

I hope you are well. Below, we provide market commentary and an in-depth portfolio update.
Format for what is covered in this Monthly Portfolio Update:
Market Thoughts
Indices Review
Key Indicators
SixSigmaCapital Performance: YTD and since Inception
Featured Quote
Current Portfolio Holdings:
Sizing | Cost Basis | Timeframe | Planned Moves
Closing Thoughts
If it is your first time here, ensure to check out what SixSigmaCapital readers are saying below:

For all readers a reminder that a premium subscription includes:
Live Portfolio updates (All Buys and Sells) in Subscriber only Channels
Favourite set-up Ideas, Market Memos plus Full archive
Monthly in depth portfolio & performance updates
Annual Tier: Discord access for live trading account updates and AMAs.
Upgrade to a premium subscription via the link below:
Market thoughts:
Equity markets had a strong month in August, with the Dow, S&P 500, and Nasdaq Composite posting month-over-month returns of +1.3%, +2.6%, and +3.9%, respectively.
For the last several months, I have been writing in this letter:
“There tends to be a large drawdown in the S&P 500 within the 12 months preceding election day. I do not know whether it will be Fed-related, a policy shock by the White House, or an economic downturn that triggers the drawdown (or something else entirely), but I think it is very likely we will see one given the way markets are behaving”
YTD Market Recap:
Despite climbing a wall of worry for most of the past year, the broader indices finally fractured in March. The S&P 500 pulled back more than 9% peak-to-trough, and the Nasdaq fell 13%. However, since April, there was a historic rebound. From the March 30 lows through the end of May, the S&P 500 gained more than 1,300 points (over 15%), while the Nasdaq Composite surged 6,300 points from its bottom (an advance of more than 30%). The run in semiconductors and every layer of the tech supply chain was unlike anything I have ever witnessed, with the SOXX ETF peaking in mid-June at >110% above its March lows, leaving the sector at its most overbought level on record.
June and July were defined by significant market rotation. After suffering one of their worst months on record in June, the Mag 7 rebounded strongly in July. Simultaneously, the severely overbought AI infrastructure and semiconductor trades cooled off, while hyperscalers, energy, financials, and most other sectors demonstrated broad-based strength.
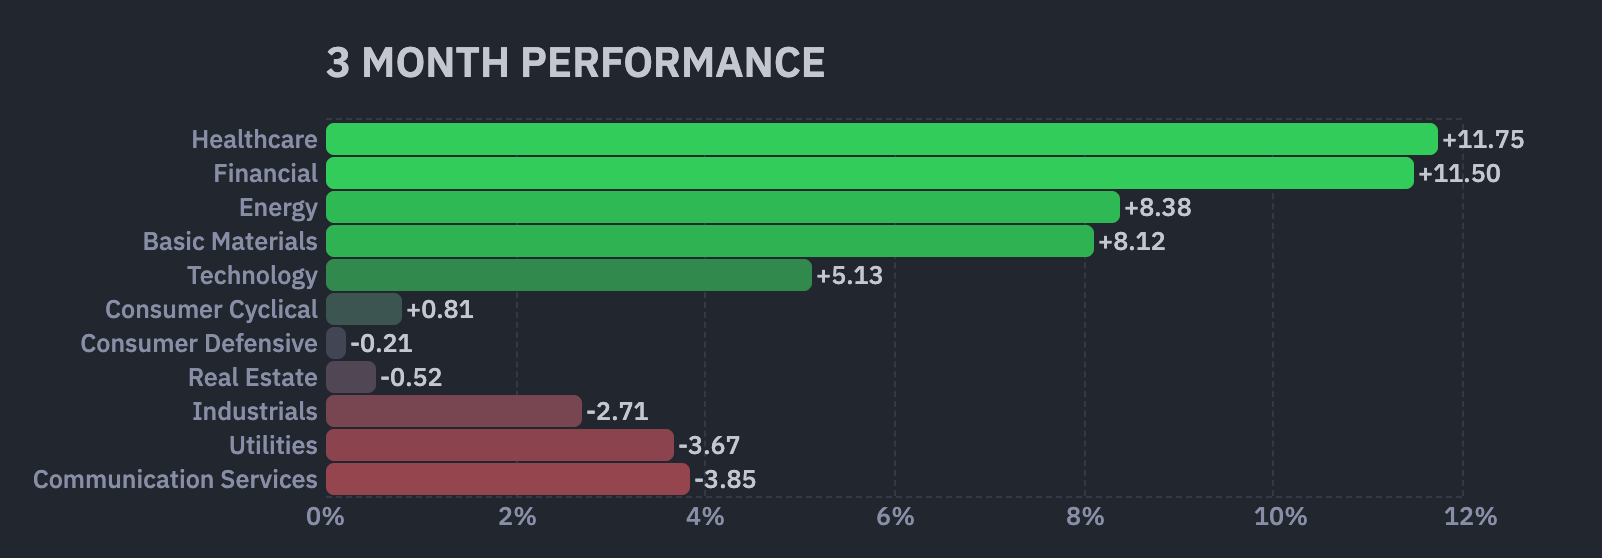
We capitalised on the hyperscaler rally to slightly reduce overall exposure. For GOOGL and AMZN, higher-cost lots were cleared out to let the house shares ride. The META position was trimmed in the $630 to $690 range, bringing the weighting down from 10% to a more comfortable ~7.5%. With MSFT, a position heavily averaged up into during the sell-off, profits were taken in the high $400s to low $500s. Concurrently, the recent Leopold AI dip provided a solid entry point to scoop up several beaten-down AI stocks. We give thanks for the cheap shares, many of which were flipped for quick gains.
August:
August was a fairly robust month for equity markets and the SSC portfolio. Highlights included Twist Biosciences (TWST) becoming a 6-bagger since initiating live on this page, the software rebound benefiting our MSFT and NOW holdings, the early-month AI infrastructure rebound (which we sold into), and the strong month-end rally across crypto.
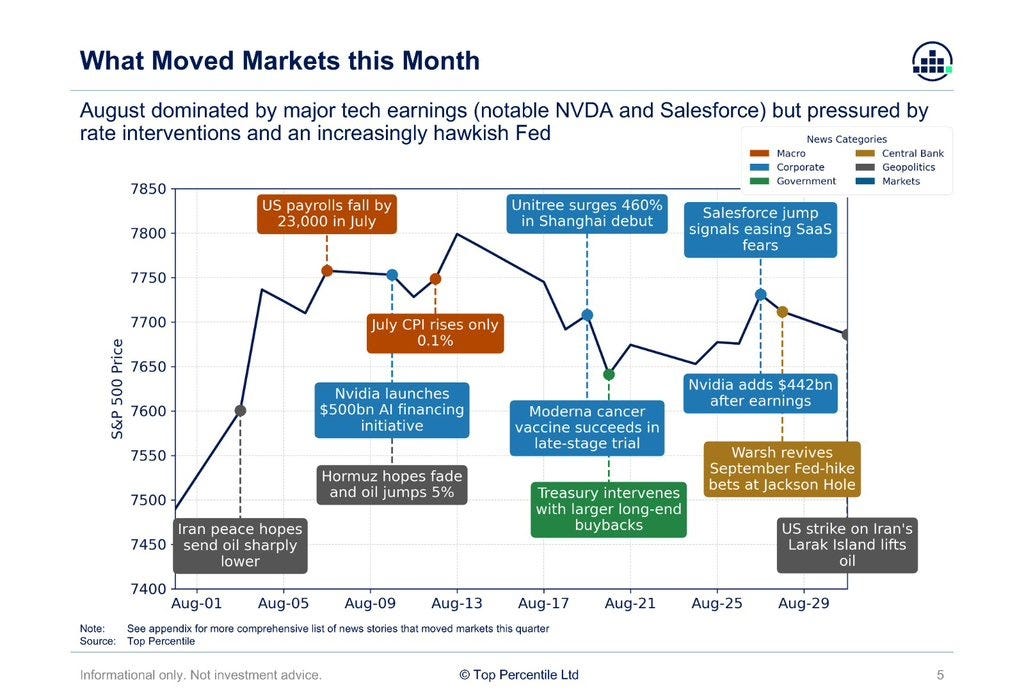
One major event of note occurred during the week commencing August 24, when U.S. Treasury Secretary Scott Bessent doubled the purchase capacity for long-dated government bond buybacks. This was seen by some as a ‘mini QE,’ and since then, we have seen some interesting market reactions: the USD weakened, while metals, crypto, and critical minerals have, on the whole, caught a strong bid. BTC is up around 25% in the last month, and Ethereum is up around 30%.
The image below succinctly shows what else moved equity markets in August:
Looking ahead, I believe the recent U.S. economic data presents a complex backdrop for the Federal Reserve’s upcoming policy meeting and interest rate decisions.
Divergent PMI Data: Manufacturing cooled to 54.6% (missing expectations alongside a noticeable slowdown in new orders), while the services sector accelerated to a robust 55.4%. Though both sectors remain in expansion territory, the service industry continues to face contracting employment metrics.
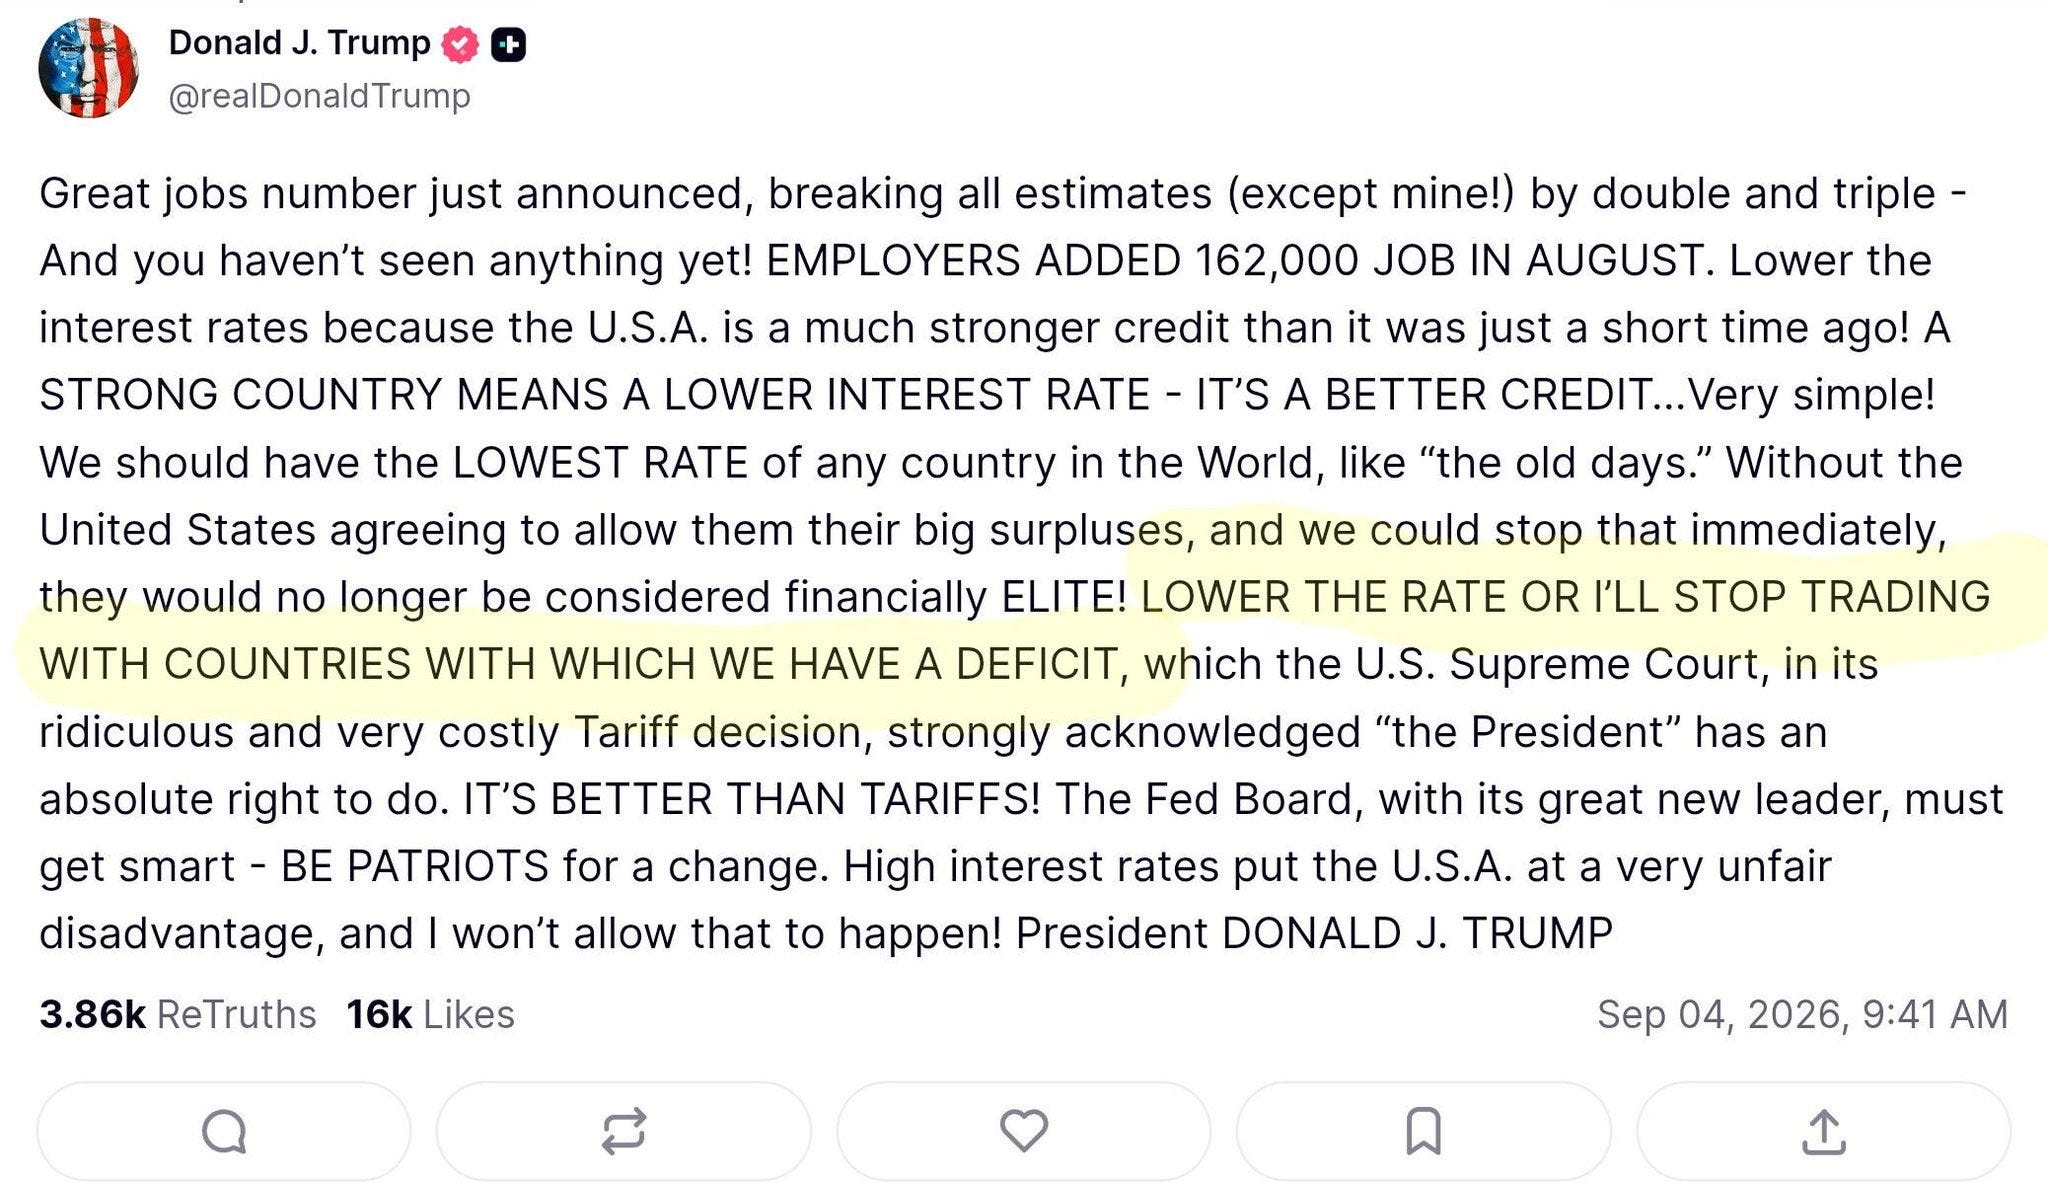
Resilient Labor Market: Friday’s August Jobs Report shattered expectations, adding 162,000 jobs compared to the forecasted 55,000. Unemployment held in-line with estimates at 4.1%, and July’s figures were revised upward by 43,000 jobs, pushing that month into positive territory.
Taken together, this robust labor data and expanding service sector keep the pressure on the Fed to hold interest rates steady or even consider further hikes at the next FOMC meeting. Consequently, the upcoming CPI and PPI inflation prints will be critical in shaping the committee’s final rate decision.
The Federal Reserve is navigating a difficult position. While multiple economic indicators support a rate hike, the committee faces intense political pressure from the sitting president, who recently threatened, “Lower the rate, or I’ll stop trading with countries with which we have a deficit.”
Looking at the bigger picture, given current geopolitical tensions and anticipated pre-midterm volatility, I have been holding a larger cash position than usual, currently around 11%. However, I will be continuing to scale into a few out-of-favour positions that I expect to perform well in the coming months.
While I have been mostly in cash in my trading account recently, I thought there were some positive signs this past week. More actionable setups are forming, and the outcomes from a few trades were encouraging. Moving forward, I will be looking to increase exposure there and be more active if the market complies.
Finally, while we experienced a decent correction in March, it remains to be seen whether that was the “midterm election-year pullback” or if another is due later in the year. S&P 500 earnings estimates continue to be revised upward, with most companies beating expectations and raising guidance. Although this fundamental strength argues against a deep, index-level decline, should a further meaningful pullback materialise, I will certainly be looking to buy select equities.
Inflation:
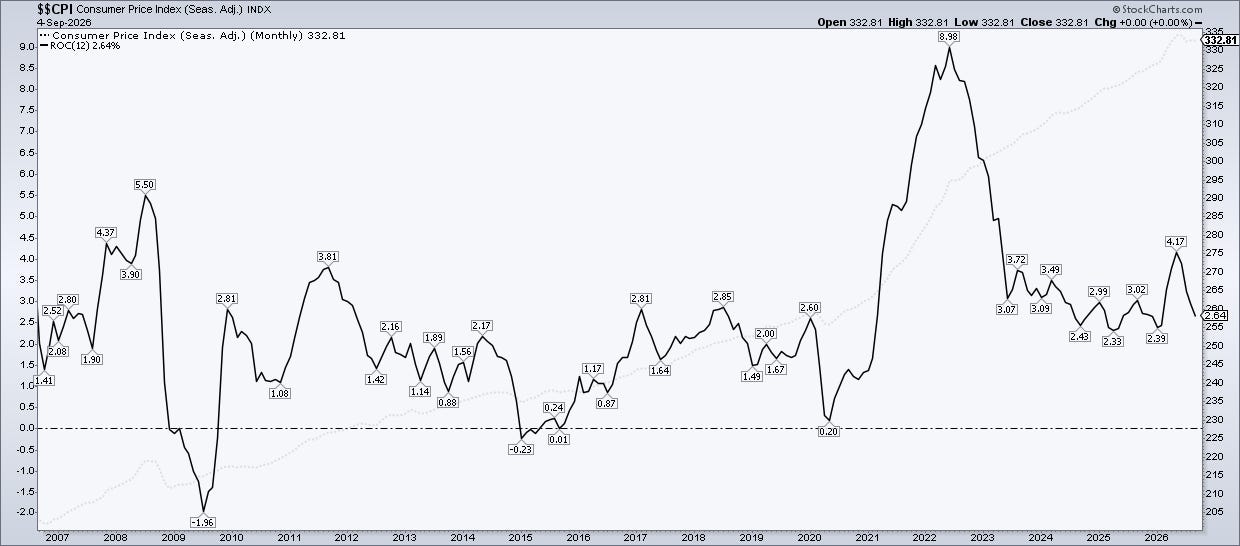
CPI: The July 2026 CPI data is presented below:
Headline CPI increased 3.4% YOY vs expectations of 3.4% YOY.
Headline CPI increased 0.1% MOM vs expectations of a 0.1% increase MOM
Core CPI increased 2.5% YOY vs expectations of 2.5% YOY.
Core CPI increased 0.2% MOM vs expectations of a 0.2% MOM
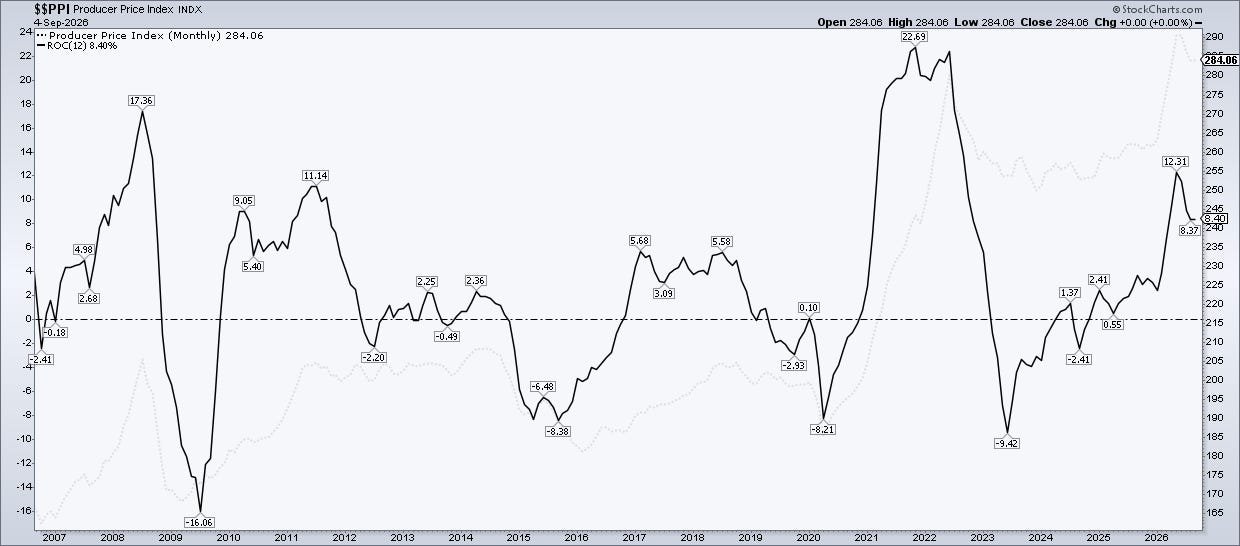
PPI: The July 2026 PPI (final demand) data is presented below:
Headline PPI increased 4.7% Y/Y vs expectations of 4.9% Y/Y
Headline PPI was unchanged (0.0%) M/M vs expectations of 0.2% M/M•
Core PPI increased 4.2% Y/Y (in line with expectations)
Core PPI increased 0.2% MOM vs expectations of 0.3% M/M
Below I have included charts showing the trend for both CPI and PPI:
PCE: With regards to the PCE price (Fed’s preferred metric), July ‘26 data came in slightly warmer than expected on the headline and in line on core.
Headline PCE increased 3.7% YOY vs expectations of 3.6% YOY.
Headline PCE increased 0.2% MOM vs expectations of 0.1% MOM.
Core PCE increased 3.3% YOY vs expectations of 3.3% YOY.
Core PCE increased 0.2% MOM vs expectations of 0.2% MOM.
Core PCE has continue to prove notably sticky throughout the last year. The upcoming PCE reading will be important for the Fed’s decision making.
July 2026 FOMC Meeting
At the most recent FOMC meeting on July 28-29, 2026, the committee decided to hold interest rates steady as it navigates persistent inflation risks alongside continued economic expansion. The target range for the federal funds rate remains at 3.50% to 3.75%, where it has sat for five consecutive meetings.
Unlike the unanimous decisions seen previously, this vote was divided 9-3, marking notable hawkish dissent in Kevin Warsh’s second meeting as Fed Chair. Three regional Fed bank presidents (Beth M. Hammack, Neel Kashkari, and Lorie K. Logan) dissented in favour of an immediate 25-basis-point rate hike. Chair Warsh maintained a concise policy statement devoid of explicit forward guidance, reiterating in his press conference that the committee remains strictly data-dependent and advising markets to focus on pure price discovery, effectively to “play the ball, not the referee”.
The Committee reaffirmed its firm stance, stating unequivocally: “The Committee will deliver price stability”. While some recent data showed softer inflation, price pressures remain elevated relative to the 2% goal, partly compounded by Middle East conflict risks, energy price volatility, and AI-related infrastructure investment.
While no updated Summary of Economic Projections (SEP) was issued at this non-quarterly meeting, the divided vote underscored that an interest rate hike remains a live possibility. Markets continue to weigh the likelihood of further tightening, pricing in higher long-end Treasury yields, heading into the next scheduled decision on September 15-16, 2026. The 2 day September meeting will also include an updated Summary of Economic Projections.
Indices:
S&P 500
Currently trades at $7,718.60 (12.54% YTD)
It is 1.67% above the 50SMA.
Trading at 23.61x trailing earnings and 21.22x forward earnings
Nasdaq Composite:
Currently trades at $26,506.99 (14.08% YTD)
It is 1.9% above the 50SMA.
Trading at 34.29x trailing earnings and 25.25x forward earnings (per WSJ for the QQQ)
Key Indicators:
10 Year T-Note: 4.784. It has increased by 14.26% YTD
British Pound vs USD: 1.351 and is up 0.45% YTD.
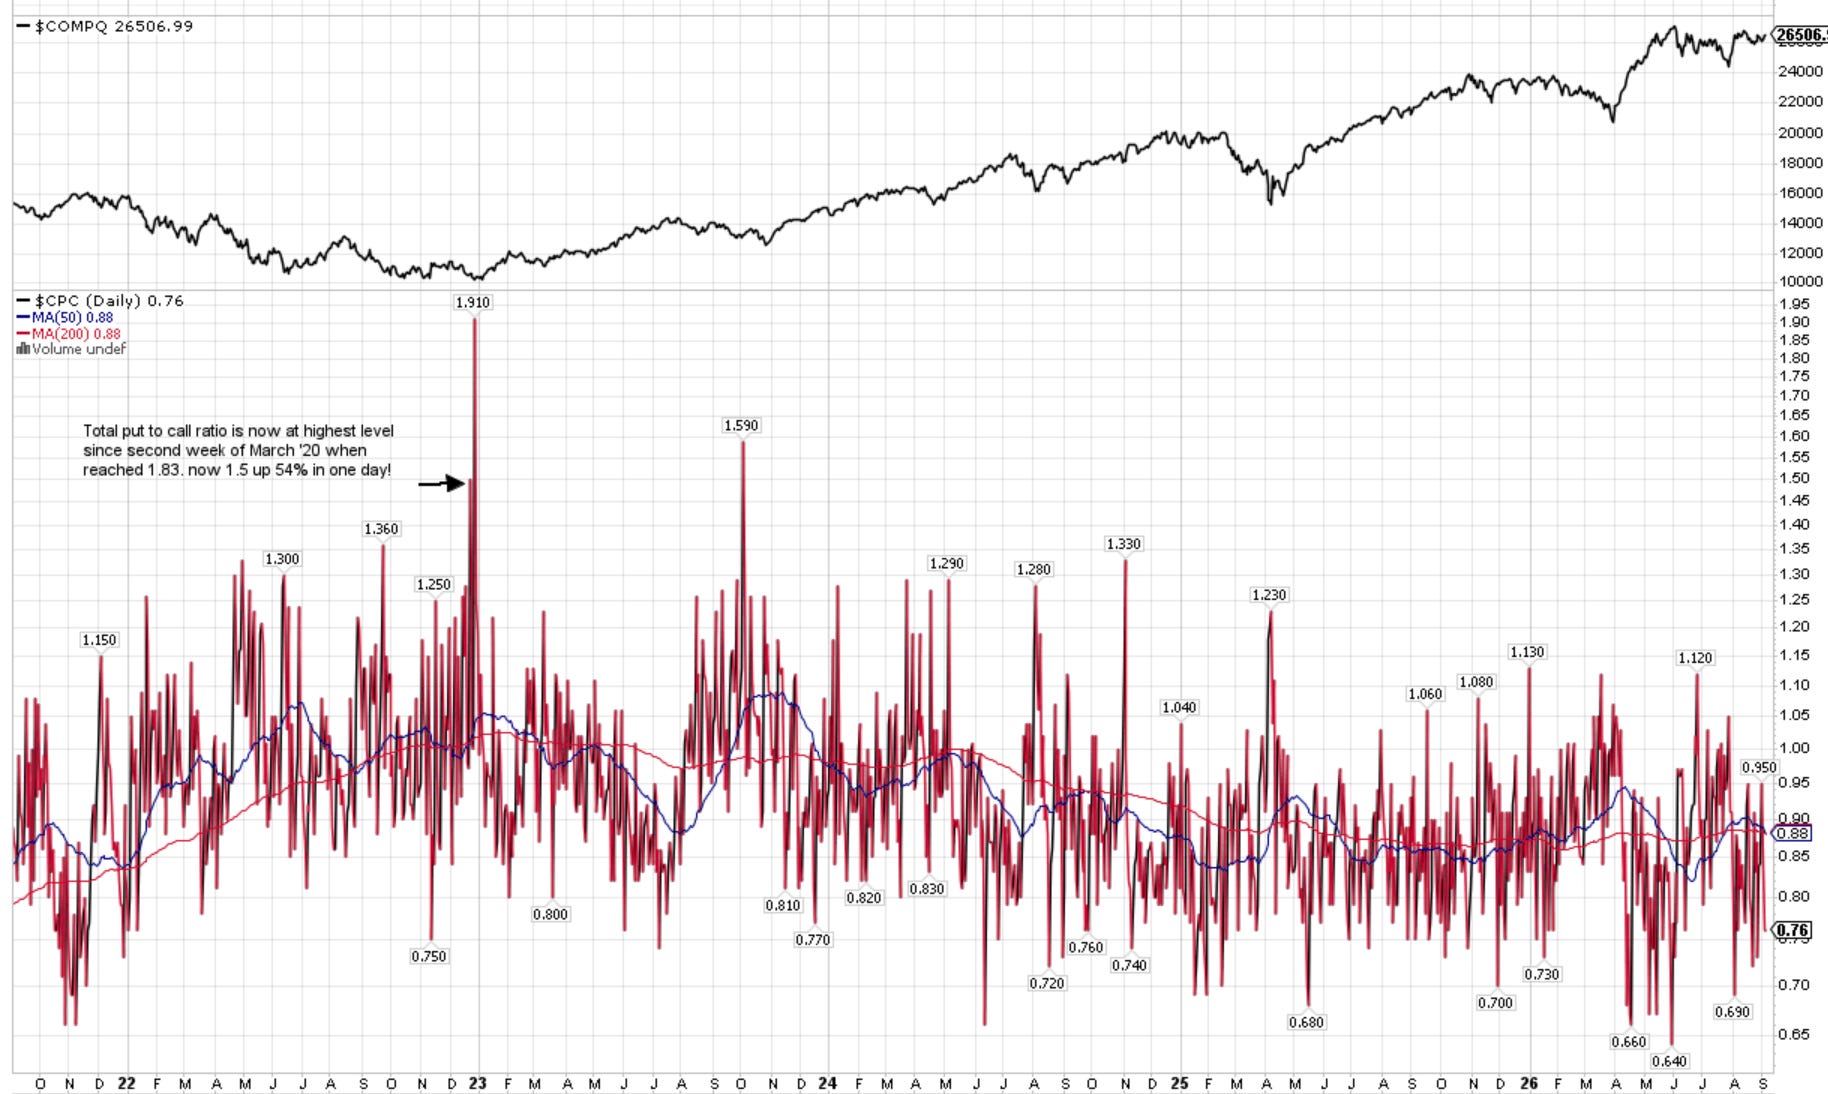
CPC (Put to Call Ratio): 0.76. Note >1 can indicate Fear and >1.5 can be Extreme.
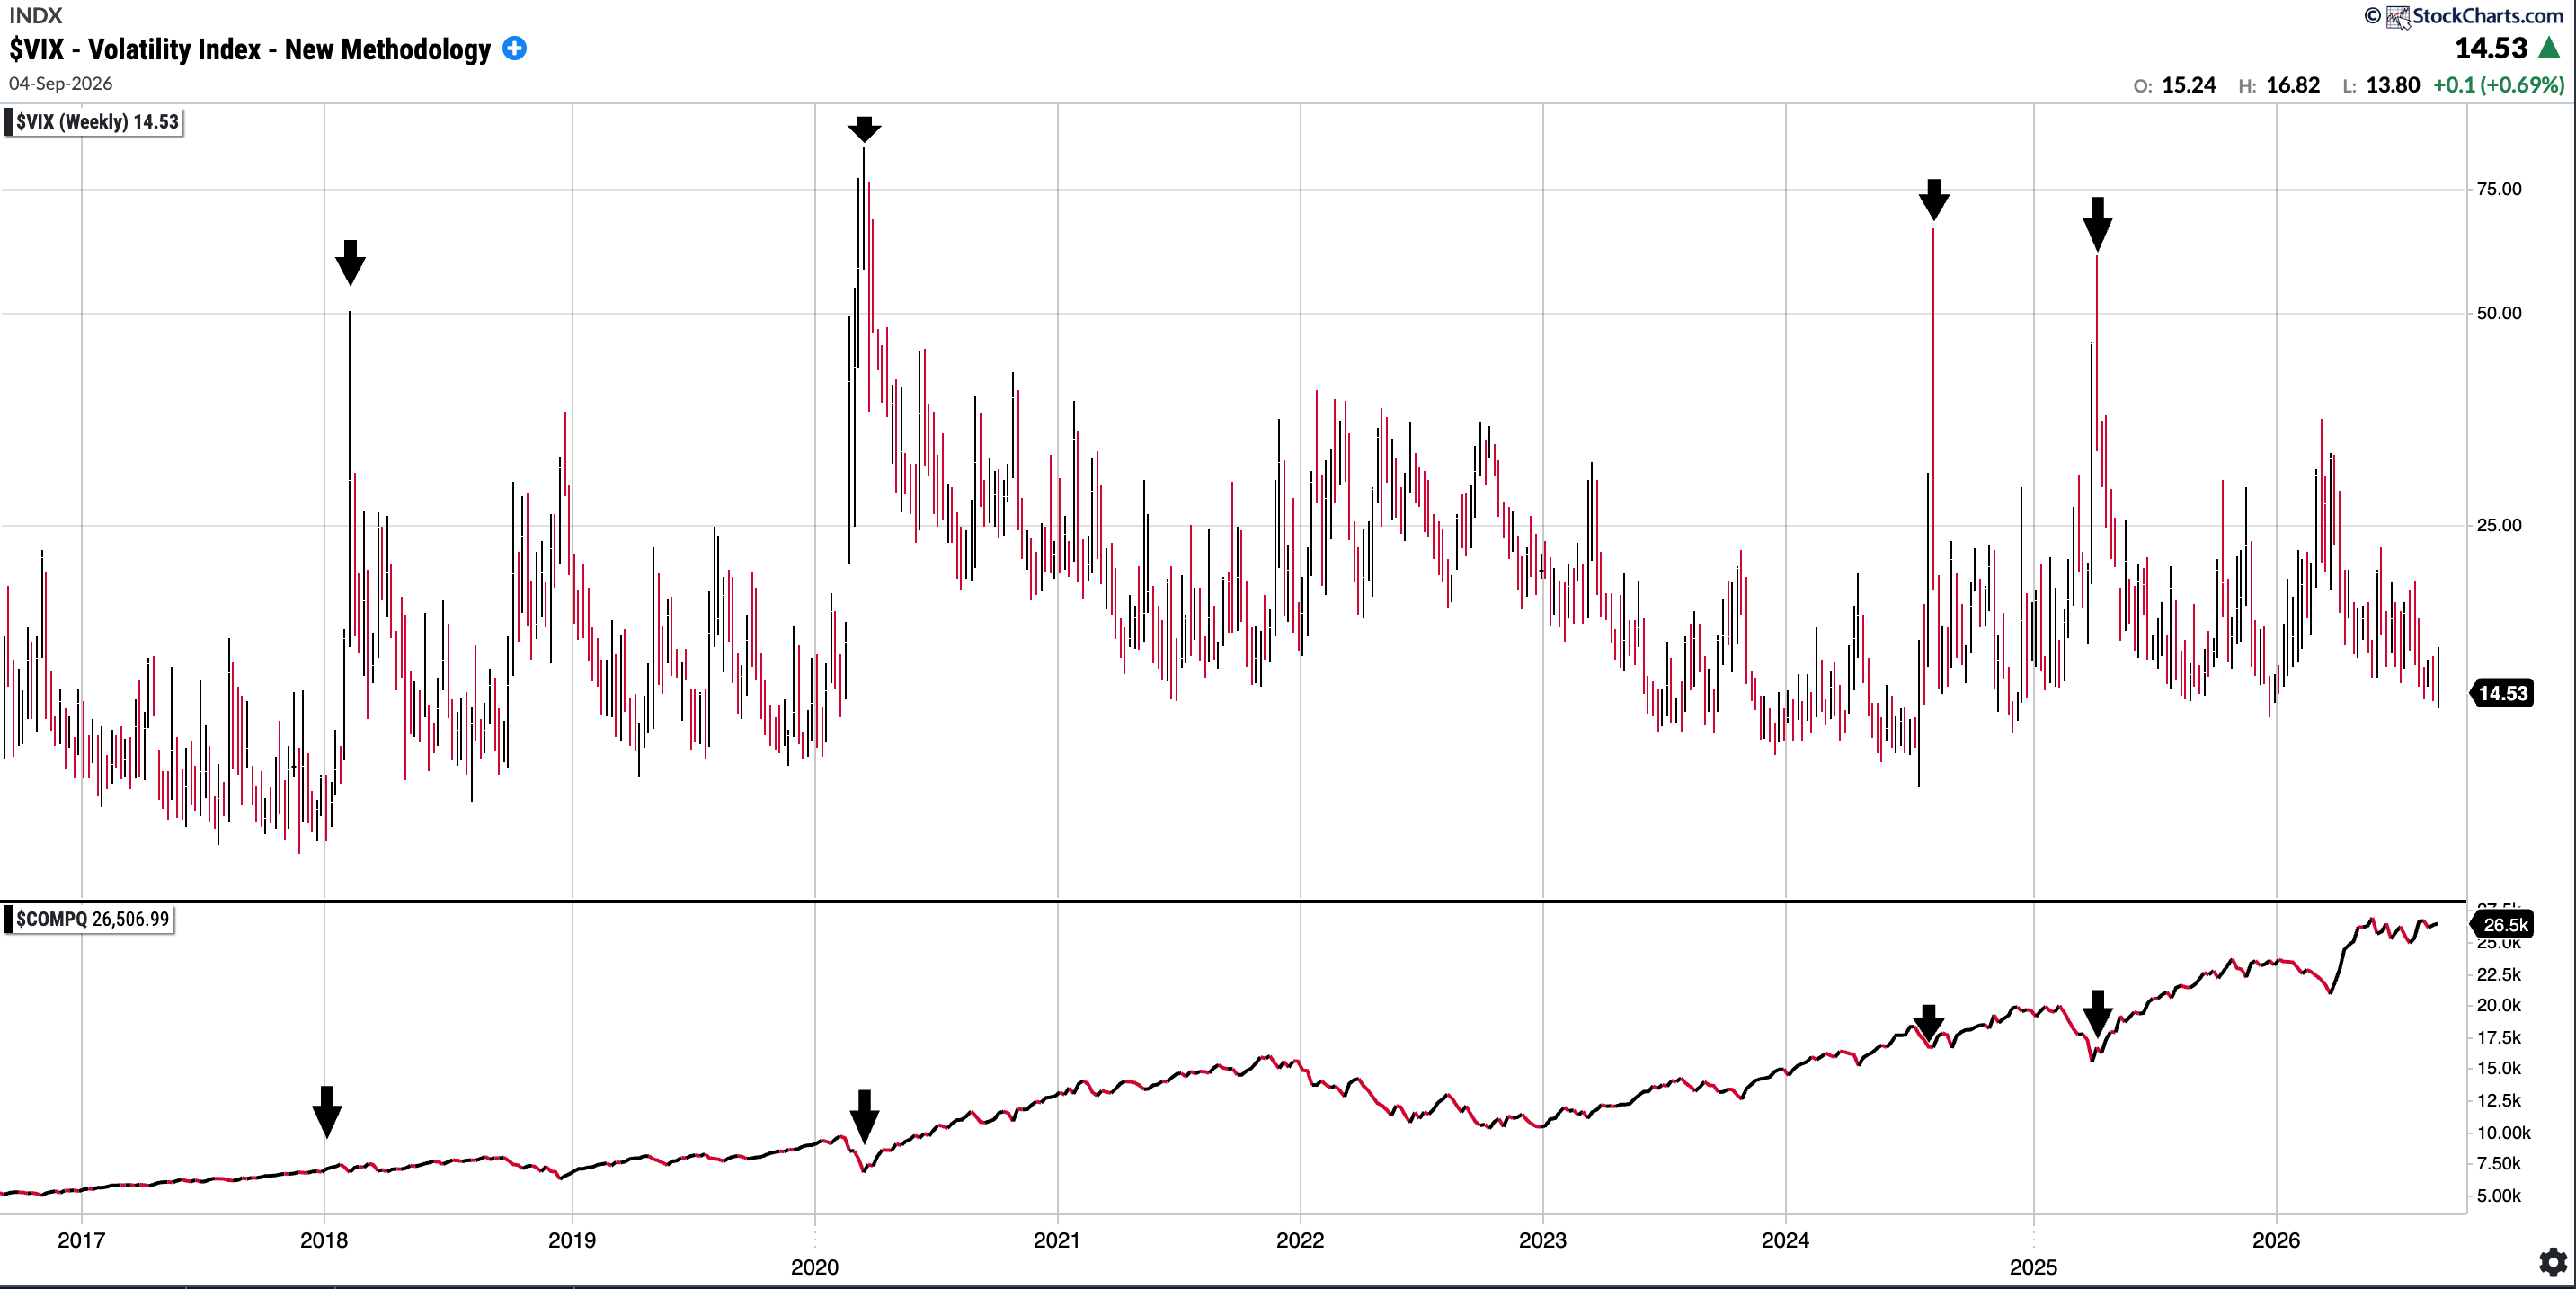
VIX: 14.53. I have included a chart below showing the VIX over time and Nasdaq Comp underneath it: you can see that extreme readings have always been a buying opportunity in the medium term.
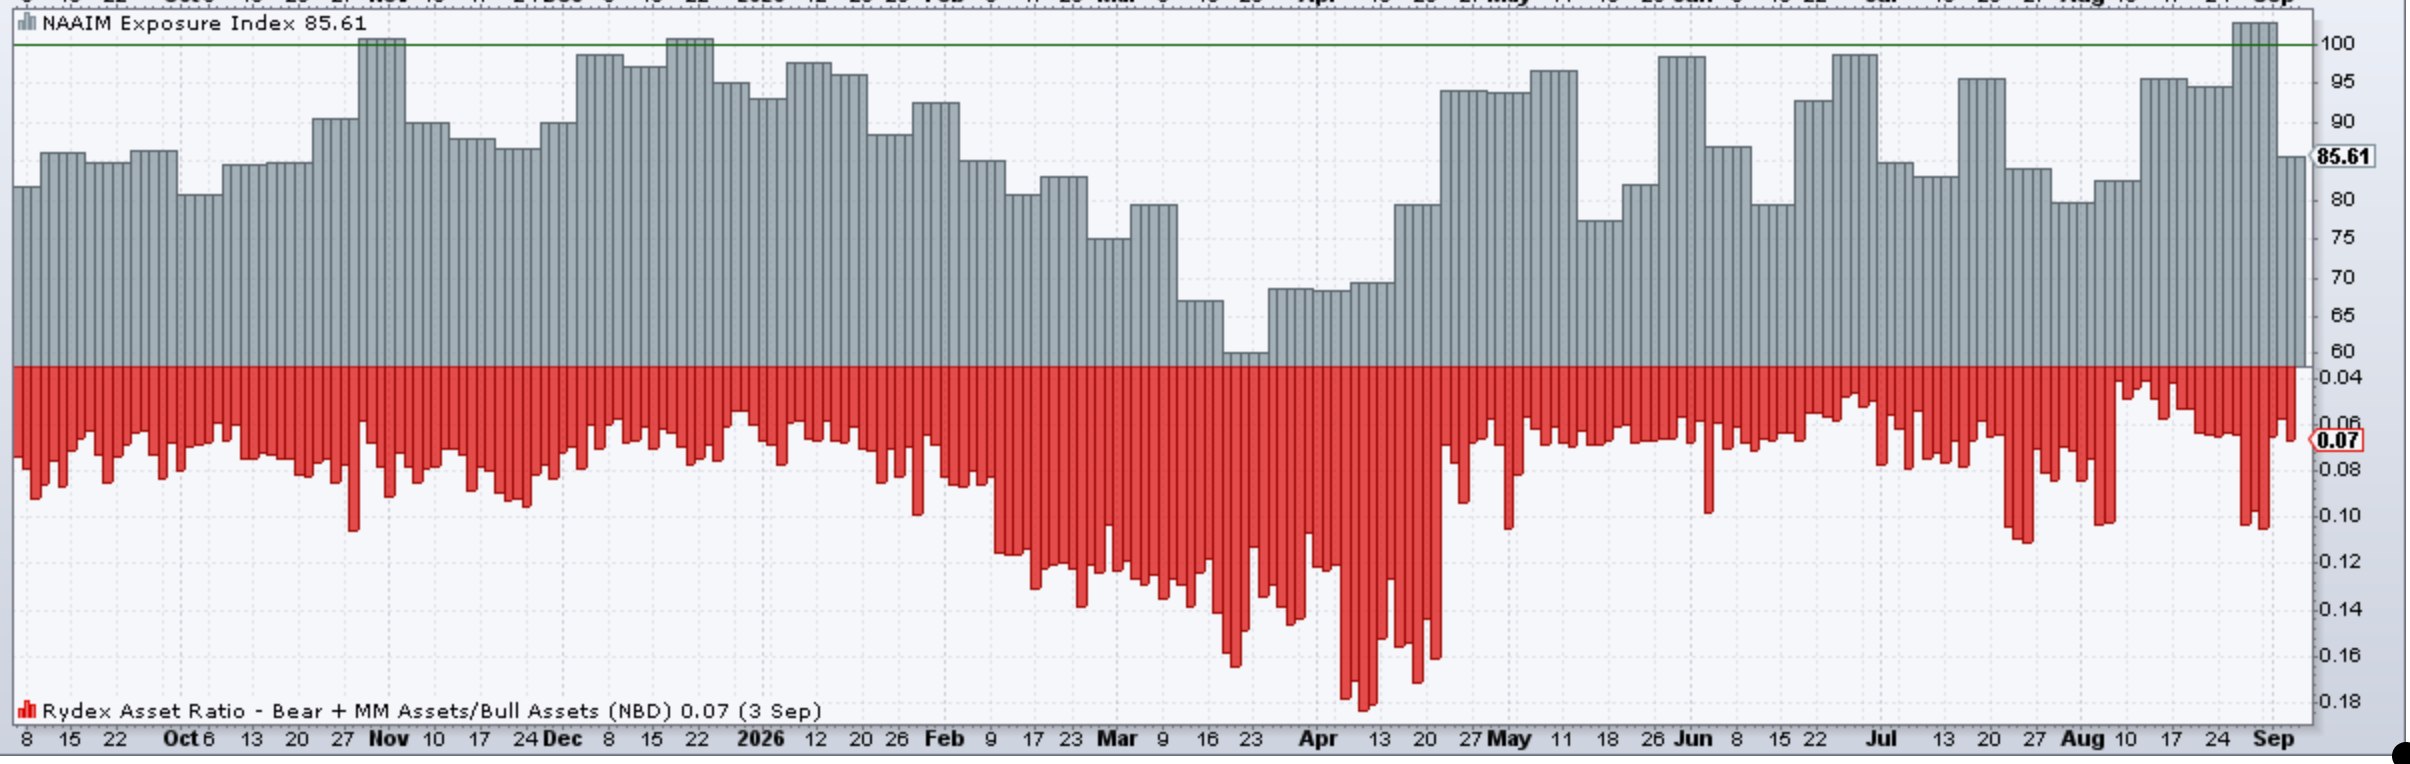
NAAIM Exposure Index: 85.61 from 84.02 last month. Note it did get into the low 30’s in April 2025 (!)
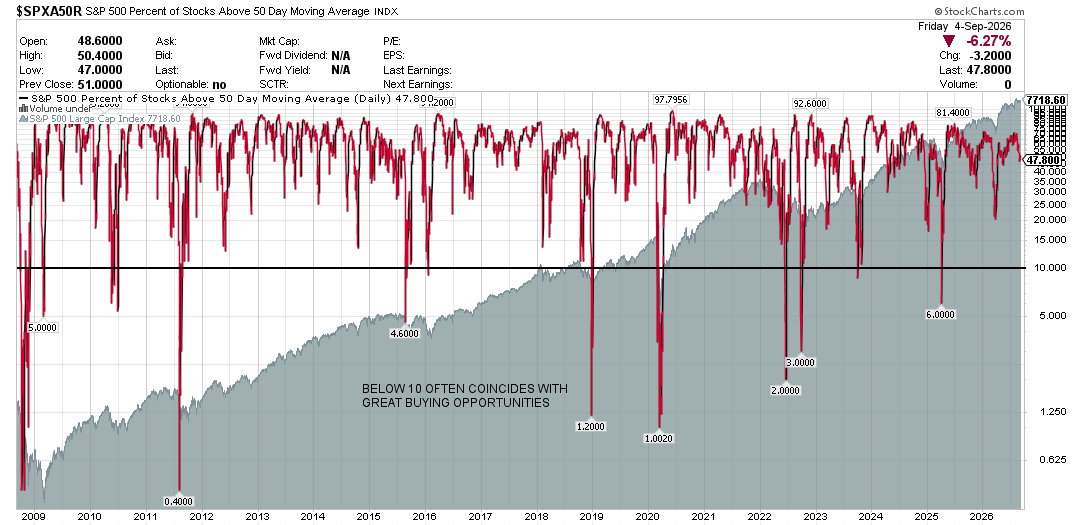
S&P 500 Percentage of Stocks Above the 50 Day Moving Average: 47.8% (<10 tend to be great buying opportunities)
Fear and Greed Index (CNN): currently reads 42 which is in the ‘Fear’ zone. At the end of March it was 19 supposedly in the ‘Extreme Fear’ zone.
Consolidated Performance across Investment Account: YTD and since Inception of SixSigmaCapital (Equities only as of Sunday 6th September)
2023: +94%
2024: +61%
2025: +57%
2026: +18.27% (with trading account gains included it would be +25.07%)
TWR since Inception of SixSigmaCapital is thus +479.98% or just under a 5.8x of the portfolio. The CAGR is 61.13%
TWR +480% vs S&P 111.5%.
TWR of S&P 500 in the same period is +111.5% or a 2.115x return.
SixSigmaCapital has achieved a +368.5% outperformance in that time period. (My overall 8 year CAGR including numbers prior to SSC sits at around low 40%)
I remain pleased overall, as risk adjusted these results are very sound. Furthermore, all moves were disclosed in real time to paid subscribers.
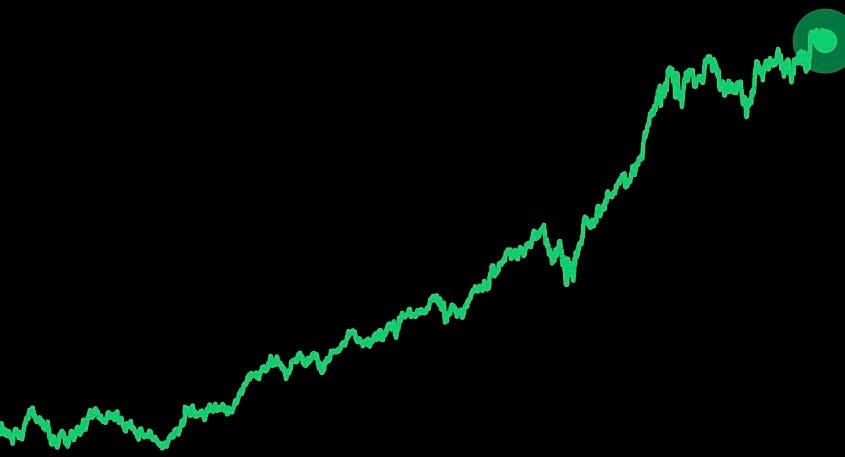
Equity curve since switching to my current brokerage in the last few years is below:
SixSigmaCapital Trading Account:
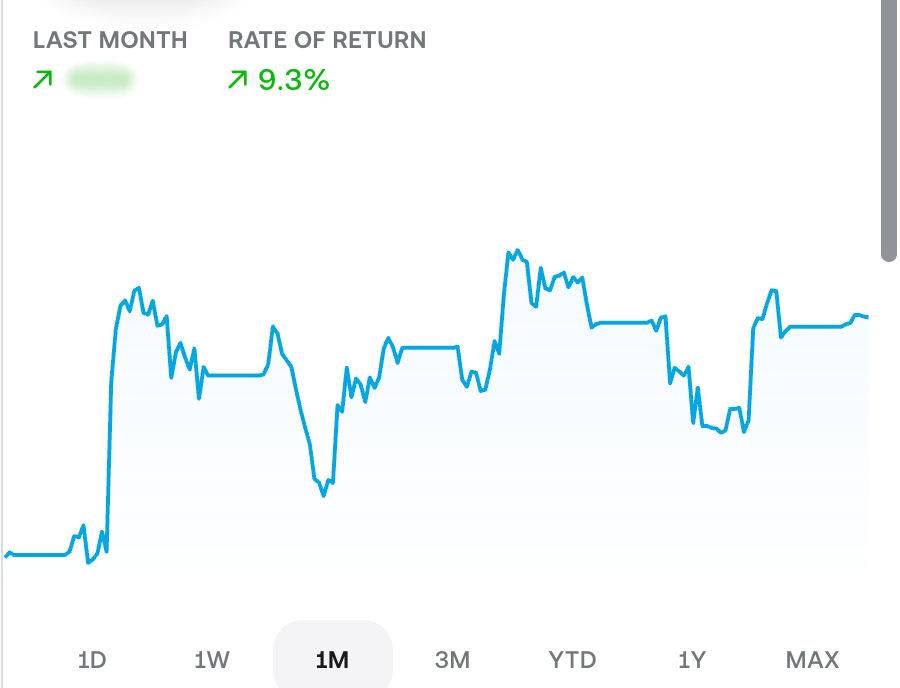
At the start of the year, I opened a dedicated trading account for active strategies. It was initially ~10% the size of my primary investment account, though has grown somewhat since then (now around 15% the size of the main book). The account is managed with a trading mindset and consists mostly of common shares, though I have utilised select options strategies.
The past month was relatively uneventful for the trading account. I took the prior month's lessons to heart, focusing on not forcing trades and sizing smaller given that conditions were not ideal for swing trading. We gained a couple of percentage points on the month, preserving valuable mental capital to capitalise on opportunities heading into year-end.
Trading Account YTD: +68% YTD
If combined to the investment account, it would add 6.8% to the total performance.
Featured Quote:
“You're looking for a mispriced gamble. That's what investing is. And you have to know enough to know whether the gamble is mispriced. That's value investing.” Charlie Munger
Current Positions in Size Order with Cost Basis (Investment Account) as of September 6, 2026:
