
Charts

Below I will go through a few charts I am looking at with commentary.
SPX
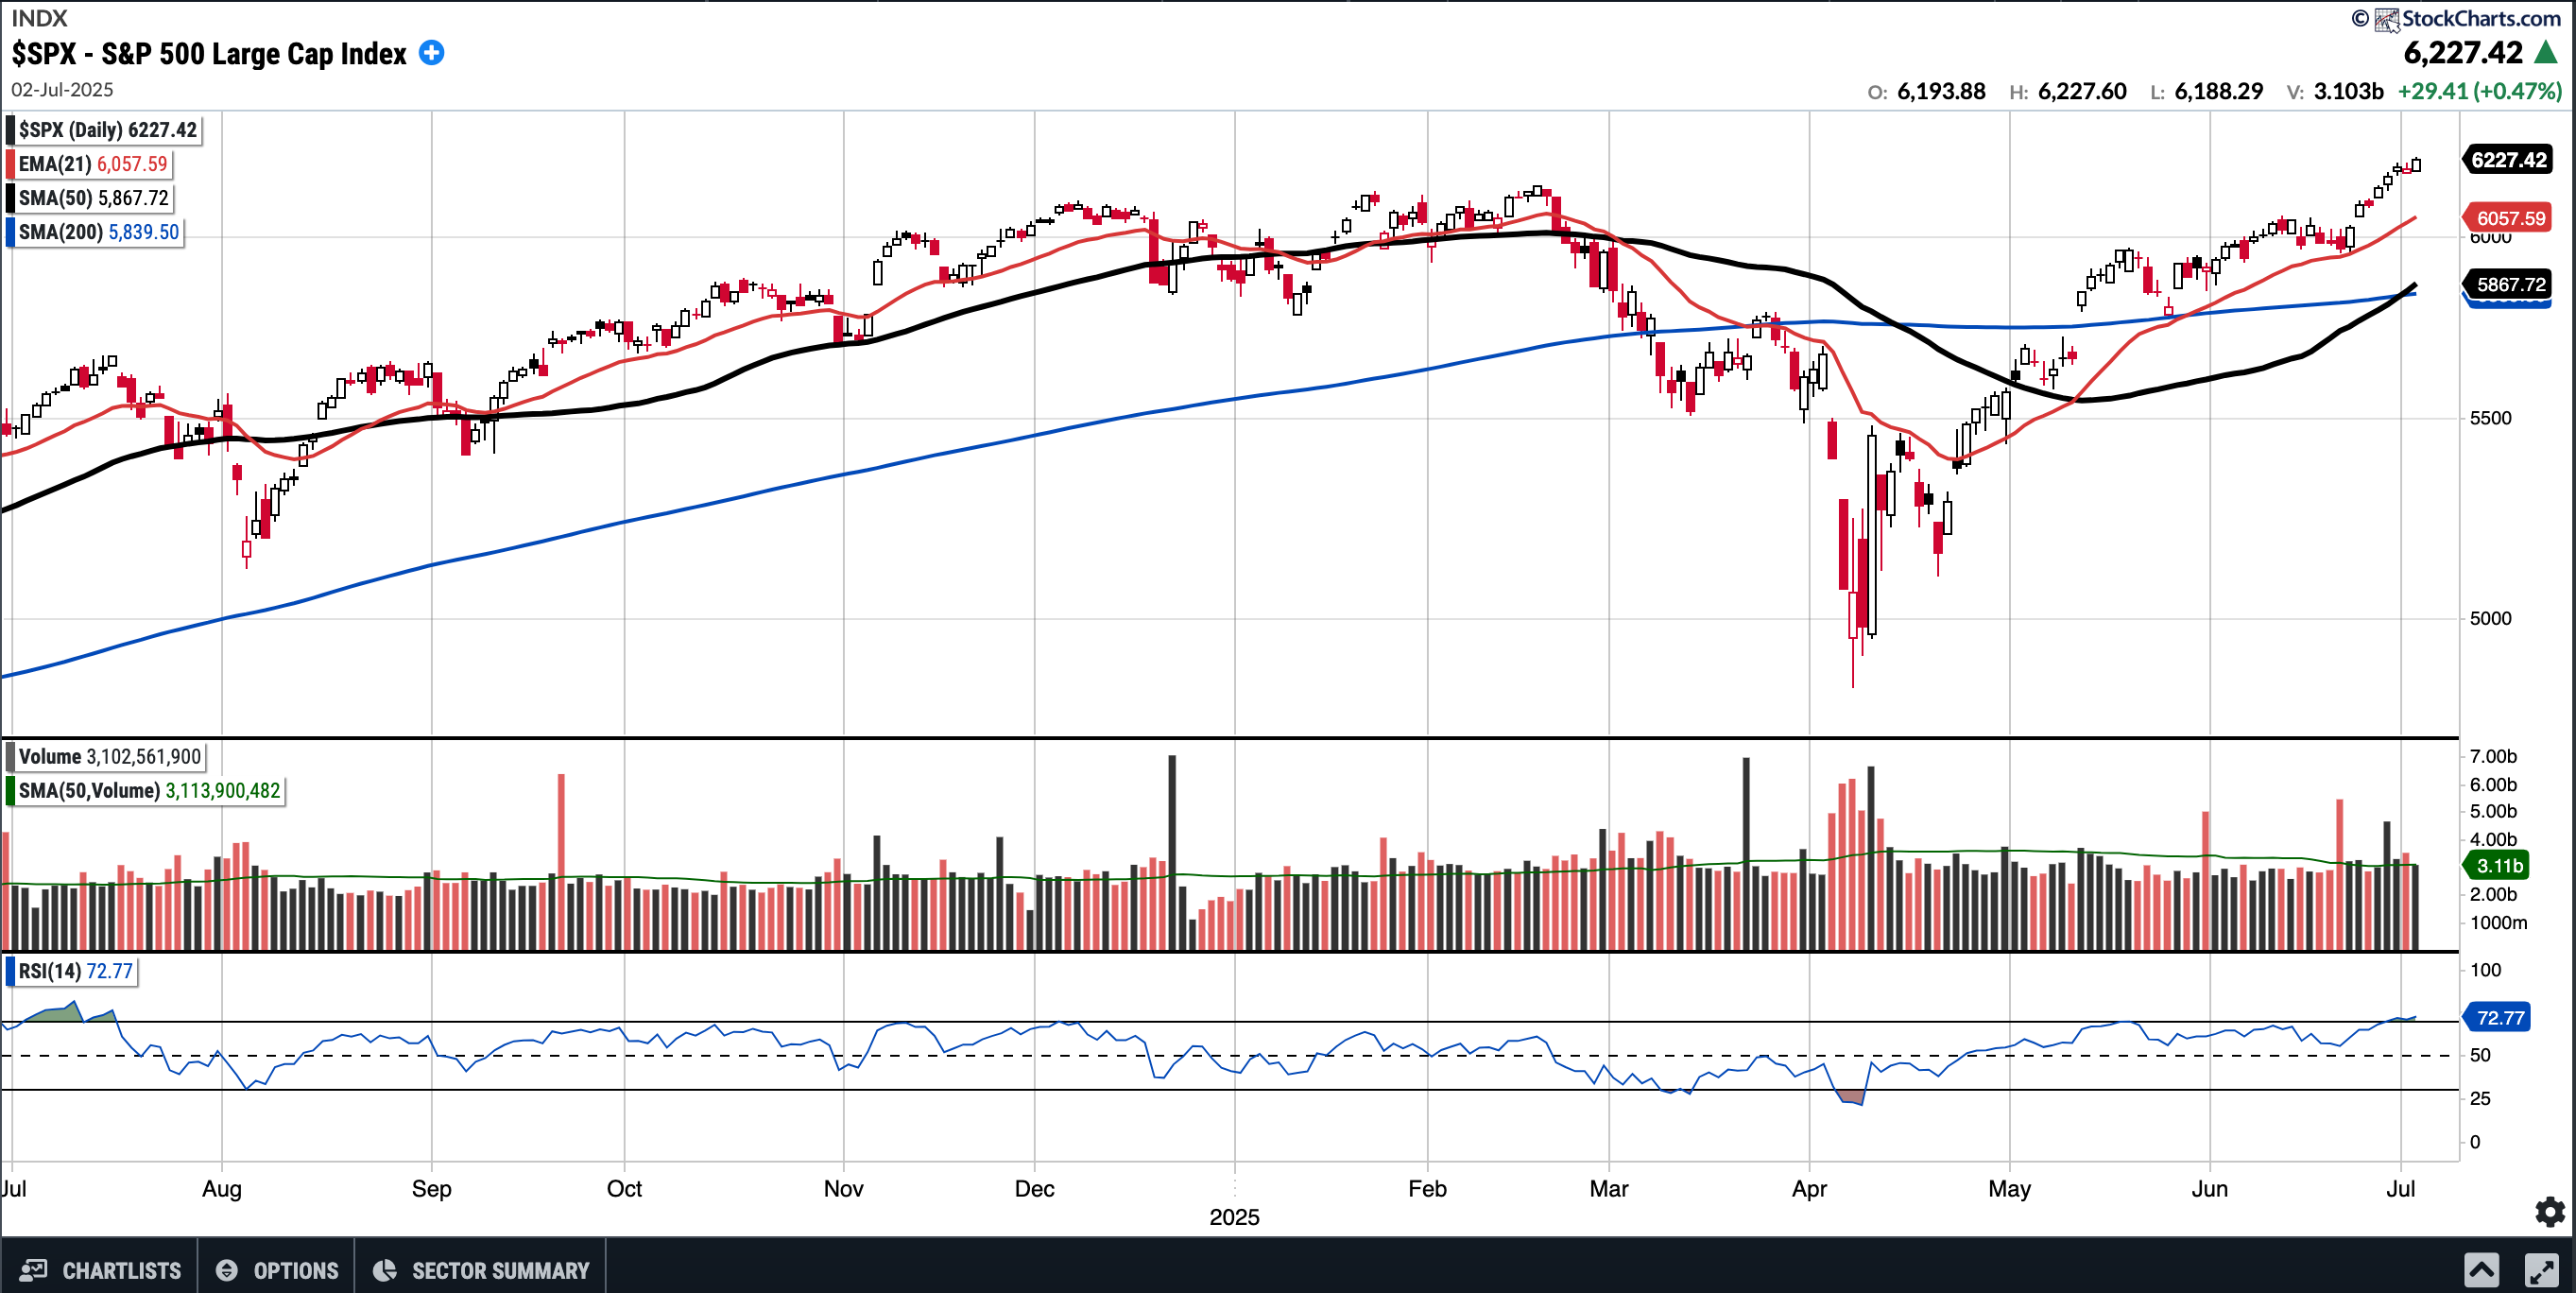
Sits currently at 6227, RSI 72.77. 6.13% above 50SMA.
At Indices level we don’t often get >7% beyond 50SMA and 6278 level would put us at 7% above 50SMA. Already tagging upper Bollinger Band. Garden variety PB to 21SMA wouldn’t be a surprise.
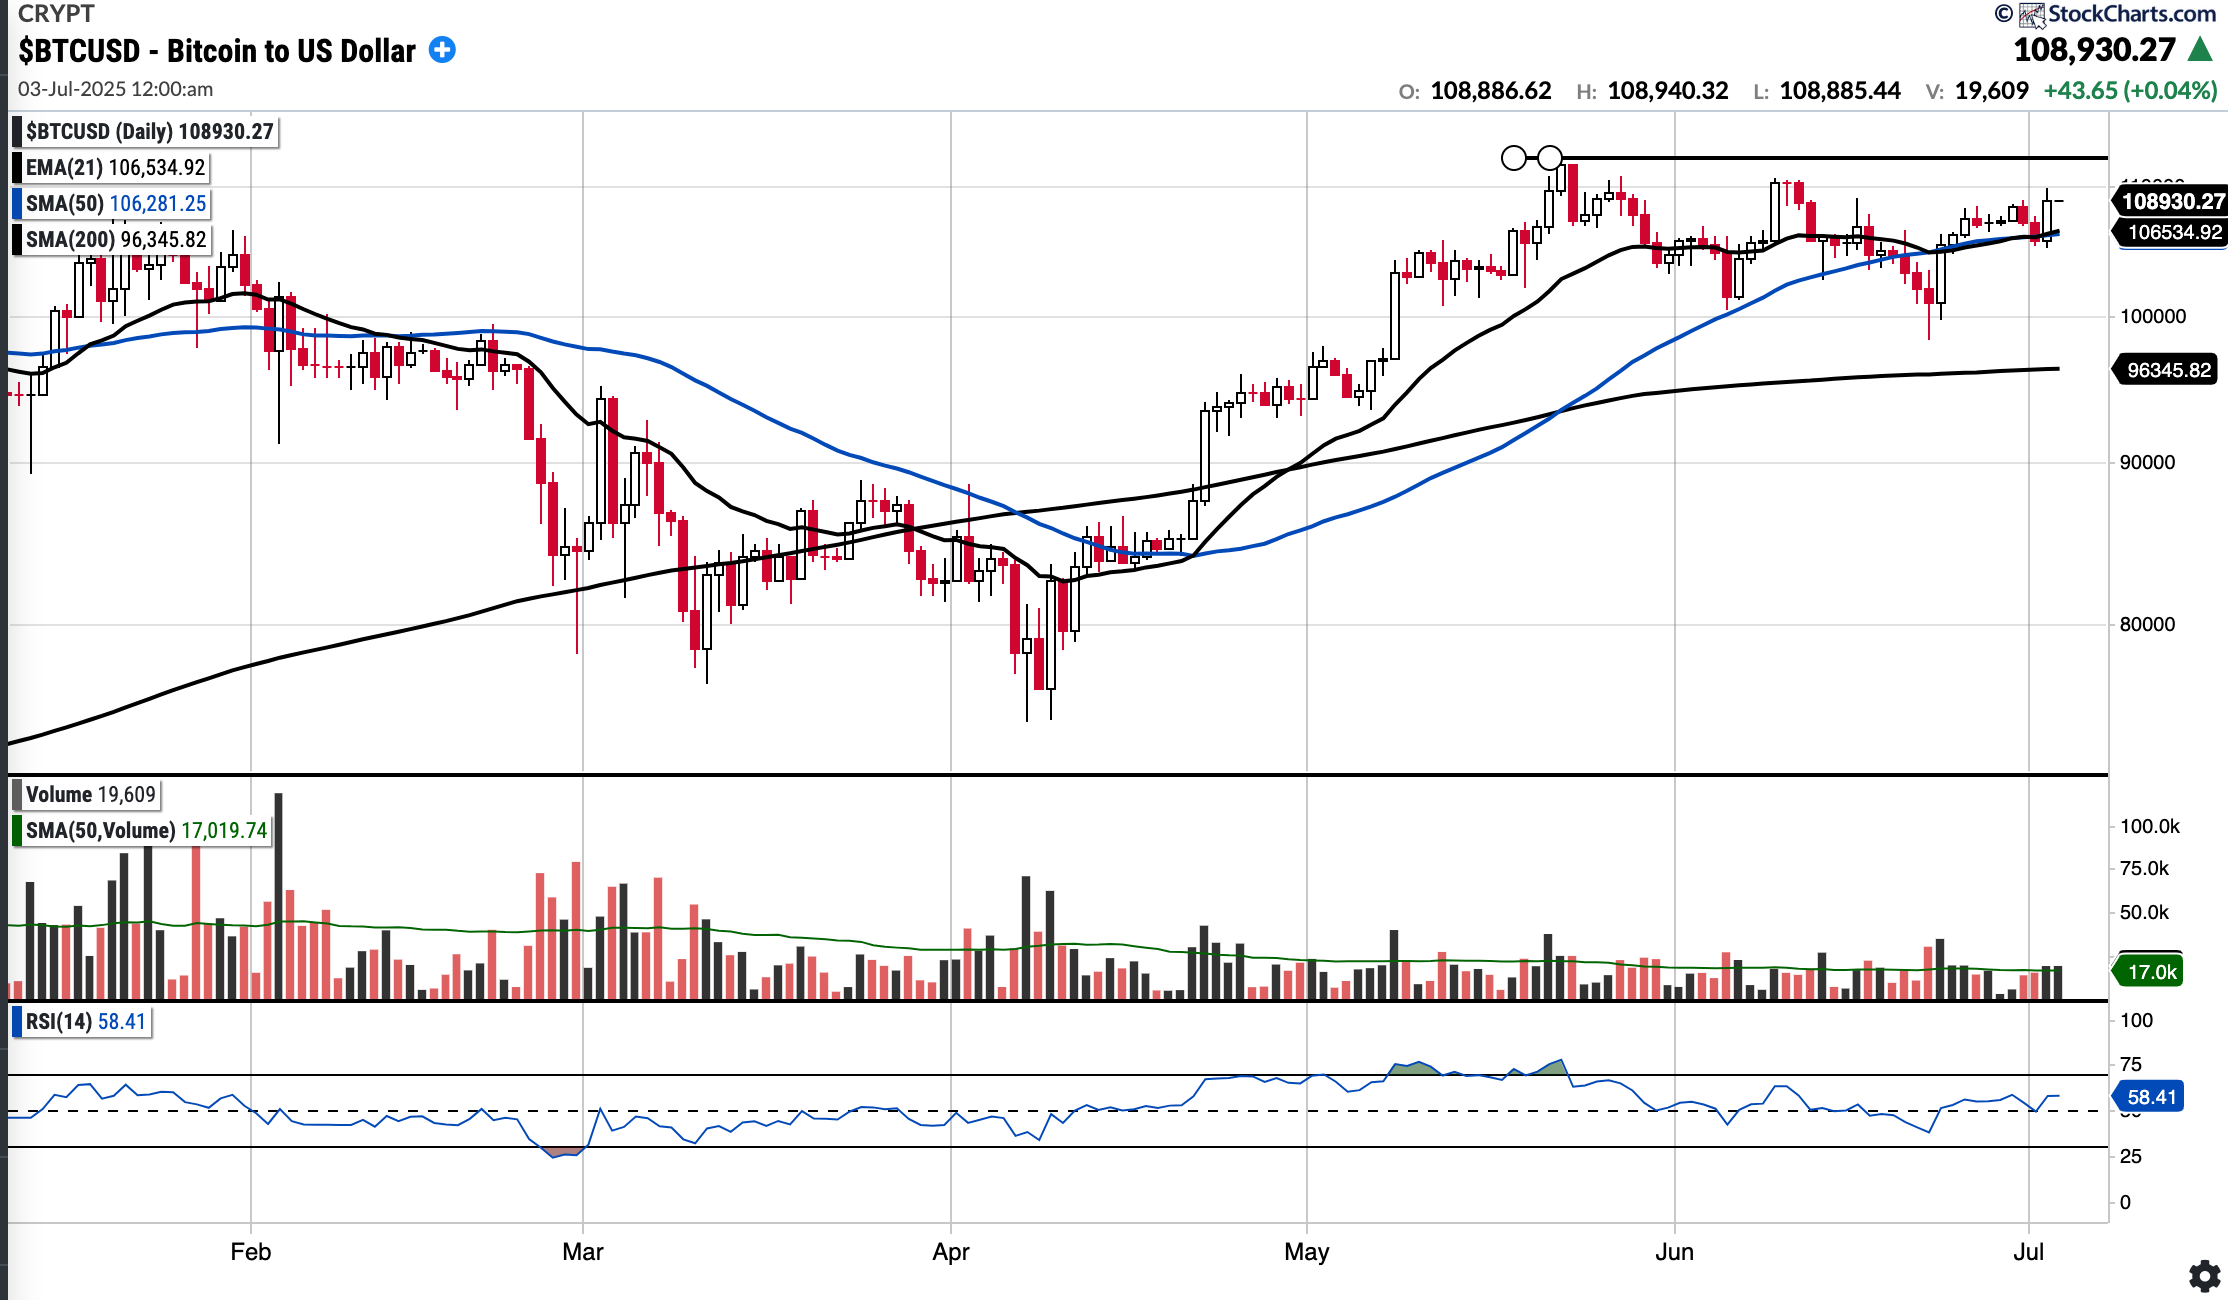
$BTCUSD
Currently $108,844. RSI 58.28. 2.53% above 50SMA
15.28% YTD.
All Key MA’s up-trending. Chart has shown steady accumulation since April, during which time it did show RS also.
A break above prev ATH of 111,980 is probable. Would be bullish for Crypto equities
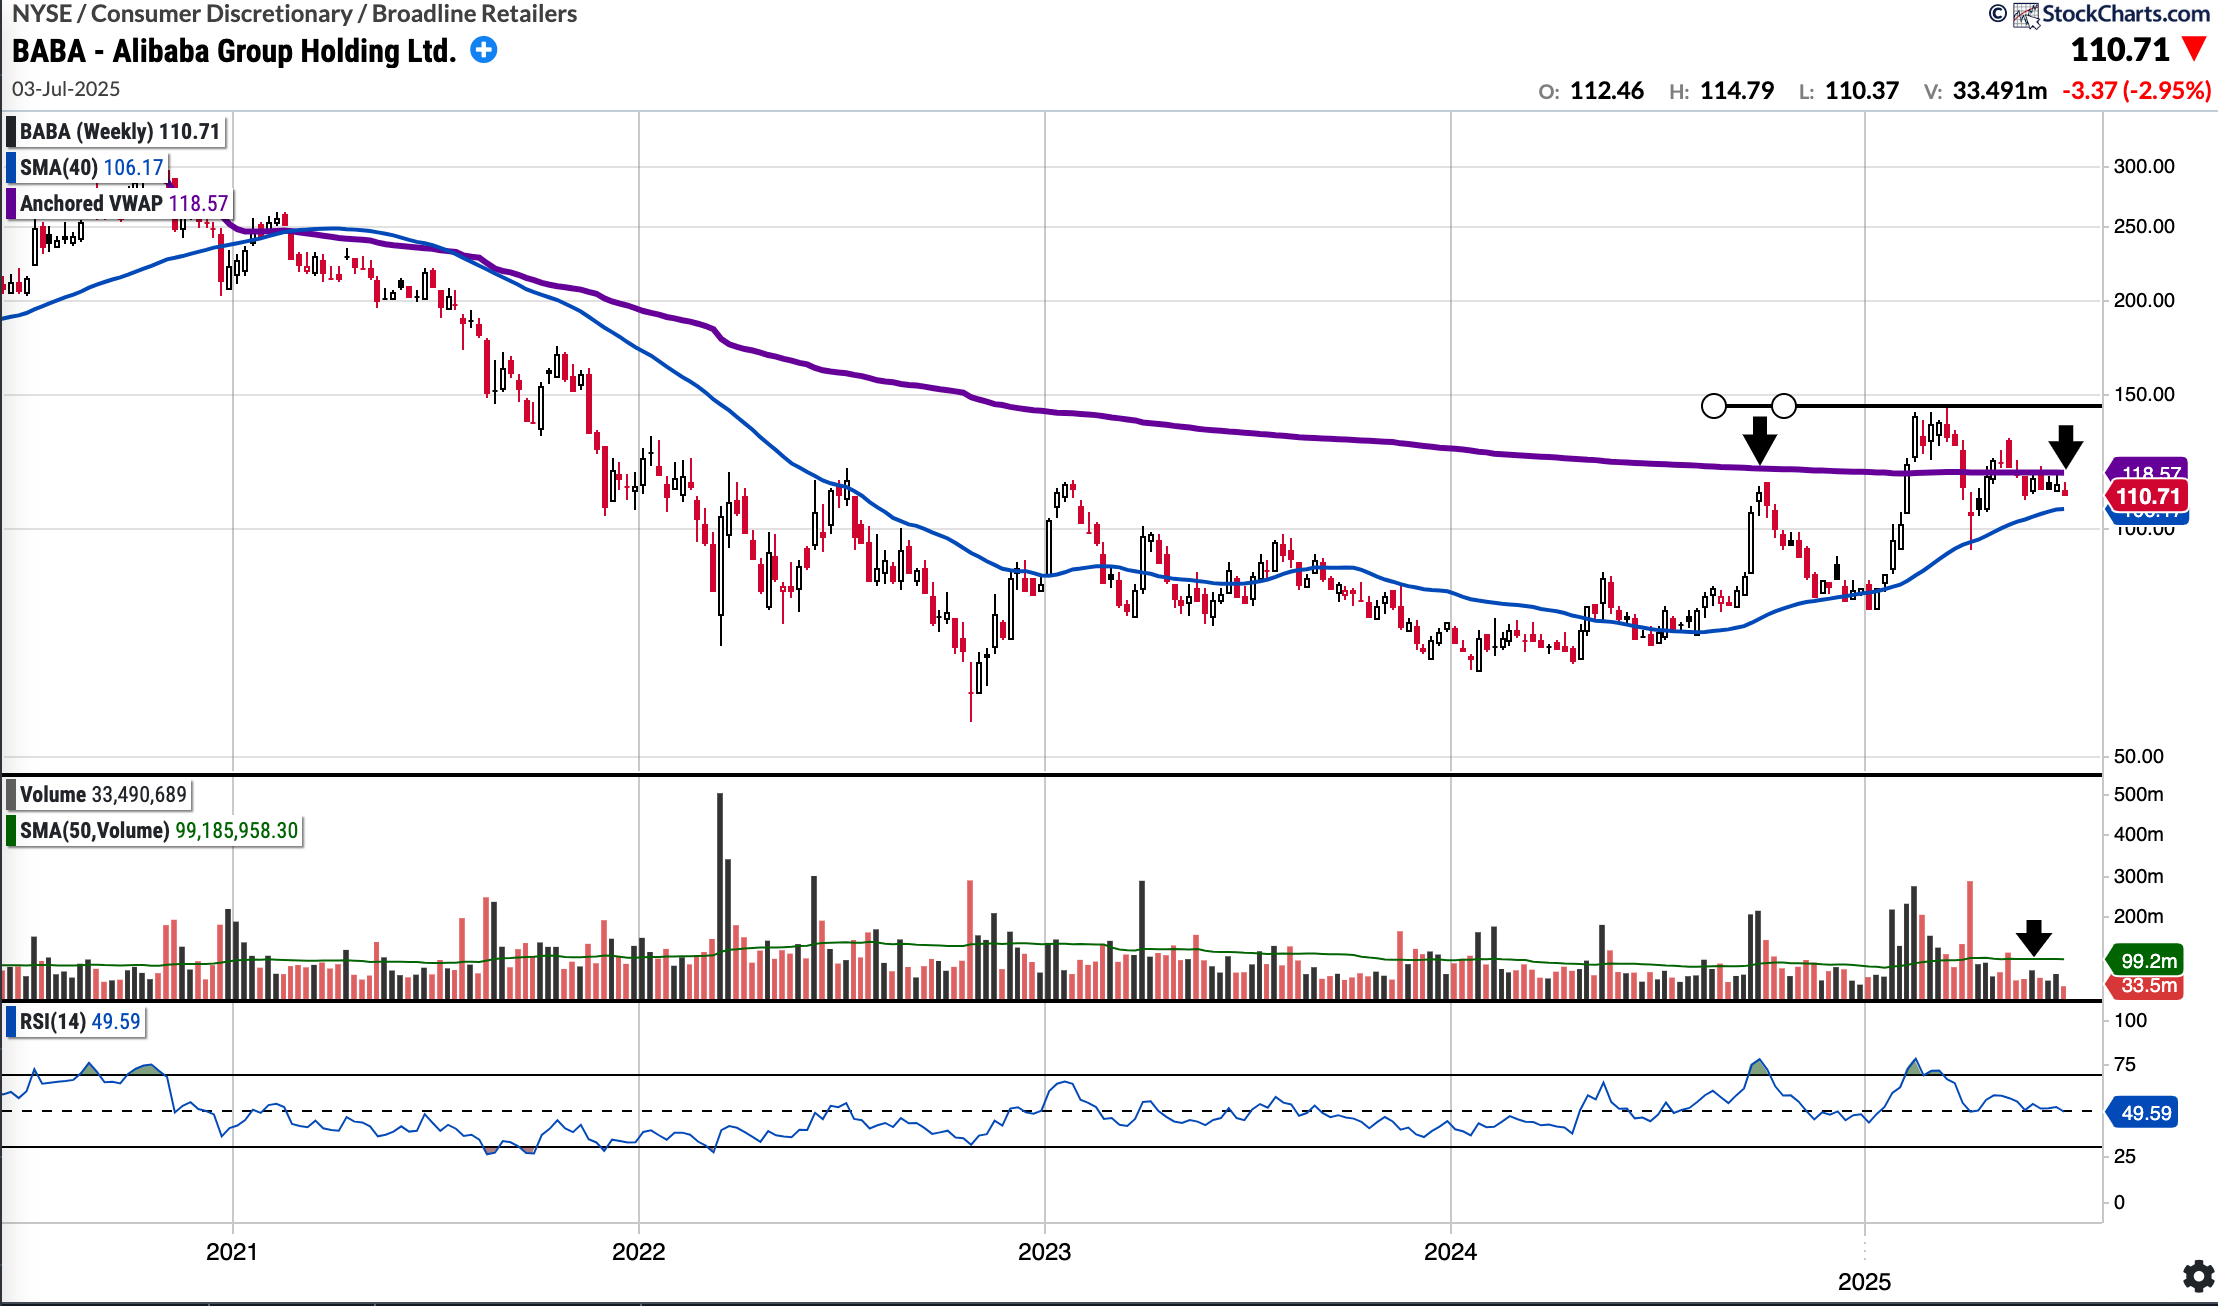
BABA
$110.71. RSI 49.59. -5.78% below 50SMA
+30.32% YTD
AVWAP from ATH sits at 118.57. Volume has dried up of late, would like to see it re-claim the AVWAP and then think makes a move to mid 140’s again.
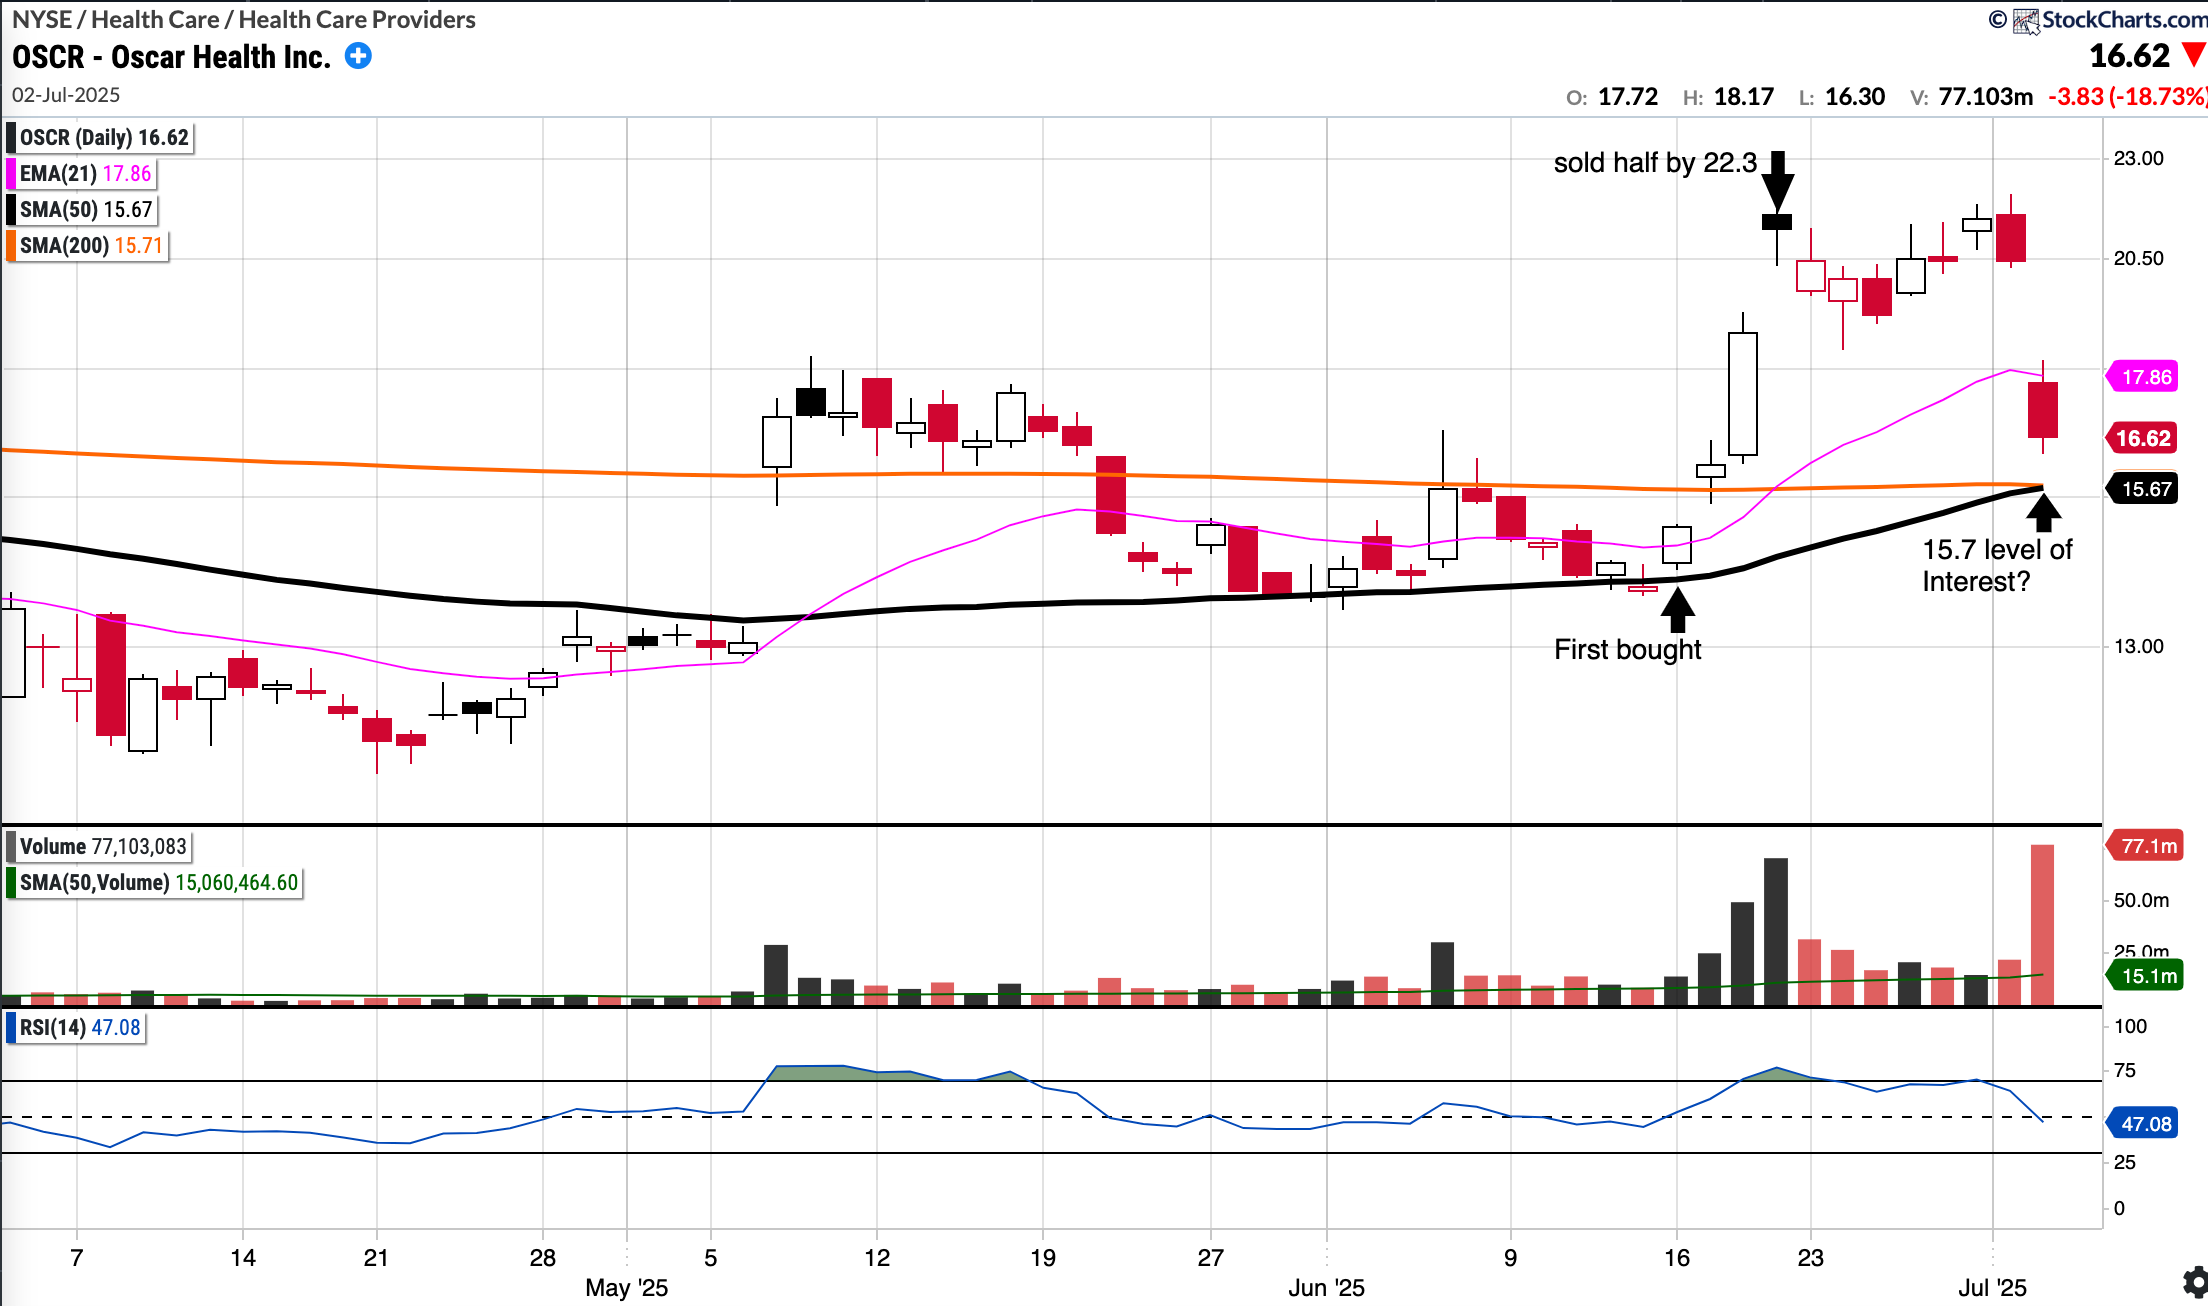
OSCR
$16.62. RSI 47.08. 6% above 50SMA.
+22.66% YTD
Recently reached as high as mid 22’s and today gapped down on huge volume. ~$15.7 could be first level of real interest, with confluence of 50SMA and 200SMA. Below that $14.
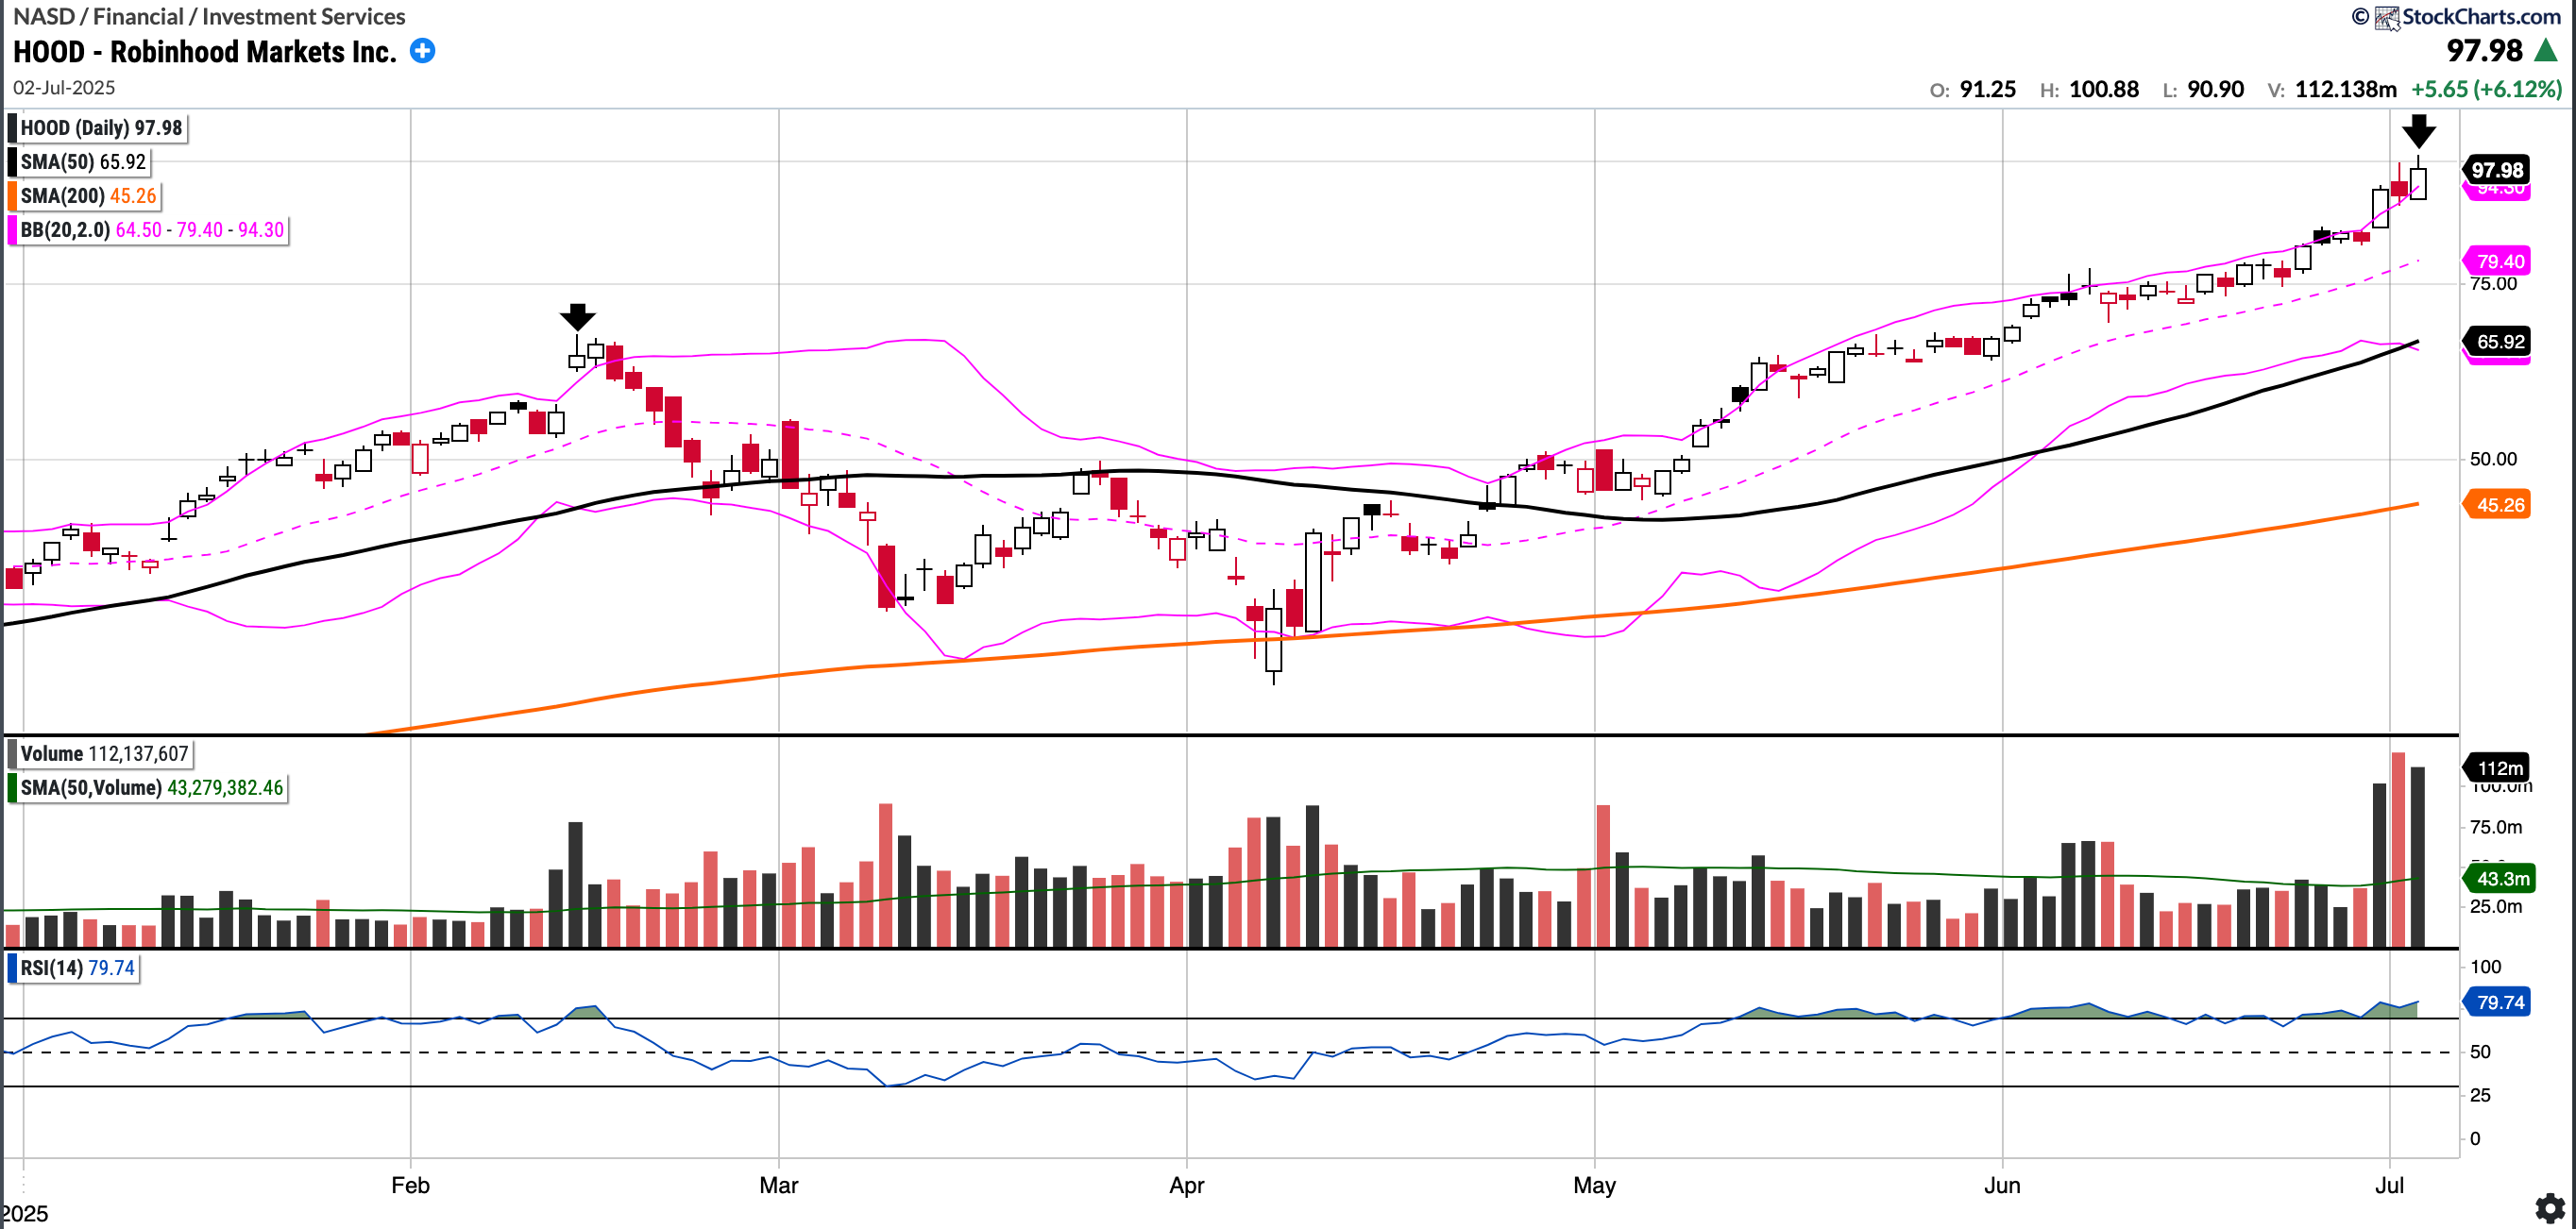
HOOD
$97.98. RSI 79.74. 48.62% above 50SMA and 116.49%(!) above 200SMA
148.43% YTD
Clearly very strong PA but is very extended. Now above upper Bollinger, interestingly in Feb when it last did this it proceeded to correct 50%. A place to take profits?
Hope that was useful and interesting. As always, any buy/sells I make I will give live updates to subscribers in the Subscriber Chat.
Thanks all for reading and see you for the next one!
Very useful, thank you
very helpful