Charts Review
This is a slight departure from my usual posting style, but I wanted to share some charts that have been requested for analysis
We will be looking at:
AMD
APP
LAES
MELI
RKT
SE
TMDX
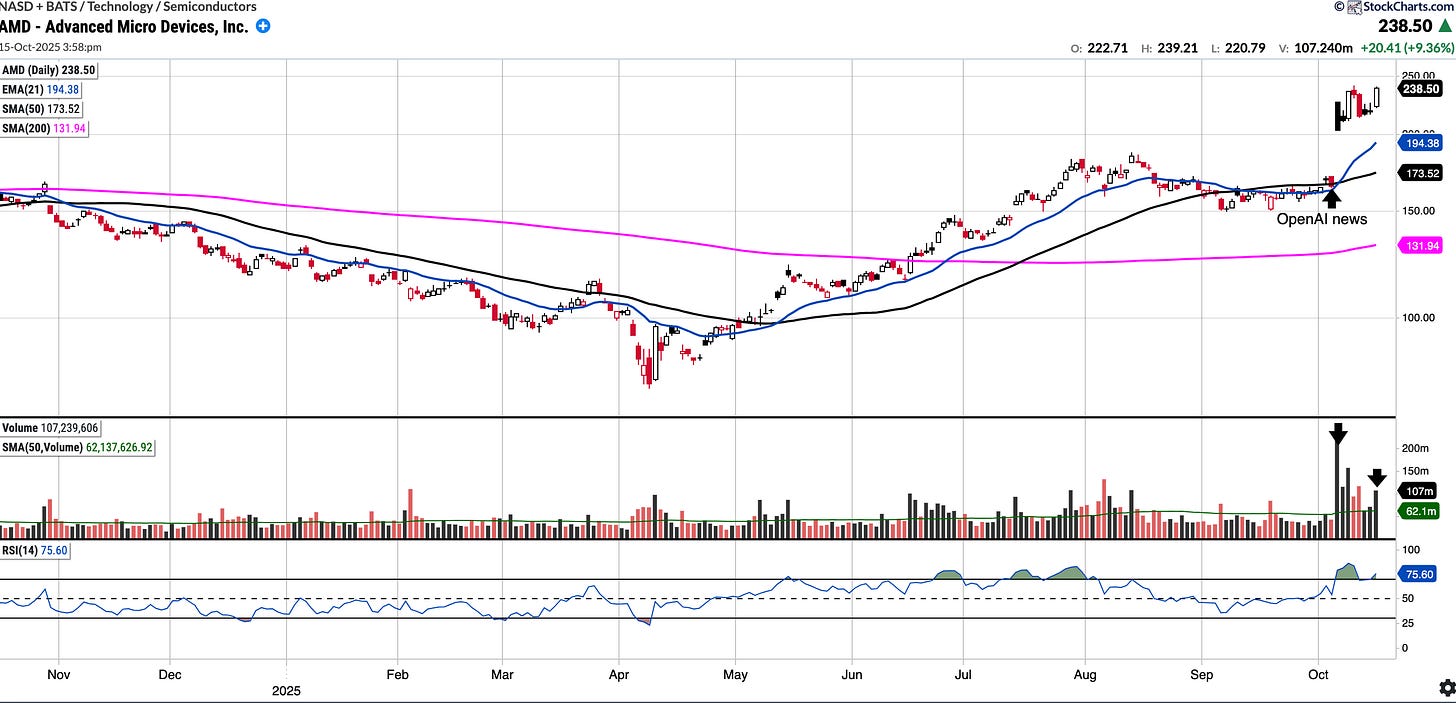
AMD (currently Long)
Currently trades at $238.6, 37.5% above the 50SMA and 80.84% above 200SMA.
RSI 79.21
97.97% YTD
AMD has had a stellar bounce from the lows in April and was trading at around $165 last Monday when the news of AMD and OpenAI’s multi year partnership hit the tape. Since then the stock is up ~$73. AMD is technically overbought but there has been a notable sentiment shift, huge volume entering the stock is proof of this. Stock needs a period of consolidation however, if this bull run continues I could see this north of 280.
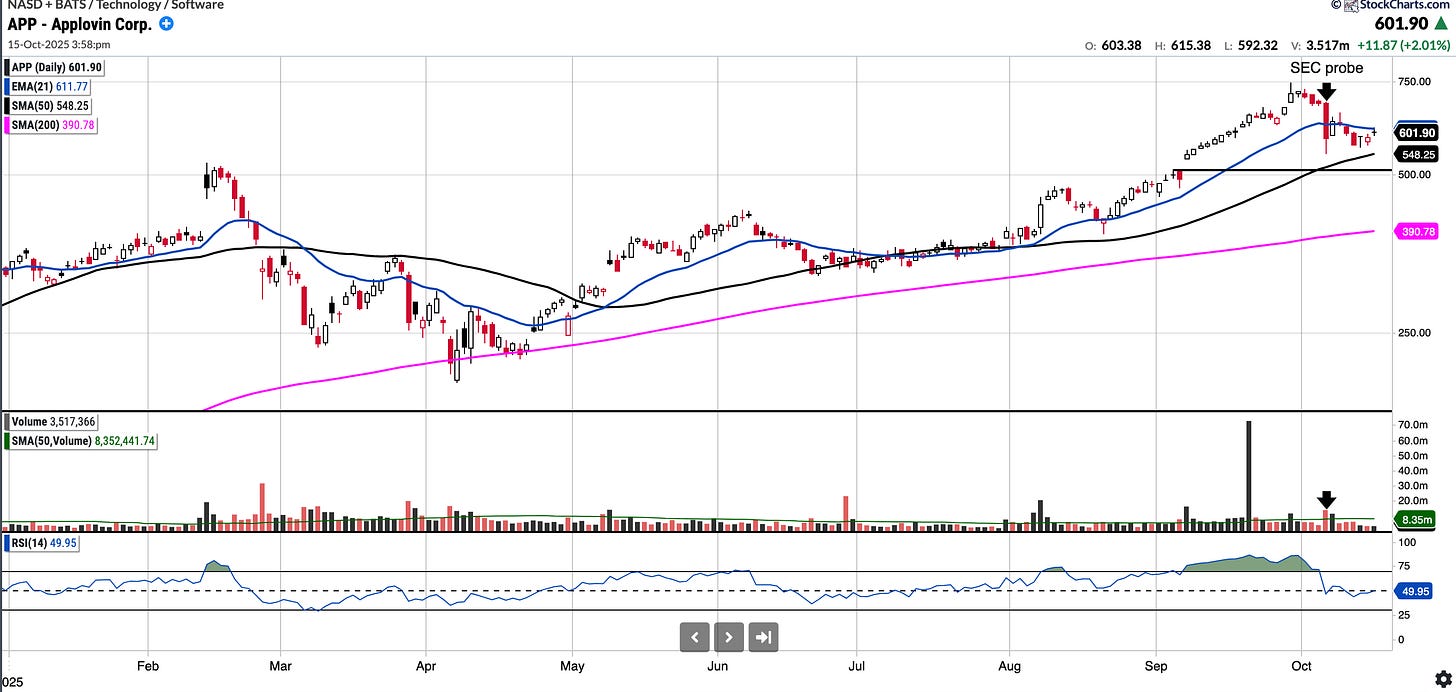
APP (no position)
Currently trades at $602.3, 9.86% above the 50SMA and 54.13% above 200SMA.
RSI 44.62
+76.22% YTD
News that Applovin was to be added to the S&P 500 came out on the 5th of September and was included on the 22th of September. Note the huge volume on the 19th.
On the 6th of October Applovin was probed by the SEC over it’s data collection practices and the stock fell over 18% on the day. It remains ~20% off the high. Gap fill from early September news takes you to ~510-515 level which would be a higher R/R entry I feel. Watching.
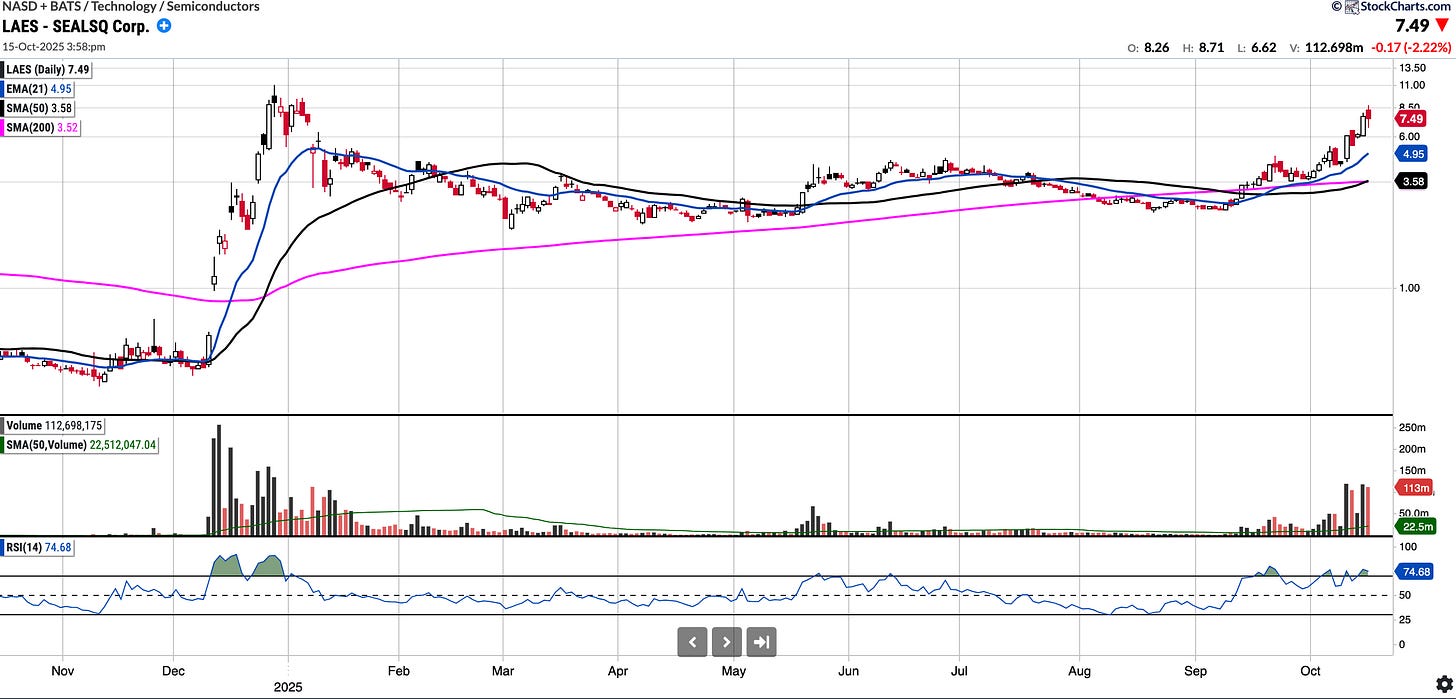
LAES Sealsq Corp (no position)
Currently trades at $7.49, 109.42% above the 50SMA and 112.58% above 200SMA.
RSI 74.69
+103.53% YTD
Sealsq Corp is a company focused on developing and selling Semiconductors, Public Key Infrastructure and Post-Quantum technology hardware and software products. The stock has doubled in the past month and whilst they priced a 200M securities offering today which led to the stock finishing down 2% it remains overbought.
I note it also had a similar run at the turn of the year when it reached $11.00 after which point it corrected to <$2. The fundamentals do not support the move so I will watch from the sidelines as I could see it making a run for 11 or collapsing again.
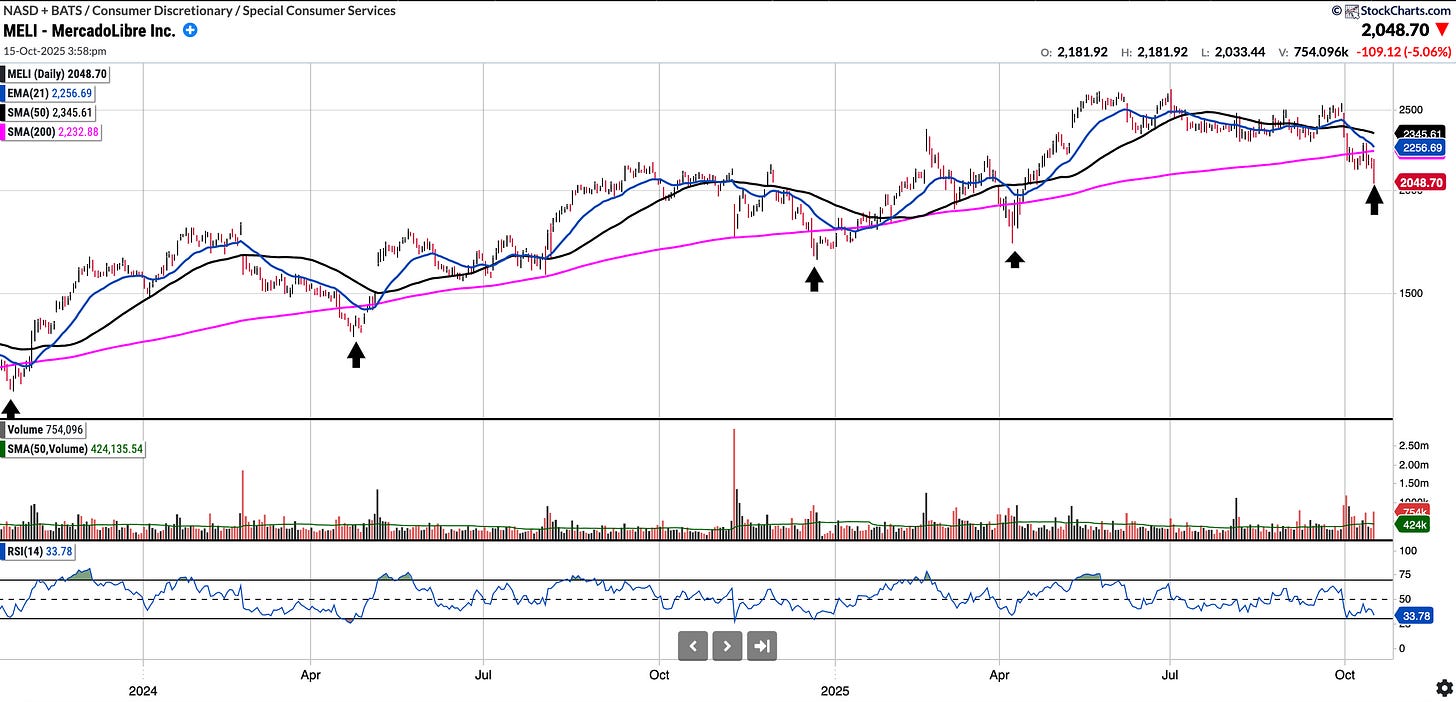
MELI (no position)
Currently trades at $2,048.35, 12.67% below the 50SMA and 8.26% below the 200SMA.
RSI 27.59
+16.05% YTD
MELI has been a perennial winner over the last 17 to 18 years, rising nearly 72x during that period. However, over the last five years, its 61% gain is lower than both the QQQ (108%) and the S&P 500 (91%) respectively. Separately, MELI dropped 5% today on no obvious news
It has lost the SMA 200 but over the last few years you can see it does not stretch too far below the SMA 200 and it usually is a buying opportunity, at least thats what recent history tells us. Valuation is not “cheap” albeit PEG of <1 and lowest decile PE multiple.
RKT (No position)
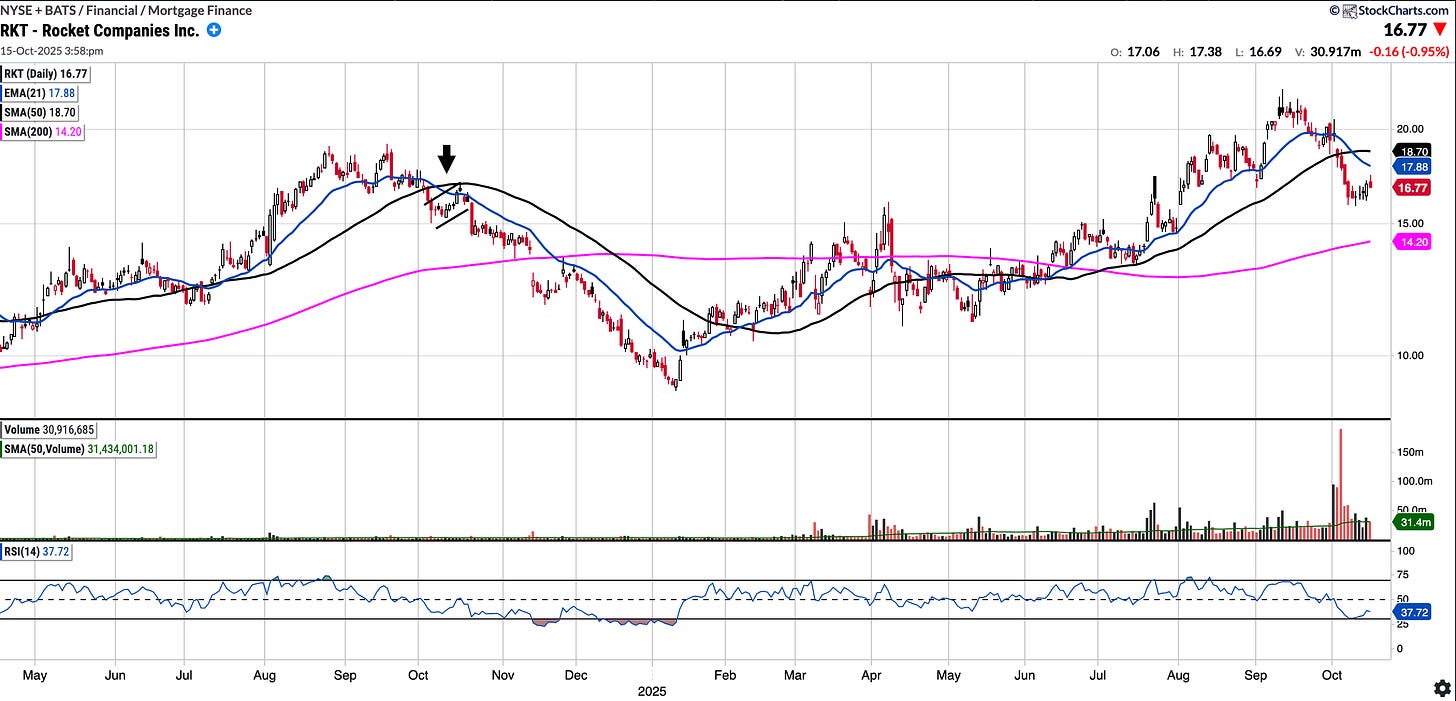
Currently trades at $16.73, 10.55% below the 50SMA and 16.25% above the 200SMA.
RSI 37.48
+54.19% YTD
RKT should in theory be a rate cut beneficiary but we can see it has shown some weakness of late on volume. Appears to be a forming a bear flag like we saw last October before a further move down. Or we see a base form and a move back towards $20.
SE (currently Long)
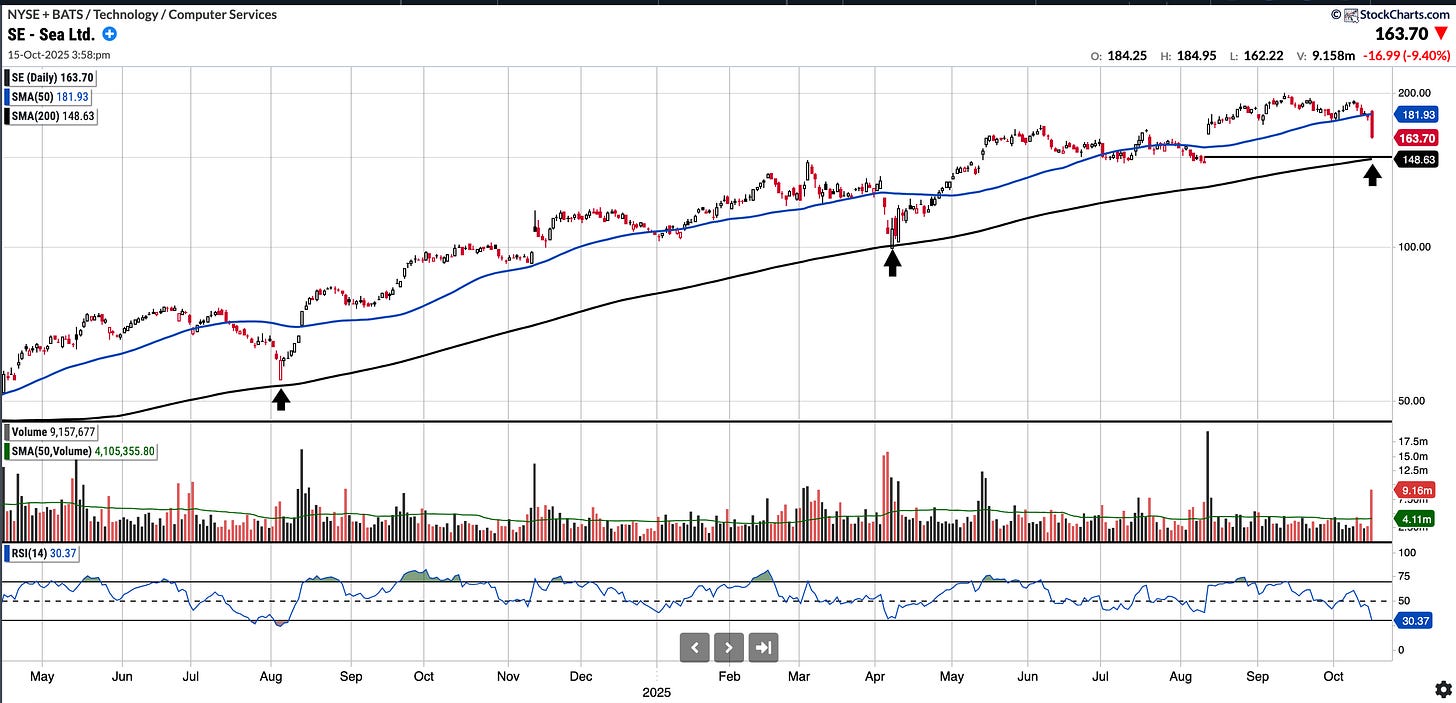
Currently trades at $163.42, 10.17% below the 50SMA and 9.95% above the 200SMA.
RSI 30.21
+55.83% YTD
SE has had a strong couple of years and remains in an uptrend. It did pullback 9.5% during the cash session today, and I will probably be looking to buy in the 150 and below (gap fill and SMA 200 level)
TMDX (currently Long)
Currently trades at $112.61, 3.37% below the 50SMA and 13.41% above the 200SMA.
RSI 47.09
+69.34% YTD
TMDX has been struggling to surpass the high 120’s which coincides with a descending trend-line from the June high. There is some chatter of a weak Q3 which may be weighing on the stock.
On weakness the key area to watch below is the 98/100 level for support which coincides with the gap fill level from May and also the up-trending SMA 200.
Thank you for reading, ensure to subscribe to the plan that suits and see you for the next one!!



Thanks for sharing these charts and commentary, really insightful.
good thread!