
How To Buy Stocks Near Their Lows
Sharing key lessons that have helped me generate strong returns

This post summarises the process I use when looking to buy stocks near their lows. It details the lessons I have learned and the framework I use to consistently identify and execute entries at these levels.
I also recommend reviewing my other investment philosophy posts. When combined with the strategies shared here, they provide a more comprehensive view of how I approach the markets. Investment Philosophy Posts
As always if you enjoy the post ensure to like and re-stack if possible.
Initial Analysis and Catalyst Tracking
When a stock you are interested in begins to fall, watch it closely. Identify any upcoming catalysts, whether positive or negative. If there are none, it means you have time. Try to work out why it is dropping: is it company-specific or sector-specific? Is it being unjustly punished? Is it a temporary issue or a thesis-changing one? If the reason is not thesis-breaking, you can continue to the next steps and give the setup more consideration.
Fundamental Due Diligence
Ensure you do the fundamental work early on. I have written about the 4M’s framework before (link below); in short, you should know what the company does, what their advantages are, what management is like, and if they are trading at a margin of safety.
I recommend checking their filings and being familiar with all three financial statements. Listen to the earnings calls as well. If you are doing a DCF, use conservative estimates to identify what the stock is worth. This ensures that when the time comes, you know you are buying at a steep discount.
Layering in Technical Analysis
Don’t buy the dip too early; be patient. Ideally, you want to be one of the last ones to buy the dip. This is important as you can study previous price action and also wait for sellers to dry up. I recommend studying the charts over several time frames; daily and weekly charts are good places to start.
There are several approaches one can take here or even combining them
Buying at the right side of the V
Waiting for the 5 EMA to cross over the 20EMA
Buying at long-standing support
Waiting until it has started to base at least 5% above 52 week lows before initiating some pilot buys
Buying on a waterfall decline (more risky set-up)
I think it would be good to put some examples below of what each of these looks like.
Buying at the “Right Side” of the V
This is a simple strategy: once you have identified a price you would like to pay, wait for the stock to stop declining. When it reverses back up to that level, you can initiate the trade. This is a higher probability entry and allows you to set your stop-loss at the recent low to protect your position.
 in - Thread from Lance Breitstein 🇺🇸🌎 @")
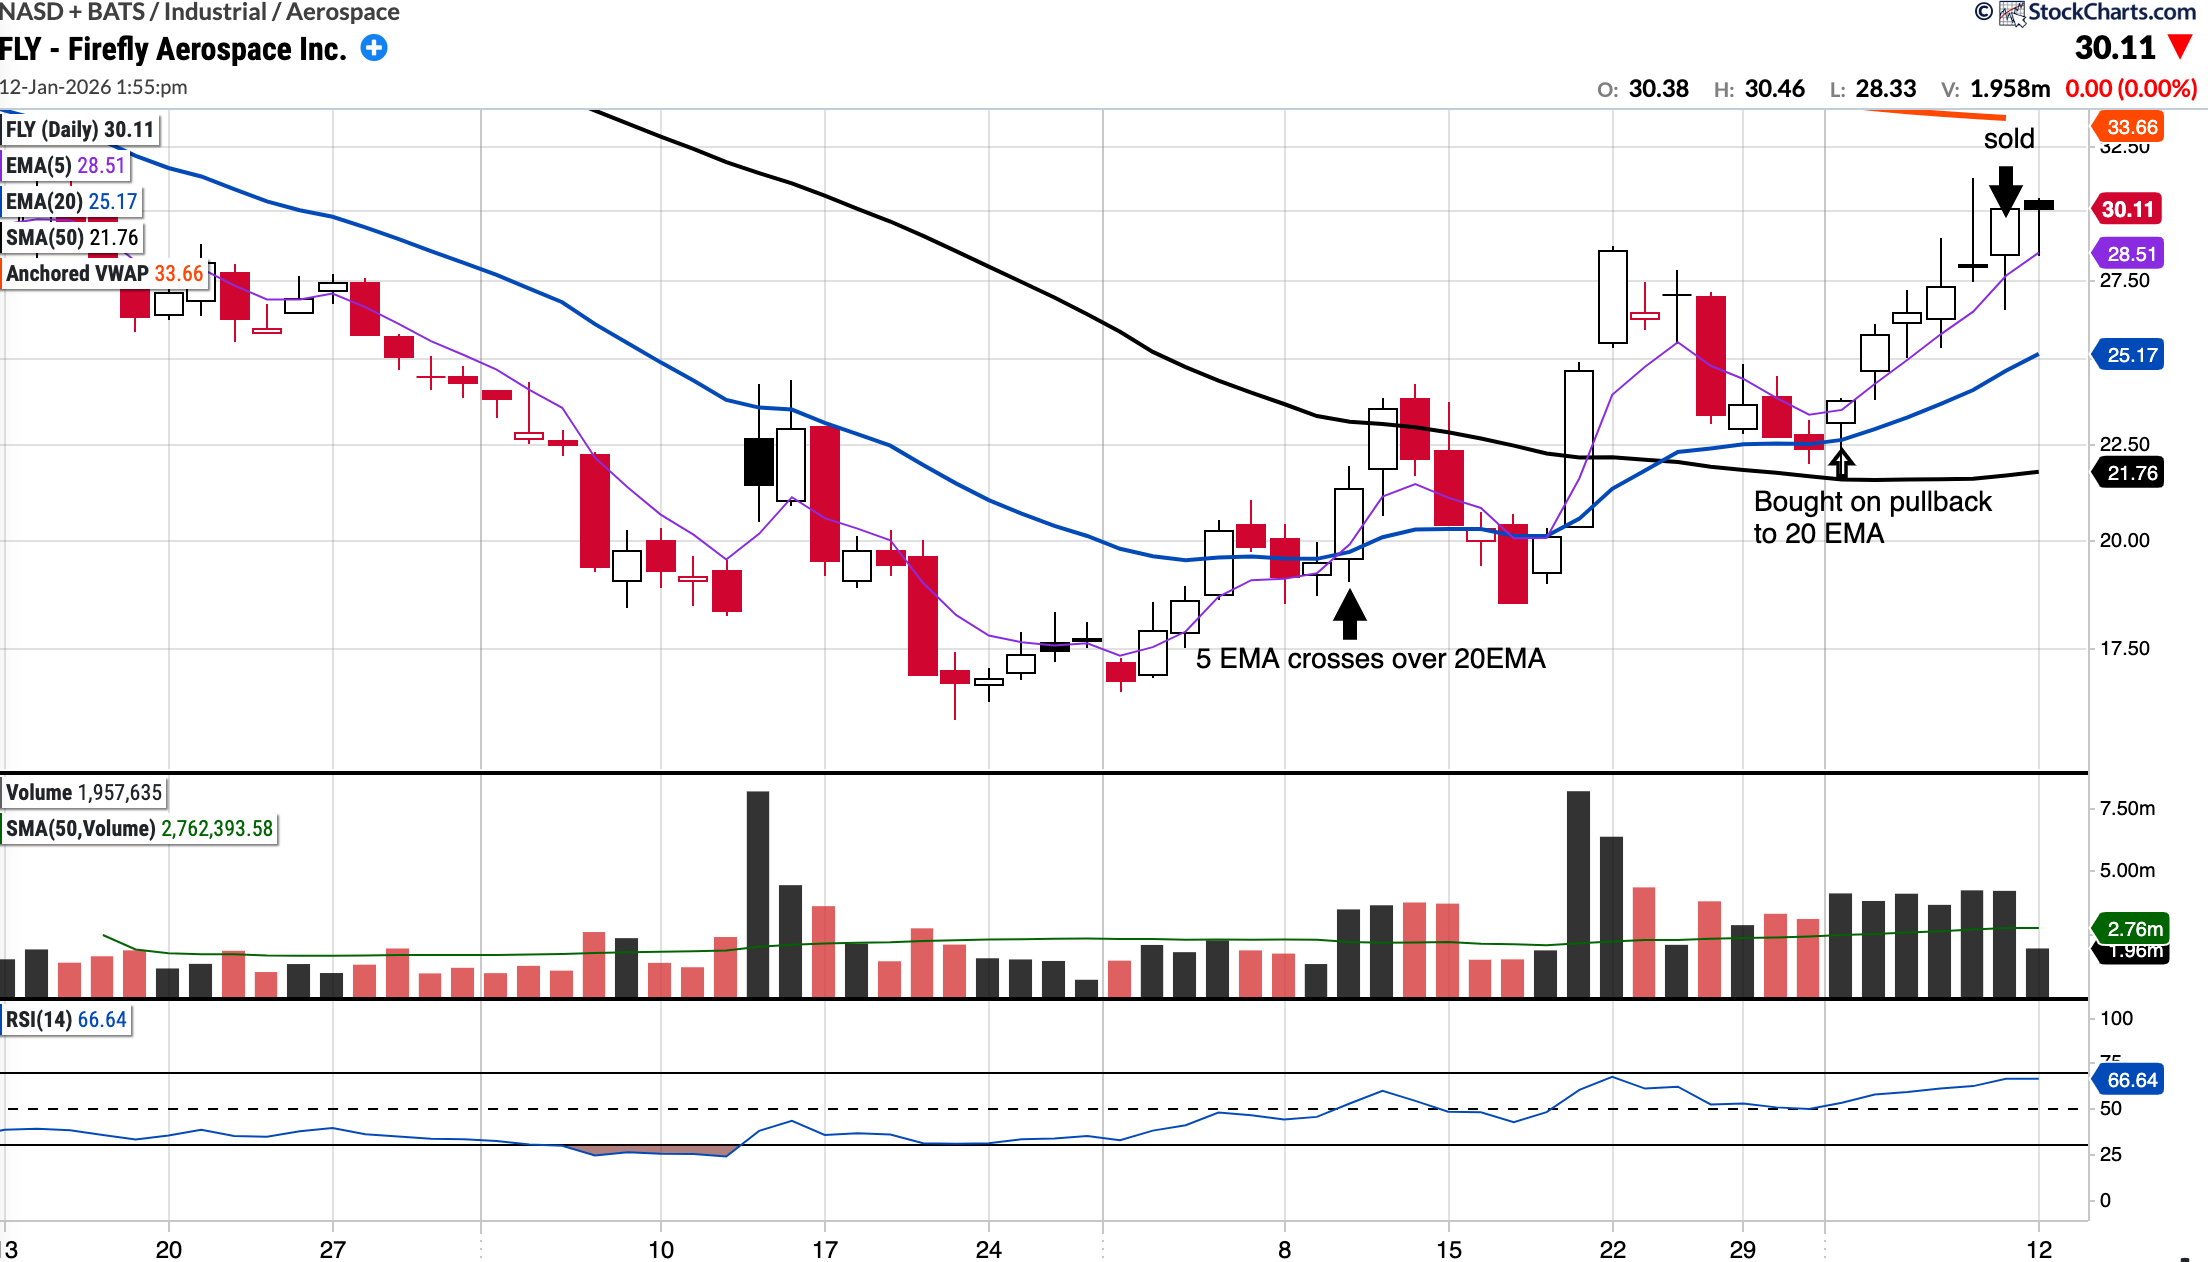
Moving Averages cross-over
Waiting for the 5-period EMA to cross over the 20-period EMA is a simple strategy I use. The idea is to wait for confirmation of a possible trend change before committing any capital.
Below is a chart from my recent FLY trade. I was interested in the stock for a little while, but I was looking for an entry once the 5 EMA crossed above the 20 EMA and held there. I eventually entered the position on a re-test of the 20 EMA. This turned out to be a solid trade, resulting in a 35% to 36% gain in about six sessions.
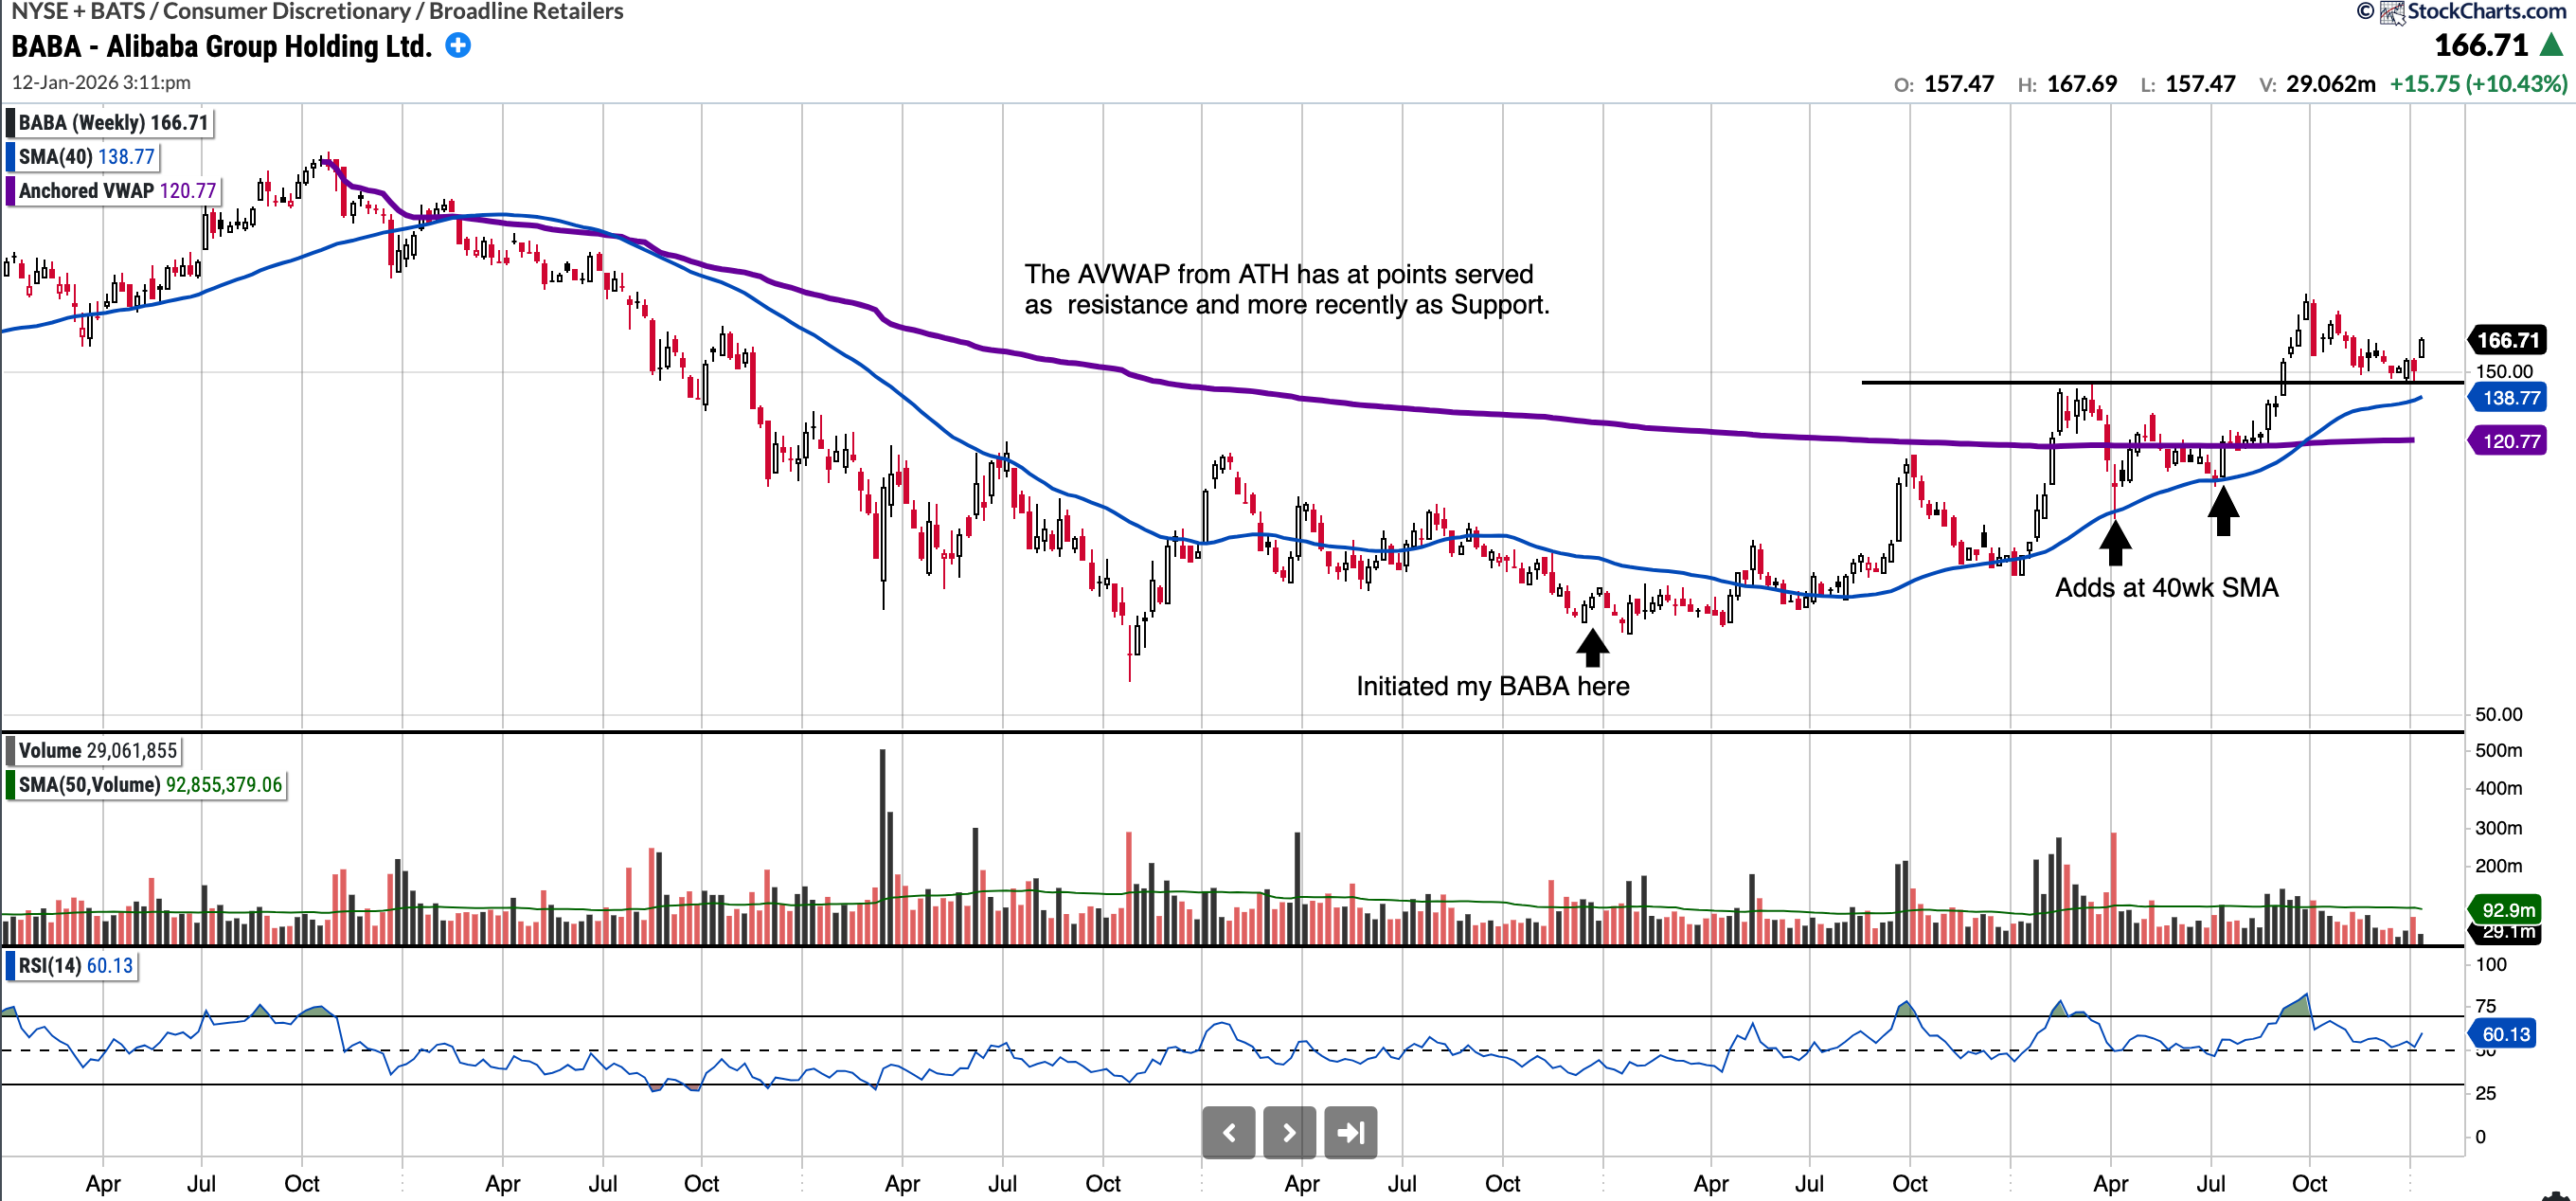
Basing
Waiting for a stock to base a few percentage points (at least 5%) above the 52-week low is another strategy I like to use. The reason for this is simple: you want to see evidence that the stock is likely to hold previous lows and that a trend change is in play.
Back in 2023, I was interested in BABA. While the stock had bottomed at $55 per share the prior year, I purchased my entry between $68 and $70 in December 2023. At that point, the stock was basing, and there was a massive price-to-value dislocation with the shares trading at only 7x earnings. I later topped up the position by adding on re-tests of the 40-week SMA. I still hold those shares to this day.
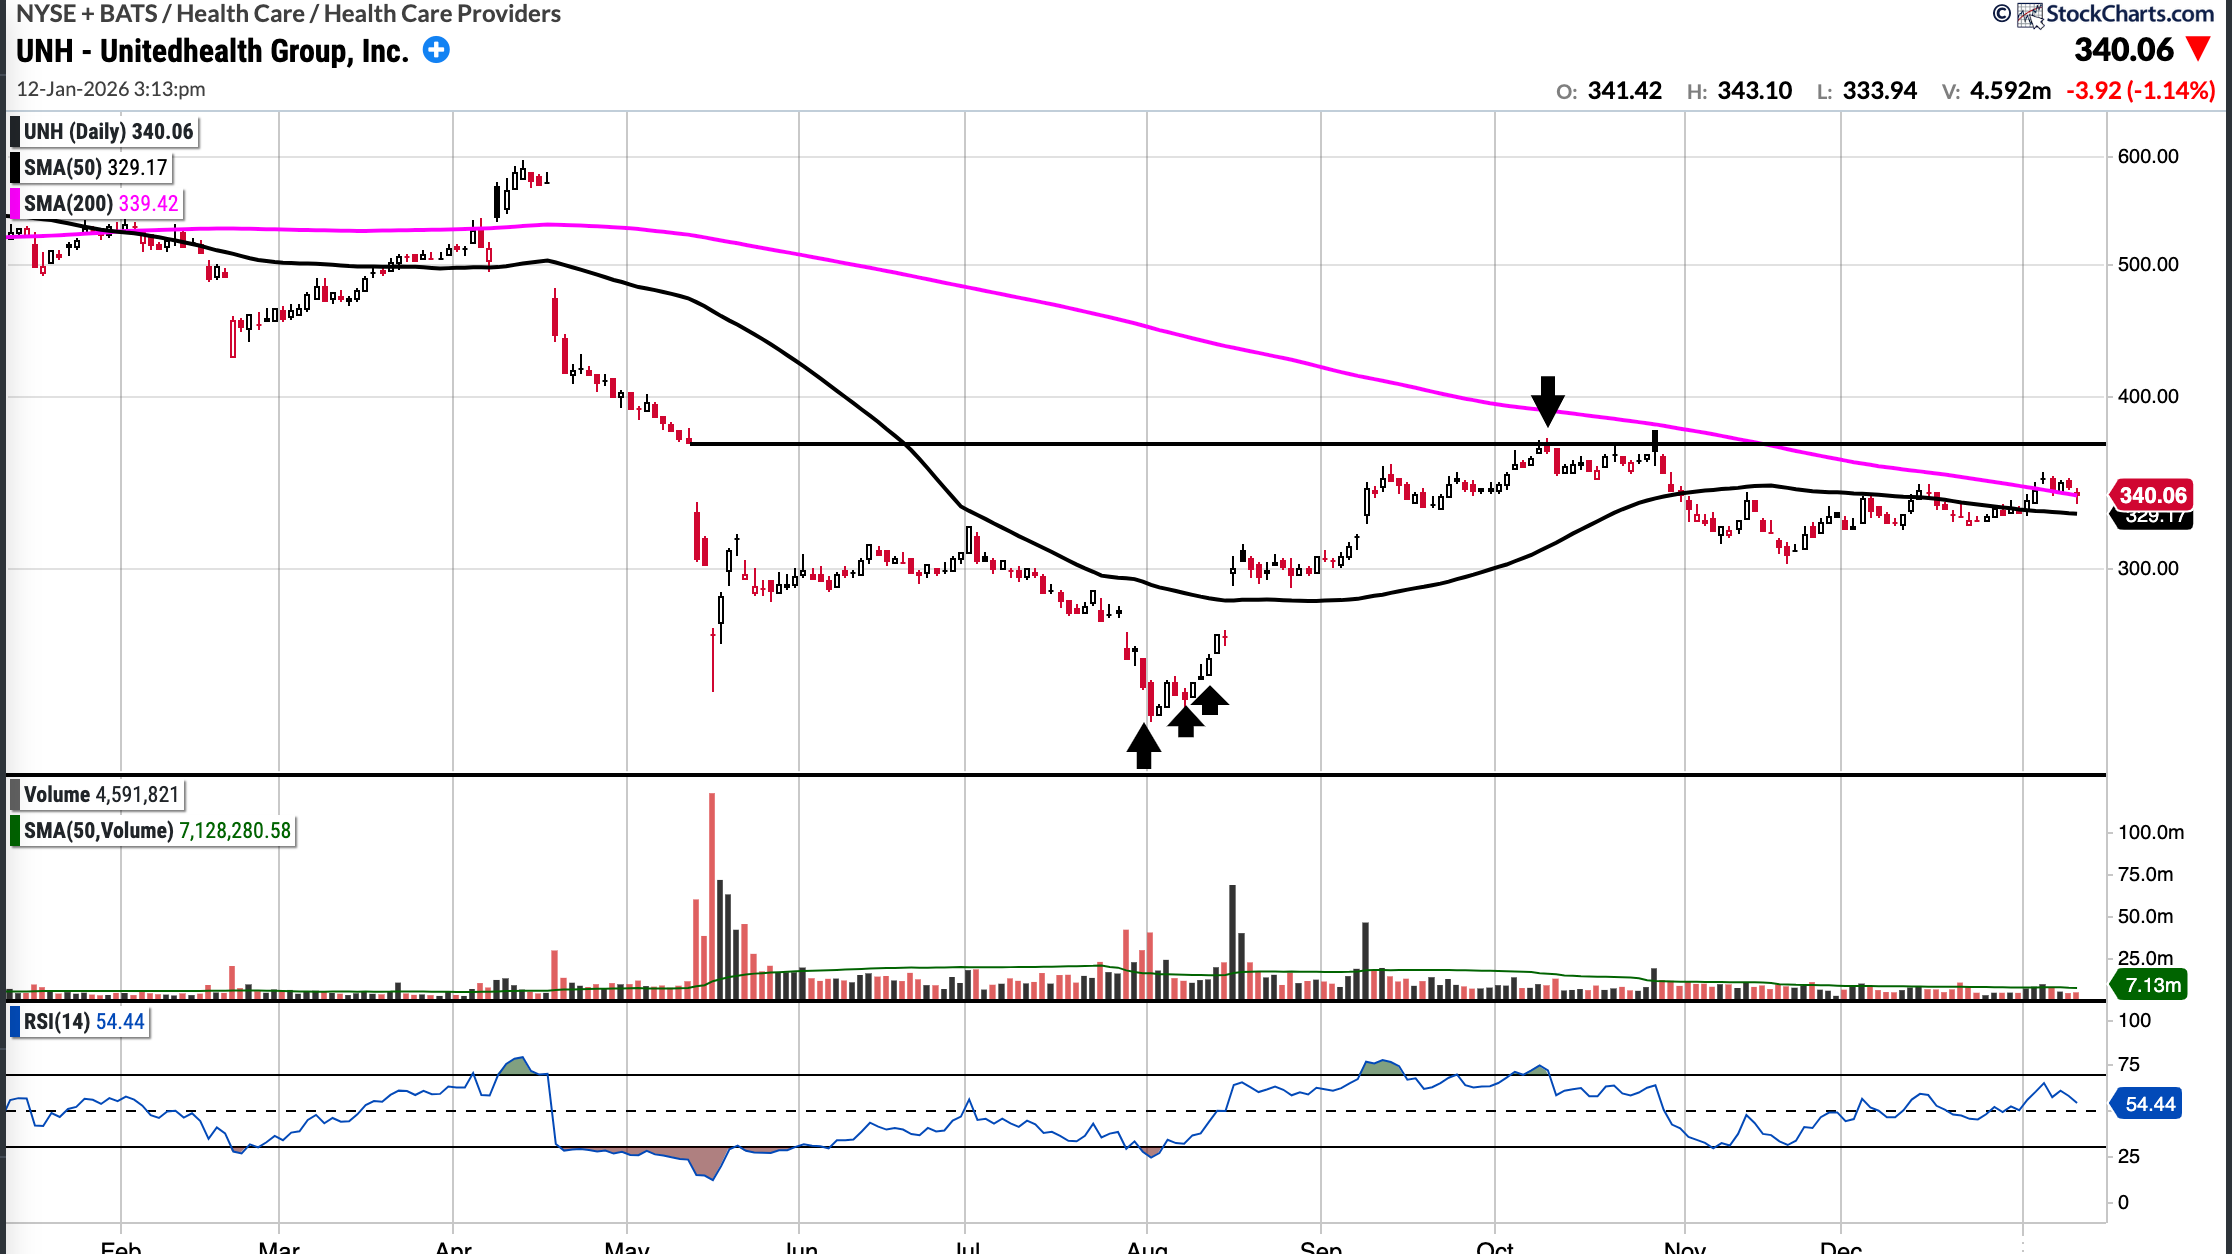
Waterfall decline
UNH is an example of how I traded a “waterfall decline.” This is a riskier setup, but I managed it by combining the principles of buying late (less sellers) and topping up on the right side of the “V”. When the shares first fell in the middle of May, I put UNH on my radar but did not purchase shares. The huge sell volume that came in was enough to keep me away initially.
However, I completed my fundamental work and marked out 240 as a level I would consider buying from a valuation perspective. When the stock began to decline rapidly in August, I started buying. I purchased multiple lots between the 230s and the high 240s as the stock began to move back up. I eventually exited the position in the middle of October once the gap was filled.
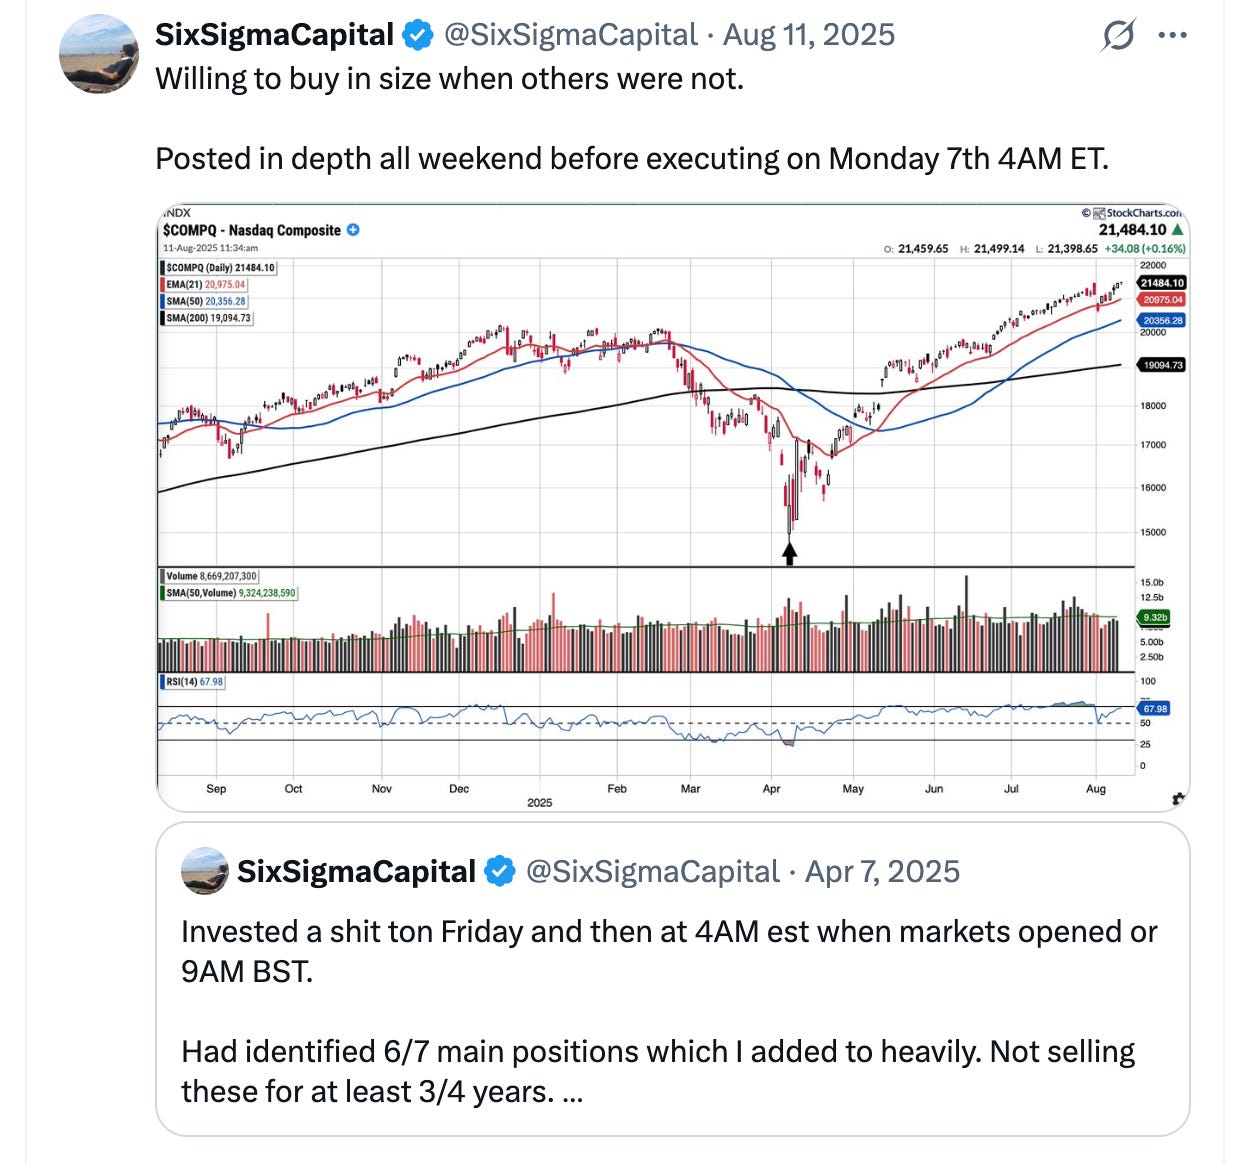
Another example of buying a waterfall decline is when I nailed the April 7, 2025, bottom. I posted an in-depth analysis throughout the entire weekend prior to executing the trade on Monday at 4:00 AM ET. Analysis from April 6th
Sentiment
Tracking sentiment is another piece of the puzzle. While it is not an exact science, there are several specific ways I incorporate sentiment analysis into my process.
As mentioned previously, I do not recommend buying when the general public is “buying the dip.” Instead, look for entry points when those early buyers have become dejected and have finally given up. A major signal occurs when ridiculously low price targets begin to circulate or when “all-in” single-stock investors sell their positions out of frustration. Notable examples include the Tesla capitulation at $150 in April 2024 or when market consensus was that Google is an “AI loser.”
I also prefer to wait for analysts to downgrade their estimates and price targets. This process often de-risks the situation; once expectations have been lowered, the bar for the company to provide a positive surprise becomes much easier to clear.
Finally, if you have a social media following, you can use it to gauge the prevailing mood. For instance, I posted the tweet asking, “I bought UNH at 237, am I cooked?” The post received unusually high engagement, responses were overwhelmingly bearish, with some users even calling for prices below $100. As there was extreme pessimism, I felt it was a decent contrarian indicator. UNH sentiment post
Thank you for reading and see you for the next one!
Great read, thanks for sharing.
A+ post, would appreciate a mirror post on selling indicators as well!