
Monthly Portfolio Update: +407% TWR Since 2023 (+317% Outperformance vs. S&P 500)
Market Thoughts | +317% Performance Since Inception | 2026 Position Plans & Outlook.

I hope you are well. Below, we provide market commentary and an in-depth portfolio update.
Format for what is covered in this Monthly Portfolio Update:
Market Thoughts
Indices Review
Key Indicators
SixSigmaCapital Performance: YTD and since Inception
Featured Quote
Current Positions in size order
Closing Thoughts
If it is your first time here, ensure to check out what SixSigmaCapital readers are saying below:

For all readers a reminder that a premium subscription includes:
Live Portfolio updates (All Buys and Sells) in Subscriber only Channels
Favourite set-up Ideas, Market Memos plus Full archive
Discord access for AMAs and live trading account updates.
Monthly in depth portfolio & performance updates
Upgrade to a premium subscription via the link below:
Market thoughts:
Equity markets had yet another volatile month, with the Dow, S&P 500, and Nasdaq Composite posting month-over-month returns of -5.4%, -5.1%, and -4.8%, respectively.
For the last several months, I have been saying the following in this letter
“My perspective remains that there is plenty to be concerned about regarding the US economy and equity markets over the medium term” and
“Historically, there tends to be a large drawdown in the S&P 500 within the 12 months preceding election day. I do not know whether it will be Fed-related, a policy shock by the White House, or an economic downturn that triggers the drawdown (or something else entirely), but I think it is very likely we will see one given the way markets are behaving”
Whilst markets had demonstrated remarkable resilience and continued to climb the wall of worry, the indices finally cracked in March. The S&P 500 pulled back more than 9% peak-to-trough, and the Nasdaq fell 13%. Although this may seem modest compared to other pullbacks, significant damage has been done under the hood: at the end of March, over 42% of S&P 500 stocks were in a bear market, with more than 79% trading below their 50-day SMA. Consumer Discretionary, Information Technology, and Financials were among the worst performers in Q1, while Energy was the best performer.
We are seeing a stagflationary picture with upticking inflation, tapering GDP, and a generally weakening jobs market, the most recent NFP excluded. Notably, large companies are conducting layoffs en masse.
The war in the Middle East and its aftermath are likely to serve as further headwinds in the coming months. If we look at oil specifically, I backtested what happens to equity markets when crude remains consistently above 100; I found that stocks can remain robust for around 20 days, but after that, they tend to suffer. This is something to pay attention to.
Tariffs:
Regarding the tariff landscape, on February 20, the Supreme Court ruled that the president overstepped his authority by utilising the International Emergency Economic Powers Act (IEEPA) to impose sweeping global tariffs in 2025. The court determined that Congress holds the exclusive power to create new taxes. In response to the ruling, the administration immediately invoked Section 122 of the Trade Act of 1974 to implement a new 10% global tariff, which was subsequently increased to a 15% target rate. These new duties became effective on February 24, 2026, starting at the 10% rate while the administration finalised the transition to 15%.
As it stands, the status of major trade deals with the EU and Japan has become highly uncertain.
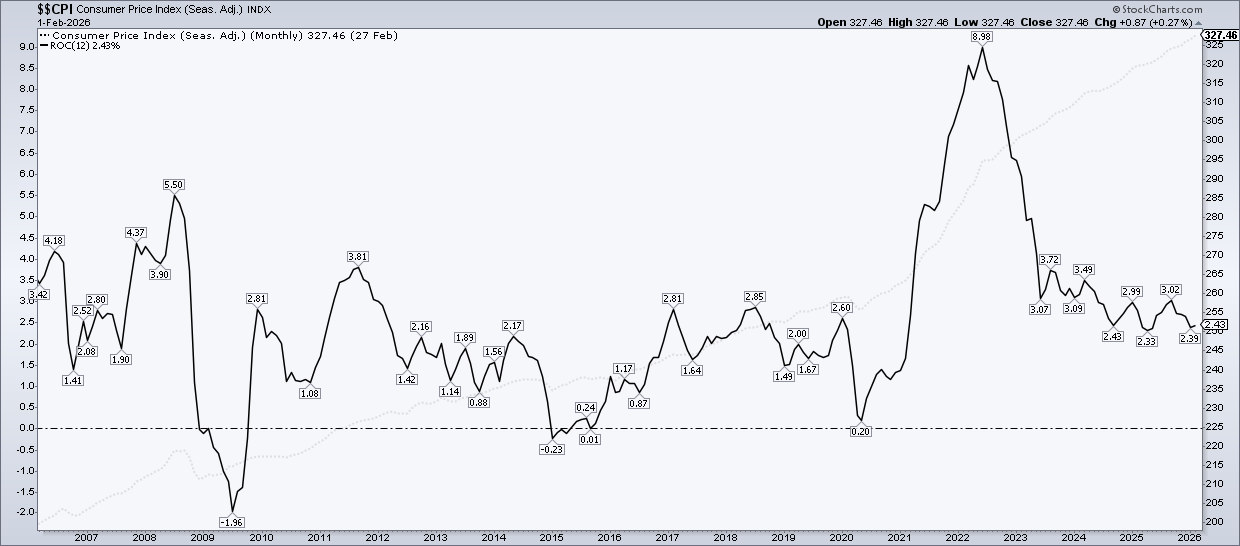
Inflation:
CPI: The February 2025 CPI data came in as expected
Headline CPI increased 2.4% YOY vs expectations of 2.4% YOY.
Headline CPI increased 0.3% MOM vs expectation of 0.3% MOM.
Core CPI increased 2.5% YOY vs expectations of 2.5% YOY
Core CPI increased 0.2% MOM vs expectations of 0.2% MOM
This report will likely serve as the "calm before the storm," as the data was gathered prior to the Middle East conflict that has since driven energy prices sharply higher. In fact, crude has surged nearly 50% in the last month alone.
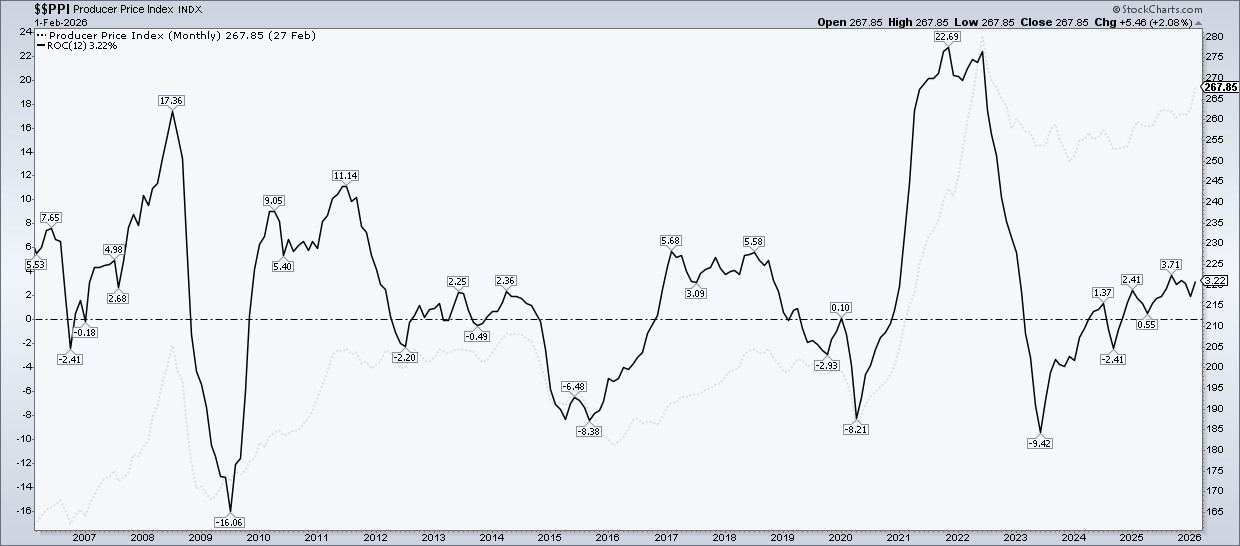
PPI: The February 2025 PPI data came in hotter than expected.
Headline PPI increased 2.6% YOY vs expectations of 2.1% YOY.
Headline PPI increased 0.6% MOM vs expectation of 0.3% MOM.
Core PPI increased 2.4% YOY vs expectations of 2.0% YOY
Core PPI increased 0.3% MOM vs expectations of 0.1% MOM
The PPI surge was primarily driven by a 4.4% monthly spike in wholesale energy costs, marking the largest jump in that category since early 2025.
Below I have included charts showing the trend for both CPI and PPI:
PCE: With regards to the PCE price (Fed’s preferred metric), January ‘26 data came in largely as expected.
Headline PCE increased 2.8% YOY vs expectations of 2.9% YOY.
Headline PCE increased 0.3% MOM vs expectation of 0.3% MOM.
Core PCE increased 3.1% YOY vs expectations of 3.1% YOY
Core PCE increased 0.4% MOM vs expectations of 0.3% MOM
Core PCE has proven notably sticky throughout the last year, remaining range-bound between 2.7% and 3.0%.
FOMC Meeting:
At the most recent FOMC meeting on March 18, 2026, the FOMC decided to hold interest rates steady for a second consecutive meeting as they navigate persistent inflation and a cooling labor market. The target range for the federal funds rate remains at 3.5% to 3.75%.
Updated projections showed upward revisions to both GDP growth (now 2.4% for 2026) and inflation forecasts (Core PCE raised to 2.7%), primarily due to an “oil shock” from conflict in the Middle East.
The median “dot plot” now signals only one rate cut by the end of 2026, down from the two cuts projected in December 2025.
The Fed agreed to slow its pace of quantitative tightening by reducing the monthly redemption cap on Treasury securities from $25 billion to $5 billion starting in April.
Indices:
S&P 500:
Currently trades at 6,582.69 (-4.02% YTD)
It is 2.96% below the 50SMA.
Trading at 23.55x trailing earnings and 20.31x forward earnings (per WSJ)
Nasdaq Composite:
Currently trades at 21,879.18 (-5.84% YTD)
It is 3.27% below the 50SMA.
Trading at 29.34x trailing earnings and 22.69x forward (per WSJ)
Key Indicators:
10 Year T-Note: 4.313. It has increased by 6.36% over the last year.
British Pound vs USD: 1.32 and is down 1.88% YTD.
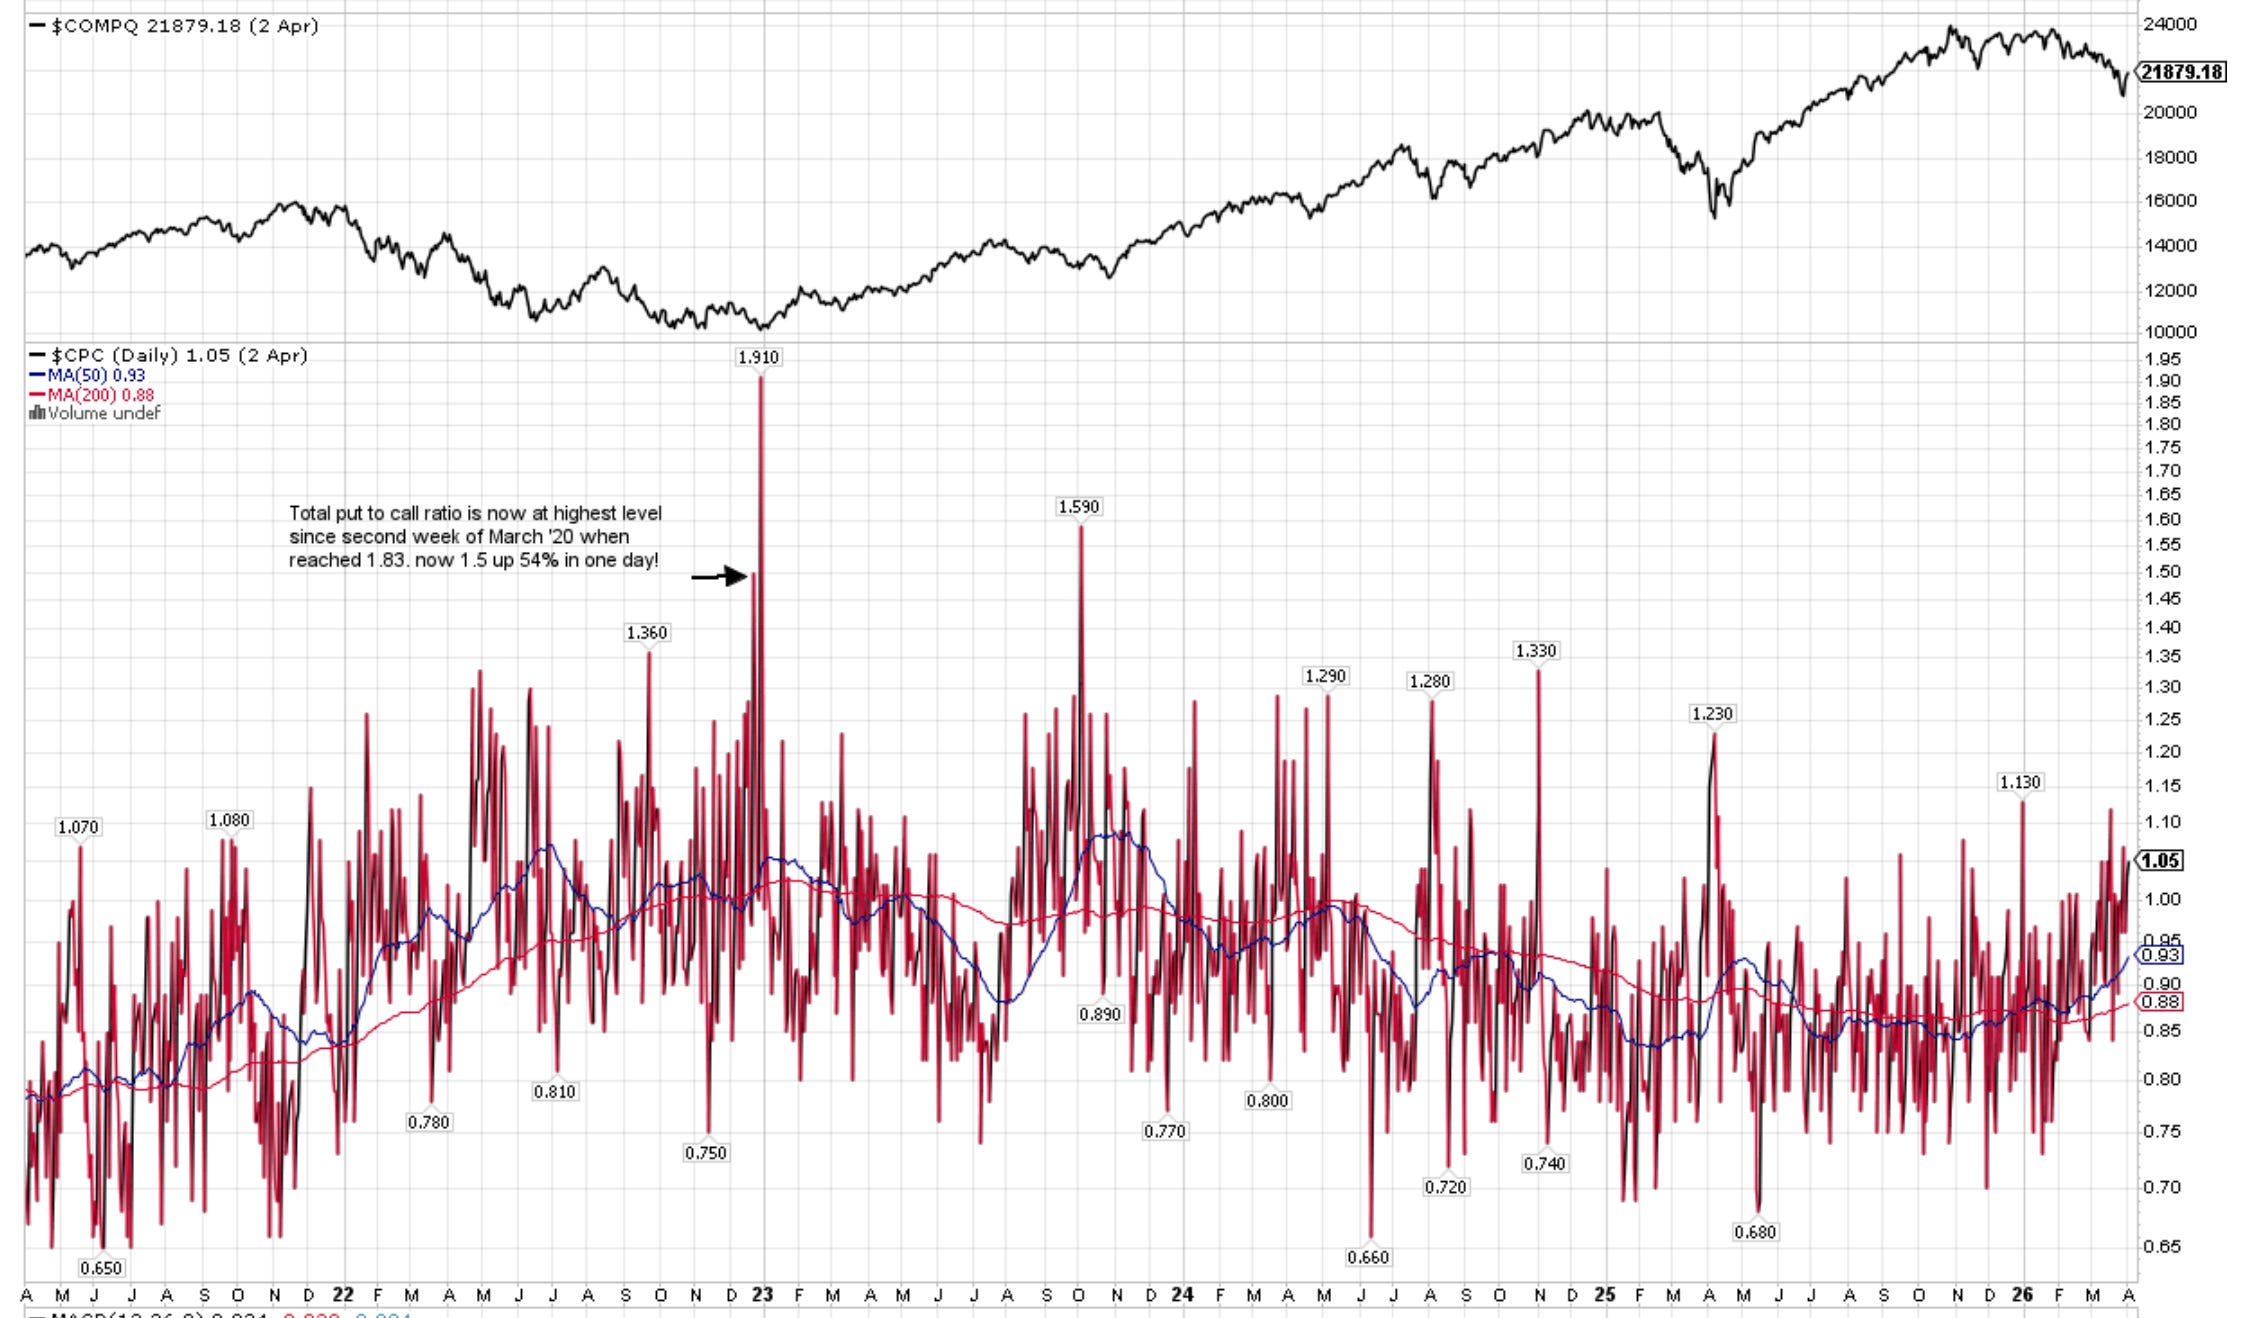
CPC (Put to Call Ratio) is 1.05. Note >1 can indicate Fear and >1.5 can be Extreme.
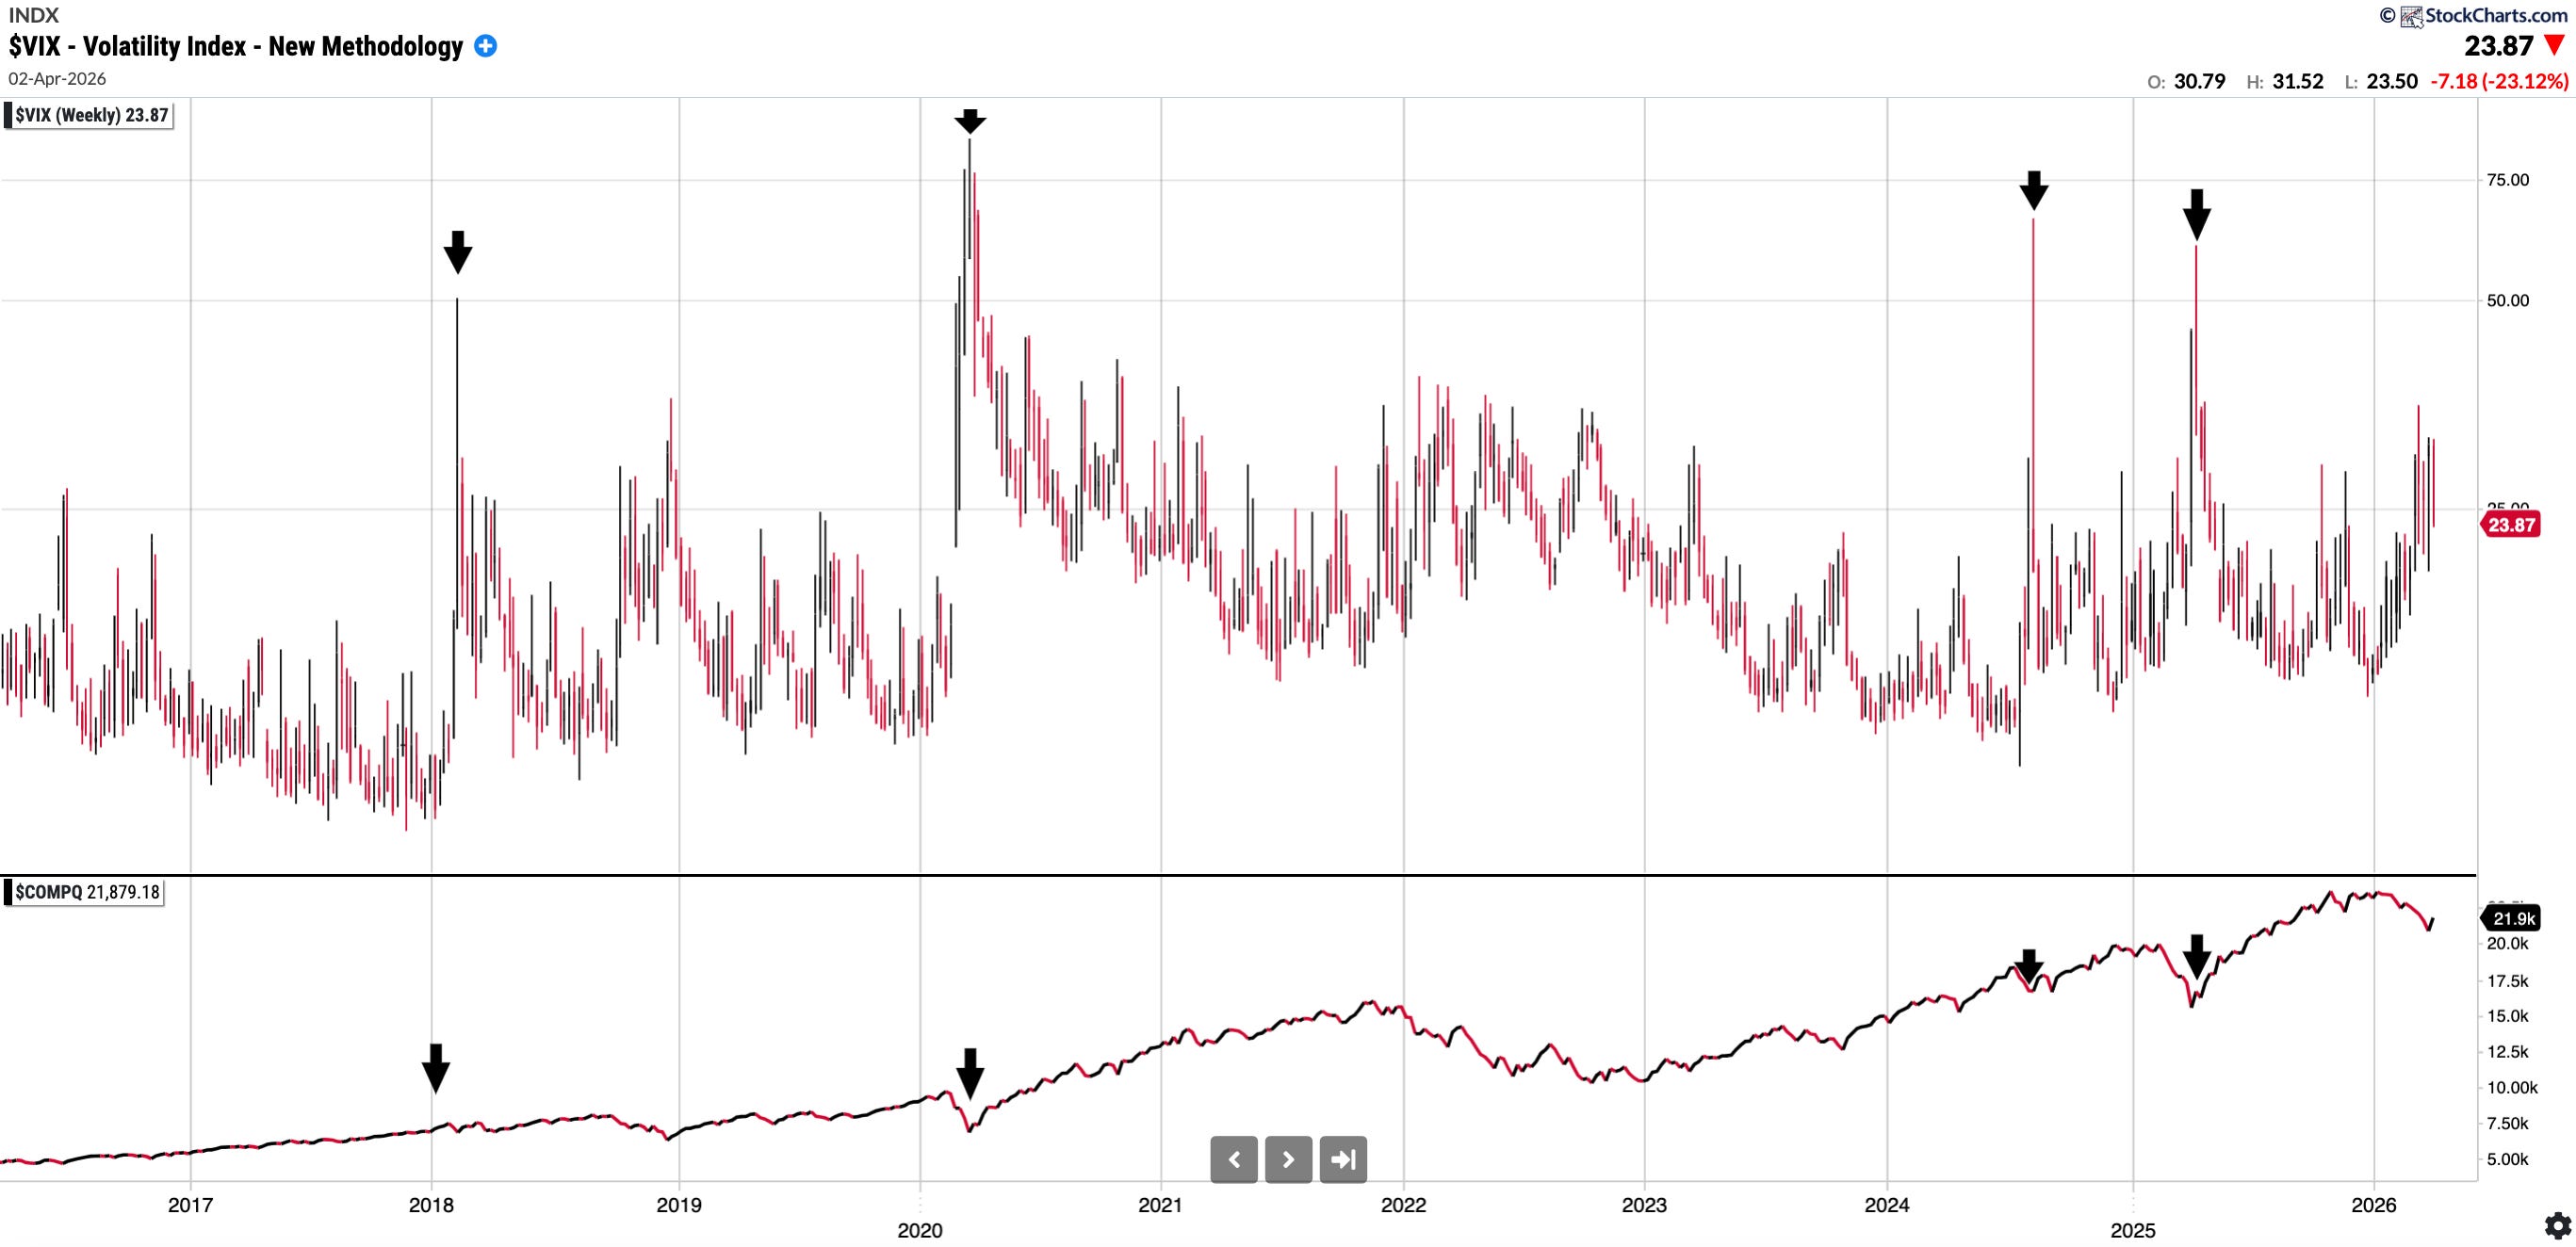
VIX: 23.87. Has remained above 20 mark thus far YTD. I have included a chart below showing the VIX over time and Nasdaq Comp underneath it: you can see extreme readings always have been a buying opportunity in the medium term.
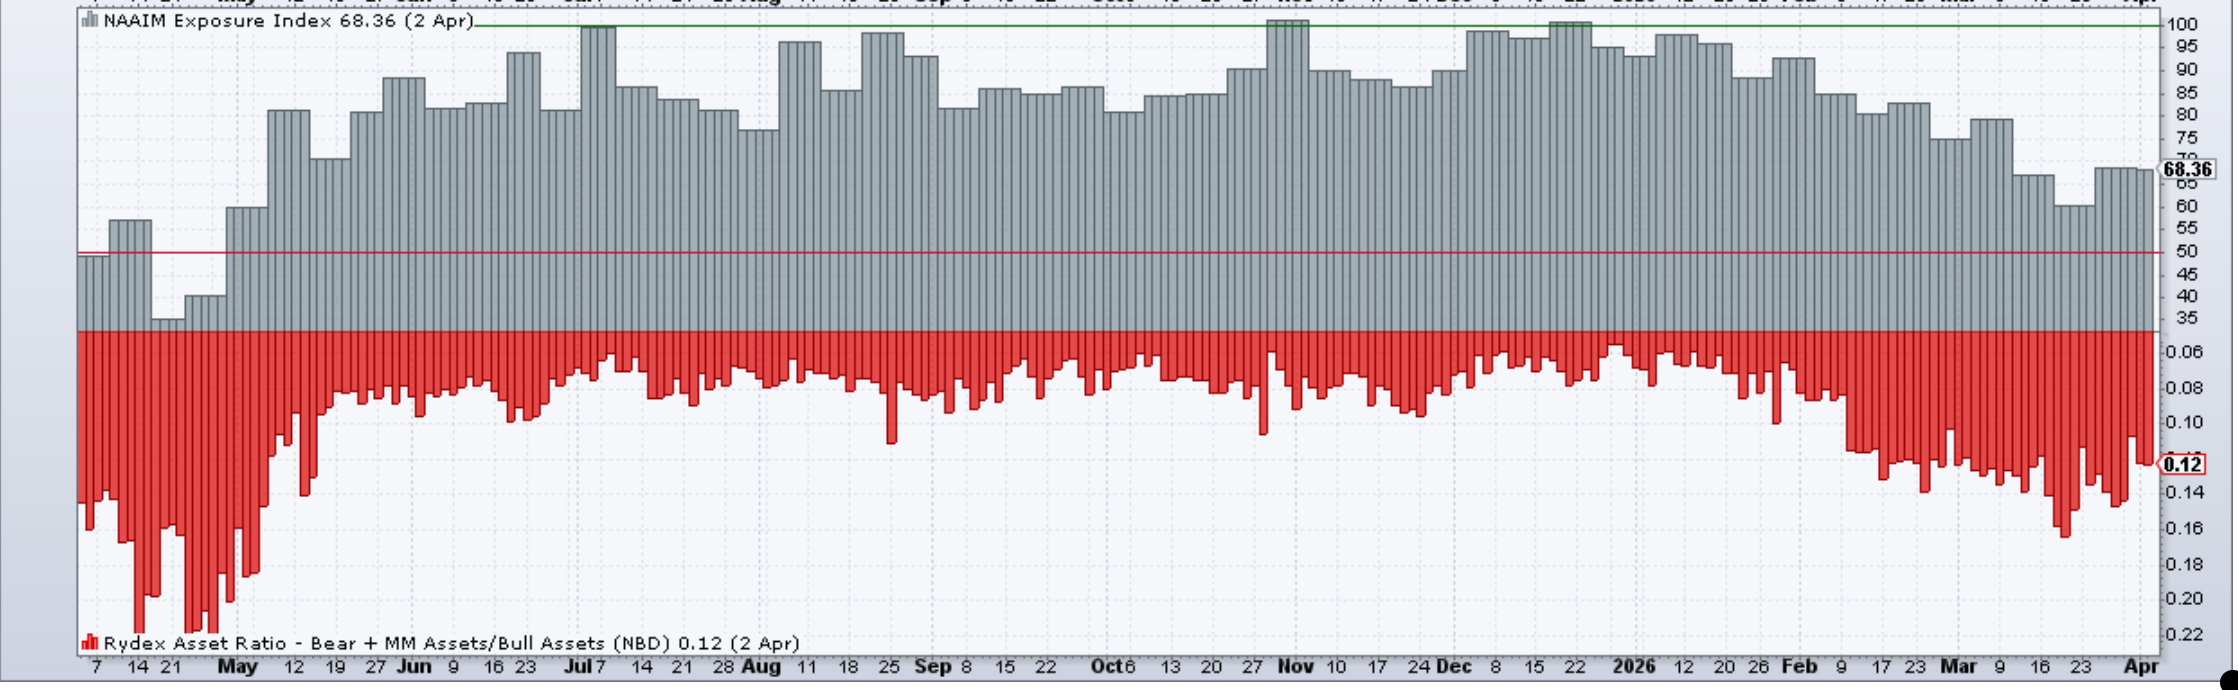
NAAIM Exposure Index is 68.36. Note it did get into the low 30’s in April 2025 (!)
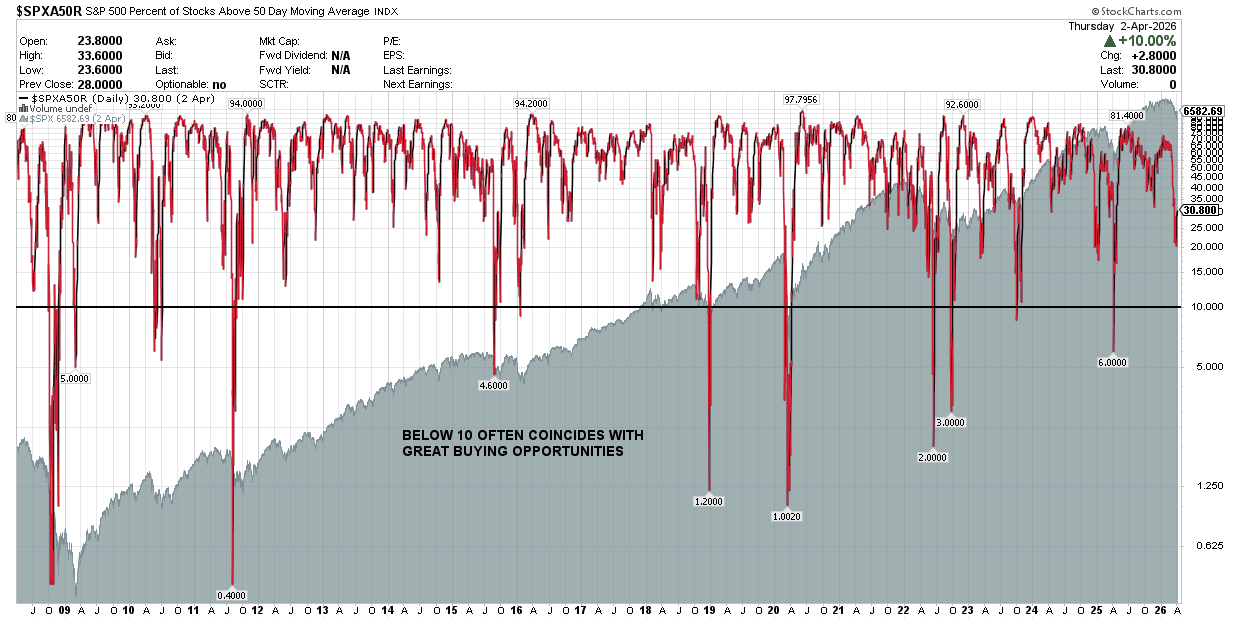
S&P 500 Percentage of Stocks Above the 50 Day Moving Average: 30.8% (<10 tend to be great buying opportunities)
Fear and Greed Index (CNN) currently reads 19 which is in the ‘Extreme Fear’ zone.
SixSigmaCapital Trading Account:
At the start of the year, I opened a dedicated trading account for active strategies. It was initially approximately 10% the size of my primary investment account. This account is managed with a trading mindset and consists mostly of common shares, though I have utilised select options strategies such as selling puts and buying ITM LEAPS as stock replacement strategies.
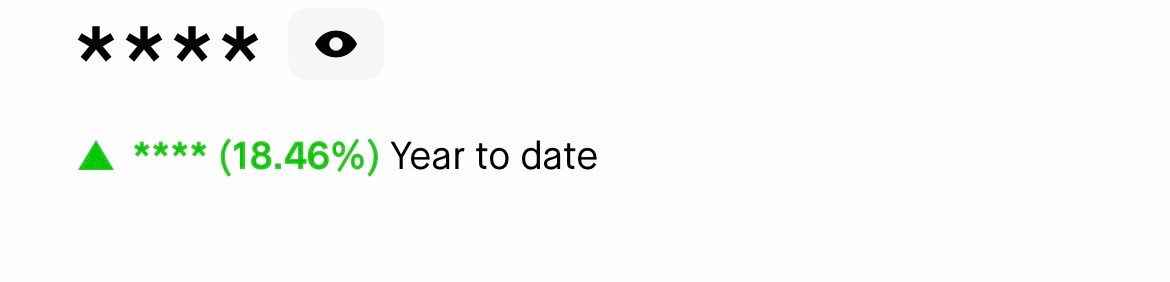
The past month was again characterised by several small losses and small wins on commons. There was some notable winners such as HIMS options trades for >100% gains but an oversized trade on an unfamiliar instrument dented the performance. I likely overtraded; however, the account still progressed, moving from +14% at the end of February to >18.4% at the end of March.
Trading Account YTD: +18.4%
Consolidated Performance across Investment Accounts: YTD and since Inception of SixSigmaCapital (Equities Only)
2023: +94%
2024: +61%
2025: +57%
2026: +3.35% (As of 14th April 2026)
TWR since Inception of SixSigmaCapital is thus $407% or a just over a 5x of the portfolio. The CAGR is 63.95.
TWR +407% vs S&P 90%
TWR of S&P 500 in the same period is +90% or a 1.9x return.
SixSigmaCapital has achieved a +317% outperformance in that time period.
I remain pleased overall, as these returns were achieved without margin, options, or leverage which means risk adjusted these results are very sound. Furthermore, all moves were disclosed in real time.
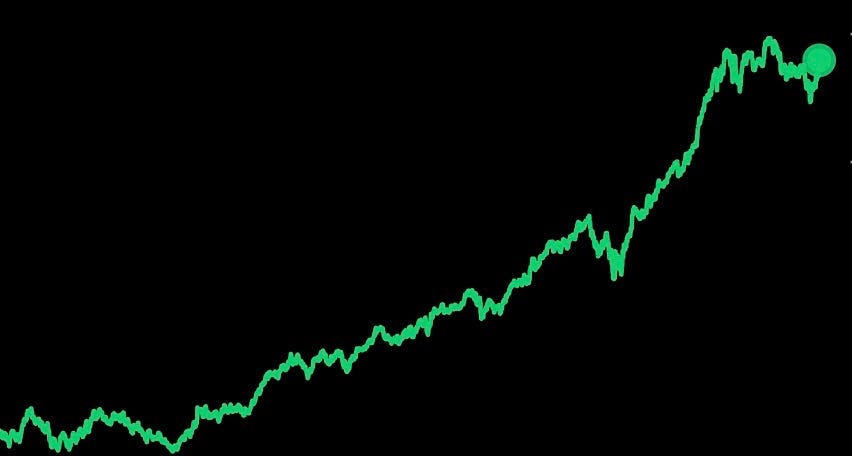
Equity curve since switching to my current brokerage in the last few years is below:
As noted, the year to date performance for the trading account is +18.4%.
However, I plan to continue reporting these accounts separately to maintain a clear distinction between my active trading and long term investment strategies.
Featured Quote:
“In investing, what is comfortable is rarely profitable” Robert Arnott
It has gotten me thinking: What’s more comfortable right now, being long or being short? Being invested or being in cash? It is not totally obvious.
Current Positions in Size Order with Cost Basis:
