
Monthly Portfolio Update: +372% TWR Since 2023 (+285% Outperformance vs. S&P 500)
Market Thoughts | +372% Performance Since Inception | 2026 Position Plans & Outlook.

I hope you are well. Below, we provide market commentary and an in-depth portfolio update.
Format for what is covered in this Monthly Portfolio Update:
Market Thoughts
Indices Review
Key Indicators
SixSigmaCapital Performance: YTD and since Inception
Featured Quote
Current Positions in size order
Closing Thoughts
If it is your first time here, ensure to check out what SixSigmaCapital readers are saying below:

For all readers a reminder that a premium subscription includes:
Live Portfolio updates (All Buys and Sells) in Subscriber only Channels
Favourite set-up Ideas, Market Memos plus Full archive
Discord access for AMAs and live trading account updates.
Monthly in depth portfolio & performance updates
Upgrade to a premium subscription via the link below:
Market thoughts:
Equity markets had another volatile month, with the Dow, S&P 500, and Nasdaq Composite posting month-over-month returns of -0.06%, -1.58%, and -5.17%, respectively.
Not to sound like a broken record, but my perspective remains that there is plenty to be concerned about regarding the US economy and equity markets over the medium term. Despite the geopolitical and macroeconomic uncertainty, especially over the last year, markets have demonstrated remarkable resilience and continued to climb the "wall of worry."
Market conditions shifted significantly following the 10/10 liquidation event. In November, we witnessed sharp sell-offs as more than 60% of equities fell into bear market territory. While the AI and cryptocurrency sectors bore the brunt of this volatility, select mega-caps, Healthcare, and Utilities acted as defensive havens. This rotation defined much of December. To start the new year, the prevailing leadership has transitioned toward Emerging Markets, Memory, Defense, Precious Metals, Consumer Staples, and Energy.
The frenzied price action in precious metals had become especially alarming but since Friday the 30th, when Silver crashed 37% peak to trough in less than 24 hours, the action has been more tempered. An estimated $7.4 trillion of wealth in gold and silver was wiped out on that one day.
Tariffs:
Regarding the tariff landscape, on February 20, the Supreme Court ruled that the president overstepped his authority by utilizing the International Emergency Economic Powers Act (IEEPA) to impose sweeping global tariffs in 2025. The court determined that Congress holds the exclusive power to create new taxes. In response to the ruling, the administration immediately invoked Section 122 of the Trade Act of 1974 to implement a new 10% global tariff, which was subsequently increased to a 15% target rate. These new duties became effective on February 24, 2026, starting at the 10% rate while the administration finalised the transition to 15%.
As it stands, the status of major trade deals with the EU and Japan has become highly uncertain.
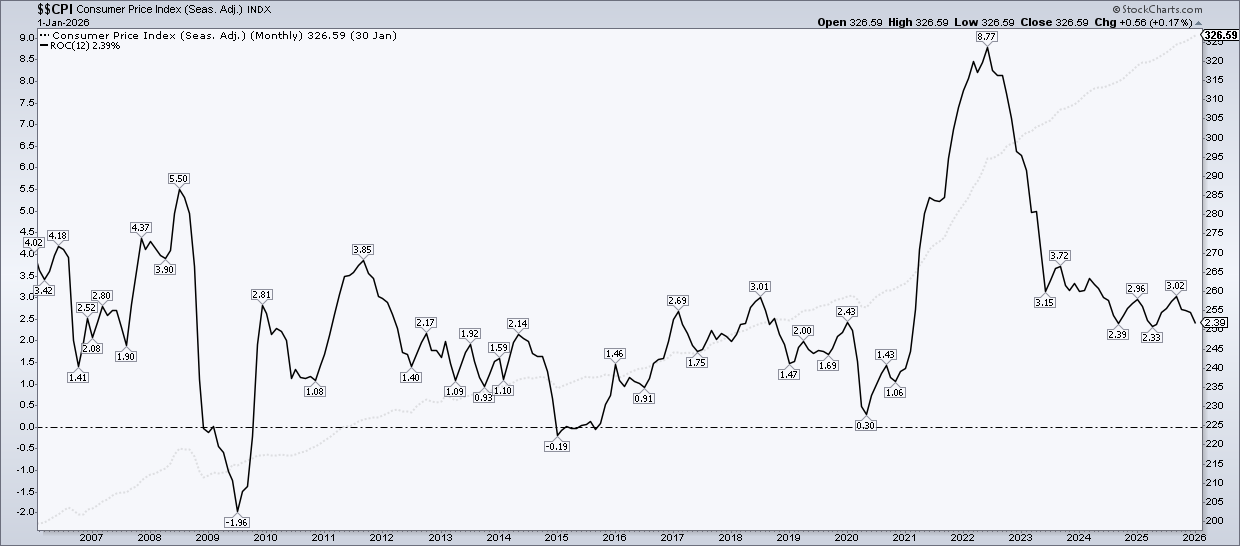
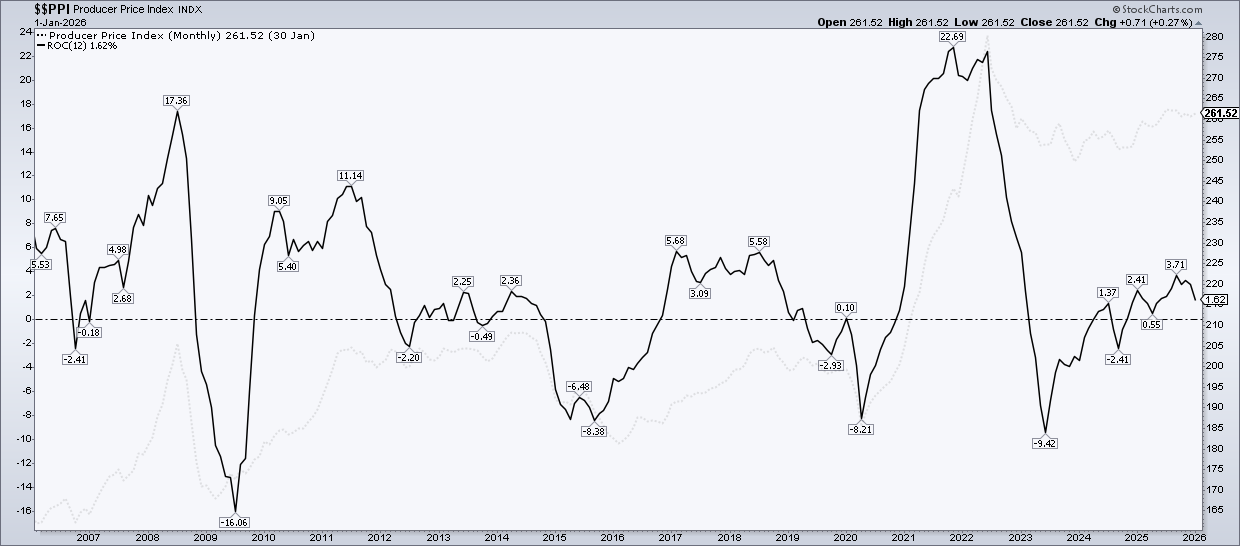
Inflation:
CPI: The January 2025 CPI data (released Feb 13, 2025) came in cooler than expected.
Headline CPI increased 2.4% YOY vs expectations of 2.5% YOY.
Headline CPI increased 0.2% MOM vs expectation of 0.3% MOM.
Core CPI increased 2.5% YOY vs expectations of 2.5% YOY
Core CPI increased 0.3% MOM vs expectations of 0.3% MOM
The biggest downward contributor was a 7.5% annual drop in gasoline prices; meanwhile, housing remains the most stubborn component, with shelter costs rising 0.2% M/M and 3% annually.
PPI: The January 2025 PPI data (released Feb 27, 2025) came in hotter than expected.
Headline PPI increased 2.9% YOY vs expectations of 2.6% YOY.
Headline PPI increased 0.5% MOM vs expectation of 0.3% MOM.
Core PPI increased 3.6% YOY vs expectations of 3.0% YOY
The PPI surge was led by services, which jumped 0.8%. Specifically, margins for professional and commercial equipment wholesaling rose 14.4%, a move analysts link to higher import costs and ongoing tariff adjustments.
Below I have included charts showing the trend for both CPI and PPI:
PCE: With regards to the PCE price (Fed’s preferred metric), December ‘25 data came in hotter than expected.
Headline PCE increased 2.9% YOY vs expectations of 2.8% YOY.
Headline PCE increased 0.4% MOM vs expectation of 0.3% MOM.
Core PCE increased 3.0% YOY vs expectations of 2.9% YOY
Core PCE increased 0.4% MOM vs expectations of 0.3% MOM
Core PCE has proven notably sticky throughout the last year, remaining range-bound between 2.7% and 3.0%.
FOMC Meeting:
At the most recent FOMC meeting on January 27–28, 2026, the FOMC decided to hold interest rates steady, marking a pause after three consecutive 25-basis-point cuts in late 2025. The target range for the federal funds rate remains at 3.5% to 3.75%.
The FOMC’s latest economic assessment (as of the January 28th) describes an economy expanding at a solid pace, though it faces a nuanced labor market and persistent inflationary pressures. While job gains have remained low, there are signs that the unemployment rate is beginning to stabilise. Despite this progress, inflation continues to hover above the 2% longer-run target, contributing to an economic outlook defined by elevated uncertainty. Consequently, the Committee remains highly attentive to risks on both sides of its dual mandate - balancing the pursuit of maximum employment with price stability.
In the post-meeting press conference, Jerome Powell described the economy on a “firm footing”, noted that current policy is not significantly restrictive and emphasised data-dependent, meeting-by-meeting decisions. He highlighted solid growth, stabilising labor markets, and no urgency for immediate further cuts. Given recent economic data suggesting a stag-flationary picture, I do not expect any rate cuts soon.
Indices:
S&P 500:
Currently trades at 6,878.88 (0.30% YTD)
It is 0.3% below the 50SMA. RSI is 48.38
Trading at 24.75x trailing earnings and 21.92x forward earnings (per WSJ)
Nasdaq Composite:
Currently trades at 22,668.21 (-2.44% YTD)
It is 2.45% below the 50SMA. RSI is 43.65
Trading at 31.87x trailing earnings and 25.47x forward (per WSJ)
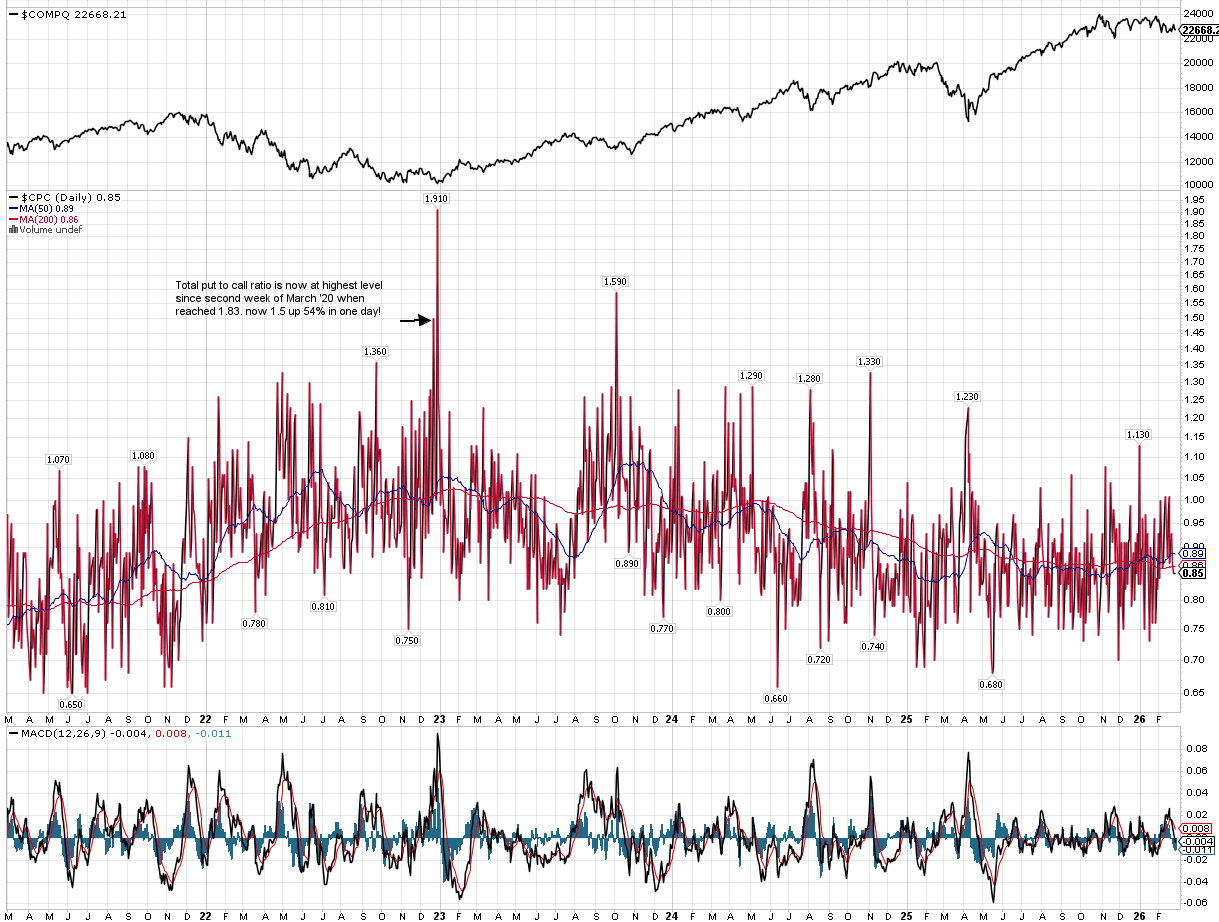
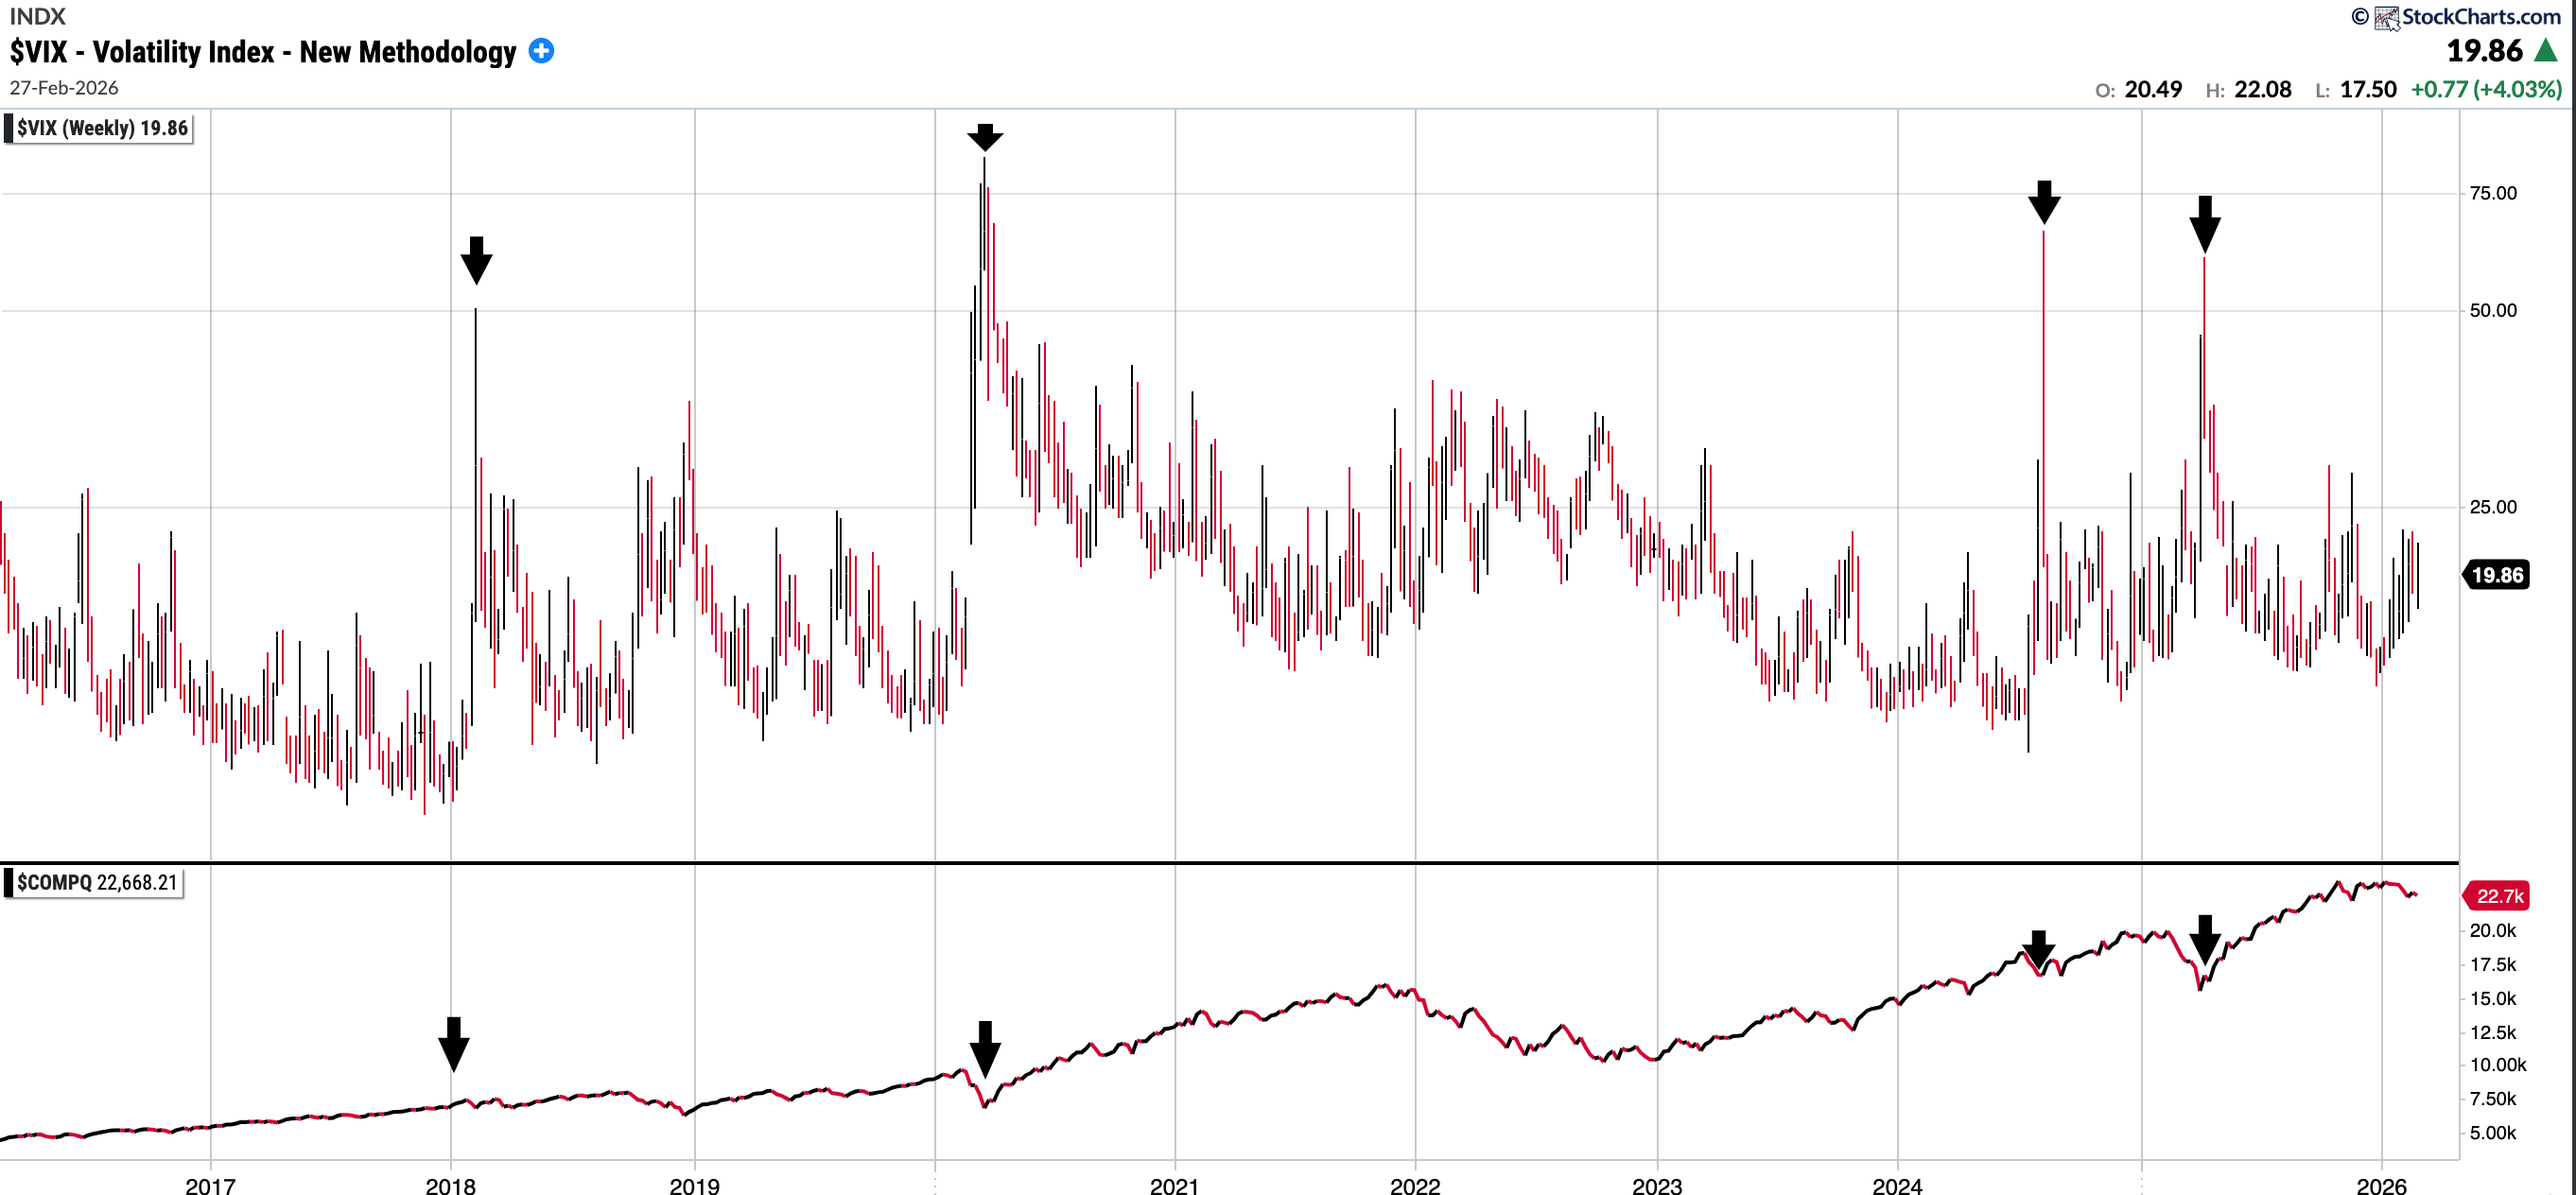
Key Indicators:
10 Year T-Note: 3.962. It has decreased by 7.54% over the last year.
CPC (Put to Call Ratio) is 0.85. Note >1 can indicate Fear and >1.5 can be Extreme.
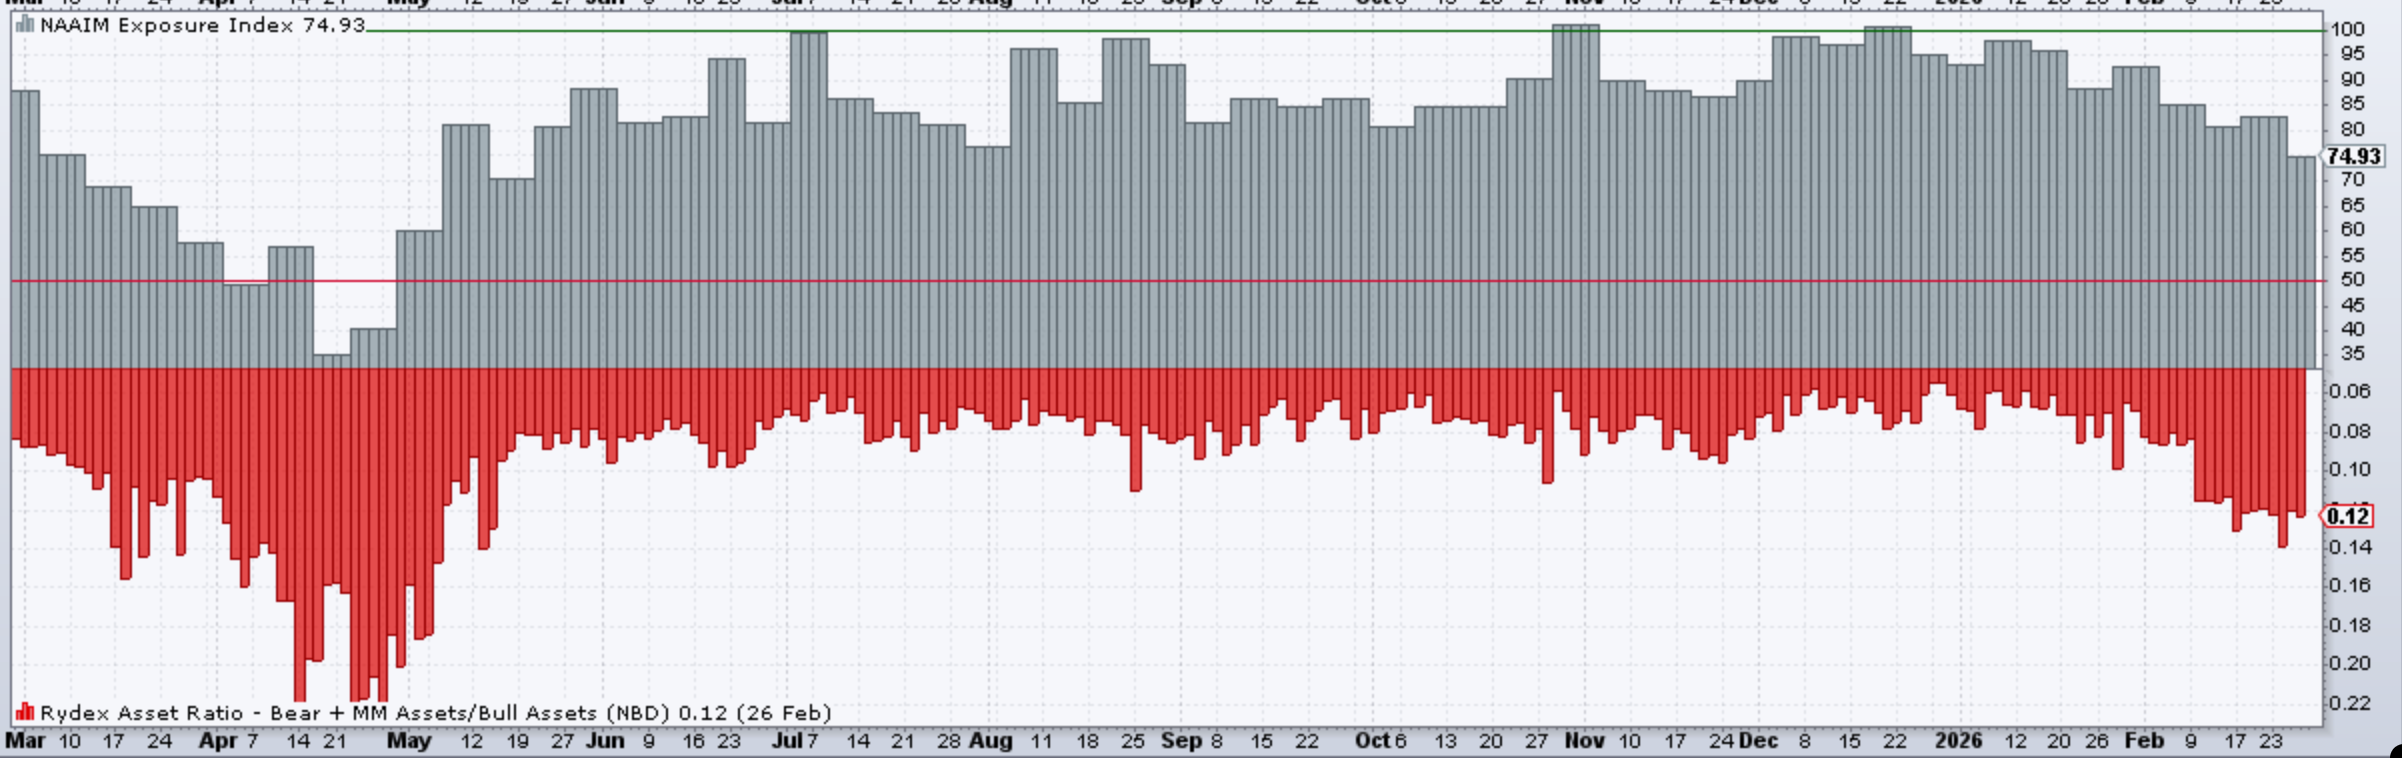
VIX: 19.86. Has remained around the 20 mark thus far YTD. I have included a chart below showing the VIX over time and Nasdaq Comp underneath it: you can see extreme readings always have been a buying opportunity in the medium term.
British Pound vs USD: 1.348 and up 0.22% YTD.
Fear and Greed Index (CNN) currently reads 43 which is in the ‘Fear’ zone.
NAAIM Exposure Index is 74.93. Has not been this low since May last year. Note it did get into the low 30’s in April 2025 (!)
SixSigmaCapital Trading Account:
At the start of the year, I opened a dedicated trading account for active strategies. It was initially approximately 10% the size of my primary investment account. This account is managed with a trading mindset and consists mostly of common shares, though I have utilised select options strategies such as selling puts and buying ITM LEAPS as stock replacement strategies.
The past month was characterised by several small losses and wins. However, during the swift pullback earlier in the month, I took some losses on cash-secured puts that reduced my account value by 3 to 4 percent. In hindsight, I was too aggressive with that strategy. While the year-to-date return had been holding between 18 and 23 percent over the last two weeks, an oversized options trade has since brought the YTD performance back to its current level.
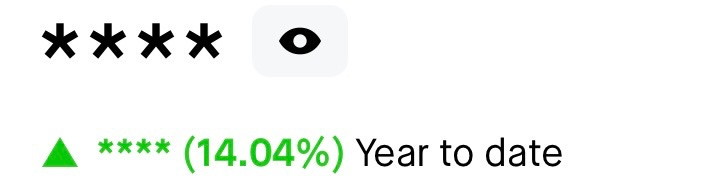
My YTD performance is: +14.04% YTD
Consolidated Performance across Investment Accounts: YTD and since Inception of SixSigmaCapital (Equities Only)
2023: +94%
2024: +61%
2025: +57%
2026: -3.68%
TWR since Inception of SixSigmaCapital is thus +372.33% or a just over a 4.7x of the portfolio. The CAGR is 63.47%
TWR of S&P 500 in the same period is +87.32% or a 1.87x return.
SixSigmaCapital has achieved a +285% outperformance in that time period.
I remain pleased overall, as these returns were achieved without margin, options, or leverage which means risk adjusted these results are very sound. Furthermore, all moves were disclosed in real time to premium members.
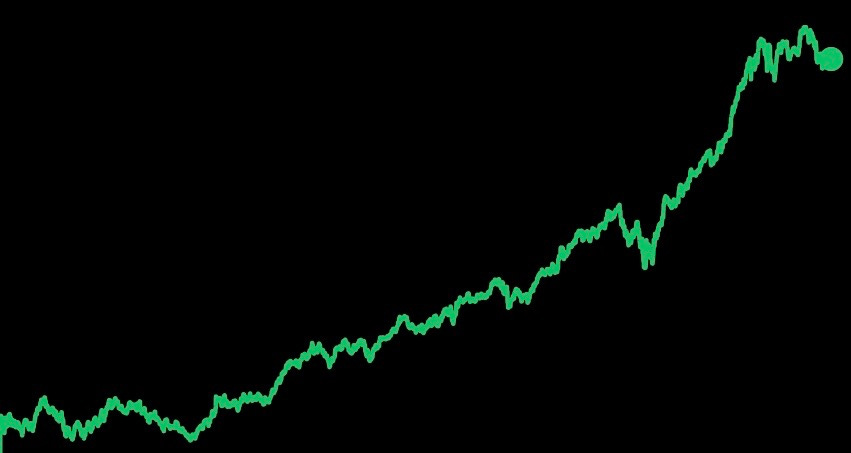
Equity curve since switching to my current brokerage in the last few years is below:
As noted, the year to date performance for the trading account is +14.04%. This results in a blended total portfolio return of -2.27% YTD.
However, I plan to continue reporting these accounts separately to maintain a clear distinction between my active trading and long term investment strategies.
Featured Quote:
“In investing, what is comfortable is rarely profitable” Robert Arnott
Current Positions in Size Order with Cost Basis:
Cash: 12.56% (Pounds Sterling)
