
Monthly Portfolio Update
Plus Market Thoughts

Market thoughts:
Equity markets have had a volatile month, with the Dow, S&P 500, and Nasdaq Composite posting -0.54%, -0.92%, and -2.61% performances, respectively, over the trailing one-month period.
As previously, my perspective remains that there is enough to be concerned about with regards to the US economy and Equity Markets over the medium term. However, despite the geopolitical and macroeconomic uncertainty, markets had continued to exhibit remarkable resilience and we continued to climb the wall of worry. That is until this last month.
We saw a sharp sell-off in the average stock, with more than 60% of equities falling into bear market territory at one point. Of course, this was not reflected in the indices, as mega-caps held up well and sectors such as Healthcare also caught a bid.
Cracks began to appear, particularly in the AI trade, where questions regarding circular financing resurfaced. CDS spreads for many AI companies, such as ORCL and CRWV, continued to widen significantly. Cryptocurrencies, often a harbinger of risk appetite, lost around 30% of their total market cap, with BTC correcting ~35% from its all-time high in a short period. In summary, much has changed over the last month regarding risk assets, even if the indices ended the period almost unchanged.
On tariffs, my belief is if they proceed as intended by the Administration this will hurt the average American and SMB. However, there has been progress with the announced Trade deal with Japan and the EU. A deal with China remains outstanding.
Notably, just in the last month Trump and Xi had their first in person meeting since 2019 to hold bilateral talks. Trump emphasised “progress on almost everything” and Xi emphasised mutual respect. The meeting resulted in a one-year framework agreement and progress on several fronts: tariffs, fentanyl, rare earth minerals and the overall stabilisation of economic ties.
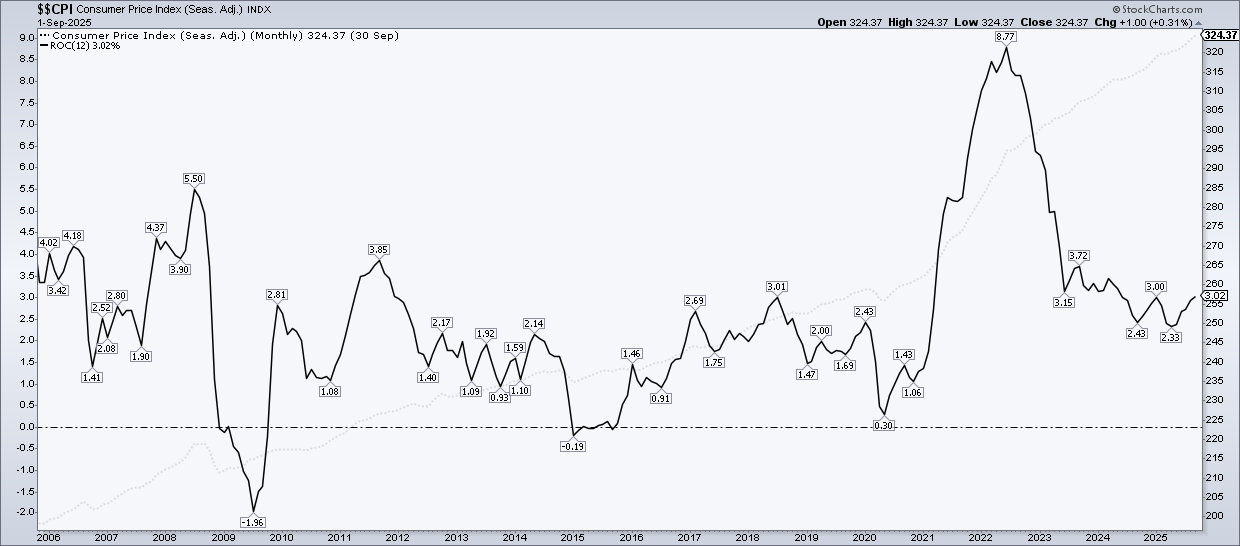
The latest CPI reading we had was on October 24, covering September 2025. Notably, the report itself was delayed due to the government shutdown and data collection for October had been halted. We have now been informed that we will likely never get the reading for October. It is logical to assume the lack of release of important data plus the lengthy government shut down weighed on the equity markets.
Back to the report for September:
Headline CPI rose 0.3% MOM and 3% YOY, expectations were 0.4% MOM and 3.1% YOY.
Core CPI increased 0.2% MOM and 3.0% YOY, again below expectations.
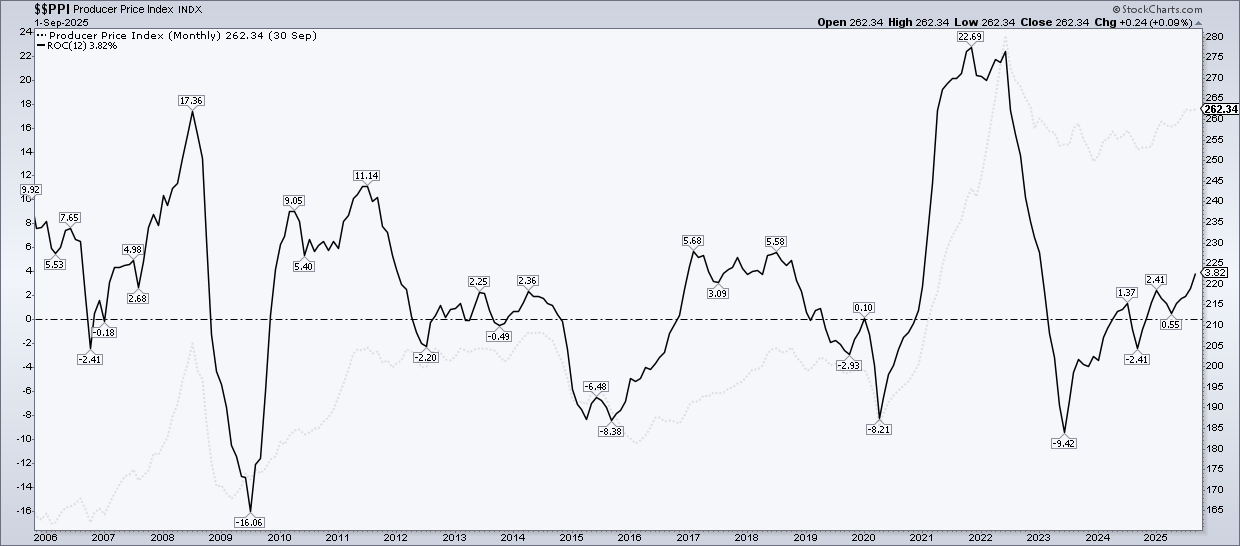
There are persistent pressures from energy, food and tariffs. Below I have included charts showing the trend for both CPI and PPI.
The FOMC concluded its October 28–29 meeting by cutting the federal funds rate by 25 basis points to a target range of 3.75%–4.00%, marking the second consecutive 25 basis points cut.
On inflation, Chairman Powell noted that prices have “moved up since earlier this year and remains somewhat elevated,” yet he reaffirmed the 2% target, which he described as “credible.” He stressed that a December rate cut is far from certain, despite internal differences of opinion, and added that the risk to employment remains weighted to the downside. In November, prediction markets started to favour no cut as the likely outcome for December although recently Governor Waller’s remarks have shifted rate cut as the more probable outcome.
With regards to PCE (Fed’s preferred metric), we were due to get a reading for September, on the 31st of October but it is now scheduled for release on December 5 due to the government shutdown delay. Note, Core PCE has been sticky this year often in the 2.7 to 2.9% range.
Last month, I stated that I had started to shift my portfolio slowly away from what’s been working to what I expect to work in some months from now. This had proven fruitful and I will continue to position this way. In hindsight I could have pivoted even quicker! More on that later in this update.
Format for the rest of the update is as follows:
Indices Review
Key Indicators
SixSigmaCapital Swing trades Recap
SixSigmaCapital Performance: YTD and since Inception
Featured Quote
Current Positions in size order
Watchlist and Favourite set-ups over next few months
Closing Thoughts
If it is your first time here ensure to check out what SixSigmaCapital readers are saying below:

For all readers a reminder that a premium subscription includes:
Favourite set-up Ideas, Market Memos plus Full archive
Live Portfolio updates (All Buys and Sells) in Subscriber only Channels
Monthly in depth portfolio & performance updates.
Private Discord Access (Engaged Community of >500 Investors)
If interested then consider upgrading to a premium subscription via the link below. There is currently a 10% annual discount, which saves 25% vs. monthly (forever) and is 42% cheaper than the Substack App price.
Indices:
S&P 500:
Currently trades at 6,849.09 (16.71% YTD)
It is 1.85% above the 50SMA. RSI is 58.90
Trading at 25.25x trailing earnings and 22.09x forward earnings (per WSJ)
Nasdaq Composite:
Currently trades at 23,365.69 (21.19% YTD)
It is 1.84% above the 50SMA. RSI is 56.50
Trading at 33.37x trailing earnings and 25.97x forward (per WSJ)
Key Indicators:
10 Year T-Note: 4.017%. Now -12.2% YTD. It has increased by 0.85% in the last month.
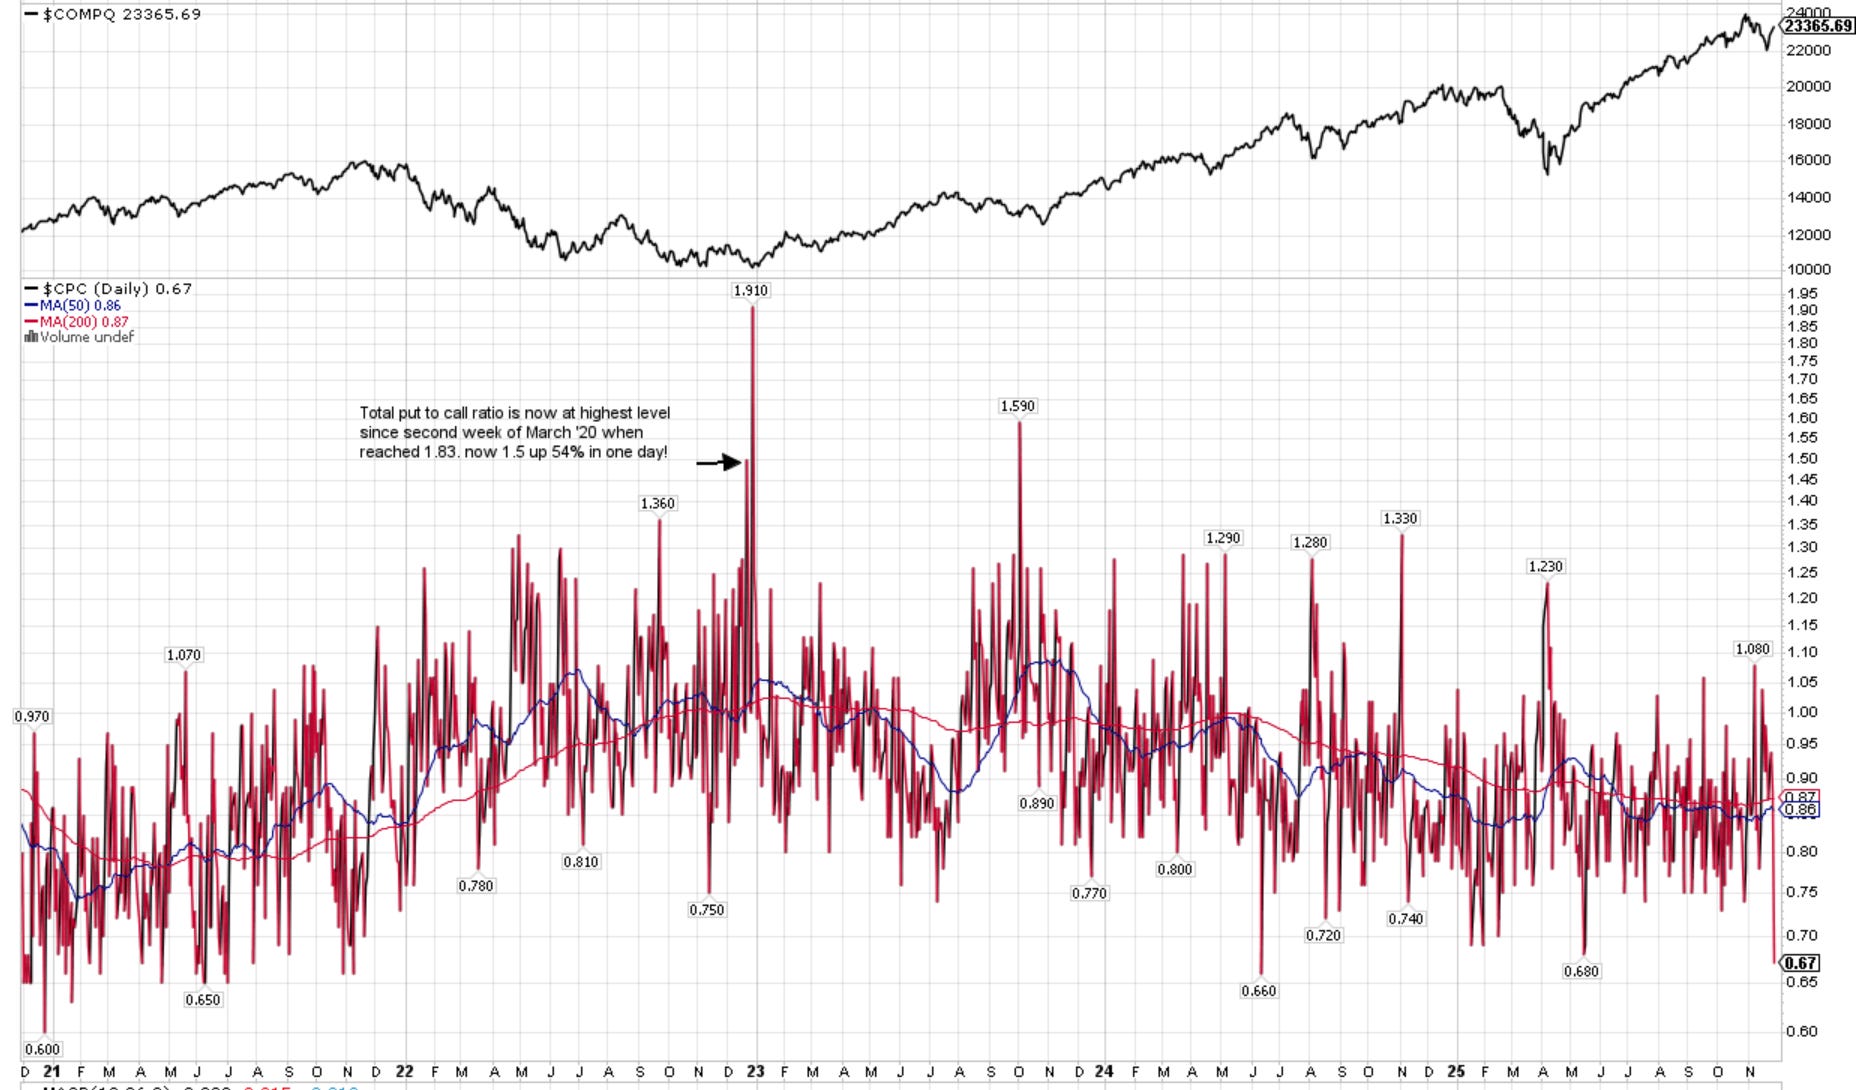
CPC (Put to Call Ratio) is subdued at 0.67. >1 can indicate Fear and >1.5 can be Extreme.
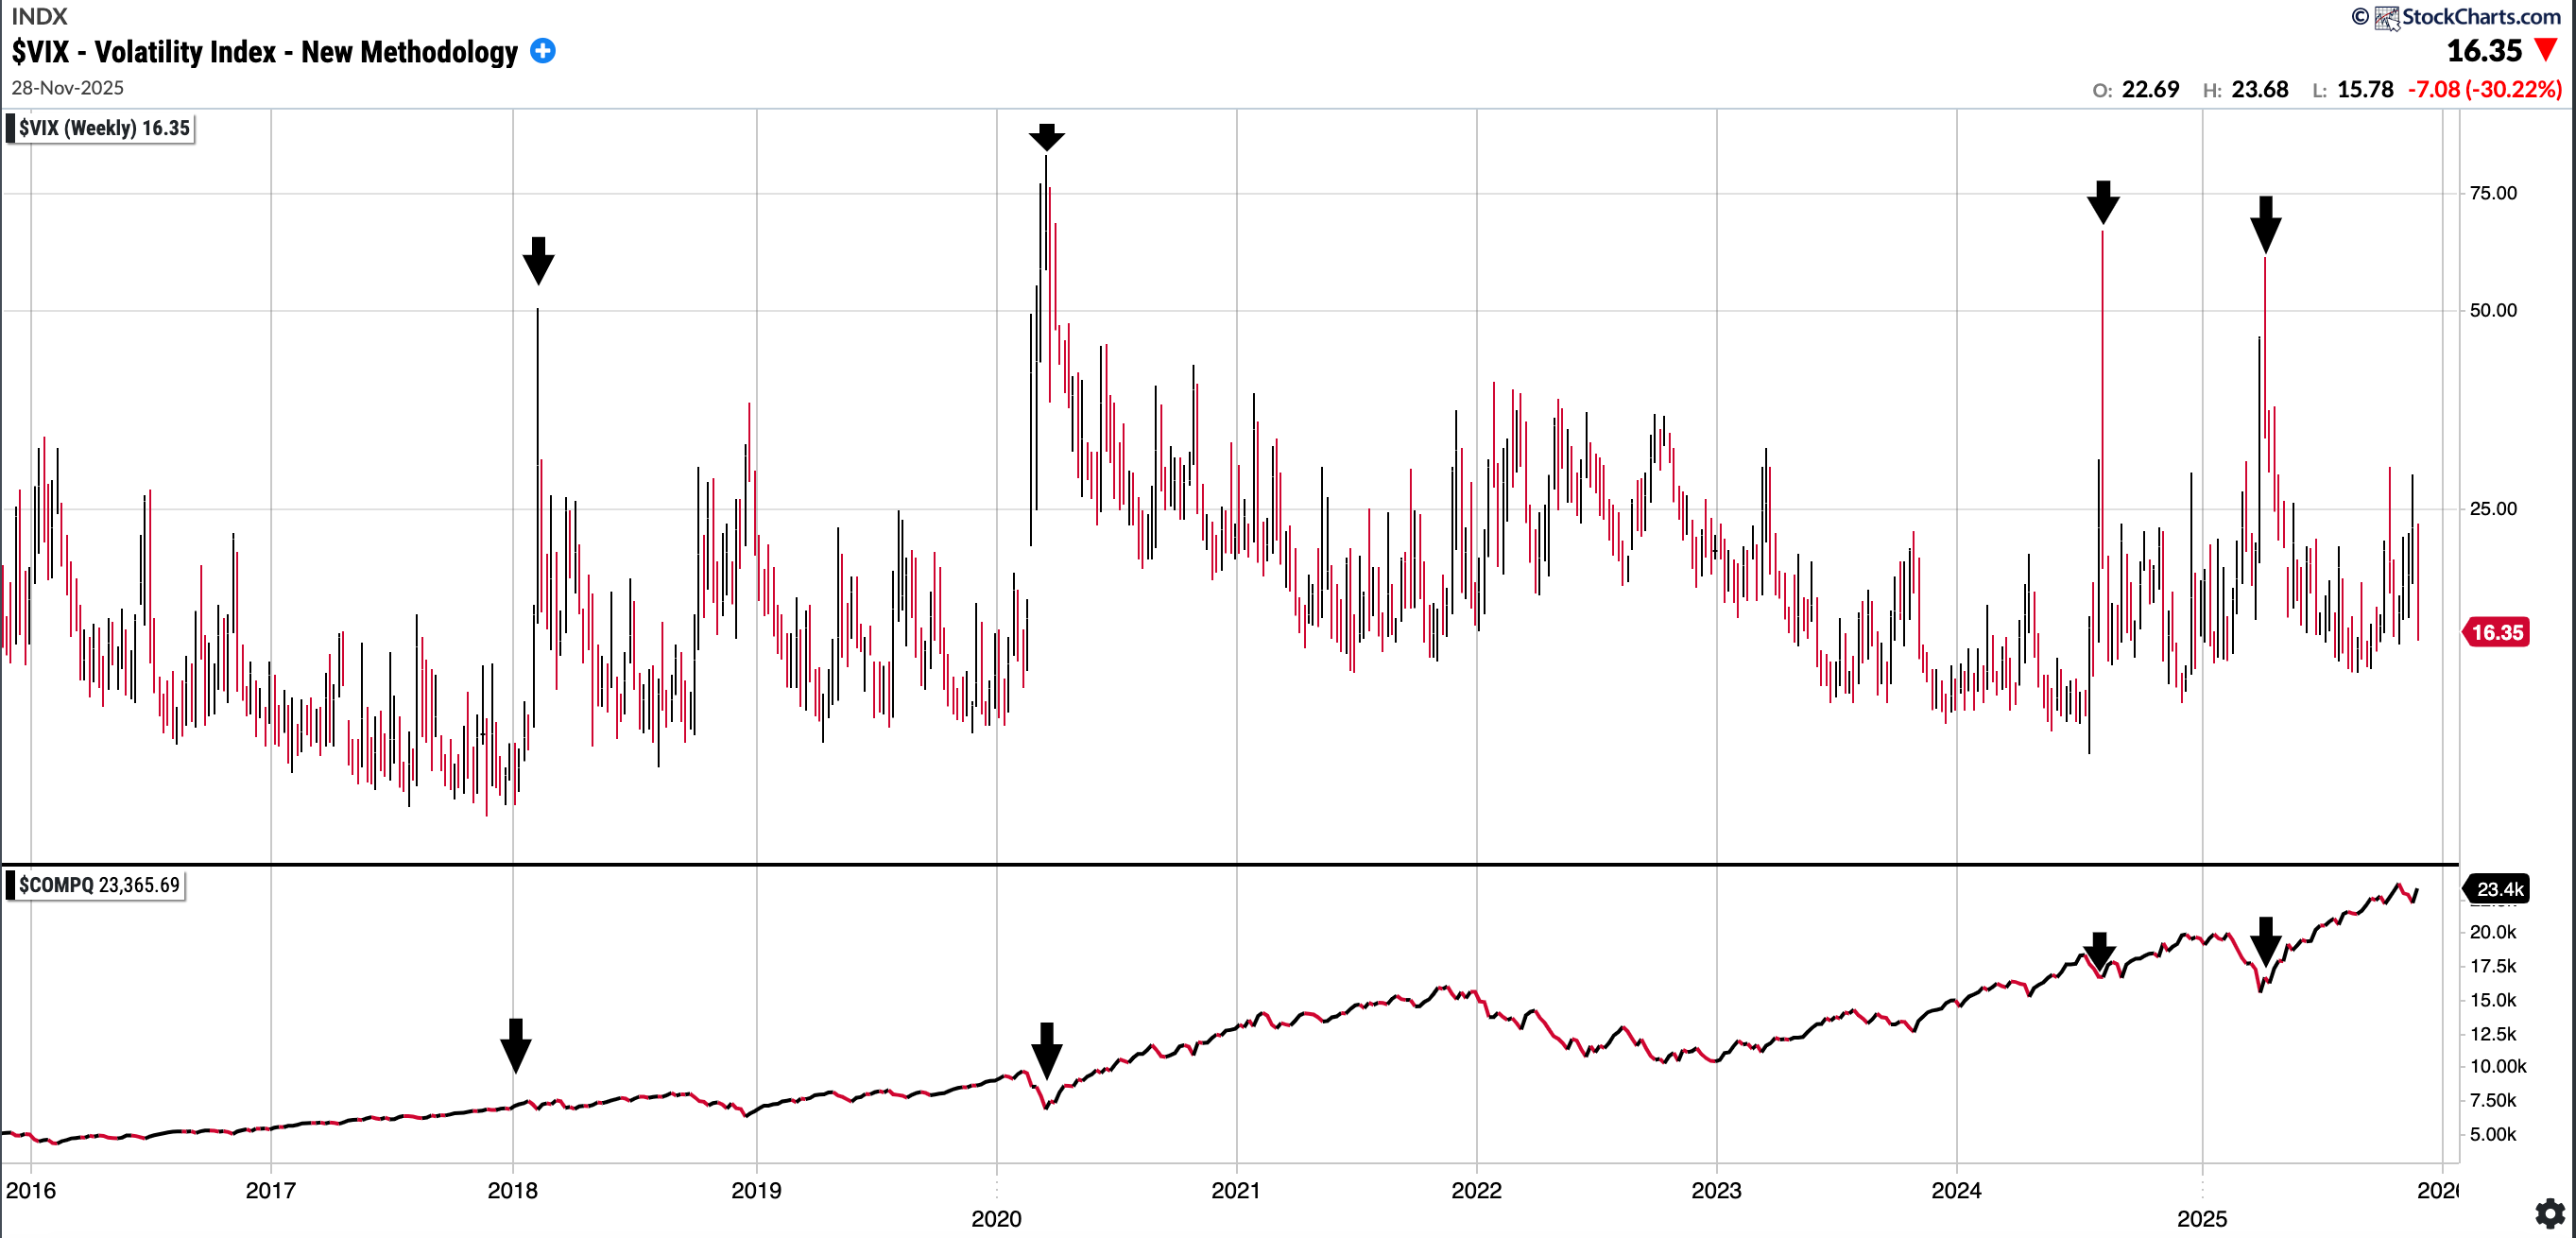
VIX: 16.35. That is in the lower range of where we have been in the last 6M. In November alone we spent the majority of it with a VIX >20 although it did decline 27.33% just this week. I have included a chart below showing the VIX over time and Nasdaq Comp underneath it: you can see extreme readings always have been a buying opportunity in medium term.
British Pound vs USD: 1.324 and up 7.03% YTD! $ has weakened significantly YTD
Fear and Greed Index currently reads 24 which supposedly is in the ‘Extreme Fear’ zone.
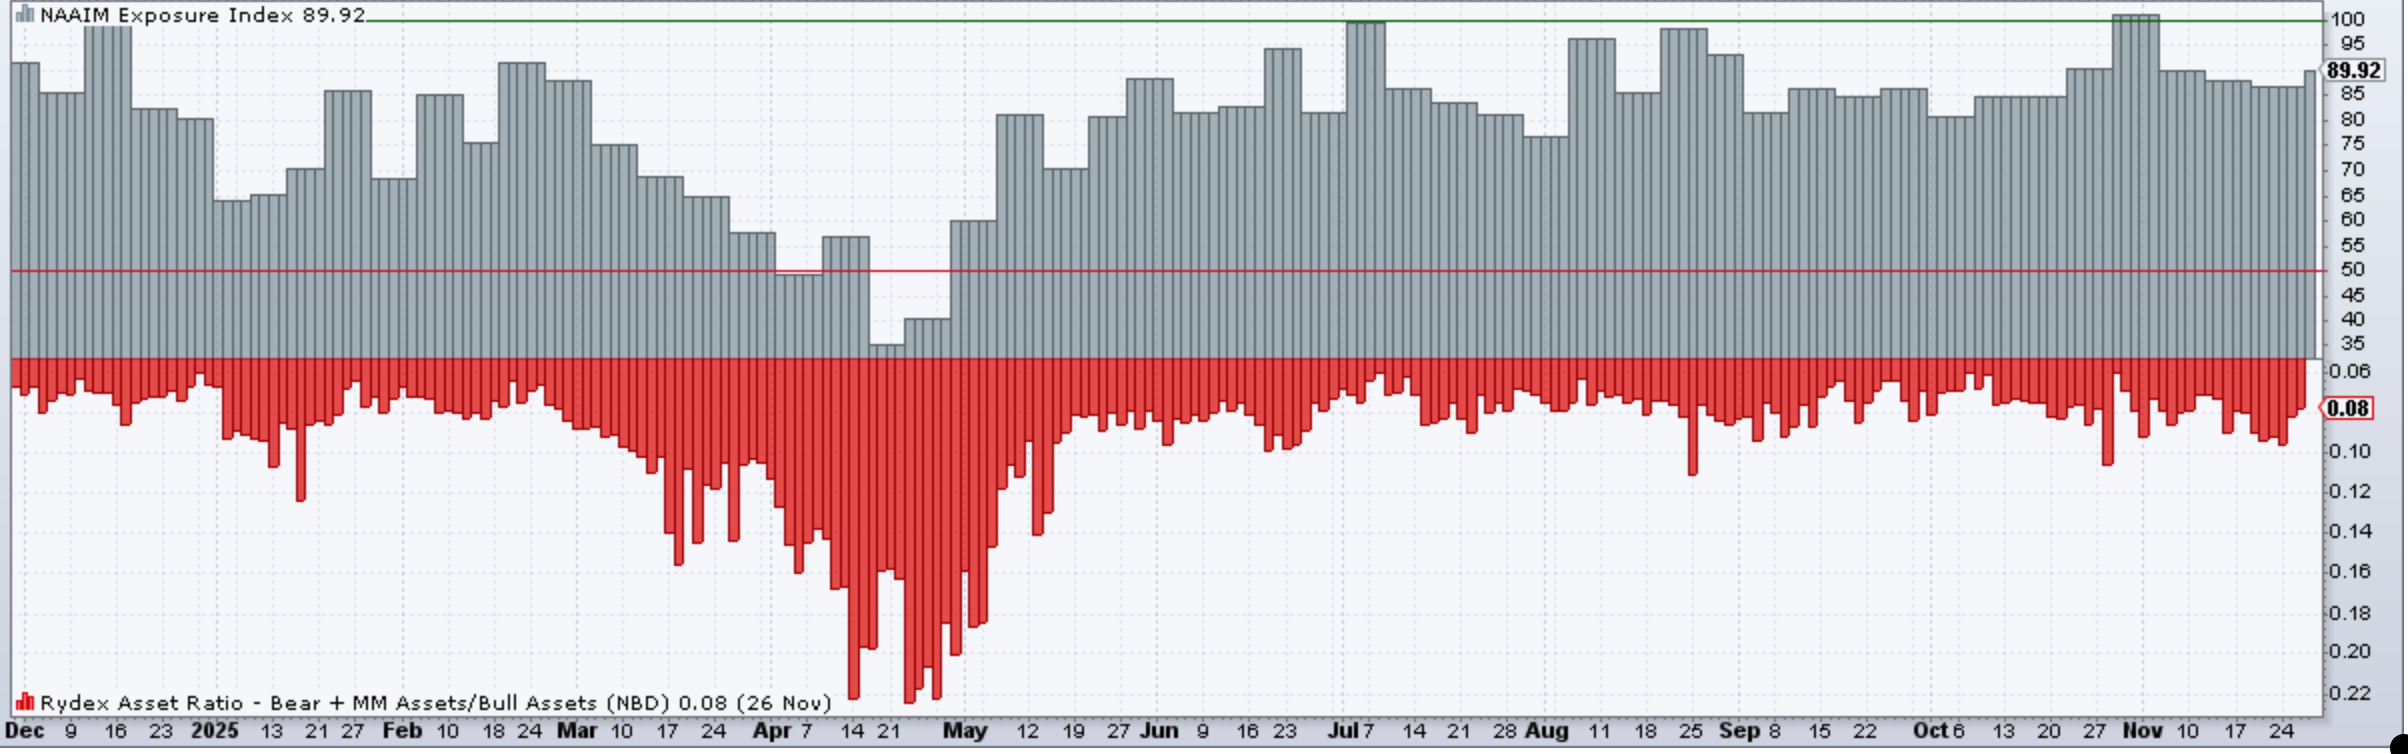
NAAIM Exposure Index is 89.92 still. This is higher than I expected. Note it did get into the low 30’s in April
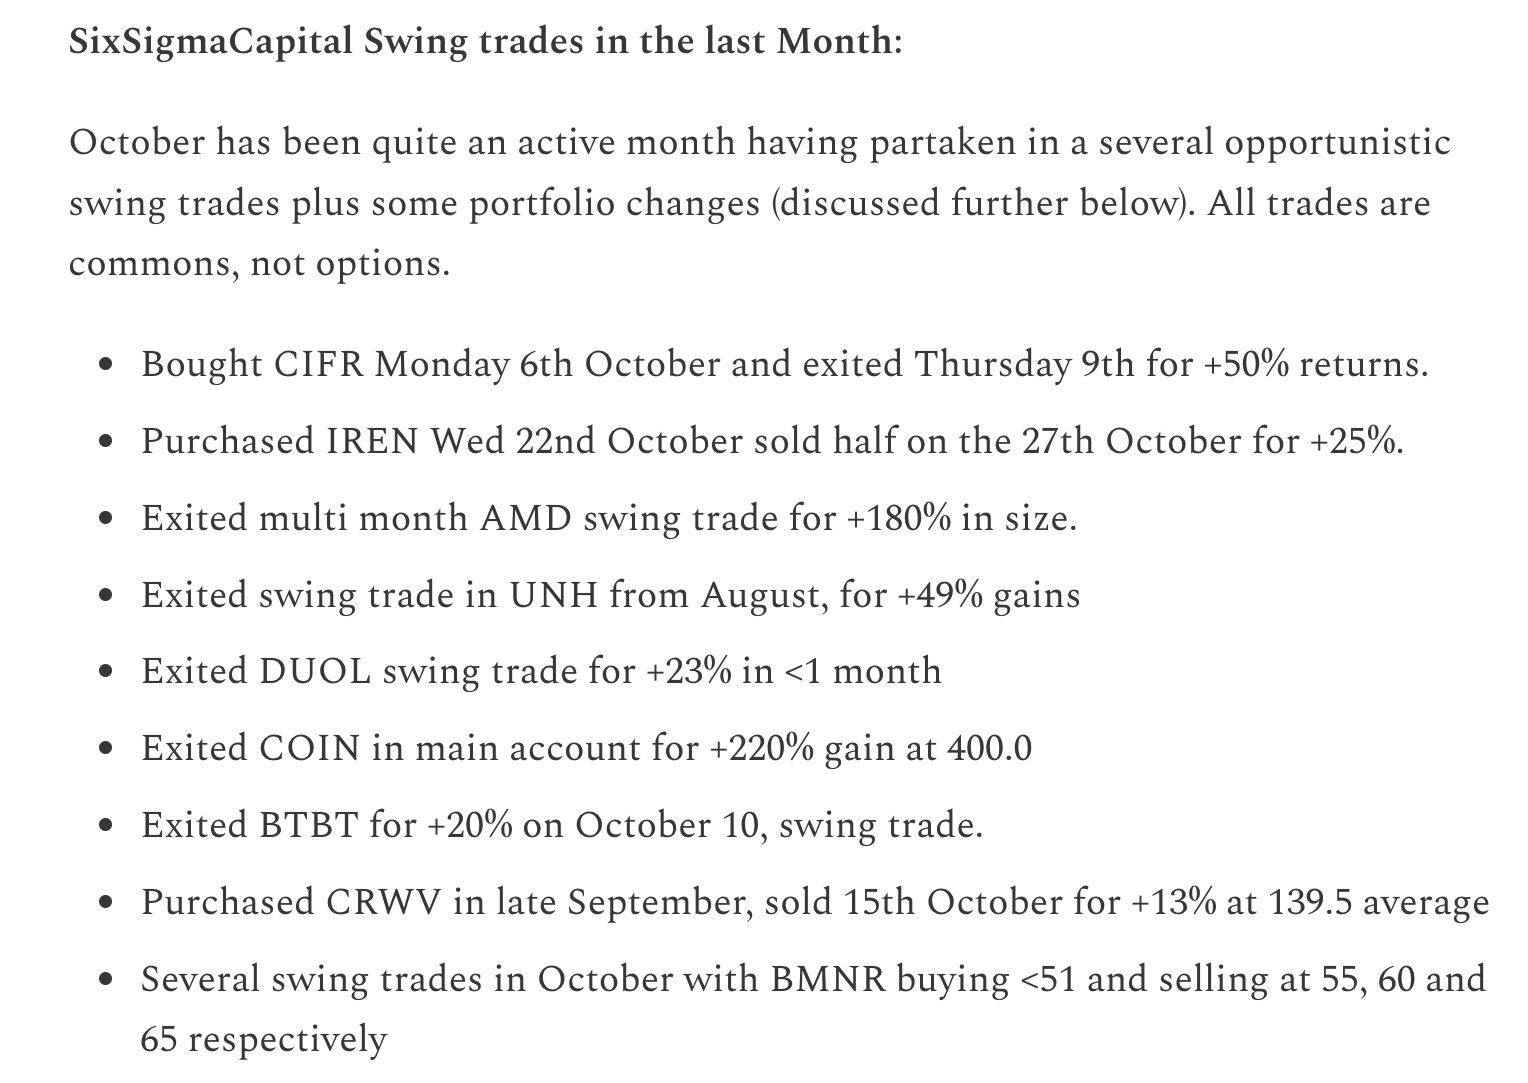
SixSigmaCapital Swing trades in the last Month:
November was a reasonably active month. I partook in opportunistic swing trades and ‘traded around a core,’ but the primary focus was cleaning up the portfolio and closing out positions, some of which were for tax loss harvesting. All trades are commons, not options.
Trade around a core: sold some $AMZN at 255 on the OAI pop, for +96% on cost basis.
Purchased IREN Wed 22nd October and exited 28th Nov for 17.8% total return.
Purchased CIFR early November, sold highest cost average CIFR shares to book 15% gains in 5th November. Further trim 28th Nov for +12% gains.
Exited NTLA for just under a 0.8% port hit. Thesis changing news prompted the exit.
Added to core HROW position 7th November at 33.5, sold at 40.7 for + 24% 7 days later.
Initiated BRKR October 9th, exited 12th November for +19% gain.
Exited PAGS swing trade for 15% returns on the 13th of November.
Reduced $GOOGL at $300 for +140% returns.
Exited my CRCL trade for a 1.75% port hit.
Purchased REGN on October 9 and Exited REGN for +39% on 24th of November.
For reference, swing trades in October are shown below also:
Consolidated Performance across Accounts: YTD and since Inception of SixSigmaCapital (Equities Only)
2023: +94%
2024: +61%
2025: +57.81% YTD (As of Friday 28th of November Market close)
TWR since Inception of SixSigmaCapital is thus +392.9%. or a just under a 5x of the portfolio. The CAGR is ~72.9%.
TWR of S&P 500 in the same period is +85% or a 1.85x return.
SixSigmaCapital has achieved a +307.9% outperformance in that time period.
Whilst YTD performance declined by ~6% month-over-month, I remain pleased overall, as these returns were achieved without margin, options, or leverage. Furthermore, all moves were disclosed in real time.
Equity curve since switching to my current brokerage in the last few years is below:
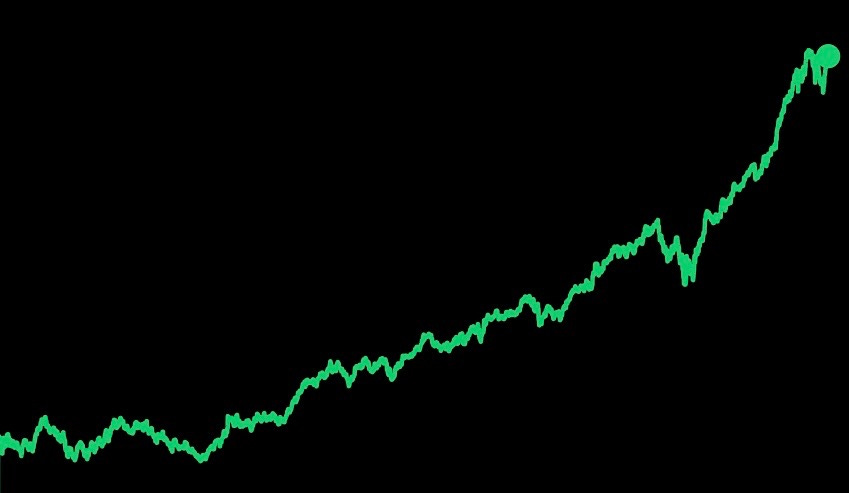
My main account, shown above, held up very well; however, my smaller peripheral accounts were the primary driver of the decline in Consolidated YTD performance from +64.6% to +57.81%.
Featured Quote:
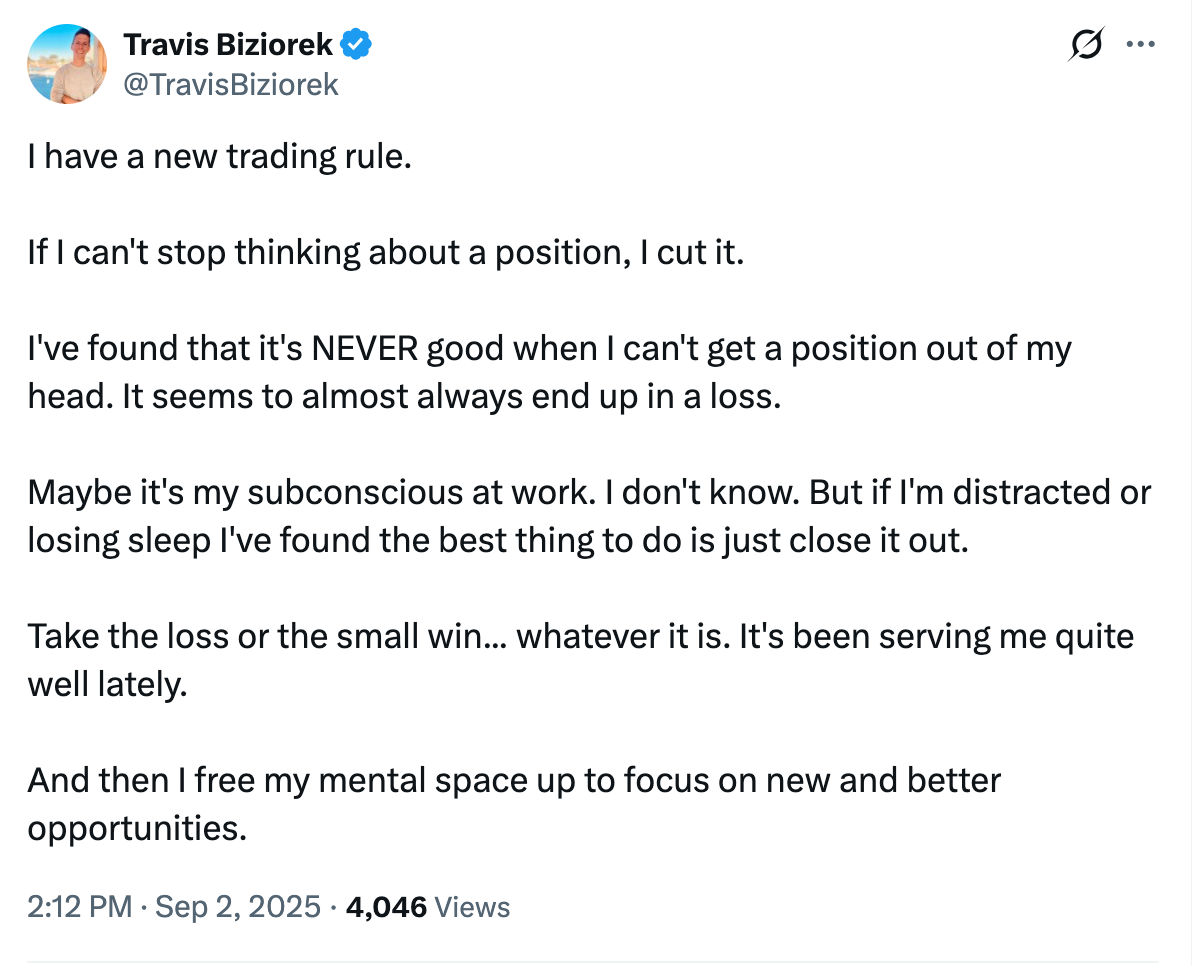
“If I can’t stop thinking about a position, I cut it” Travis Biziorek
Current Positions in Size Order with Cost Basis (at market close Friday 28 November):
