
Monthly Portfolio Update: +433.6% TWR Since 2023 (+336% Outperformance vs. S&P 500)
Market Thoughts | +336% Performance Since Inception | 2026 Position Plans & Outlook.

I hope you are well. Below, we provide market commentary and an in-depth portfolio update.
Format for what is covered in this Monthly Portfolio Update:
Market Thoughts
Indices Review
Key Indicators
SixSigmaCapital Performance: YTD and since Inception
Featured Quote
Current Positions in size order
Closing Thoughts
If it is your first time here, ensure to check out what SixSigmaCapital readers are saying below:

For all readers a reminder that a premium subscription includes:
Live Portfolio updates (All Buys and Sells) in Subscriber only Channels
Favourite set-up Ideas, Market Memos plus Full archive
Discord access for AMAs and live trading account updates.
Monthly in depth portfolio & performance updates
Upgrade to a premium subscription via the link below:
Market thoughts:
Equity markets had yet another volatile month, with the Dow, S&P 500, and Nasdaq Composite posting month-over-month returns of +7.1%, 10.4%, and 15.3%, respectively.
For the last several months, I have been saying the following in this letter:
My perspective remains that there is plenty to be concerned about regarding the US economy and equity markets over the medium term” and
“Historically, there tends to be a large drawdown in the S&P 500 within the 12 months preceding election day. I do not know whether it will be Fed-related, a policy shock by the White House, or an economic downturn that triggers the drawdown (or something else entirely), but I think it is very likely we will see one given the way markets are behaving”
In the last year, markets demonstrated remarkable resilience and continued to climb the wall of worry though the indices finally cracked in March. The S&P 500 pulled back more than 9% peak-to-trough, and the Nasdaq fell 13%. Although this may seem modest compared to other pullbacks, significant damage was done under the hood: at the end of March, over 42% of S&P 500 stocks were in a bear market, with more than 79% trading below their 50-day SMA. Consumer Discretionary, Information Technology, and Financials were among the worst performers in Q1, while Energy was the best performer.
However, in April we had a historic rebound, and since the March 30 lows, the S&P 500 is up >900 points (15%) and the Nasdaq Composite is up 4,500 points from the lows (more than 20%). Both of them closed the month at all-time highs. Beyond this, semiconductors and every layer of the supply chain are on a historic run; the SOXX ETF is up >50% (!) since the March lows, and semis as a group are now the most overbought in history. They are more overbought than they were during the dot-com bubble or COVID-19 mania.
Before we forget, we are still seeing a stagflationary picture with upticking inflation, tapering GDP, and a generally weakening jobs market (the most recent NFP report notwithstanding). Notably, large companies are conducting layoffs en masse.
The war in the Middle East and its aftermath are likely to serve as further headwinds in the coming months. If we look at oil specifically, I backtested what happens to equity markets when crude remains consistently above $100; I found that stocks can remain robust for around 20 days, but after that, they tend to suffer. This is something to pay attention to as we head into the summer, with crude currently at $105.
While we saw a correction in March, it remains to be seen if that was the major midterm election-year pullback or if one will occur later in the year. Notably, S&P 500 earnings estimates continue to be revised upward, and the majority of companies are beating expectations and raising guidance. This fundamental strength would argue against a large index-level pullback. If there is a pullback, I will certainly be a buyer of select equities.
Tariffs:
Regarding the tariff landscape, on February 20, the Supreme Court ruled that the president overstepped his authority by utilising the International Emergency Economic Powers Act (IEEPA) to impose sweeping global tariffs in 2025. The court determined that Congress holds the exclusive power to create new taxes. In response to the ruling, the administration immediately invoked Section 122 of the Trade Act of 1974 to implement a new 10% global tariff, which was subsequently increased to a 15% target rate. These new duties became effective on February 24, 2026, starting at the 10% rate while the administration finalised the transition to 15%.
As it stands, the status of major trade deals with the EU and Japan remain uncertain.
Inflation:
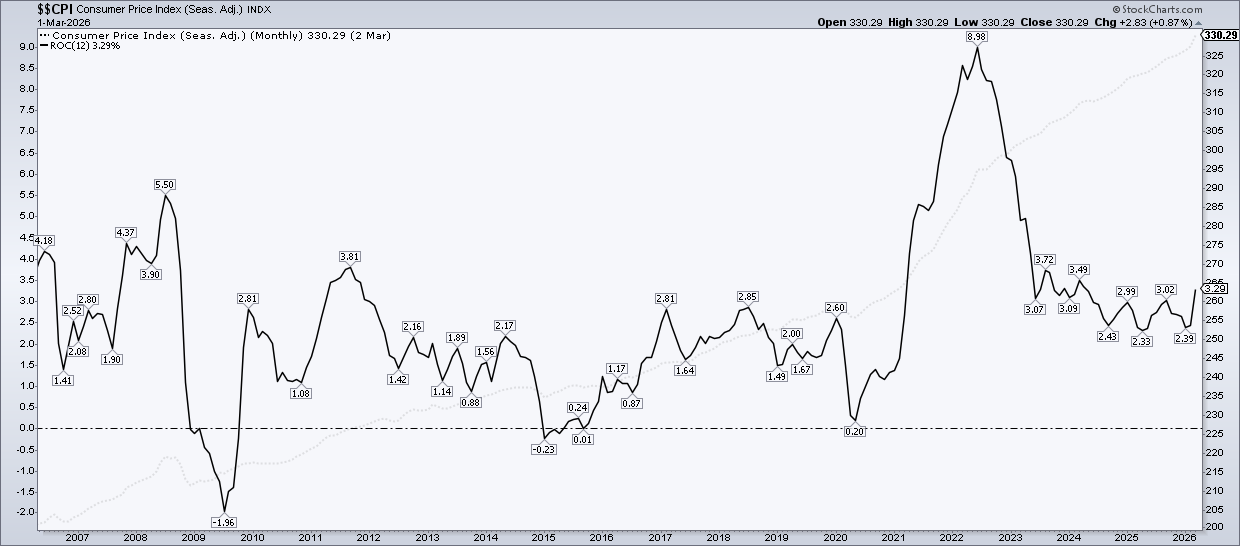
CPI: The March 2026 CPI data is presented below
Headline CPI increased 3.3% YOY vs expectations of 3.4% YOY.
Headline CPI increased 0.9% MOM vs expectation of 1.0% MOM.
Core CPI increased 2.6% YOY vs expectations of 2.6% YOY
Core CPI increased 0.2% MOM vs expectations of 0.2% MOM
This is the first report since the onset of the Middle East conflict, during which energy prices have risen sharply.
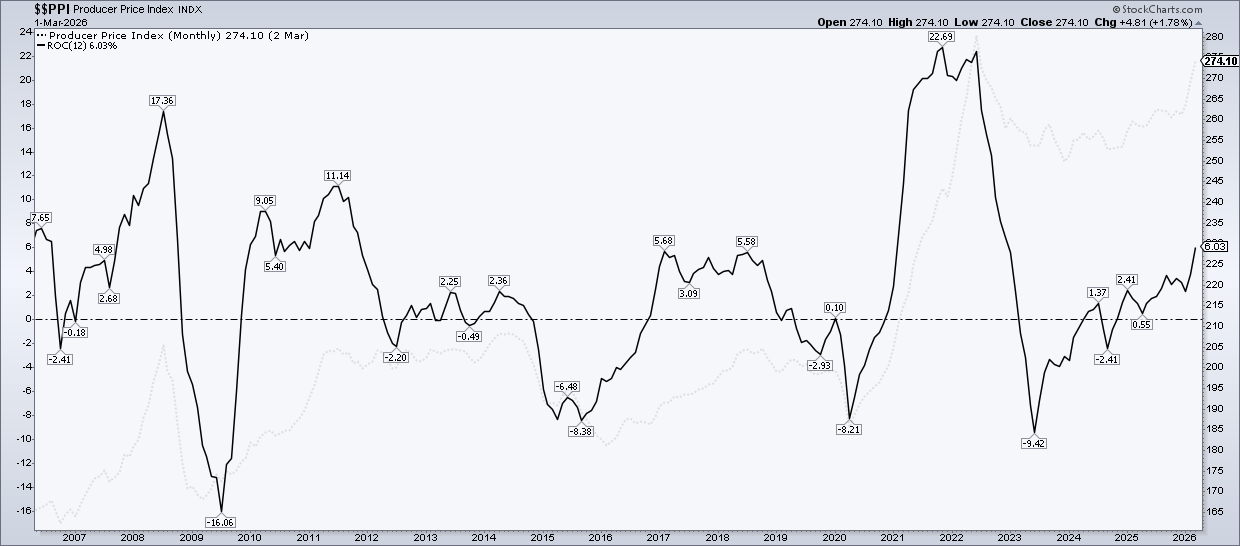
PPI: The March 2026 PPI data is presented below
Headline PPI increased 4.0% YOY vs expectations of 4.6% YOY.
Headline PPI increased 0.5% MOM vs expectation of 1.1% MOM.
Core PPI increased 3.8% YOY vs expectations of 4.2% YOY
Core PPI increased 0.1% MOM vs expectations of 0.5% MOM
The headline figure was driven by a sharp rise in energy prices (+8.5% MOM), but core measures came in softer than expected, providing some relief on underlying pressures.
Below I have included charts showing the trend for both CPI and PPI:
PCE: With regards to the PCE price (Fed’s preferred metric), March ‘26 data came in largely as expected but showed re-acceleration, with core at its highest since late 2023.
Headline PCE increased 3.5% YOY vs expectations of 3.5% YOY.
Headline PCE increased 0.7% MOM vs expectation of 0.7% MOM.
Core PCE increased 3.2% YOY vs expectations of 3.2% YOY
Core PCE increased 0.3% MOM vs expectations of 0.3% MOM
Core PCE has proven notably sticky throughout the last year.
FOMC Meeting:
At the most recent FOMC meeting on April 28-29, 2026, the FOMC decided to hold interest rates steady for a third consecutive meeting as they navigate persistent inflation and a cooling labor market. The target range for the federal funds rate remains at 3.5% to 3.75%.
Interestingly, there were four dissents , the most since 1992. One for a 25bp cut and three against the “easing bias” language used.
The Committee reiterated that it is attentive to risks on both sides of its dual mandate (price stability and full employment). While energy costs are keeping inflationary pressure up, there are concerns that higher fuel prices will dampen disposable income and slow overall GDP growth.
No SEP projections were released, as they are only published quarterly.
Indices:
S&P 500:
Currently trades at 7,230.12 (-4.99% YTD)
It is 5.46% above the 50SMA.
Trading at 26.05x trailing earnings and 22.56x forward earnings (per WSJ)
Nasdaq Composite:
Currently trades at 25,067.80 (7.89% YTD)
It is 9.14% above the 50SMA.
Trading at 33.9x trailing earnings and 29.25x forward earnings (per WSJ)
Key Indicators:
10 Year T-Note: 4.446. It has increased by 6.19% YTD
British Pound vs USD: 1.353 and is up 0.56% YTD.
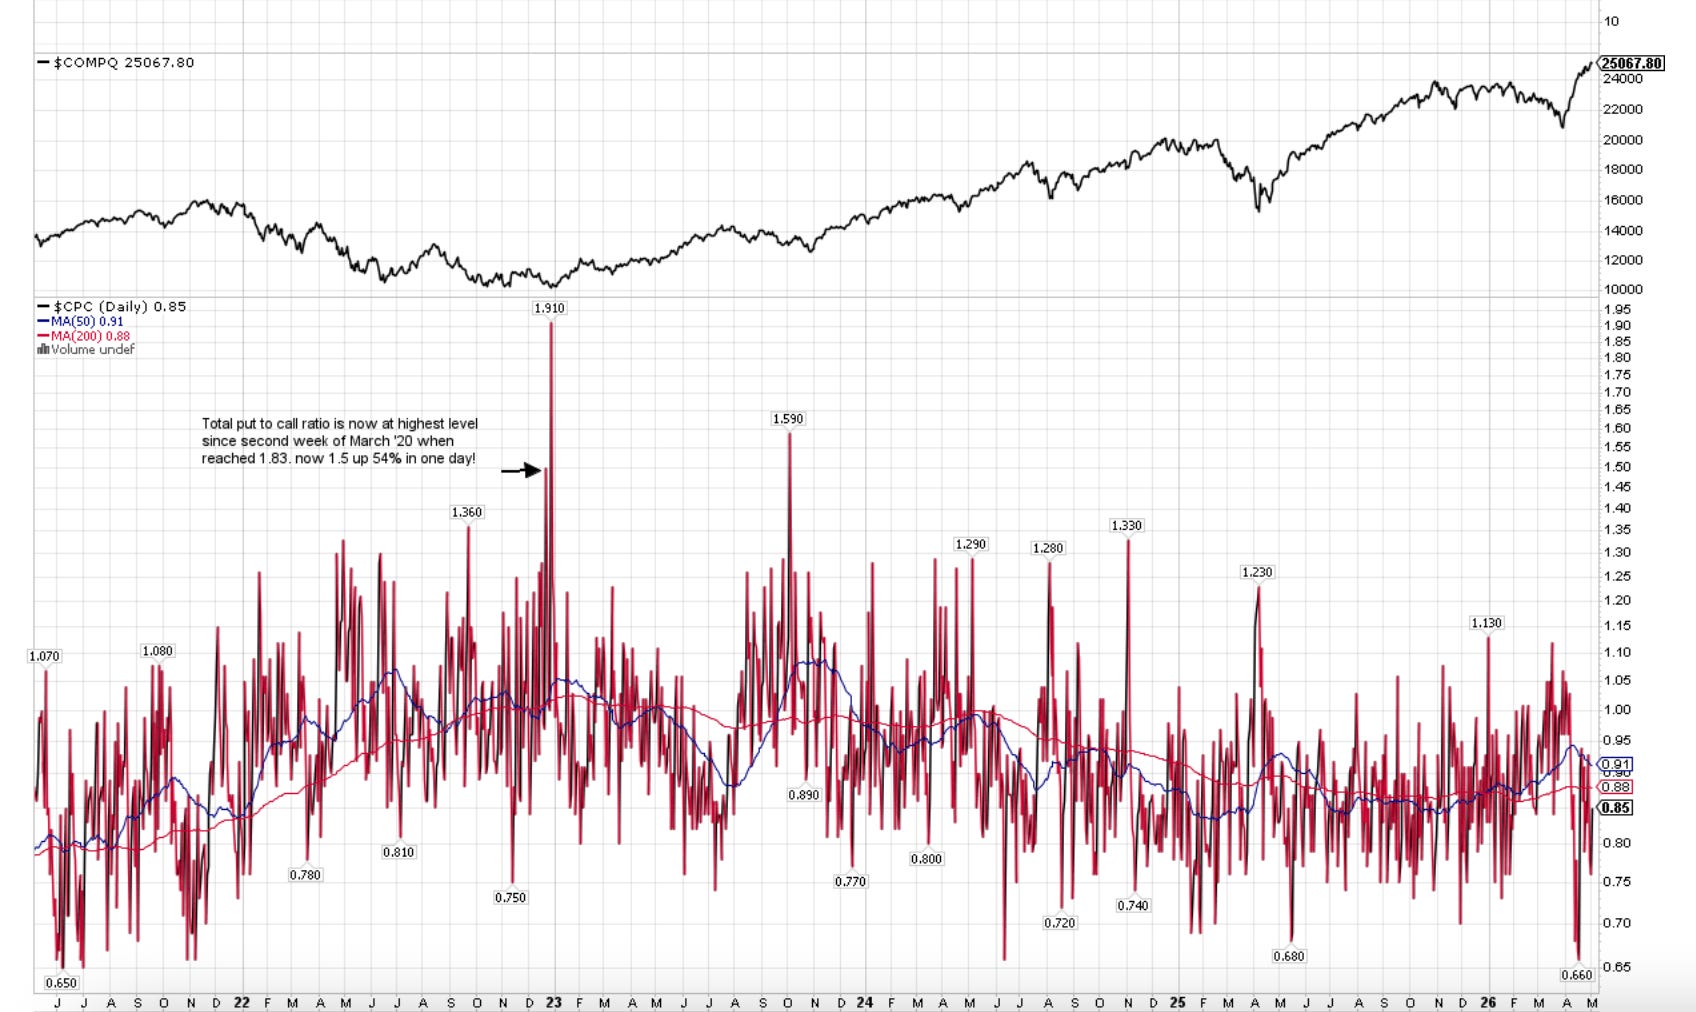
CPC (Put to Call Ratio) is 0.85. Note >1 can indicate Fear and >1.5 can be Extreme.
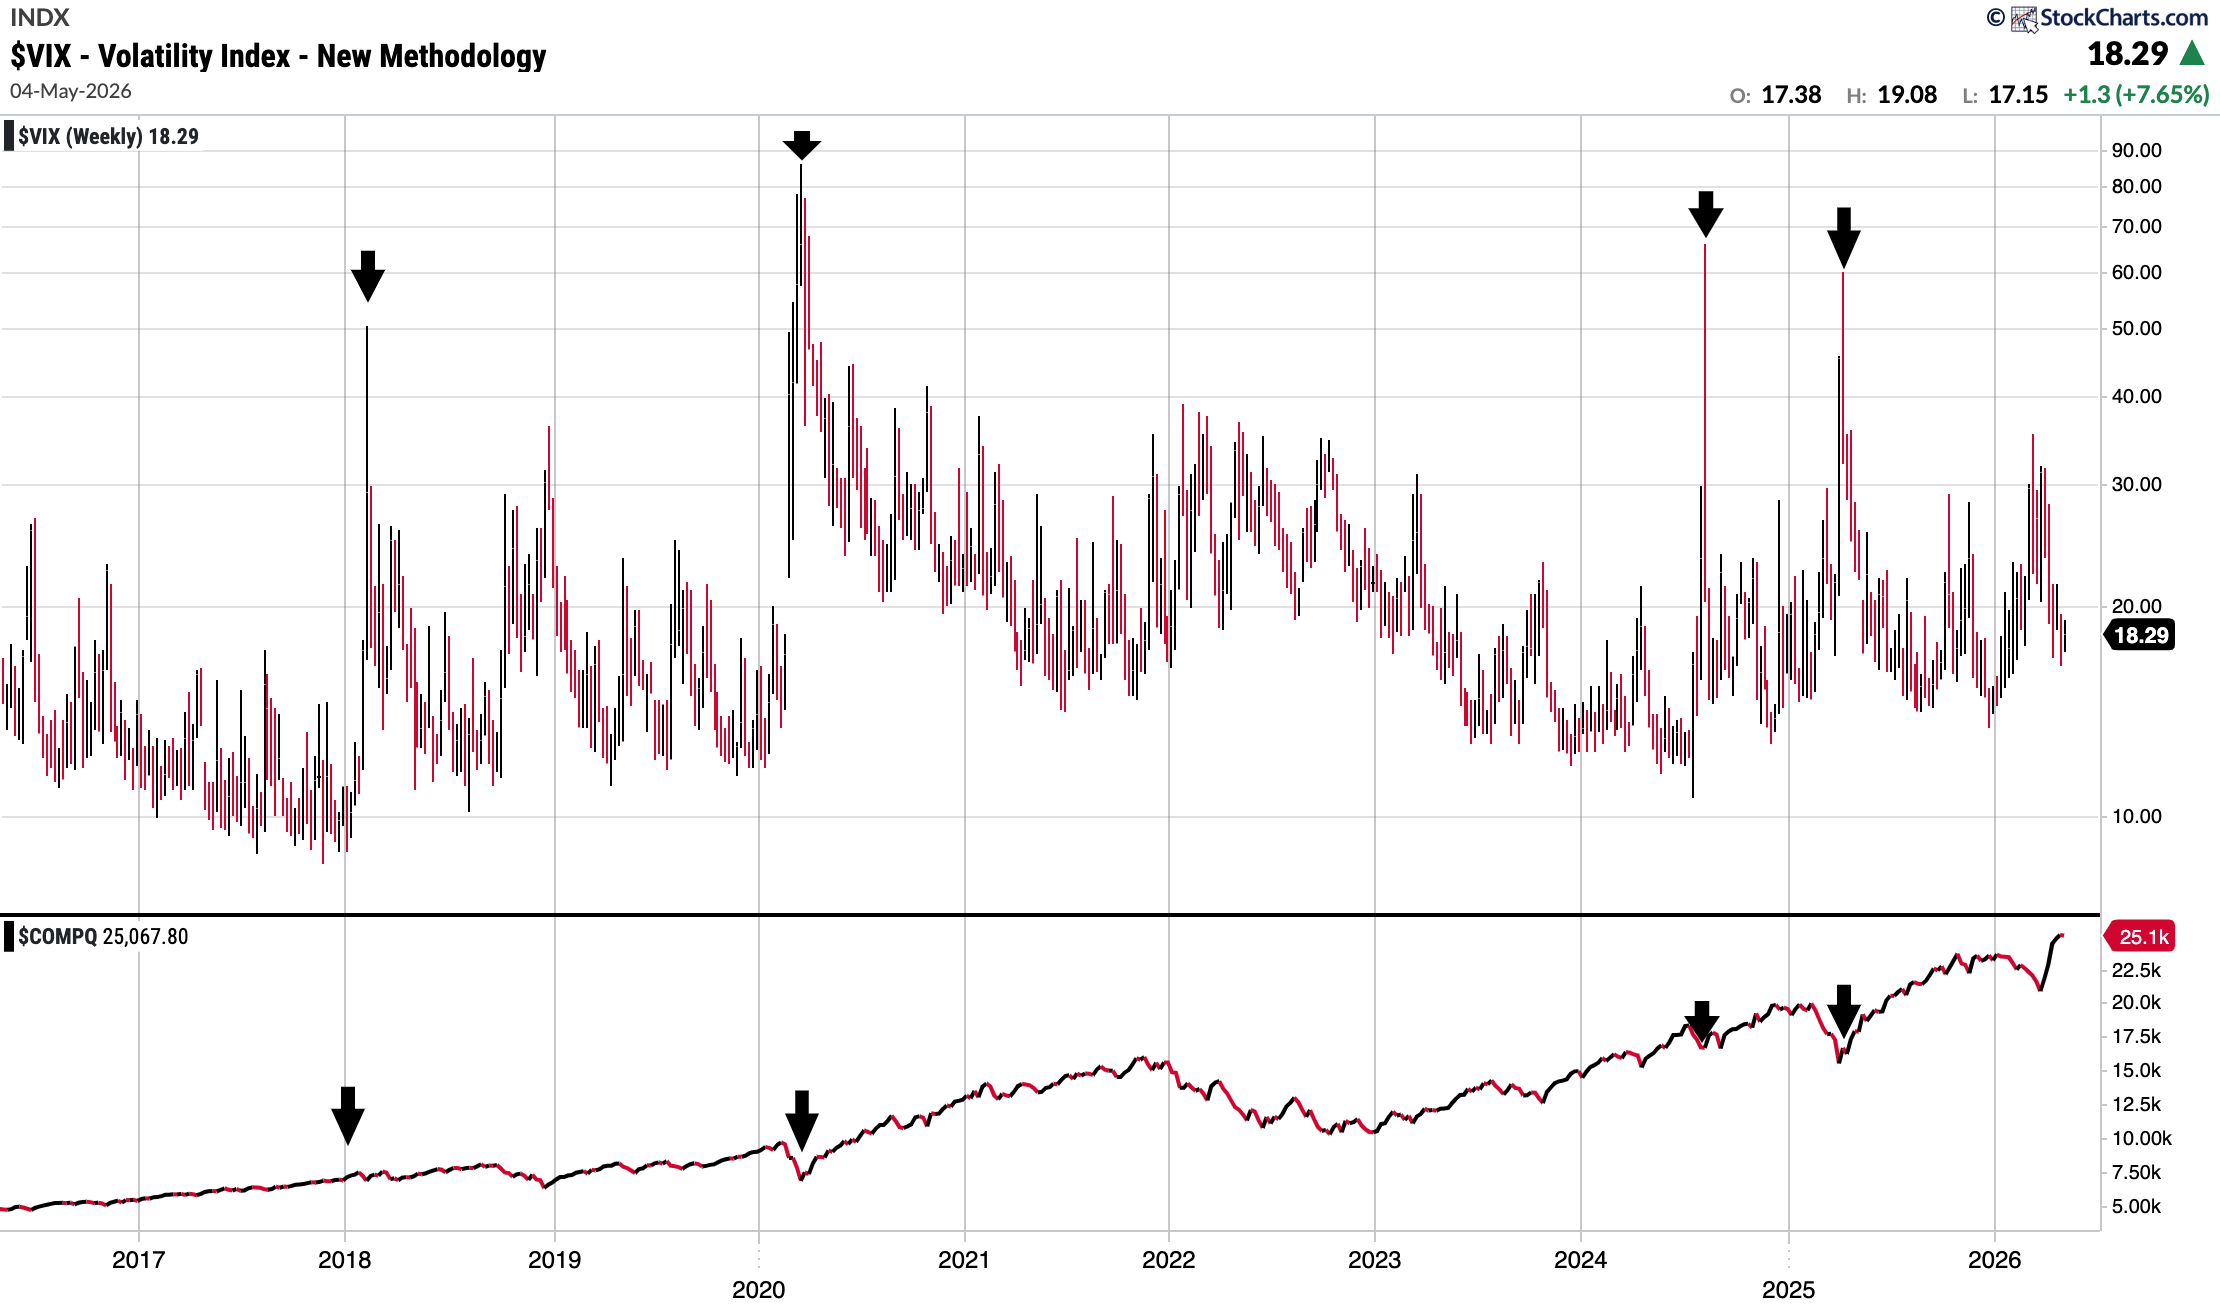
VIX: 18.29. I have included a chart below showing the VIX over time and Nasdaq Comp underneath it: you can see that extreme readings have always been a buying opportunity in the medium term.
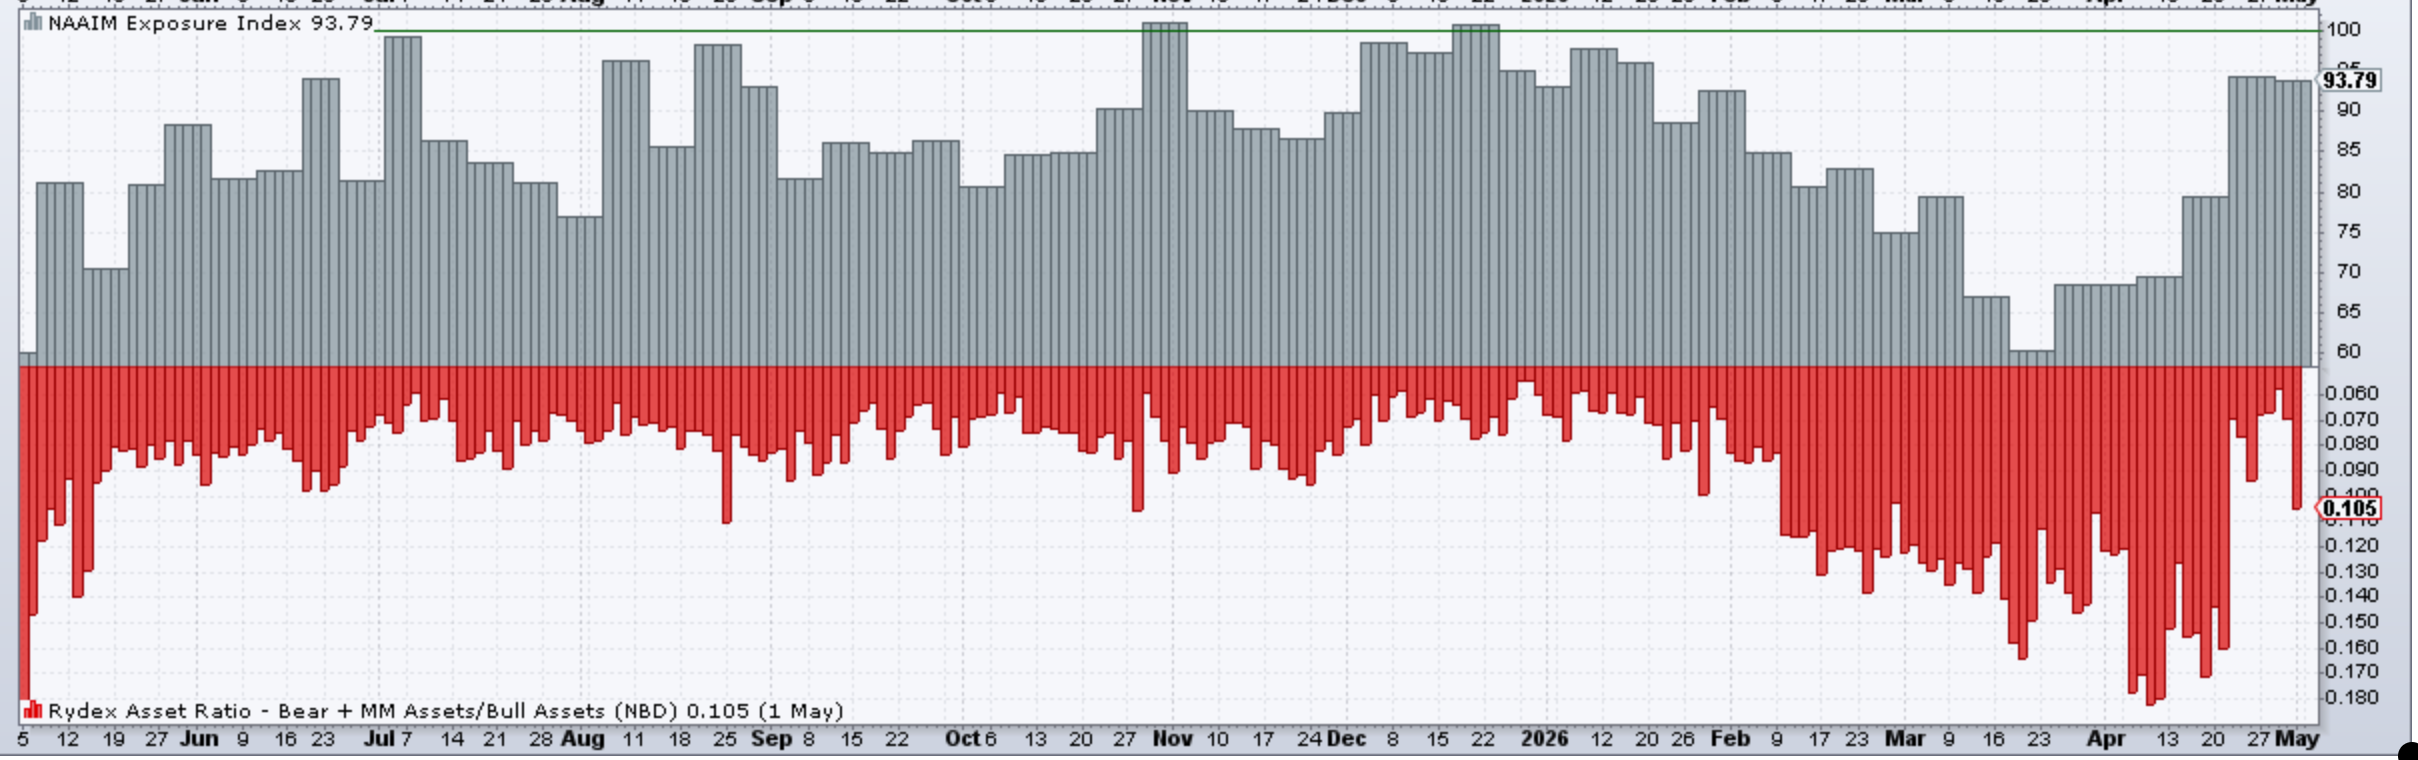
NAAIM Exposure Index is 93.79 from 68.36 at the end of last month. Interesting. Note it did get into the low 30’s in April 2025 (!)
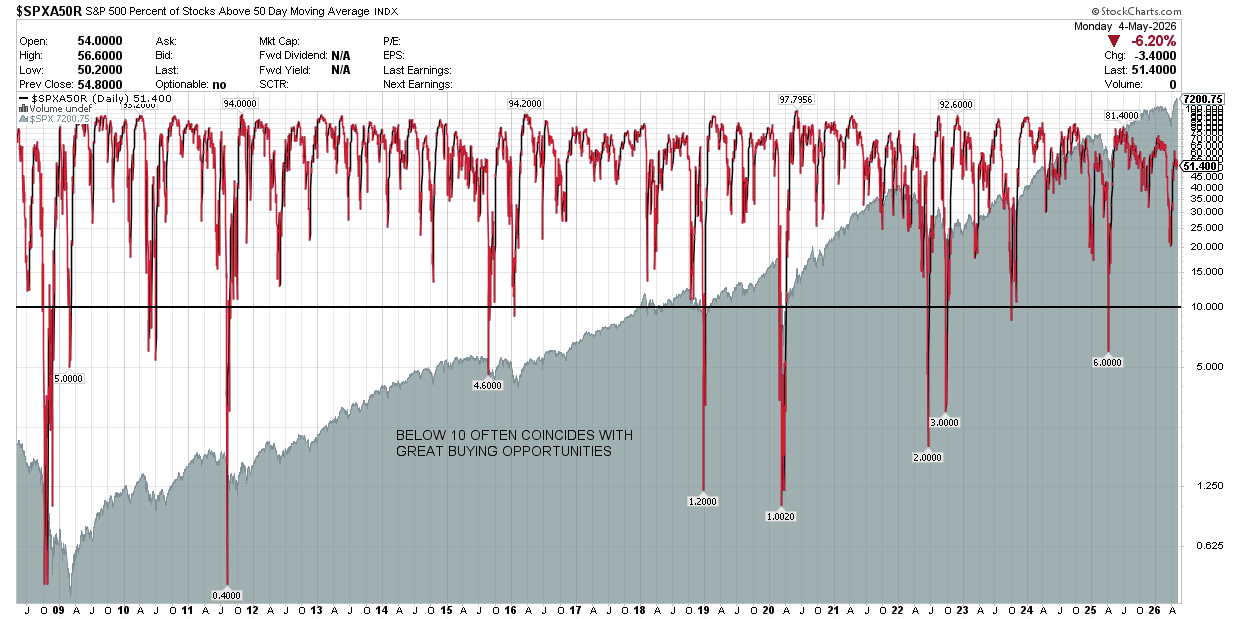
S&P 500 Percentage of Stocks Above the 50 Day Moving Average: 51.4% (<10 tend to be great buying opportunities)
Fear and Greed Index (CNN) currently reads 63 which is in the ‘Greed’ zone. Note last month it was 19 supposedly in the ‘Extreme Fear’ zone.
Consolidated Performance across Investment Accounts: YTD and since Inception of SixSigmaCapital (Equities Only)
2023: +94%
2024: +61%
2025: +57%
2026: +8.82%
TWR since Inception of SixSigmaCapital is thus +433.62% or a just over a 5.3x of the portfolio. The CAGR is 65%
TWR +433.62% vs S&P 97.32%
TWR of S&P 500 in the same period is +97.32% or a 1.97x return.
SixSigmaCapital has achieved a +336.3% outperformance in that time period.
I remain pleased overall, as risk adjusted these results are very sound. Furthermore, all moves were disclosed in real time.
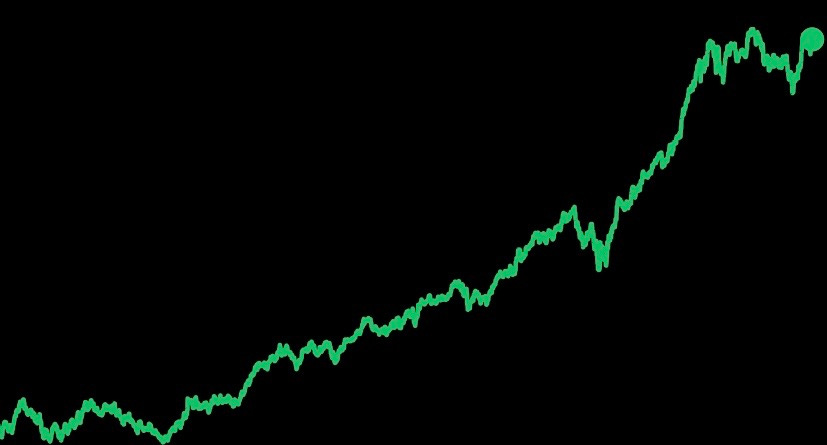
Equity curve since switching to my current brokerage in the last few years is below:
SixSigmaCapital Trading Account:
At the start of the year, I opened a dedicated trading account for active strategies. It was initially approximately 10% the size of my primary investment account, though has grown somewhat since then. The account is managed with a trading mindset and consists mostly of common shares, though I have utilised select options strategies.
The past month was a strong one with some needle moving trades in ARM, RKLB, ASTS, IREN plus others. Of course there was several small losses and small wins also. The account progressed to 45% at the end of April.
Trading Account YTD: +45%
If combined to the investment account, it would add 4.5% to the total performance.
Featured Quote:
“Where you want to be is always in control, never wishing, always trading, and always first and foremost protecting your butt. That’s why most people lose money as individual investors or traders because they’re not focusing on losing money. They need to focus on the money that they have at risk and how much capital is at risk in any single investment they have. If everyone spent 90 percent of their time on that, not 90 percent of the time on pie-in-the-sky ideas on how much money they’re going to make, then they will be incredibly successful investors.” Paul Tudor Jones

Current Positions in Size Order with Cost Basis (Investment Account) as of May 3 2026
