
Monthly Portfolio Update: +455.94% TWR Since 2023 (+361.04% Outperformance vs. S&P 500)
Market Thoughts | +361.04% Performance Since Inception | 2026 Position Plans & Outlook.

I hope you are well. Below, we provide market commentary and an in-depth portfolio update.
Format for what is covered in this Monthly Portfolio Update:
Market Thoughts
Indices Review
Key Indicators
SixSigmaCapital Performance: YTD and since Inception
Featured Quote
Current Positions in size order
Closing Thoughts
If it is your first time here, ensure to check out what SixSigmaCapital readers are saying below:

For all readers a reminder that a premium subscription includes:
Live Portfolio updates (All Buys and Sells) in Subscriber only Channels
Favourite set-up Ideas, Market Memos plus Full archive
Discord access for AMAs and live trading account updates (Annual Subscribers only)
Monthly in depth portfolio & performance updates
Upgrade to a premium subscription via the link below:
Market thoughts:
Equity markets had a mixed month in May, with the Dow, S&P 500, and Nasdaq Composite posting month-over-month returns of +2.4%, -1.54%, and -3.86%, respectively.
For the last several months, I have been saying in this letter:
My perspective remains that there is plenty to be concerned about regarding the US economy and equity markets over the medium term” &
“Historically, there tends to be a large drawdown in the S&P 500 within the 12 months preceding election day. I do not know whether it will be Fed-related, a policy shock by the White House, or an economic downturn that triggers the drawdown (or something else entirely), but I think it is very likely we will see one given the way markets are behaving”
Despite climbing a wall of worry for most of the past year, the broader indices finally fractured in March. The S&P 500 pulled back more than 9% peak-to-trough, and the Nasdaq fell 13%. Although this may seem modest compared to other pullbacks, significant damage was done under the hood: at the end of March, more than 42% of S&P 500 stocks were in a bear market, with more than 79% trading below their 50-day SMA. Consumer Discretionary, Information Technology, and Financials were among the worst performers in Q1, whilst Energy was the best performer.
However, since April, there has been a historic rebound. From the March 30 lows through the end of May, the S&P 500 gained more than 1,300 points (over 15%), while the Nasdaq Composite surged 6,300 points from its bottom (an advance of more than 30%). Semiconductors and every layer of the tech supply chain have enjoyed an unprecedented run, with the SOXX ETF peaking in mid-June at >110% above its March lows, leaving the sector at its most overbought level on record.
Both indexes ended the month of June slightly off their highs, but it was an interesting month that brought with it some notable rotation. It may not have felt that way given the continued strength in semiconductors, but the Mag 7 actually had one of their worst months on record, and Technology as a group was down month-over-month. Meanwhile, Healthcare, Financials, Real Estate, and Consumer Defensives all had strong months. See the image below:

As a reminder, we are still seeing a stagflationary picture characterised by rising inflation, slowing GDP growth, and a generally weakening labor market (e.g., June non-farm payrolls rose by just 57,000, well below the 110,000 forecast). Notably, large companies are still conducting layoffs en masse, Microsoft the most recent to do so.
Last month I had written that:
The aftermath war in the Middle East will likely serve as further headwinds in the coming months. If we look at oil specifically, I backtested what happens to equity markets when crude remains consistently above $100; I found that stocks can remain robust for around 20 days, but after that, they tend to suffer. This is something to pay attention to as we head into the rest of summer, though crude is currently at $90 after pulling back.
Since the MOU was signed by both parties last week, crude has really started to come in, closing Friday at $68. In my view, this is a boon for equities, especially EM names.
Whilst we saw a correction in March, it remains to be seen if that was the major midterm election-year pullback or if another one will occur later in the year. Notably, S&P 500 earnings estimates continue to be revised upward, and the majority of companies are beating expectations and raising guidance. This fundamental strength argues against a large, index-level pullback; however, we did get a textbook retrace to the 50-day simple moving average and I would not rule out a retrace to the 7,000 breakout level on the SPX. If a meaningful pullback does materialise, I will certainly be a buyer of select equities.
Inflation:
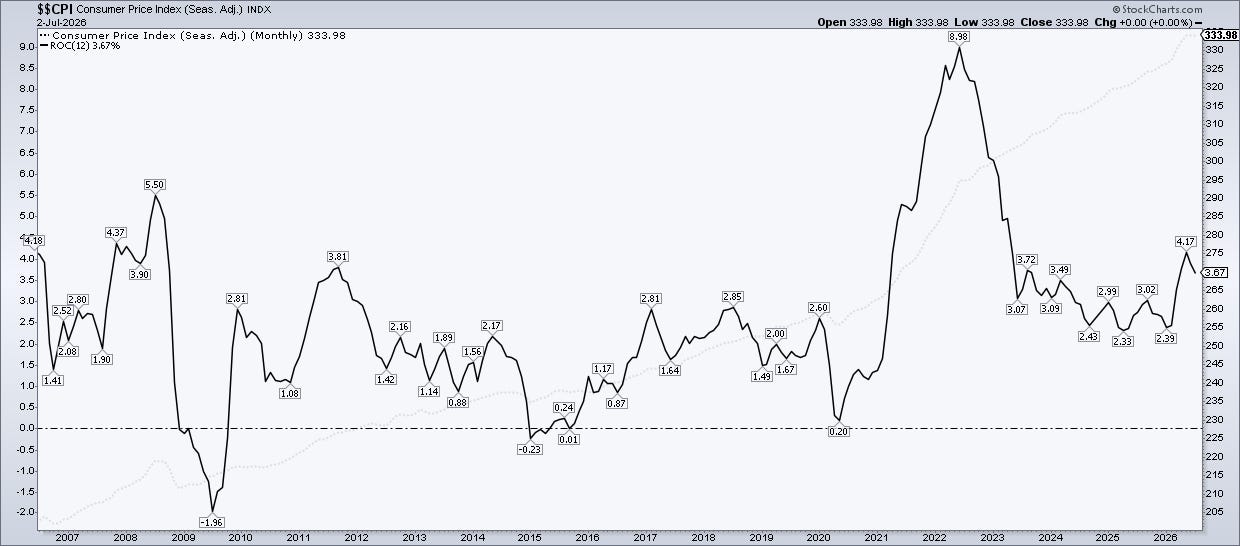
CPI: The May 2026 CPI data is presented below
Headline CPI increased 4.2% YOY vs expectations of 4.2% YOY.
Headline CPI increased 0.5% MOM vs expectation of 0.5% MOM.
Core CPI increased 2.9% YOY vs expectations of 2.9% YOY
Core CPI increased 0.2% MOM vs expectations of 0.3% MOM
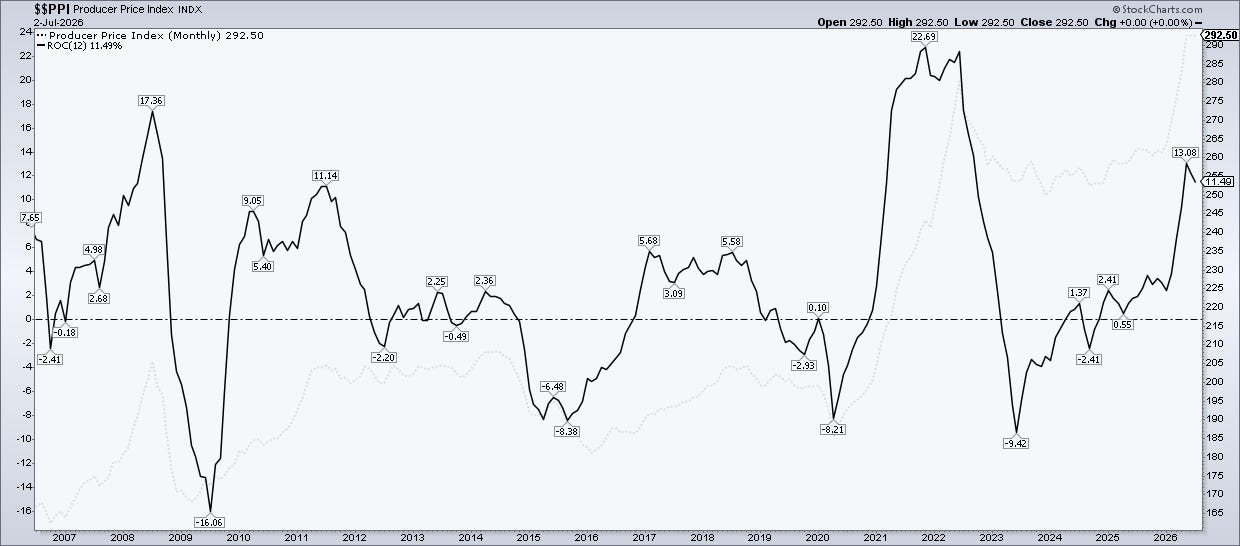
PPI: The May 2026 PPI data is presented below
Headline PPI increased 6.5% YOY vs expectations of 6.4% YOY.
Headline PPI increased 1.1% MOM vs expectation of 0.7% MOM.
Core PPI increased 4.9% YOY vs expectations of 5.4% YOY
Core PPI increased 0.4% MOM vs expectations of 0.5% MOM
Below I have included charts showing the trend for both CPI and PPI:
PCE: With regards to the PCE price (Fed’s preferred metric), May ‘26 data came in largely as expected but showed re-acceleration, with core at its highest since late 2023.
Headline PCE increased 4.1% YOY vs expectations of 4.1% YOY.
Headline PCE increased 0.4% MOM vs expectation of 0.5% MOM.
Core PCE increased 3.4% YOY vs expectations of 3.4% YOY
Core PCE increased 0.3% MOM vs expectations of 0.3% MOM
Whilst Core PCE came in lighter than expectations, Core PCE has proven notably sticky throughout the last year.
June FOMC Meeting:
At the most recent FOMC meeting on June 16-17, 2026, the FOMC decided to hold interest rates steady as they navigate elevated inflation and a resilient labor market. The target range for the federal funds rate remains at 3.50% to 3.75%.
Interestingly, the decision was completely unanimous with no dissents, and this marked Kevin Warsh’s first meeting as the new Fed Chair. The policy statement was notably shorter and contained less forward guidance than those of his predecessor, and Warsh notably refrained from offering his own personal interest rate projections in the dot plot.
The Committee stressed its commitment to fighting inflation, with the closing sentence of the statement clearly declaring: “The committee will deliver price stability.” While a recent preliminary US–Iran agreement has helped bring Brent crude prices down to around $83, headline inflation remains high at 4.2%. Meanwhile, the labor market remains strong, with May payrolls rising by a stronger-than-expected 172,000 and unemployment holding steady at 4.3%.
SEP projections were released, revealing a “hawkish dot plot” surprise. All but one participating policymaker projected that interest rates will stay the same or increase by year’s end, pushing the median expectation for 2026 up to 3.80%.
Indices:
S&P 500
Currently trades at 7,483.24 (9.11% YTD)
It is 1.2% above the 50SMA.
Trading at 25.37x trailing earnings and 21.74x forward earnings (per WSJ)
Nasdaq Composite:
Currently trades at 25,832.67 (11.18% YTD)
It is 0.31% below the 50SMA.
Trading at 35.22x trailing earnings and 26.97x forward earnings (per WSJ for the QQQ)
Key Indicators:
10 Year T-Note: 4.485. It has increased by 7.12% YTD
British Pound vs USD: 1.336 and is down 0.73% YTD.
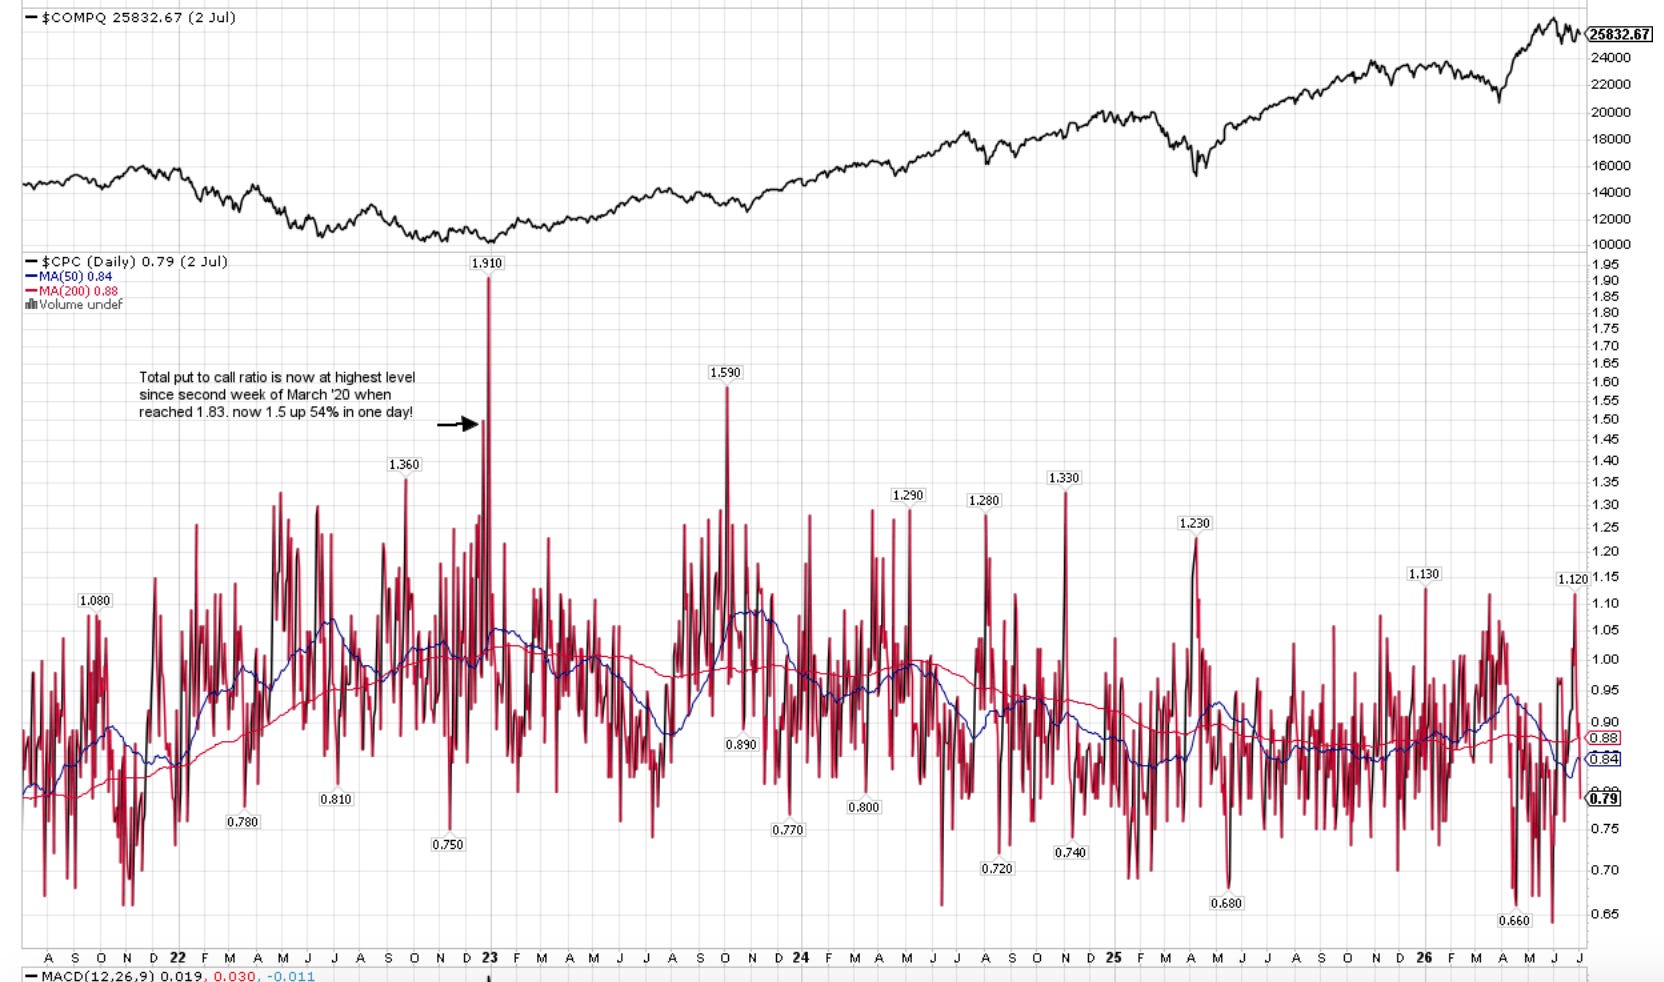
CPC (Put to Call Ratio): 0.79. Note >1 can indicate Fear and >1.5 can be Extreme.
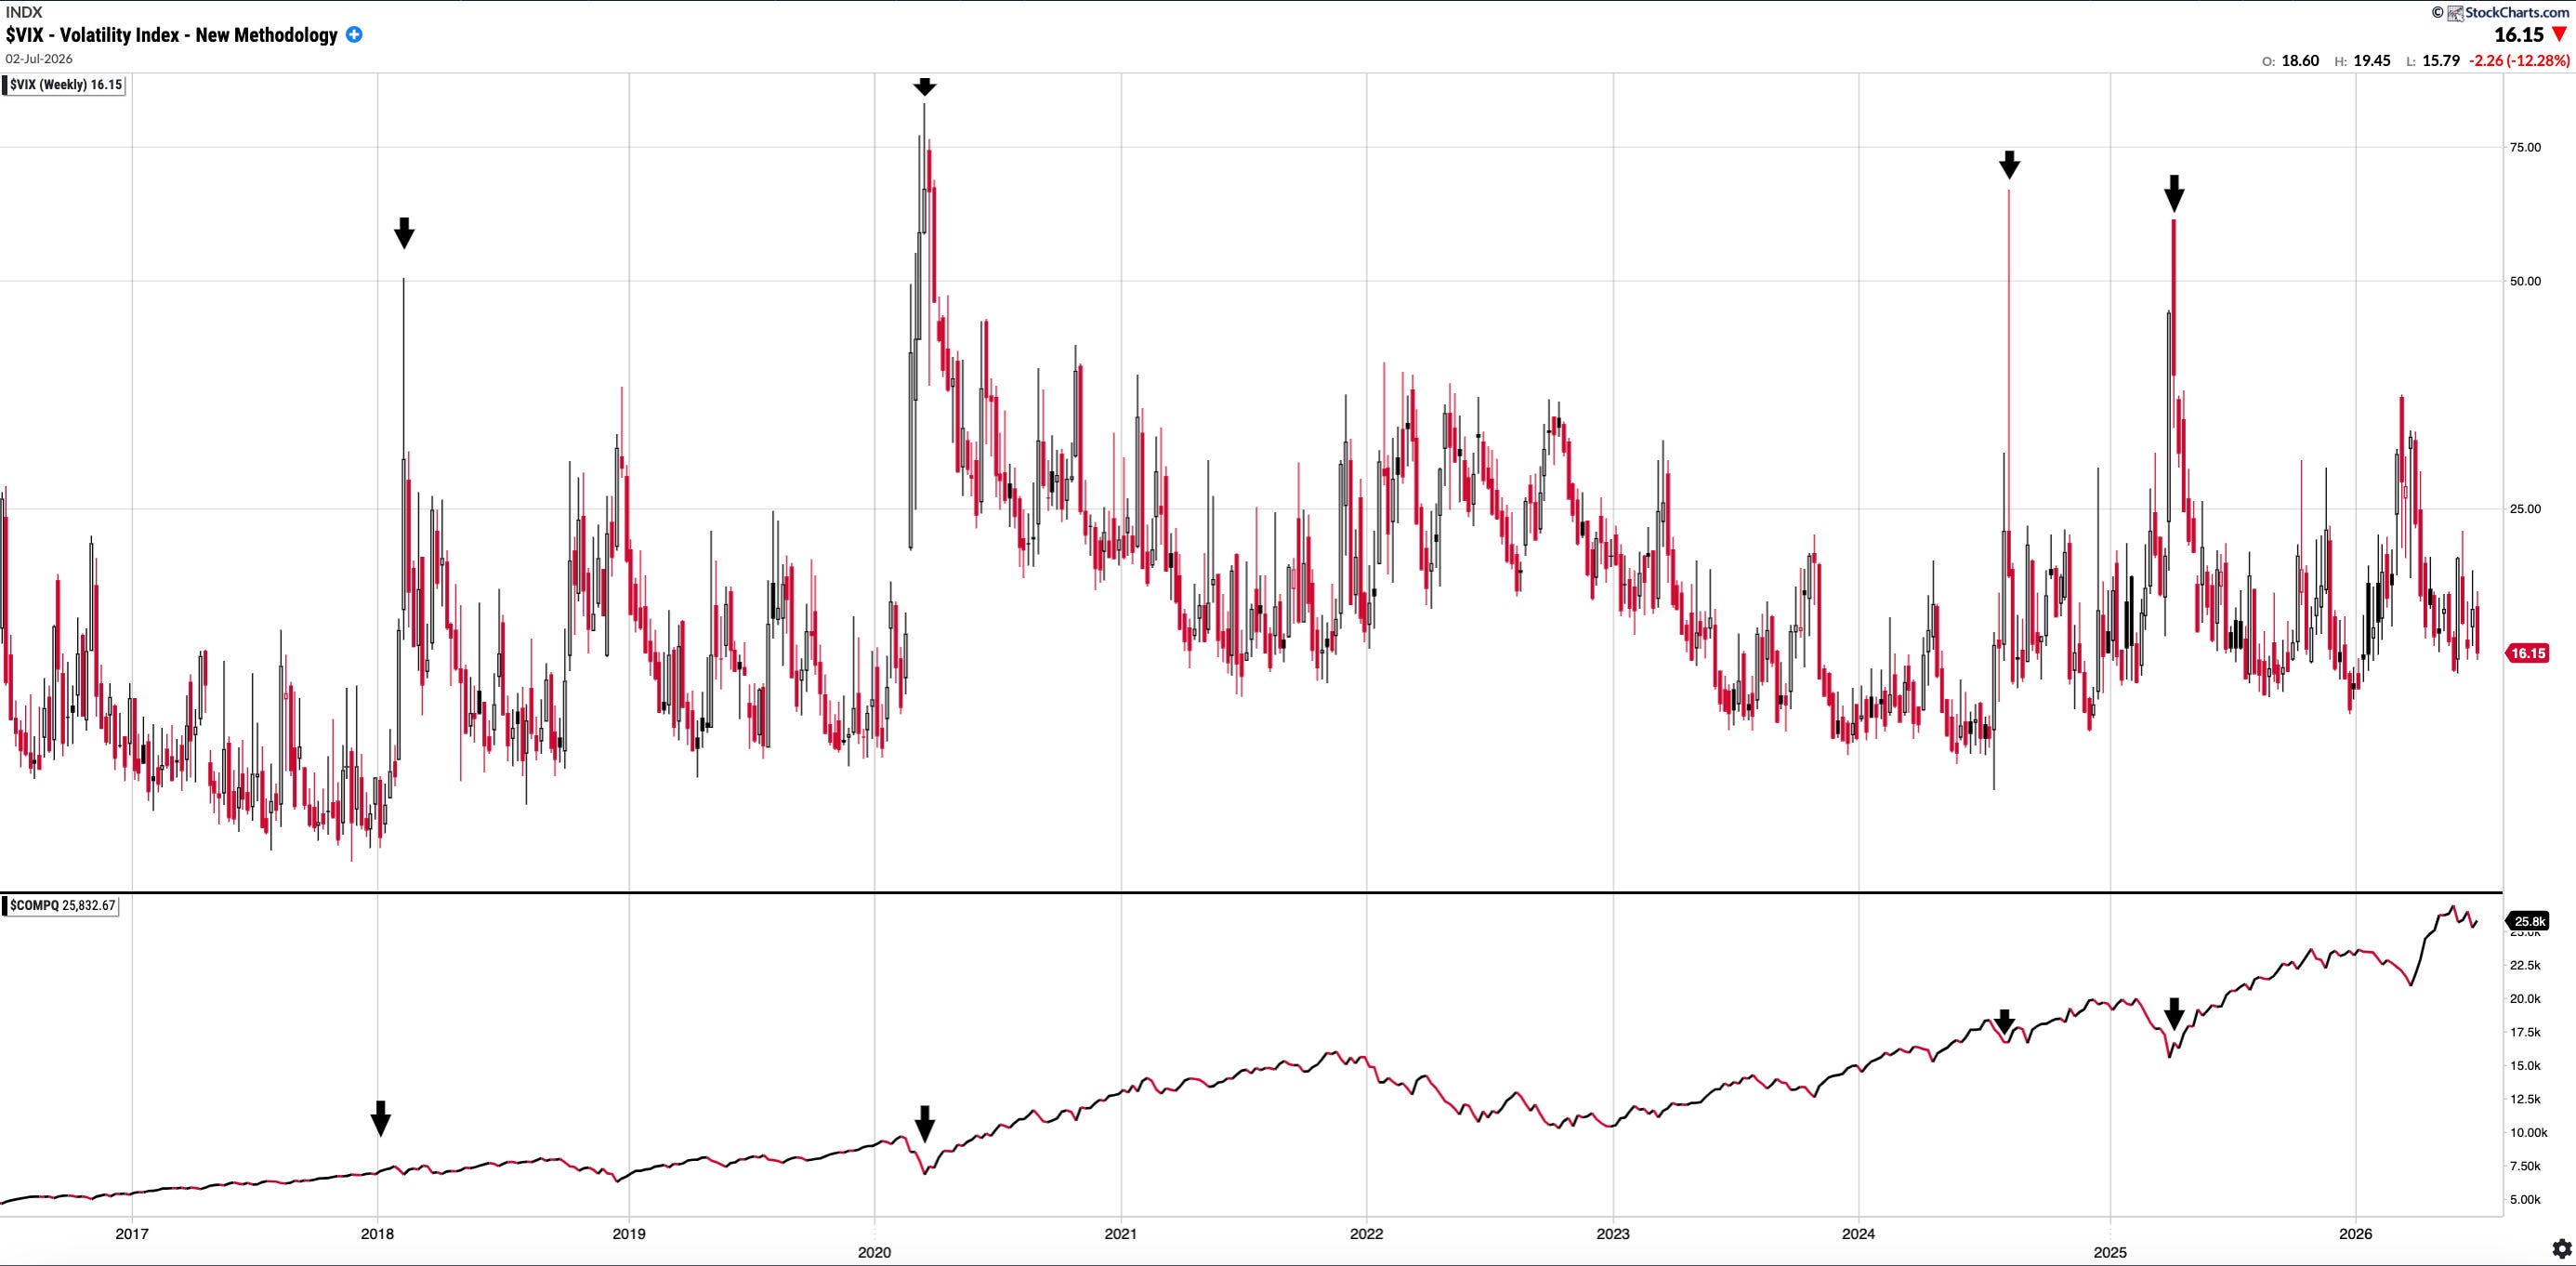
VIX: 16.15. I have included a chart below showing the VIX over time and Nasdaq Comp underneath it: you can see that extreme readings have always been a buying opportunity in the medium term.
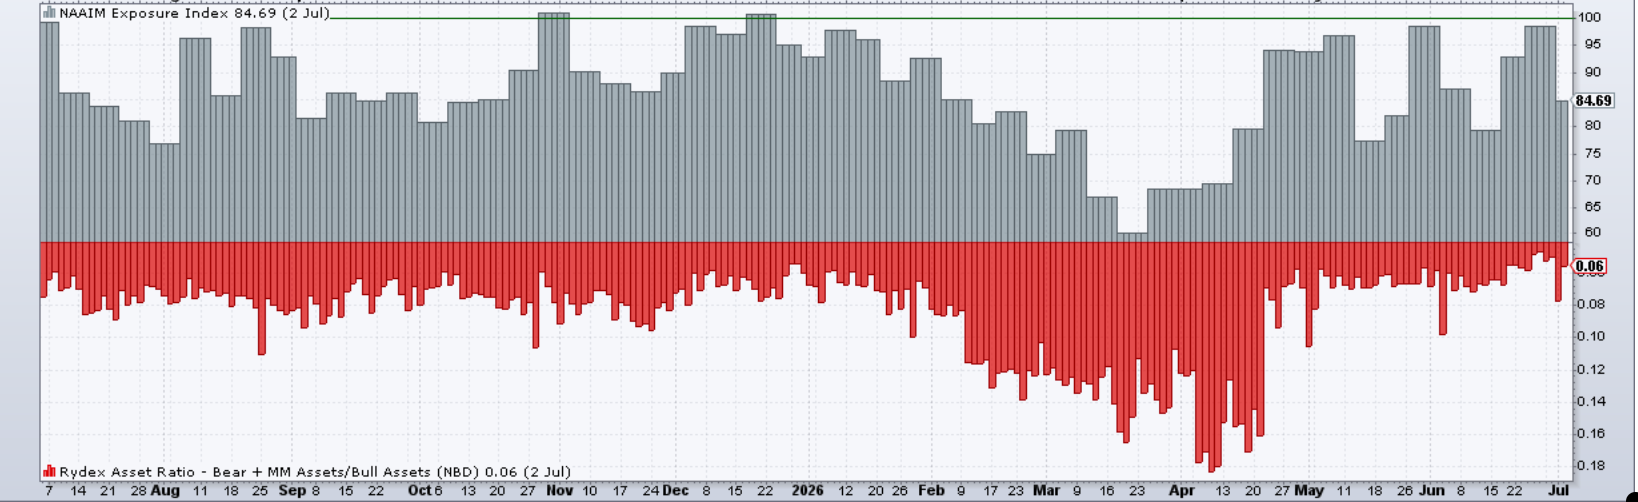
NAAIM Exposure Index: 84.69 from 98.39 from 68.36 at the end of the last month. Interesting. Note it did get into the low 30’s in April 2025 (!)
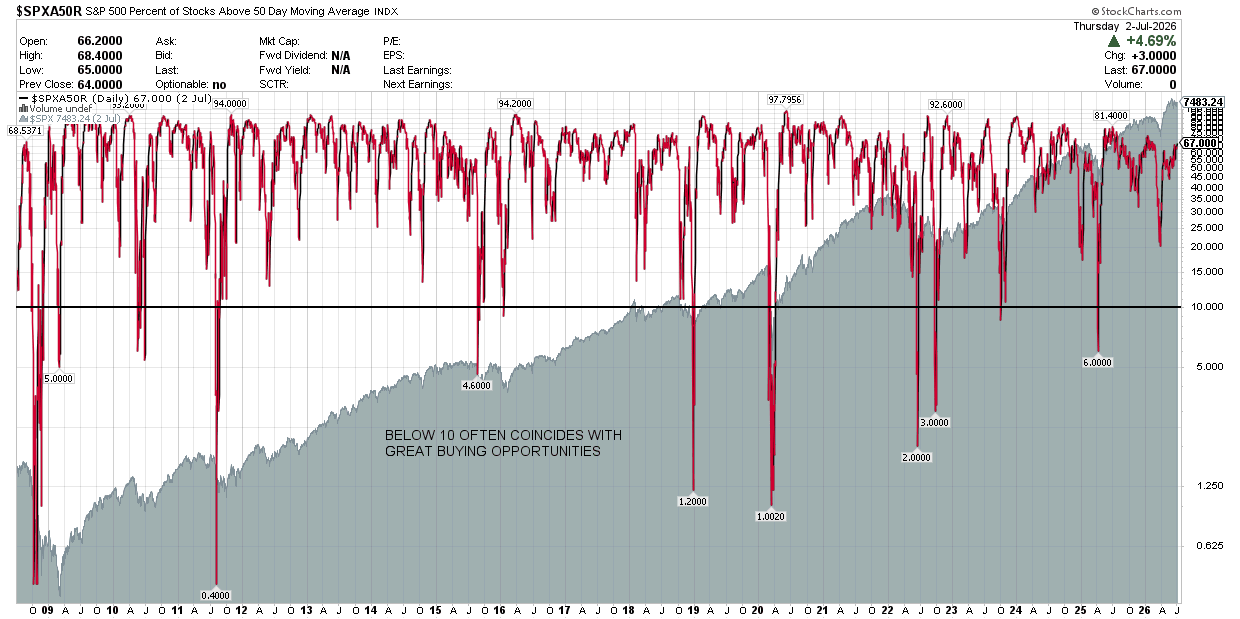
S&P 500 Percentage of Stocks Above the 50 Day Moving Average: 67% (<10 tend to be great buying opportunities)
Fear and Greed Index (CNN): currently reads 32 which is in the ‘Fear’ zone. At the end of March it was 19 supposedly in the ‘Extreme Fear’ zone.
Consolidated Performance across Investment Account: YTD and since Inception of SixSigmaCapital (Equities only as of Friday 3rd July)
2023: +94%
2024: +61%
2025: +57%
2026: +13.4% (with trading account gains it would be +21.9%)
TWR since Inception of SixSigmaCapital is thus +455.94% or just over a 5.5x of the portfolio. The CAGR is 63%
TWR +455.94% vs S&P 94.90%.
TWR of S&P 500 in the same period is +94.9% or a 1.949x return.
SixSigmaCapital has achieved a +361.04% outperformance in that time period.
I remain pleased overall, as risk adjusted these results are very sound. Furthermore, all moves were disclosed in real time.
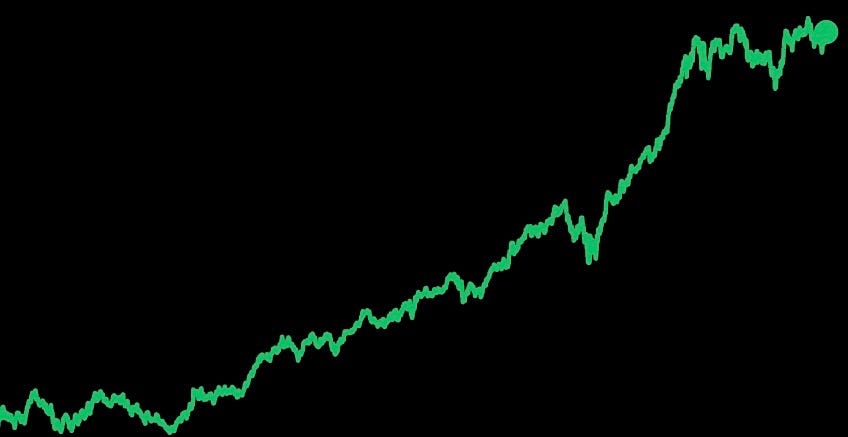
Equity curve since switching to my current brokerage in the last few years is below:
SixSigmaCapital Trading Account:
At the start of the year, I opened a dedicated trading account for active strategies. It was initially approximately 10% the size of my primary investment account, though has grown somewhat since then (now around 18% the size of the main book). The account is managed with a trading mindset and consists mostly of common shares, though I have utilised select options strategies.
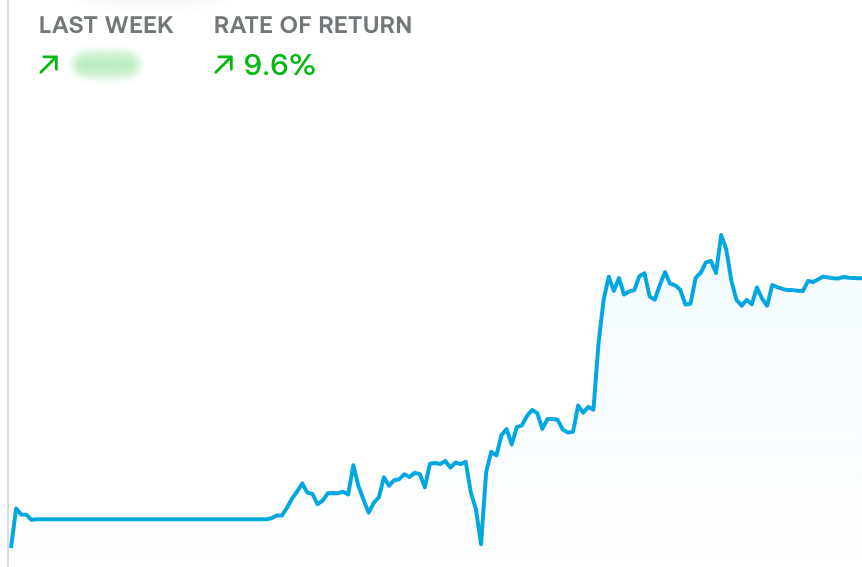
The past month was another strong one with some needle moving trades in OUST, ASTS, CRWV, AMBA plus a couple of successful options trades. Of course there was several small losses and small wins also. The account progressed to +85% as of Friday 3rd July.
Trading Account YTD: +85% YTD
If combined to the investment account, it would add 8.5% to the total performance.
Featured Quote:
“There are times to make money and times not to lose money” David Tepper

Current Positions in Size Order with Cost Basis (Investment Account) as of July 3 2026
