

I hope you are well. Below, we provide market commentary and an in-depth portfolio update.
Format for what is covered in this Monthly Portfolio Update:
Market Thoughts
Indices Review
Key Indicators
SixSigmaCapital Performance: YTD and since Inception
Featured Quote
Current Positions in size order
Closing Thoughts
If it is your first time here, ensure to check out what SixSigmaCapital readers are saying below:

For all readers a reminder that a premium subscription includes:
Live Portfolio updates (All Buys and Sells) in Subscriber only Channels
Favourite set-up Ideas, Market Memos plus Full archive
Discord access for AMAs and live trading account updates (Annual Subscribers only)
Monthly in depth portfolio & performance updates
Upgrade to a premium subscription via the link below:
Market thoughts:
Equity markets had a volatile month in July, with the Dow, S&P 500, and Nasdaq Composite posting month-over-month returns of +0.18%, -0.09%, and -2.89%, respectively.
For the last several months, I have been saying in this letter:
My perspective remains that there is plenty to be concerned about regarding the US economy and equity markets over the medium term” &
“Historically, there tends to be a large drawdown in the S&P 500 within the 12 months preceding election day. I do not know whether it will be Fed-related, a policy shock by the White House, or an economic downturn that triggers the drawdown (or something else entirely), but I think it is very likely we will see one given the way markets are behaving”
Despite climbing a wall of worry for most of the past year, the broader indices finally fractured in March. The S&P 500 pulled back more than 9% peak-to-trough, and the Nasdaq fell 13%. However, since April, there had been a historic rebound. From the March 30 lows through the end of May, the S&P 500 gained more than 1,300 points (over 15%), while the Nasdaq Composite surged 6,300 points from its bottom (an advance of more than 30%). Semiconductors and every layer of the tech supply chain have enjoyed an unprecedented run, with the SOXX ETF peaking in mid-June at >110% above its March lows, leaving the sector at its most overbought level on record.
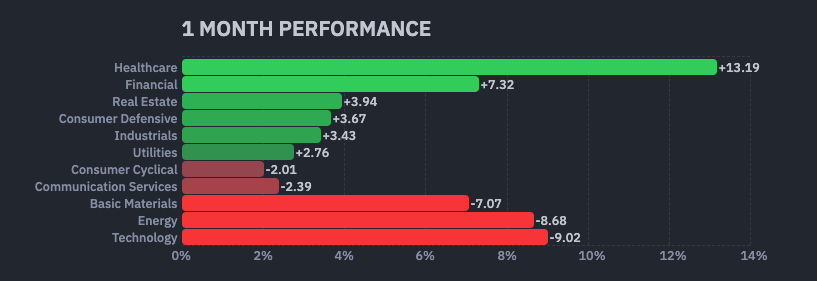
June was an interesting month that brought notable market rotation. Both indexes ended the month slightly off their highs, though it may not have felt that way given the continued strength in semiconductors. However, the Mag 7 actually had one of its worst months on record, and technology as a group was down month-over-month. Meanwhile, healthcare, financials, real estate, and consumer defensives all had strong months. See the image below:
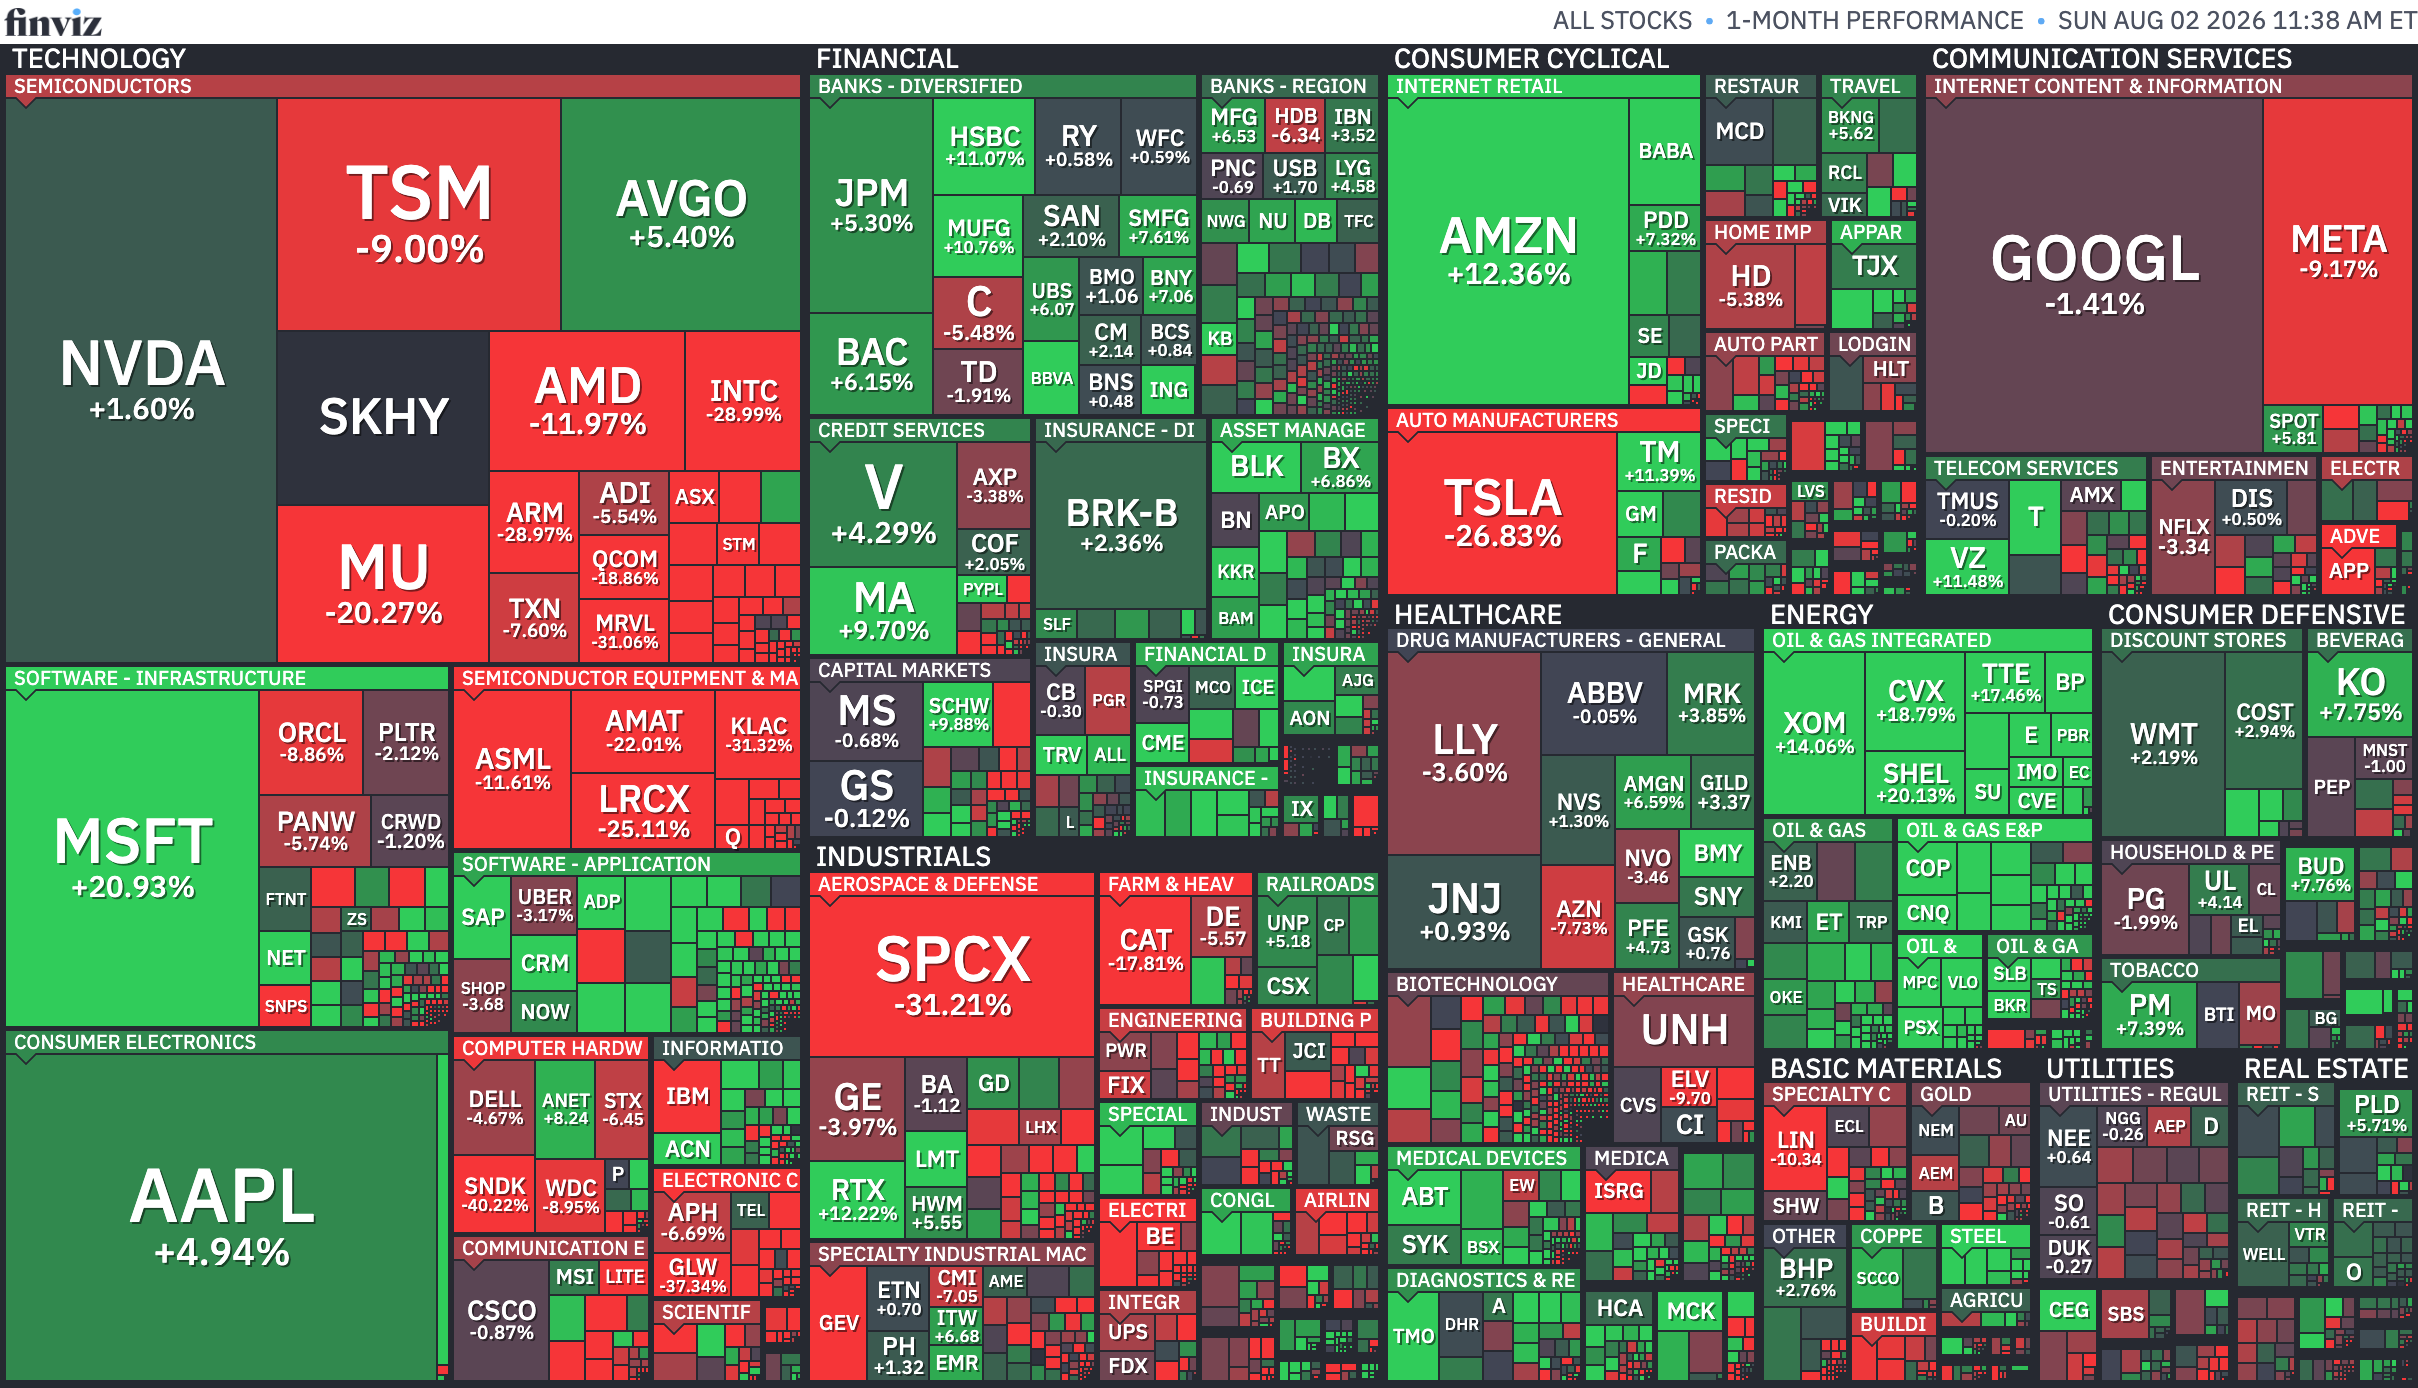
July brought with it continued rotation, and the severely overbought AI infrastructure and semiconductor trade cooled off dramatically, whilst hyper-scalers, energy, financials, and, frankly, most other sectors showed some strength. See sector map below:
The last week of the month was dynamic to say the least. Most relevantly, we had mega-cap earnings from Microsoft, Meta, Apple, and Amazon, as well as reports from leading AI and memory companies like Vertiv, Seagate, KLA, Teradyne, Samsung, and SK Hynix.
Regarding Mega-Cap earnings, Microsoft and Amazon especially impressed with strong cloud numbers. Microsoft’s capex forecasts were in line with expectations, while Amazon’s were slightly higher. Wall Street seemed convinced of the return on invested capital (ROIC) for this spend, sending both stocks up double digits. Meta sold off post-print despite strong revenue, weighed down by worsening margins and higher capital expenditure. Meanwhile, SK Hynix missed consensus estimates despite reporting rock-solid fundamentals. Samsung posted strong numbers and noted on its call that supply constraints will worsen in 2027 compared to 2026, with shortages likely persisting through 2028. Visibility beyond 2029 remains limited.
The Fed held interest rates steady at the FOMC meeting. However, long-dated US Treasury bond yields surged sharply soon after. The benchmark 30-year Treasury yield spiked above 5.24%, marking its highest level since 2007. At the same time, the 10-year Treasury yield broke out to 4.745%. This reaction triggered a drastic “twist steepener” in the yield curve, as short-term yields drifted lower while long-term borrowing costs soared. While equities initially held up during the press conference, they fell sharply into the close.
Lingering in the background was the dramatic liquidation of Situational Awareness LP (SALP). The Financial Times reported that Goldman Sachs met with SALP on July 24th to discuss an orderly liquidation. News then broke that SALP had written to limited partners asking for additional capital following a sharp decline, with estimates suggesting the fund was down over 50% month-to-date. Other firms likely caught wind of this and pressed their short positions, making the liquidation visible in the tape. This culminated in Citadel acquiring SALP’s stock portfolio, which triggered a 20% to 35% rally in those same holdings the following day. Fitting end to a wild month in the Stock Market!
Last month I had written that:
The aftermath war in the Middle East will likely serve as further headwinds in the coming months. If we look at oil specifically, I backtested what happens to equity markets when crude remains consistently above $100; I found that stocks can remain robust for around 20 days, but after that, they tend to suffer. This is something to pay attention to as we head into the rest of summer, though crude is currently at $90 after pulling back.
Since the fragile June ceasefire almost entirely collapsed over the last fortnight, tit-for-tat military strikes have resumed with no quick resolution in sight. As a result, we have continued to see crude prices rise sharply, climbing from $66 at the beginning of July into the mid-80s as of Friday’s close. There have been talks by Trump over the weekend about cancelling the strikes and working on a deal with Iran. If so, then we could see crude drop.
While we experienced a decent correction in March, it remains to be seen whether that was the main midterm election-year pullback or if another is due later in the year. S&P 500 earnings estimates continue to be revised upward, with most companies beating expectations and raising guidance. Although this fundamental strength argues against a deep, index-level decline, the market did just finish the month with a -5% pullback in the SPX and an 11% peak-to-trough drop in the Qs. Should a further meaningful pullback materialise, I will certainly be looking to buy select equities.
Inflation:
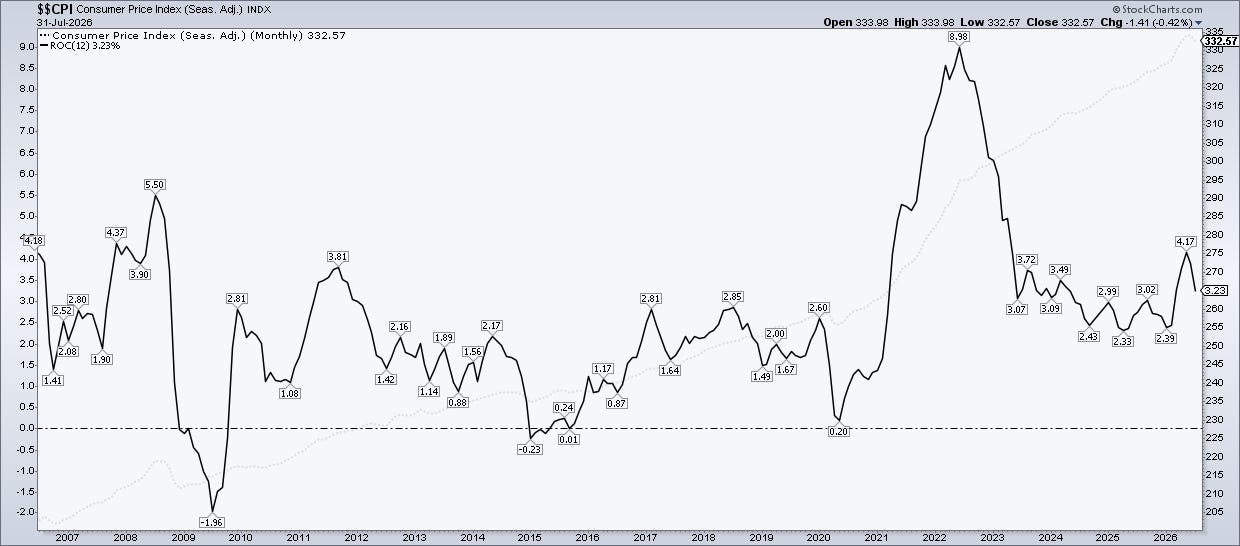
CPI: The June 2026 CPI data is presented below:
Headline CPI increased 3.5% YOY vs expectations of 3.8% YOY.
Headline CPI decreased 0.4% MOM vs expectations of a 0.2% decrease MOM
Core CPI increased 2.6% YOY vs expectations of 2.8%–2.9% YOY.
Core CPI was unchanged (0.0%) MOM vs expectations of a 0.2% MOM
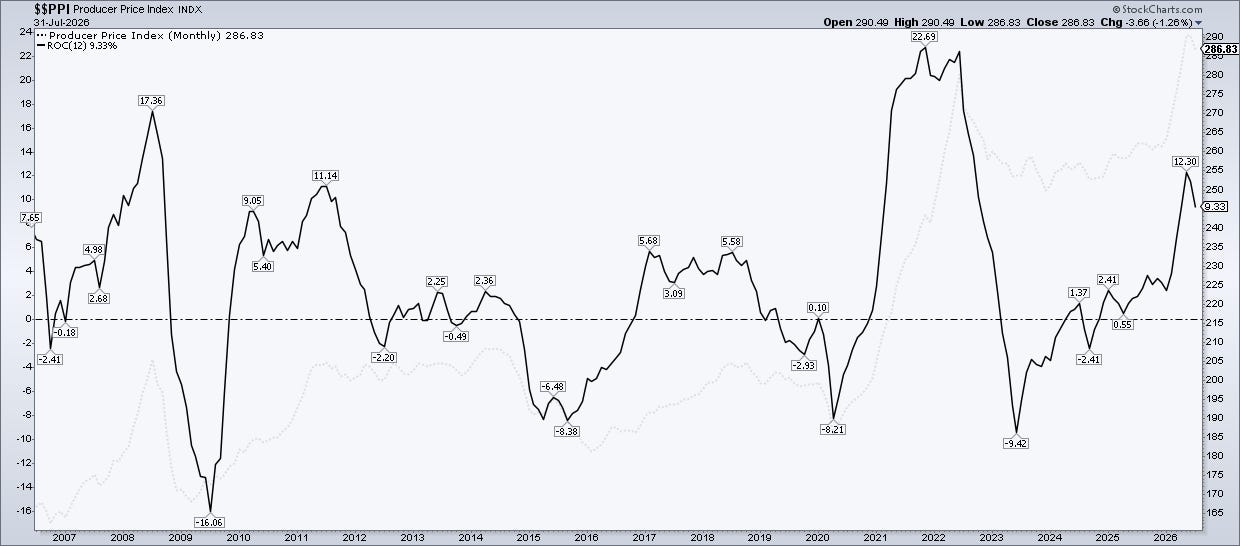
PPI: The June 2026 PPI (final demand) data is presented below:
Headline PPI increased 5.5% Y/Y vs expectations of 6.2% Y/Y
Headline PPI decreased 0.3% M/M vs expectations of 0.0% M/M
Core PPI increased 4.7% Y/Y vs expectations of 5.2% Y/Y
Core PPI increased 0.2% MOM vs expectations of 0.4% M/M
Below I have included charts showing the trend for both CPI and PPI:
PCE: With regards to the PCE price (Fed’s preferred metric), June ‘26 data came in slightly cooler than expected.
Headline PCE increased 3.7% YOY vs expectations of 3.8% YOY.
Headline PCE decreased 0.1% MOM vs expectations of 0.0% MOM.
Core PCE increased 3.3% YOY vs expectations of 3.4% YOY.
Core PCE increased 0.1% MOM vs expectations of 0.2% MOM.
Whilst Core PCE came in lighter than expectations, Core PCE has proven notably sticky throughout the last year.
July FOMC Meeting:
At the most recent FOMC meeting on July 28–29, 2026, the FOMC decided to hold interest rates steady as they navigate persistent inflation risks alongside signs of economic expansion. The target range for the federal funds rate remains at 3.50% to 3.75%.
Unlike the unanimous decision in June, this decision was divided with a 9–3 vote, marking notable hawkish dissent in Kevin Warsh’s second meeting as Fed Chair. Three regional Fed bank presidents—Beth M. Hammack, Neel Kashkari, and Lorie K. Logan—dissented in favour of a 25-basis-point rate hike. Chair Warsh maintained a concise policy statement devoid of explicit forward guidance, reiterating in his press conference that the committee remains strictly data-dependent and advising markets to “play the ball, not the referee”.
The Committee reaffirmed its firm stance, stating unequivocally: “The Committee will deliver price stability”. While headline inflation cooled slightly in June due to a temporary pullback in petrol prices, price pressures remain elevated relative to the 2% goal, partly compounded by Middle East conflict risks, tariffs, and AI-related infrastructure demand. Meanwhile, productivity and capital investment remain strong, job gains have kept pace with the workforce, and the unemployment rate has changed little.
While no updated Summary of Economic Projections (SEP) was issued at this non-quarterly meeting, the divided vote underscored that an interest rate hike remains a live possibility for future meetings. Markets continue to weigh the likelihood of further tightening heading into the next decision on September 15–16.
Indices:
S&P 500
Currently trades at 7,489.72 (9.2% YTD)
It is 0.24% above the 50SMA.
Trading at 25.19x trailing earnings and 21.01x forward earnings
Nasdaq Composite:
Currently trades at 25,373.85 (9.2% YTD)
It is 2.21% below the 50SMA.
Trading at 32.61x trailing earnings and 24.79x forward earnings (per WSJ for the QQQ)
Key Indicators:
10 Year T-Note: 4.745. It has increased by 13.33% YTD
British Pound vs USD: 1.348 and is up 0.21% YTD.
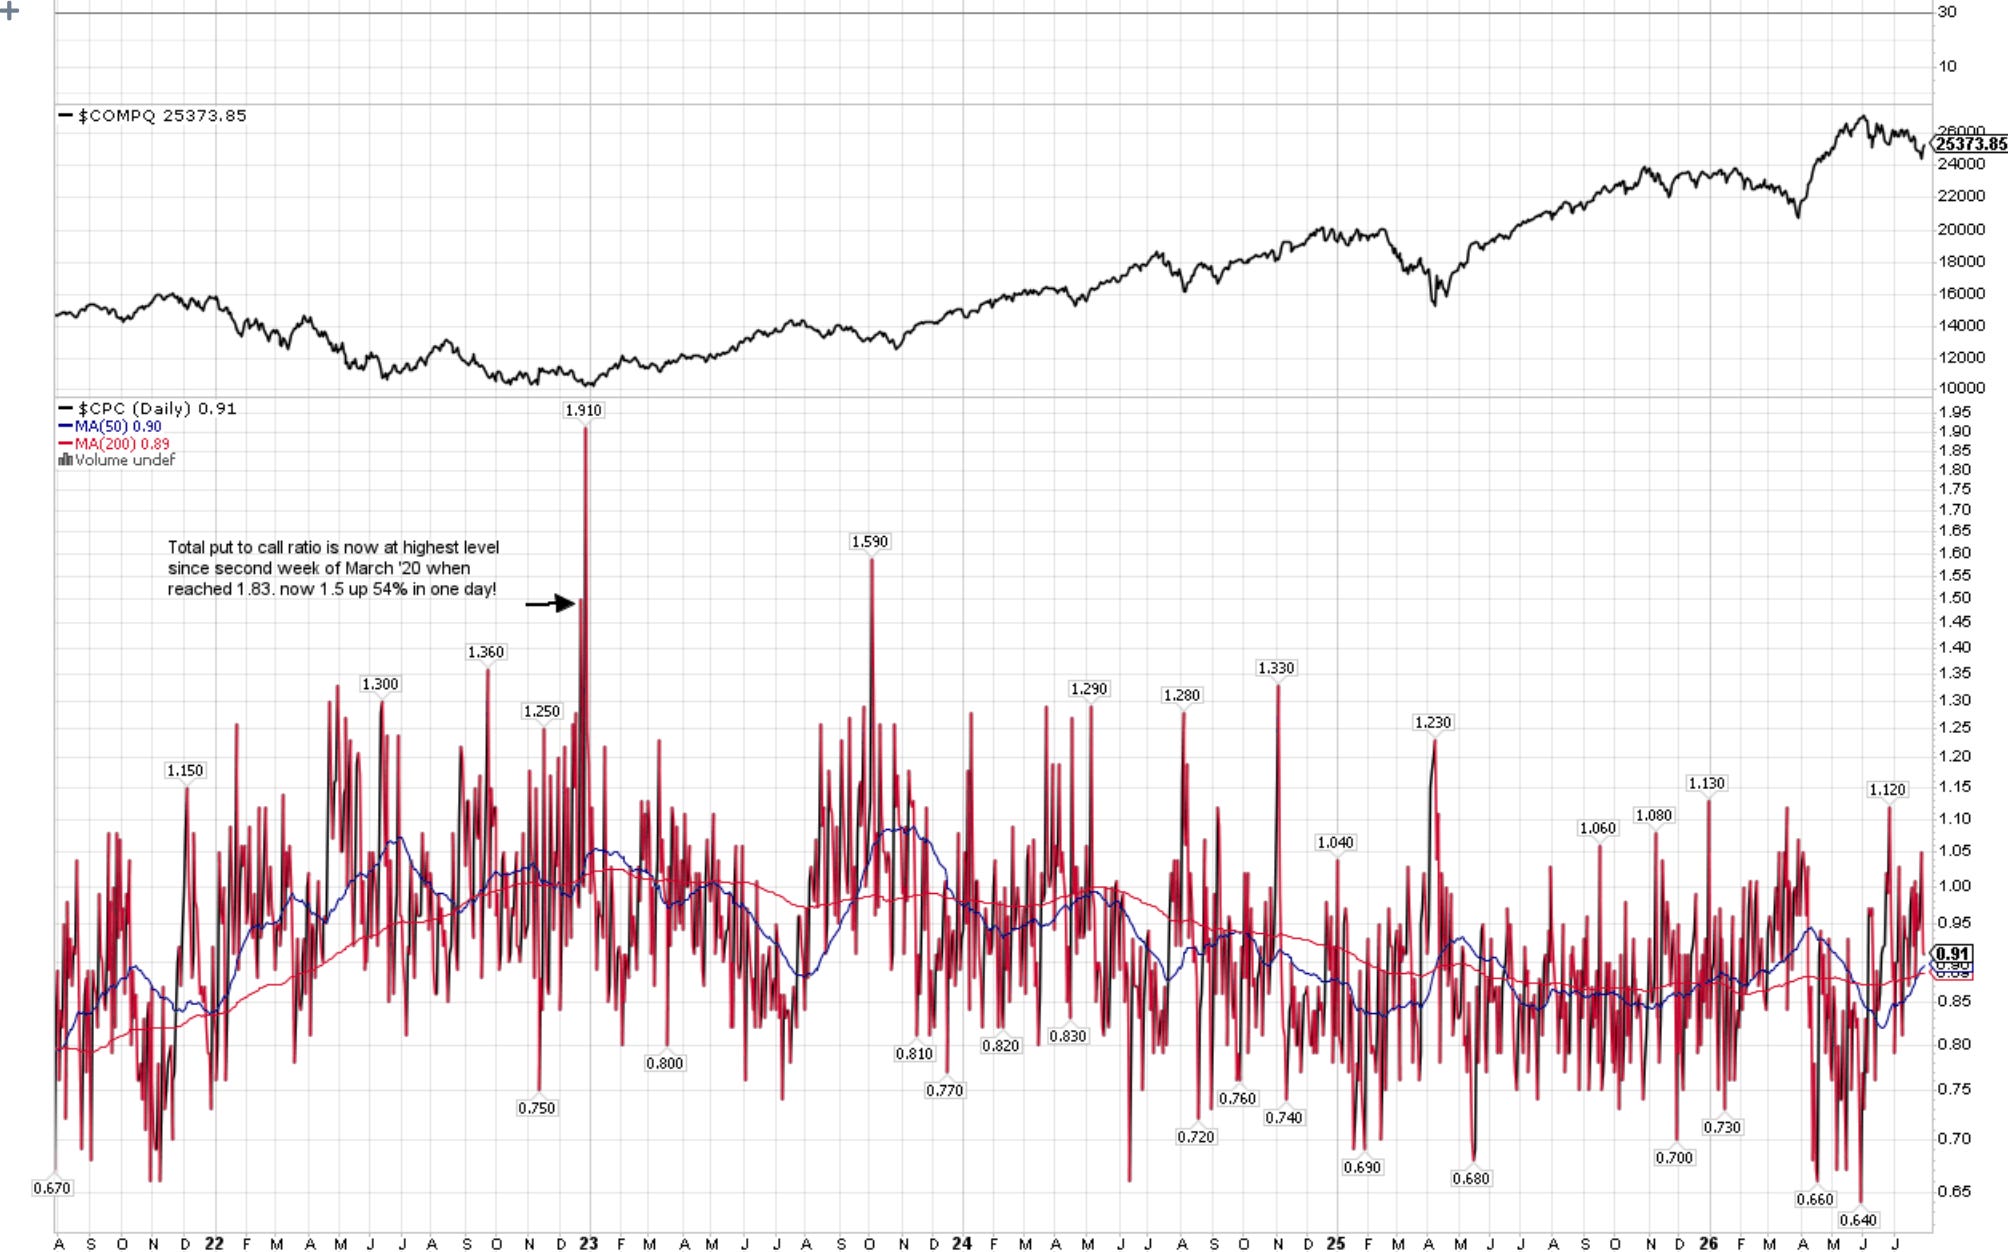
CPC (Put to Call Ratio): 0.91. Note >1 can indicate Fear and >1.5 can be Extreme.
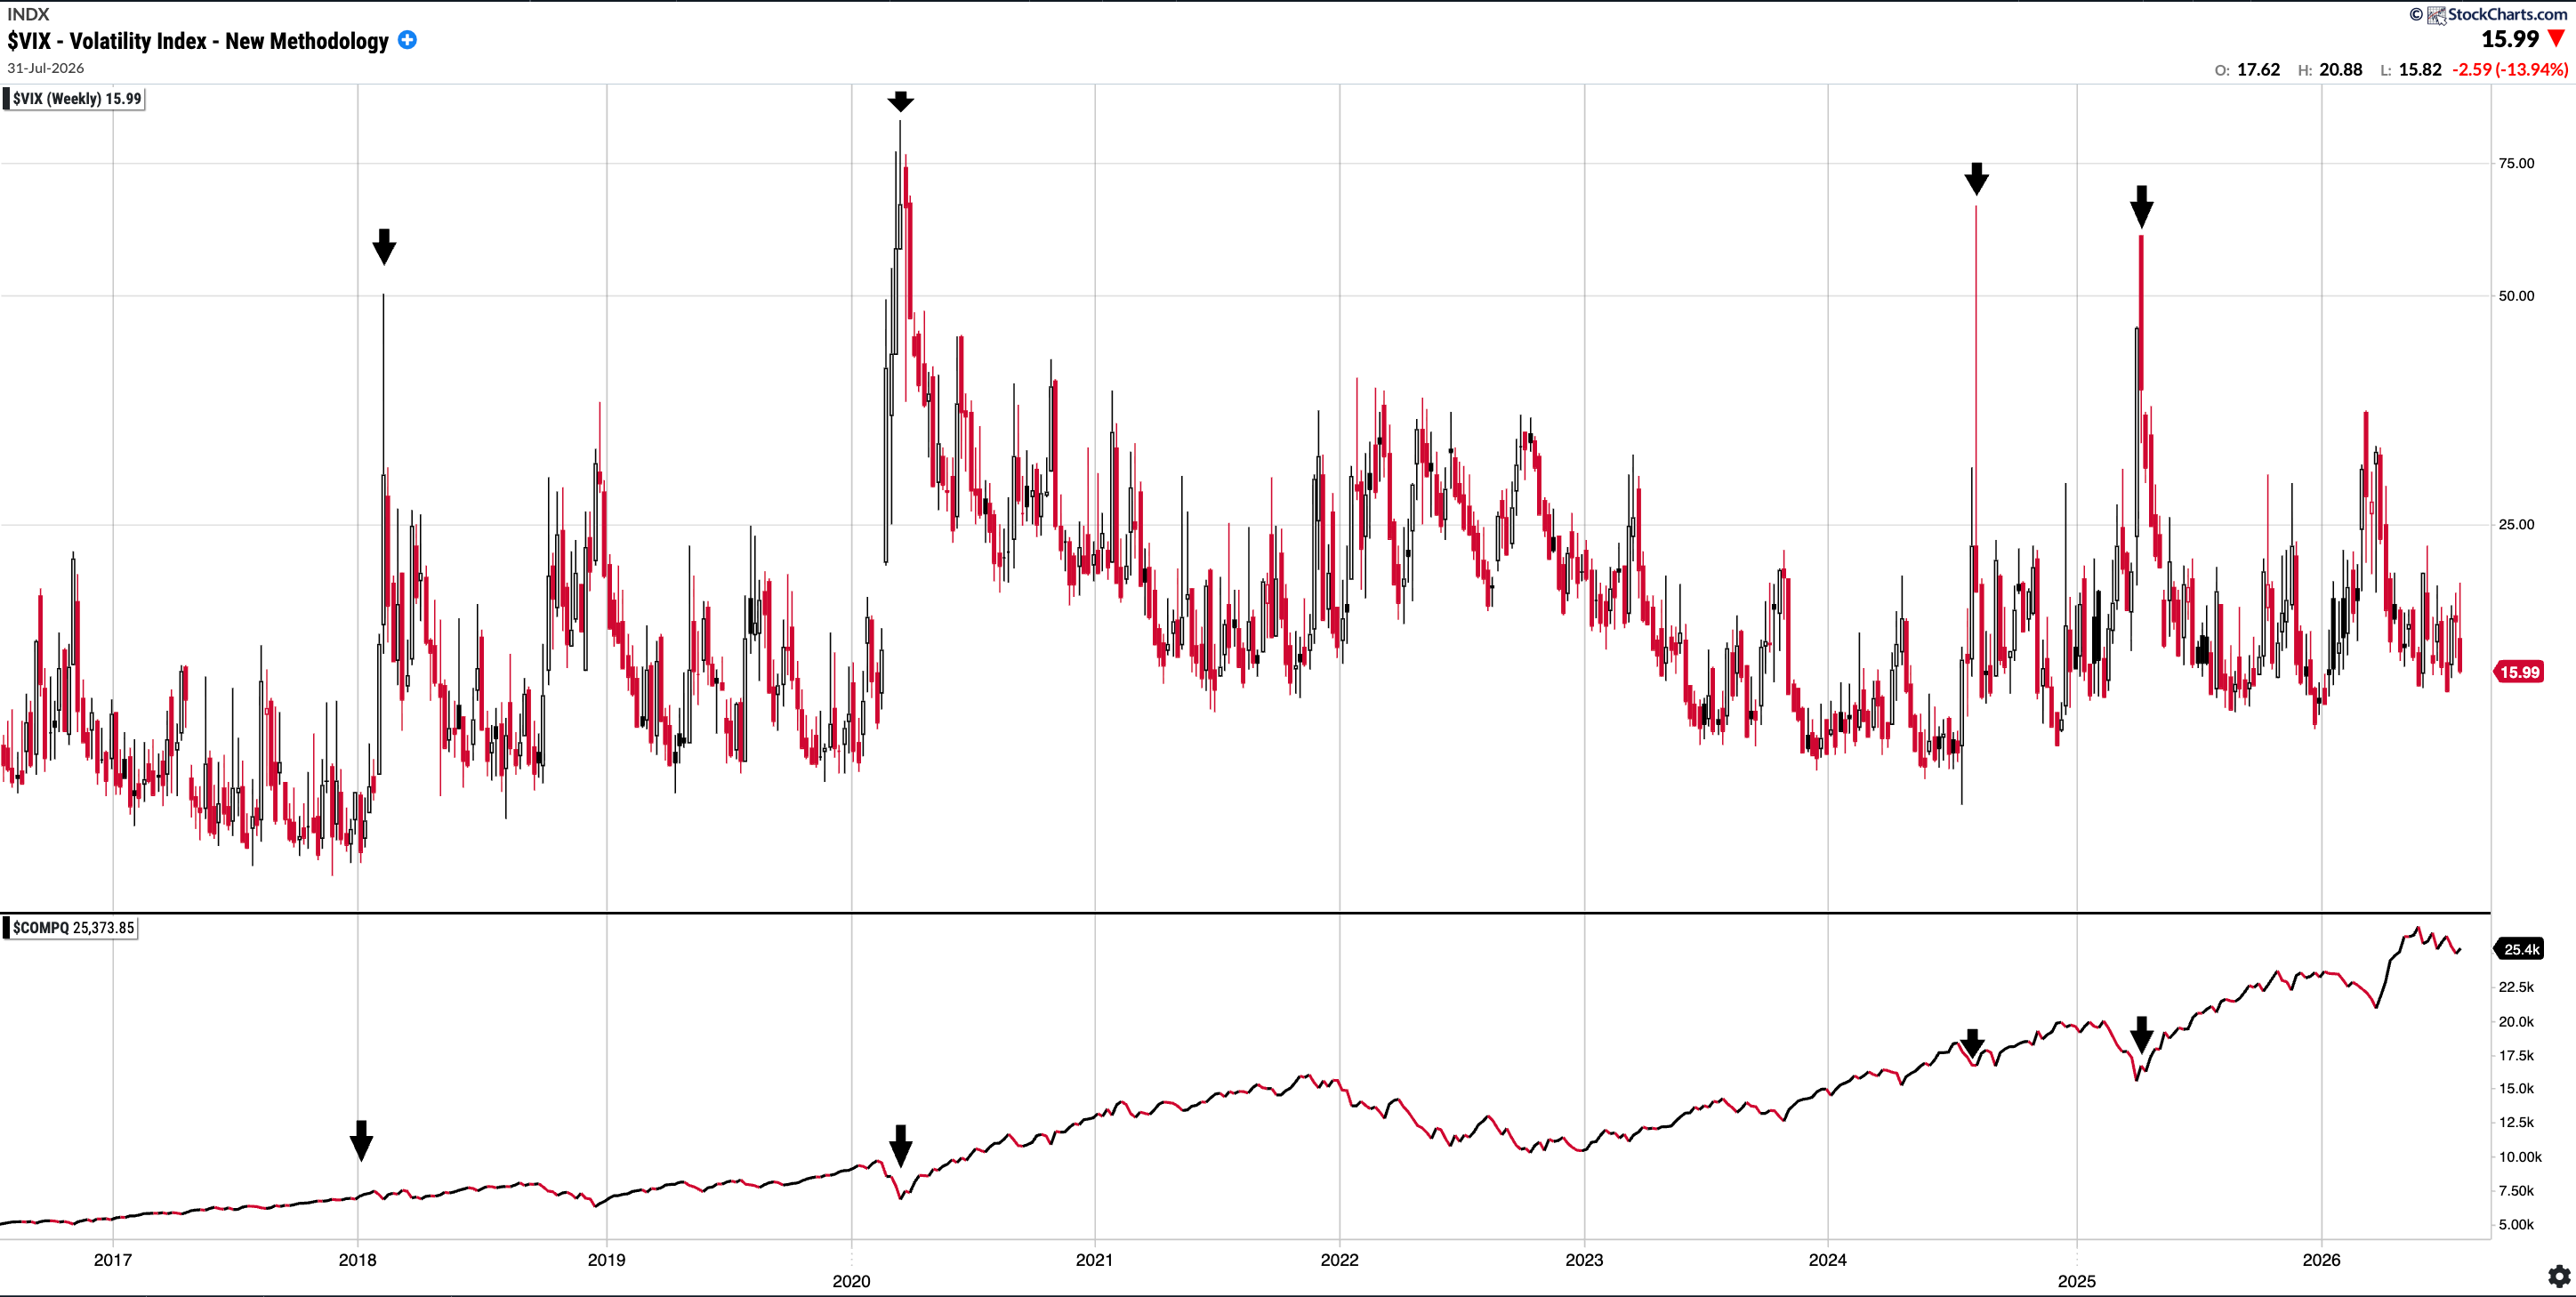
VIX: 15.99. I have included a chart below showing the VIX over time and Nasdaq Comp underneath it: you can see that extreme readings have always been a buying opportunity in the medium term.
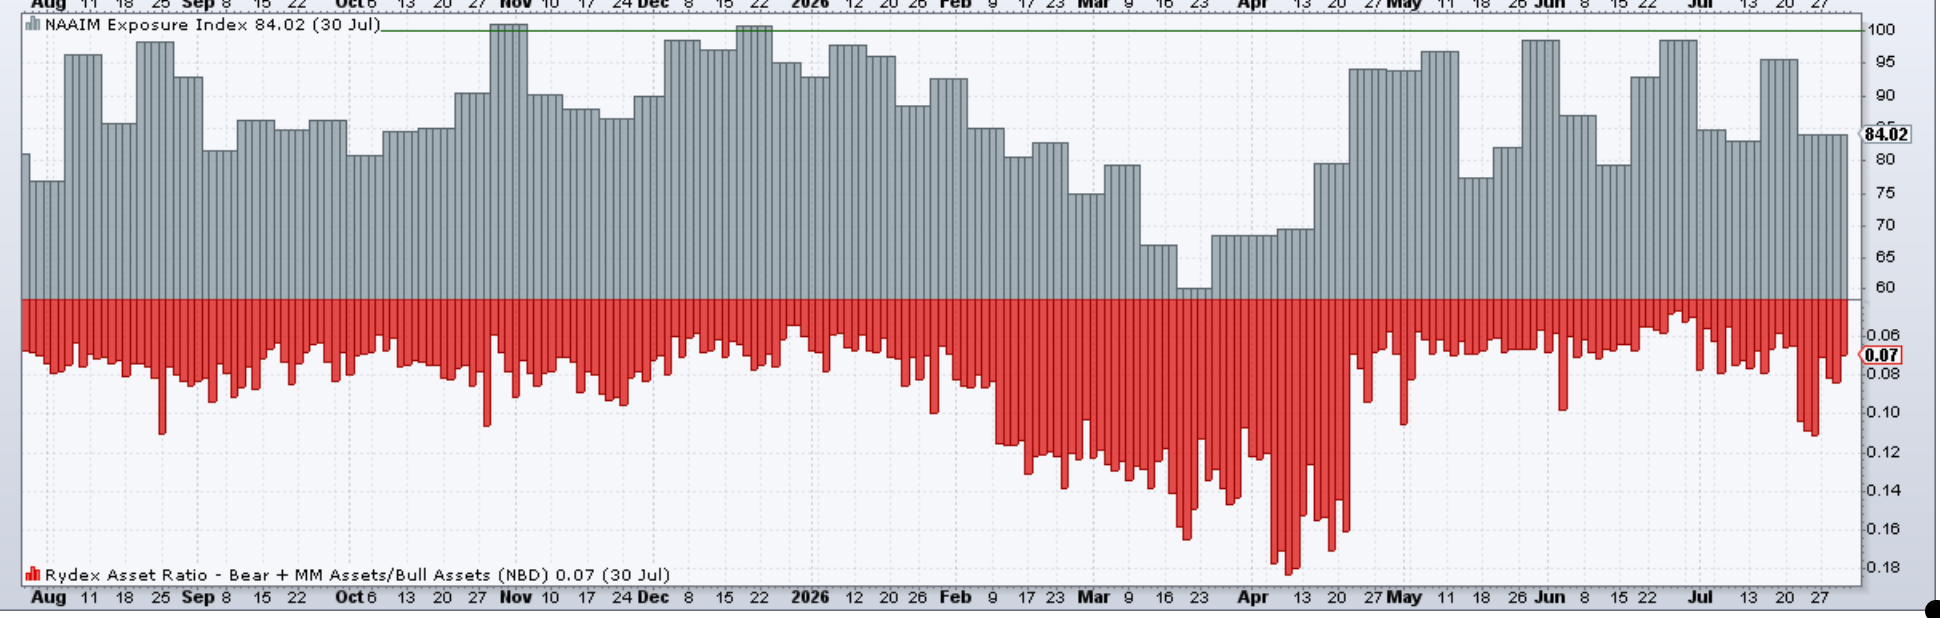
NAAIM Exposure Index: 84.02 from 84.69 last month. Note it did get into the low 30’s in April 2025 (!)
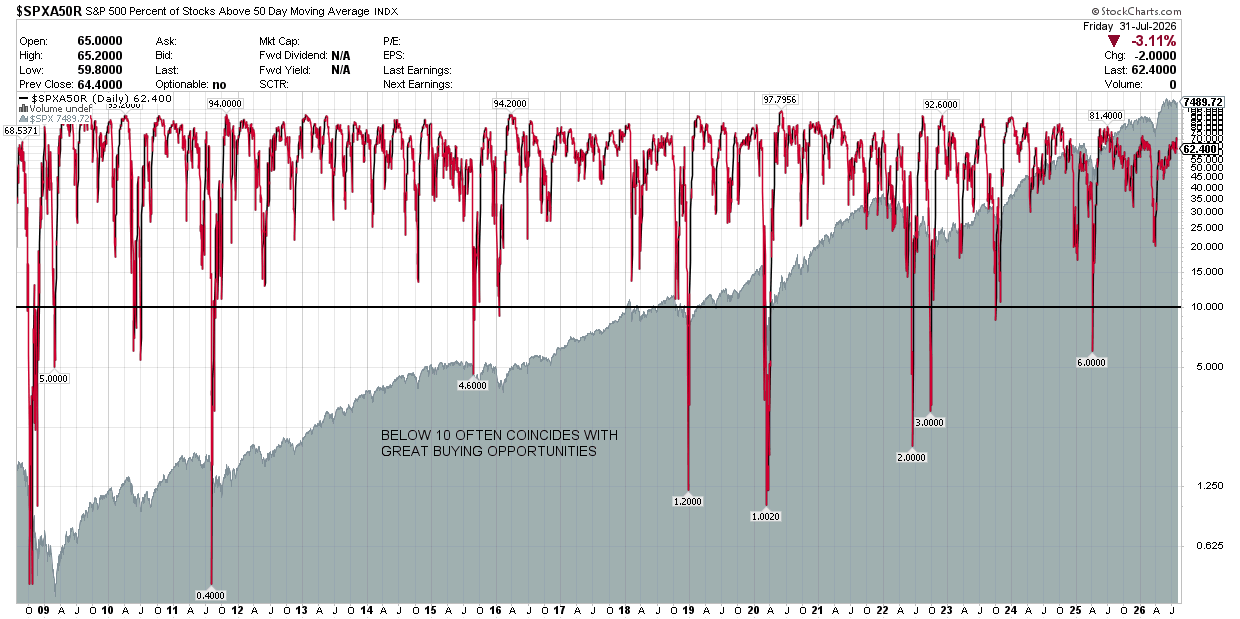
S&P 500 Percentage of Stocks Above the 50 Day Moving Average: 62.4% (<10 tend to be great buying opportunities)
Fear and Greed Index (CNN): currently reads 42 which is in the ‘Fear’ zone. At the end of March it was 19 supposedly in the ‘Extreme Fear’ zone.
Consolidated Performance across Investment Account: YTD and since Inception of SixSigmaCapital (Equities only as of Sunday 2nd August)
2023: +94%
2024: +61%
2025: +57%
2026: +14.5% (with trading account gains it would be +21.2%)
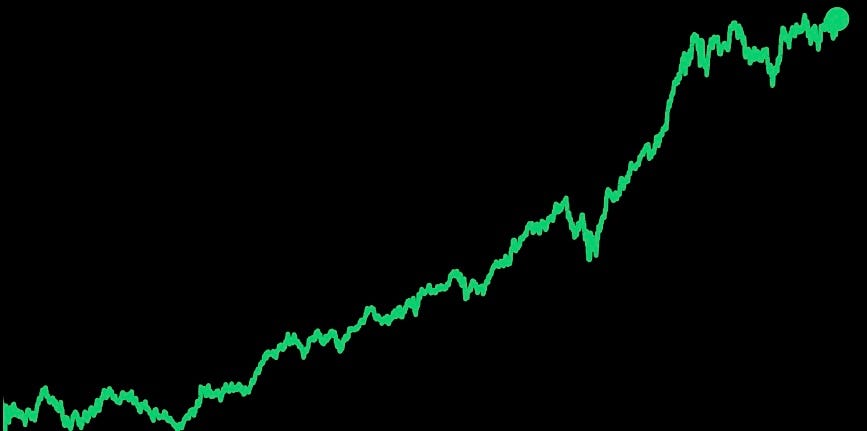
TWR since Inception of SixSigmaCapital is thus +461.48% or just over a 5.6x of the portfolio. The CAGR is 61.79%
TWR +455.94% vs S&P 94.90%.
TWR of S&P 500 in the same period is +105% or a 2.05x return.
SixSigmaCapital has achieved a +356.48% outperformance in that time period. (My overall 8 year CAGR including numbers prior to SSC sits at around low 40%)
I remain pleased overall, as risk adjusted these results are very sound. Furthermore, all moves were disclosed in real time.
Equity curve since switching to my current brokerage in the last few years is below:
SixSigmaCapital Trading Account:
At the start of the year, I opened a dedicated trading account for active strategies. It was initially approximately 10% the size of my primary investment account, though has grown somewhat since then (now around 16% the size of the main book). The account is managed with a trading mindset and consists mostly of common shares, though I have utilised select options strategies.
The past month was not a strong one for the account, as it underwent a decent drawdown, pulling back from +85% to +67%. The areas to work on were to take fewer trades in a poor environment and to size them smaller, given many of my normal-sized ones got stopped. However, the positive was that I proactively maintained a high cash position throughout the month and thus did not give back an excess amount of performance.
Trading Account YTD: +67% YTD
If combined to the investment account, it would add 6.7% to the total performance.
Featured Quote:
“If investing is entertaining, if you're having fun, you're probably not making any money. Good investing is boring” George Soros
Current Positions in Size Order with Cost Basis (Investment Account) as of August 2nd 2026
