

I hope you are well. Below, we provide market commentary and an in-depth portfolio update.
Format for what is covered in this Monthly Portfolio Update:
Market Thoughts
Indices Review
Key Indicators
SixSigmaCapital Performance: YTD and since Inception
Featured Quote
Current Portfolio Holdings:
Sizing | Cost Basis | Timeframe | Planned Moves
Closing Thoughts
If it is your first time here, ensure to check out what SixSigmaCapital readers are saying below:

For all readers a reminder that a premium subscription includes:
Live Portfolio updates (All Buys and Sells) in Subscriber only Channels
Favourite set-up Ideas, Market Memos plus Full archive
Monthly in depth portfolio & performance updates
Annual Tier: Discord access for live trading account updates and AMAs.
Upgrade to a premium subscription via the link below:
Market thoughts:
Equity markets had a very volatile month in October, with the Dow, S&P 500 and Nasdaq Composite posting month-over-month returns of +1.7%, -0.9% and -5.3%, respectively. The divergence came almost entirely from the AI trade. Semiconductors bore the brunt of it, with the SOXX ETF falling 17% on the month, as concerns grew over funding the AI buildout. This was further exacerbated by mixed earnings results from the top AI names.
For the last several months, I have been writing in this letter:
“There tends to be a large drawdown in the S&P 500 within the 12 months preceding election day. I do not know whether it will be Fed-related, a policy shock by the White House, or an economic downturn that triggers the drawdown (or something else entirely), but I think it is very likely we will see one given the way markets are behaving”
Against this backdrop, while our portfolio reached all-time highs earlier in the month building on momentum from August and September, the portfolio finished down approximately 8% month-over-month. With the broader AI complex looking stretched heading into earnings season, our primary objective shifted toward risk mitigation, disciplined profit-taking, and maintaining a sizeable cash cushion.
Several preemptive moves shielded capital from severe downside. Most notably, we completely avoided some steep tape-bombs by exiting ServiceNow (NOW) for a +63% gain ahead of earnings and liquidating Intel (INTC), with both names plunging more than 30% in the days following our exits. Alongside these defensive cuts, we locked in profits by closing out Cipher Mining at $19 (now 7), Credo Technology (CRDO) at $229, and Qualcomm (QCOM) at $179. Finally, we leaned into strength across SK Hynix (SKHY) after its record quarter and Eli Lilly (LLY) following its post-earnings breakout to new highs, trimming both positions down to house shares to let the remainder run risk-free.
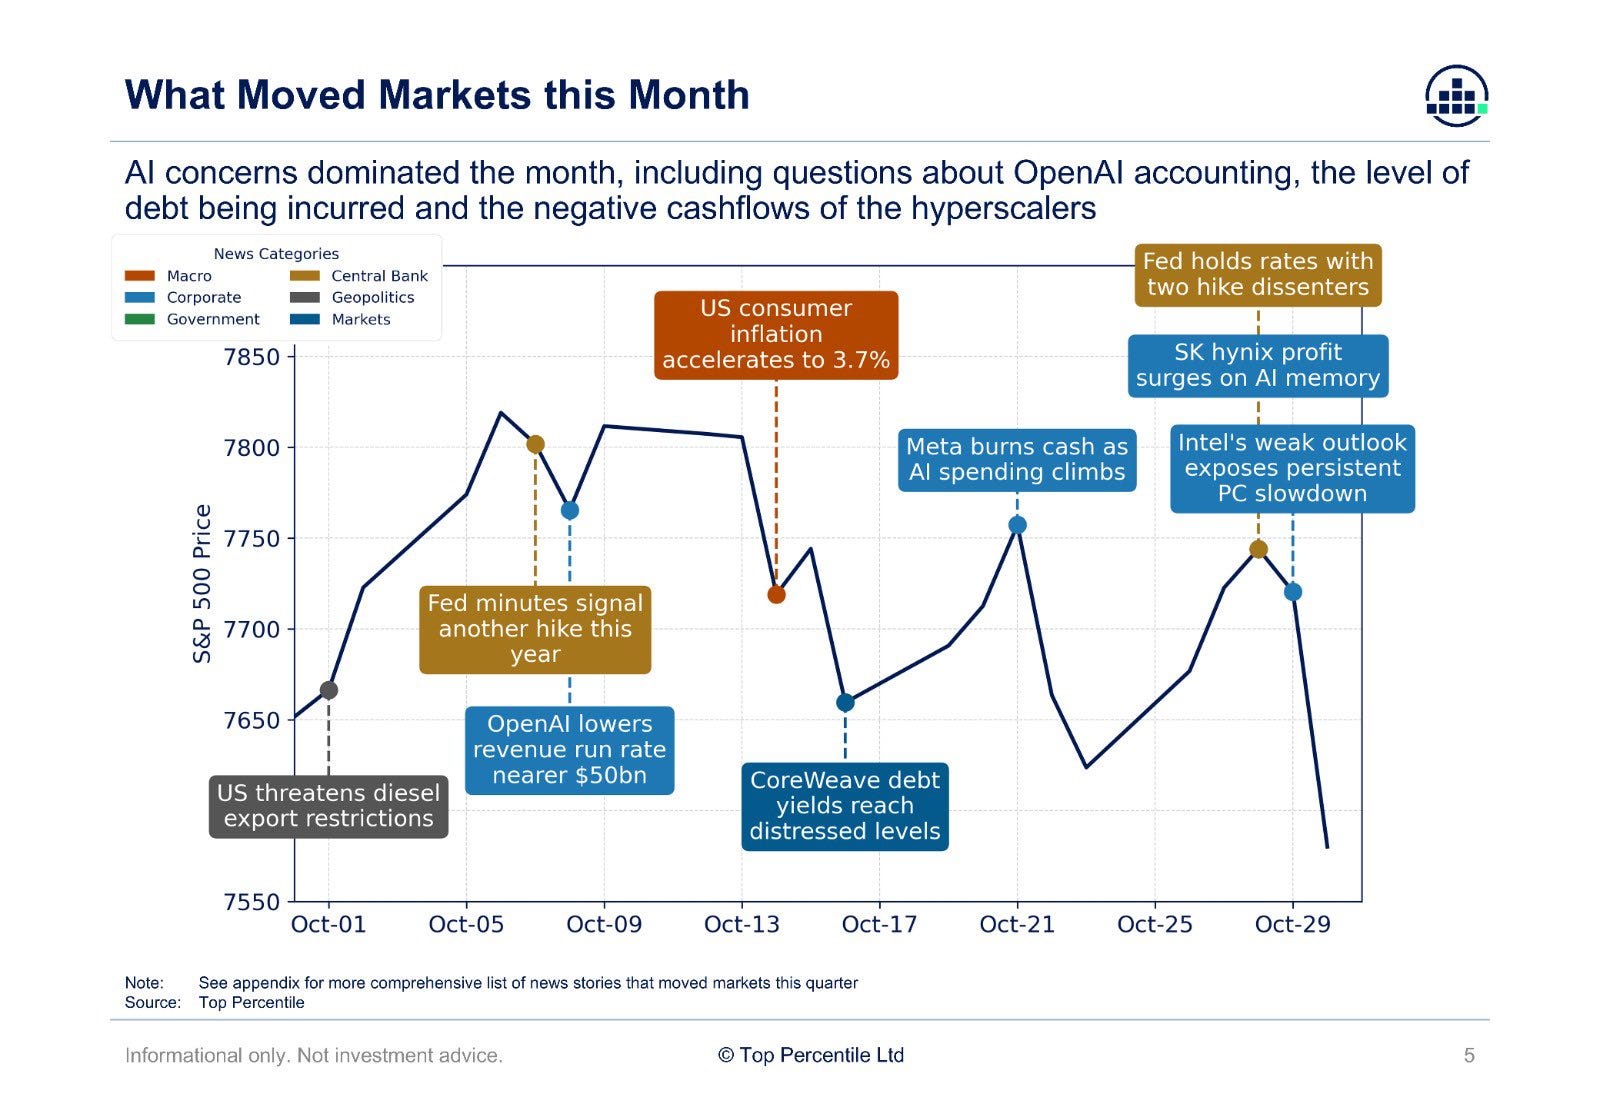
The image below succinctly shows what else moved equity markets in October:
YTD Market Recap
Before looking ahead to the fourth quarter, it is helpful to frame the recent price action within the context of the year so far.
After climbing a wall of worry for most of the prior year, broader indices fractured in March: the S&P 500 pulled back over 9% peak-to-trough, and the Nasdaq dropped 13%. A historic rebound followed from late-March lows through May, with the S&P 500 gaining over 15% (1,300+ points) and the Nasdaq surging more than 30% (6,300+ points). Semis and the broader tech supply chain led the move, the SOXX ETF peaked in mid-June at >110% above its March lows, pushing the sector to record overbought territory.
June and July were defined by significant rotation. Following a brutal June, the Mag 7 rebounded sharply in July while overbought AI infrastructure and semiconductor trades cooled off. Meanwhile, hyperscalers, energy, and financials demonstrated broad-based strength.
Taking advantage of the hyperscaler rally, we systematically trimmed exposure across core holdings. In Alphabet and Amazon, we cleared out higher-cost tax lots to let our house shares run unburdened. We locked in profits on Microsoft too, capitalising on our aggressive buying when we averaged up during the spring sell-off. Concurrently, we took advantage of the “Leopold AI” dip to scoop up oversold names, quickly flipping several positions for short-term gains.
August and September were robust months for the SSC portfolio. Key highlights included Twist Biosciences hitting 7-bagger status since our initial live entry, software strength lifting MSFT and NOW, lightening up our AI exposure into the AI infrastructure bounce, and a strong month-end
October:
The month started strongly, with the S&P 500 and Nasdaq both making all-time closing highs on October 6. From there, the AI trade came under sustained pressure. Meta turned free cash flow negative for the first time in its history on record capex, Lam Research’s 2027 spending outlook fell short of bull-case projections, and the final week brought a heavy slate of big tech earnings:
Alphabet: missed on revenue and earnings and fell 12.6%, despite Google Cloud revenue more than doubling.
Amazon: missed and guided below estimates while holding 2026 capex at about $220 billion. AWS growth accelerated to 39%.
Intel: beat on the quarter, but its weak guide sparked an AI-wide sell-off on Friday, with SOXX down 8.2% on the day.
Demand for AI held up, with Azure up 48%, AWS up 39% and SK Hynix posting an 80% operating margin, but the market focused on the cost of delivering it.
The Fed held rates at 3.75% to 4.00% following September’s hike, with two members dissenting in favour of another increase. Bitcoin fell 9% on the month. Brazil (EWZ) dropped nearly 20% in a single session after the presidential runoff.
The charts below illustrate sector performance over the last three months and year-to-date (YTD), respectively:
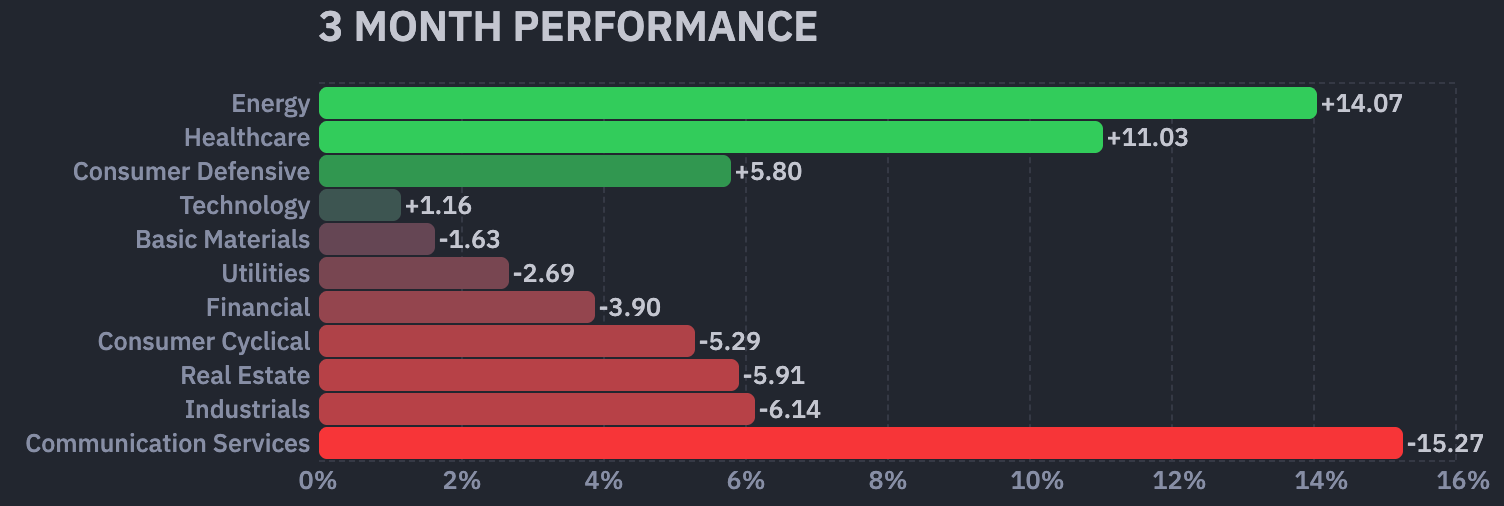
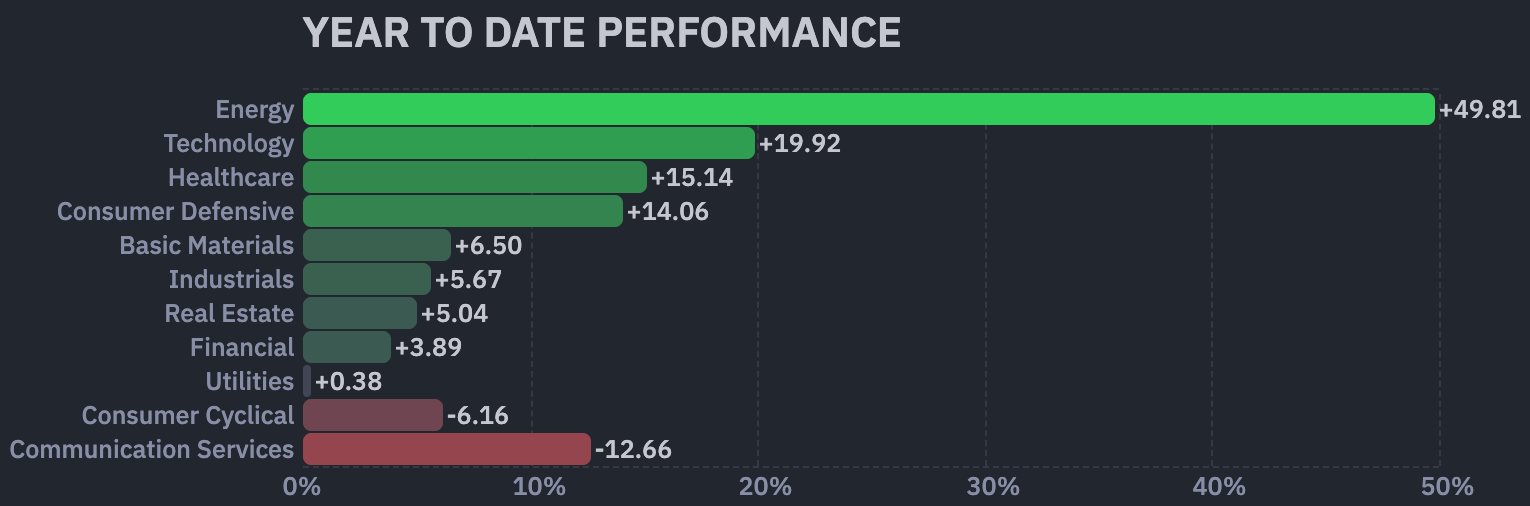
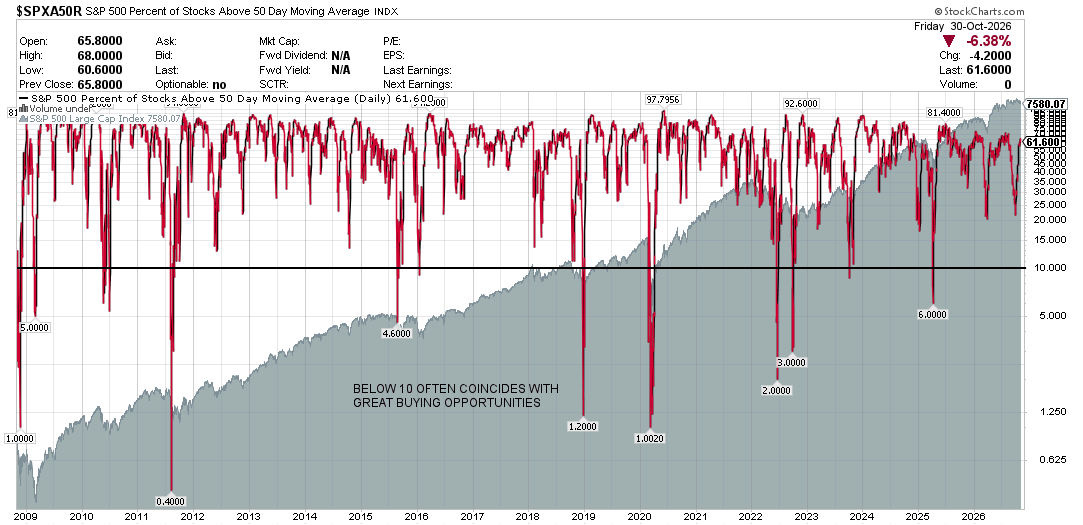
Looking ahead, the market appears to anticipate continued volatility around the midterm elections on November 3 and the Fed’s December 8-9 meeting, where markets are currently pricing roughly a 70% chance of another quarter-point hike. Market breadth has broadened meaningfully since last month: the percentage of stocks trading above their 50-day moving average recovered from 21% to around 60% in October. Taken alongside the sharp sell-off in semiconductors, this suggests capital is rotating out of the crowded AI trade and into the broader market, rather than a wholesale move to risk-off.
The macroeconomic backdrop remains challenging. Inflation re-accelerated in September, with headline CPI rising to 3.7% and headline PPI to 6.3% year over year, driven largely by energy. Crude oil climbed a further 15% in October, with WTI rising from roughly $90 to $104 a barrel on geopolitical developments. One interpretation is that sticky inflation, further Fed tightening and growing concerns over how the AI buildout is financed set the stage for more downside. Conversely, the 10-year Treasury yield fell from 5.29% to 4.93% over the month even as the Fed held a hawkish line. If that continues and crude oil cools even slightly, the improving breadth could support a rally into year-end.
While the near-term macroeconomic outcome remains uncertain, the portfolio remains positioned long though cash position has grown to >15% following this month’s moves. This balanced approach ensures we stay nimble and opportunistic as market conditions remain volatile. I continue to advise caution while the major indices trade below their 50-day moving averages.
Inflation:
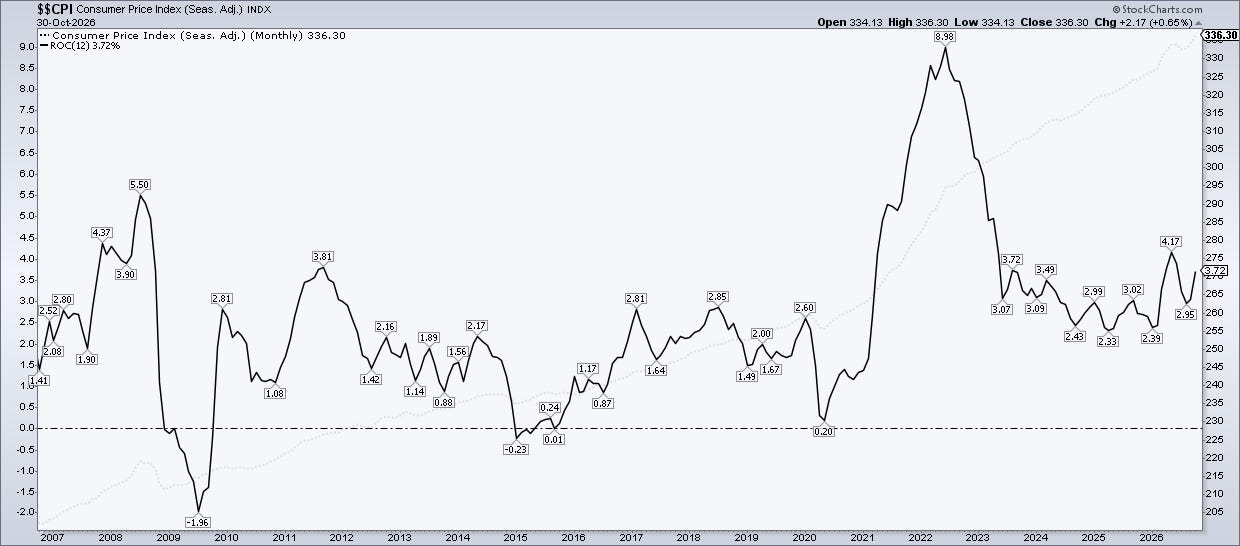
CPI: The September 2026 CPI data is presented below:
Headline CPI increased 3.7% YOY vs expectations of 3.6% YOY.
Headline CPI increased 0.6% MOM vs expectations of a 0.6% increase MOM
Core CPI increased 2.6% YOY vs expectations of 2.5% YOY.
Core CPI increased 0.3% MOM vs expectations of a 0.2% MOM
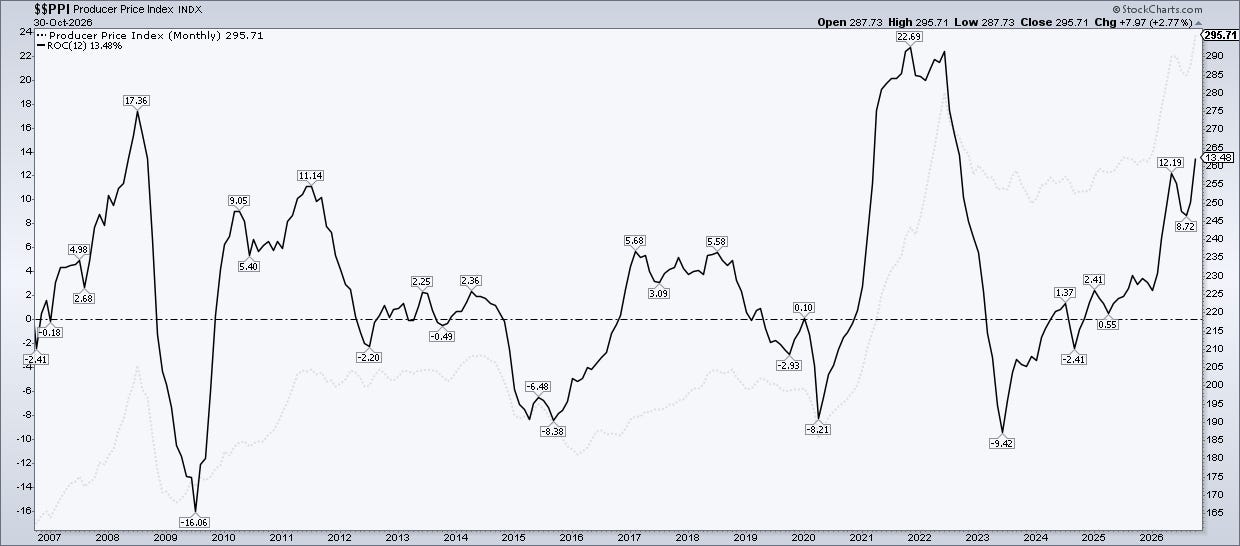
PPI: The September 2026 PPI (final demand) data is presented below:
Headline PPI increased 6.3% YOY vs expectations of 5.5% YOY
Headline PPI increased 1.3% MOM vs expectations of 0.6% MOM
Core PPI increased 5.0% YOY vs 4.4% YOY
Core PPI increased 0.5% MOM vs 0.3% MOM
Below I have included charts showing the trend for both CPI and PPI:
PCE: With regards to the PCE price index (the Fed’s preferred metric), September ‘26 data came in line with expectations on both the headline and core, though inflation picked up again from August.
Headline PCE increased 3.6% YOY vs expectations of 3.6% YOY.
Headline PCE increased 0.5% MOM vs expectations of 0.5% MOM.
Core PCE increased 3.1% YOY vs expectations of 3.1% YOY.
Core PCE increased 0.3% MOM vs expectations of 0.3% MOM.
For context, headline PCE rose from 3.4% in August, driven largely by energy, mirroring the jump in September’s CPI and PPI. Core PCE is now 1.1 points above the Fed’s 2% target. The October CPI (November 10) and the October jobs report (November 6) are the key data points ahead of the December 8-9 FOMC.
October 2026 FOMC Meeting
At the most recent FOMC meeting on October 27-28, 2026, the committee decided to hold interest rates steady, following September’s 25-basis-point hike, keeping the target range for the federal funds rate at 3.75% to 4.00%. The committee said that “the accumulation of more information will help the Committee determine the policy stance appropriate to ensure a timely return of inflation to the Committee’s 2 percent goal”.
Unlike September’s unanimous decision, the vote was 10-2, with Lisa D. Cook and Beth M. Hammack dissenting in favour of a further 25-basis-point hike. In his press conference, Chair Warsh said economic growth has strengthened and the labour market remains “quite positive”, but that “inflation is too high”, with energy prices moving higher again in recent weeks. As a result, the committee’s discussion focused mainly on the price stability side of its mandate. On financial conditions, Warsh said they have tightened since September’s hike, but that he is “unwilling and unable to call them tight”, and he described the tightening as a sign that policy is working. He declined to give any guidance on December, saying he does not believe in forward guidance in normal times, but noted the committee has made clear its “readiness to act as circumstances require”. Asked whether the midterm elections played a part, he said politics played no role in the decision. Warsh also announced that from 2027, one FOMC meeting a year will be dedicated solely to monetary policy strategy, with no rate decision or statement.
The Committee reaffirmed its firm stance once more, stating: “The Committee will deliver price stability”. The statement upgraded its description of economic activity to “expanding at a strong pace”, from “solid” in September, adding that “productivity growth is strong, and capital investment is robust”. Job gains “have kept pace with the workforce”, while “inflation remains elevated”.
The data since the meeting has backed up the committee’s view of a strong economy. Q3 GDP grew at a 3.4% annualised rate (up from 2.2% in Q2), and September’s PCE came in line with expectations. Markets are pricing roughly a 70% chance of a 25-basis-point hike at the December 8-9 meeting per CME FedWatch, which will also include an updated Summary of Economic Projections. Meanwhile, the 10-year Treasury yield ended October at around 4.93%, down from 5.29% at the end of September.
Indices:
S&P 500
Currently trades at $7,580.07 (10.52% YTD)
It is 1.52% below the 50SMA.
Trading at 23.55x trailing earnings and 19.25x forward earnings
Nasdaq Composite:
Currently trades at $25,437.00 (9.47% YTD)
It is 4.28% below the 50SMA.
Trading at 29.92x trailing earnings and 21.37x forward earnings (per WSJ for the QQQ)
Key Indicators:
10 Year T-Note: 4.93. It has increased by 18.40% YTD
British Pound vs USD: 1.339 and is down -0.56% YTD.
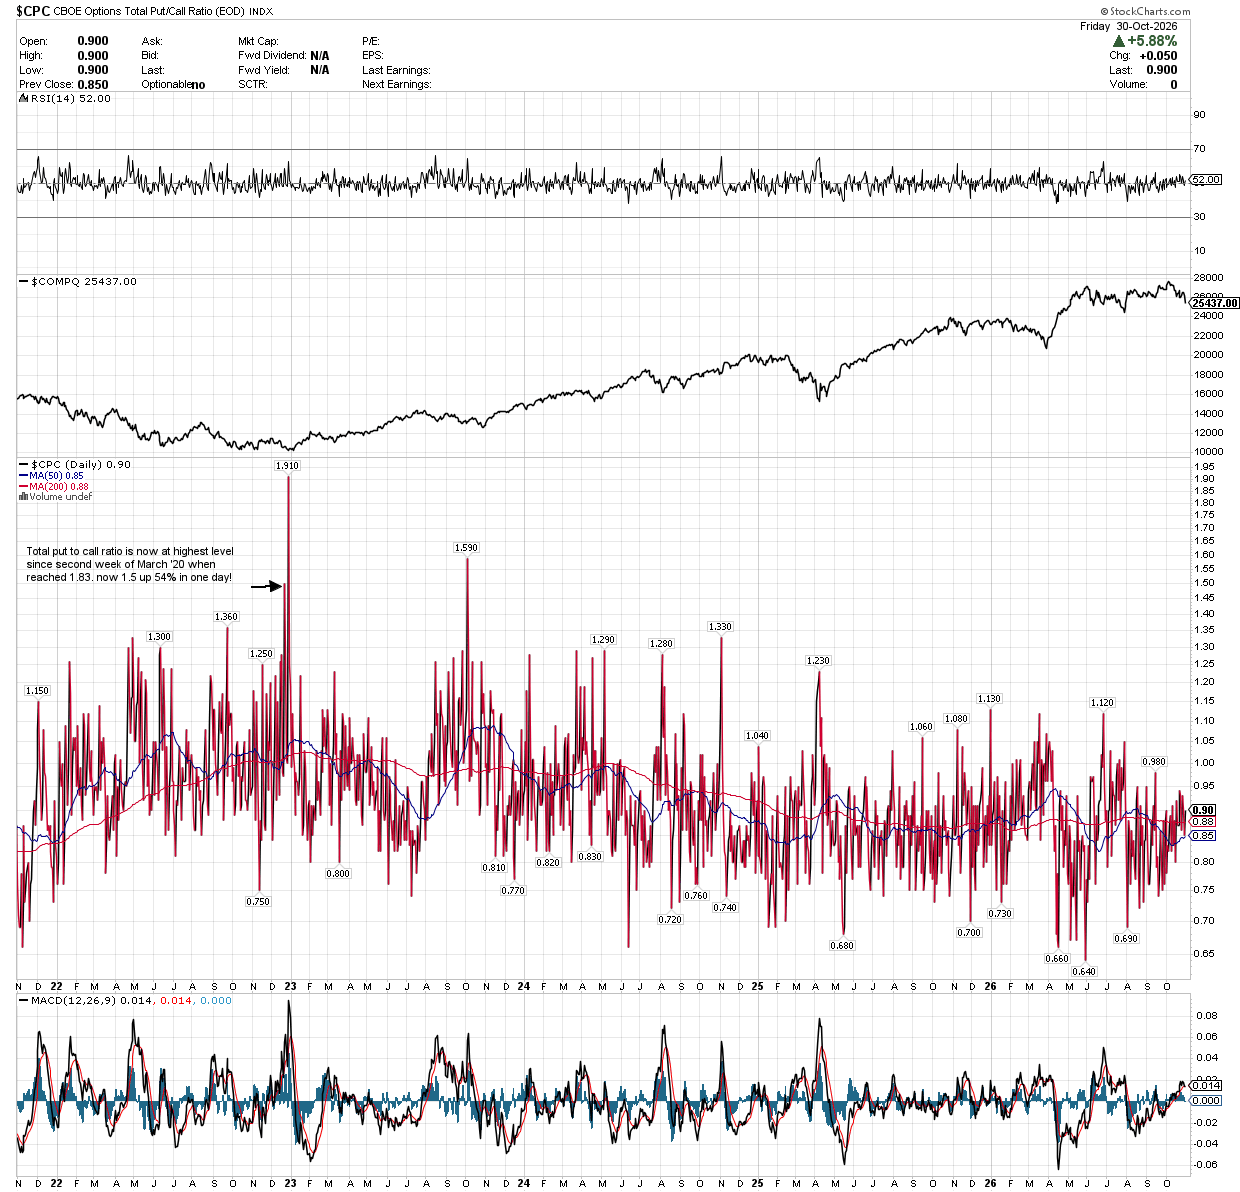
CPC (Put to Call Ratio): 0.90. Note >1 can indicate Fear and >1.5 can be Extreme.
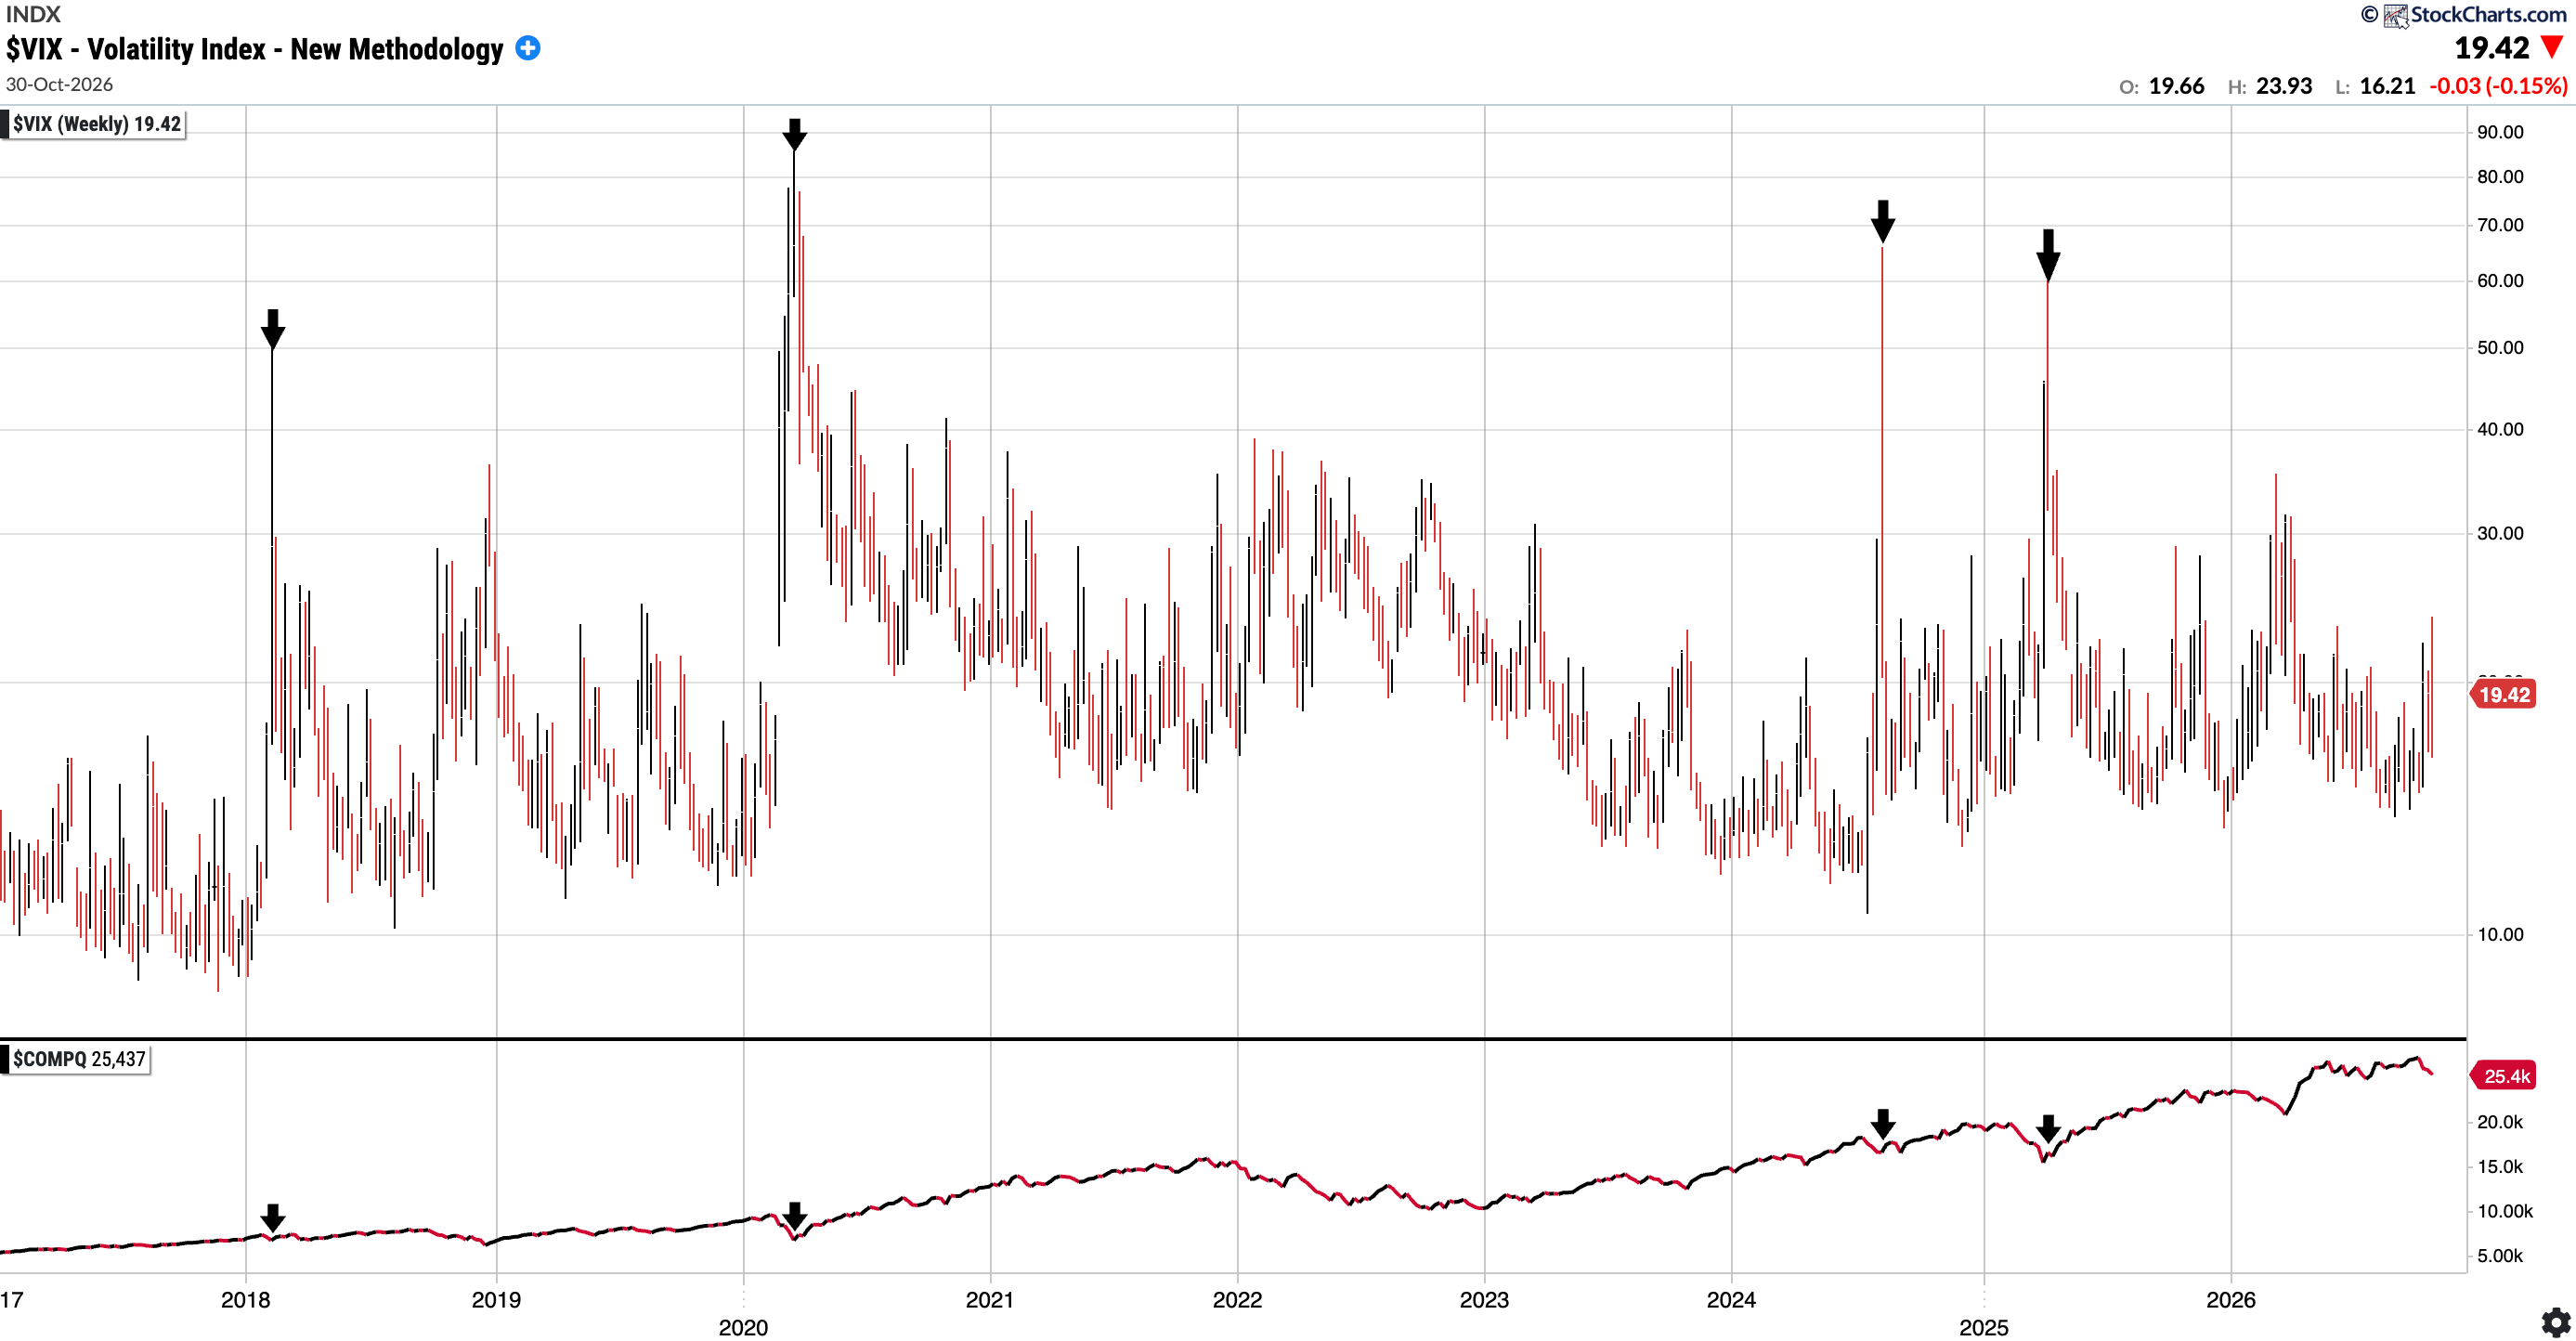
VIX: 19.42. I have included a chart below showing the VIX over time and Nasdaq Comp underneath it: you can see that extreme readings have always been a buying opportunity in the medium term.
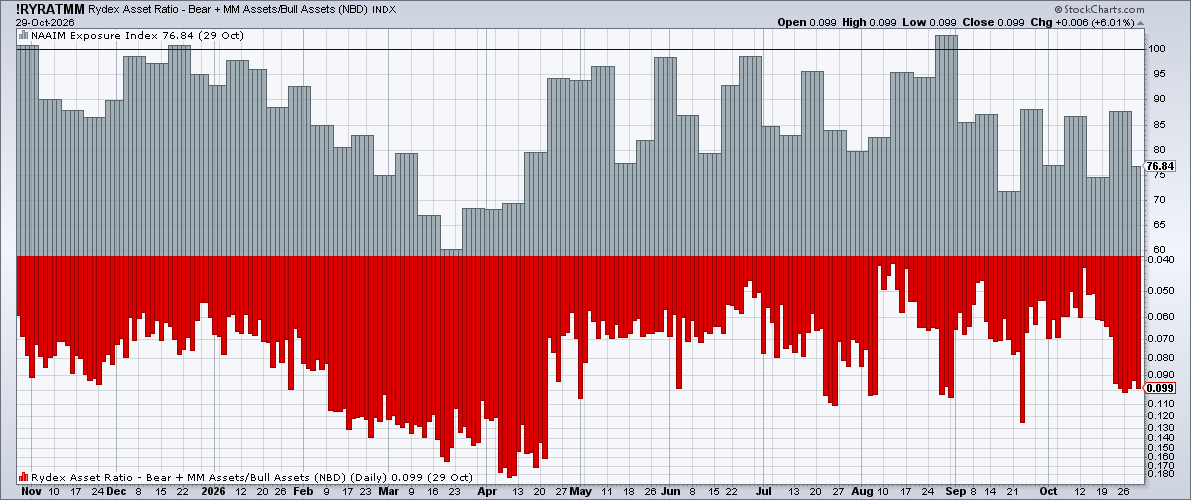
NAAIM Exposure Index: 76.84 from 85.612 last month. Note it did get into the low 30’s in April 2025 (!)
S&P 500 Percentage of Stocks Above the 50 Day Moving Average: 61.60% (<10 tend to be great buying opportunities)
Fear and Greed Index (CNN): currently reads 26 which is in the low end of the ‘Fear’ zone, bordering Extreme Fear. At the end of March it was 19 supposedly in the ‘Extreme Fear’ zone. We might see the index drop down there again this upcoming week.
Consolidated Performance across Investment Account: YTD and since Inception of SixSigmaCapital (Equities only as of October 30th)
2023: +94%
2024: +61%
2025: +57%
2026: +10.77% (with trading account gains included it would be +16.50%)
TWR since Inception of SixSigmaCapital is thus +443.19% or just over a 5.4x of the portfolio. The CAGR is 55.60%
TWR +443.19% vs S&P 108.01%.
SixSigmaCapital has achieved a +335.18% outperformance in that time period. (My overall 8 year CAGR including numbers prior to SSC sits at around low 40%)
I remain pleased overall, as risk adjusted these results are very sound. Furthermore, all moves were disclosed in real time to paid subscribers.
SixSigmaCapital Trading Account:
At the start of the year, I opened a dedicated trading account for active strategies. It was initially ~10% the size of my primary investment account, though has grown somewhat since then (now around 14% the size of the main book). The account is managed with a trading mindset and consists mostly of common shares, though I have utilised select options strategies.
The account drew down from +71% to +57% YTD this month, despite holding more than 70% in cash.
Trading Account YTD: +57.32% YTD (YTD high was +91%)
If combined to the investment account, it would add 5.7% to the total performance.
Featured Quote:
“Opportunity comes to the prepared Mind” Charlie Munger
Current Positions in Size Order with Cost Basis (Investment Account) as of October 30, 2026:
Cash: 15.36% (Pounds Sterling)