
Preview of the Week Ahead
W/C August 25, 2025

Hope you all are having a good weekend. Below we will be previewing the upcoming week.
Format for what is covered in this weekly preview:
A look at the indices
Key upcoming economic events
Upcoming earnings reports
Interesting charts and setups
Notable portfolio changes from the previous week
Current Portfolio Holdings
If it is your first time here, check out the post below on how to navigate the SixSigmaCapital Website:

Indices
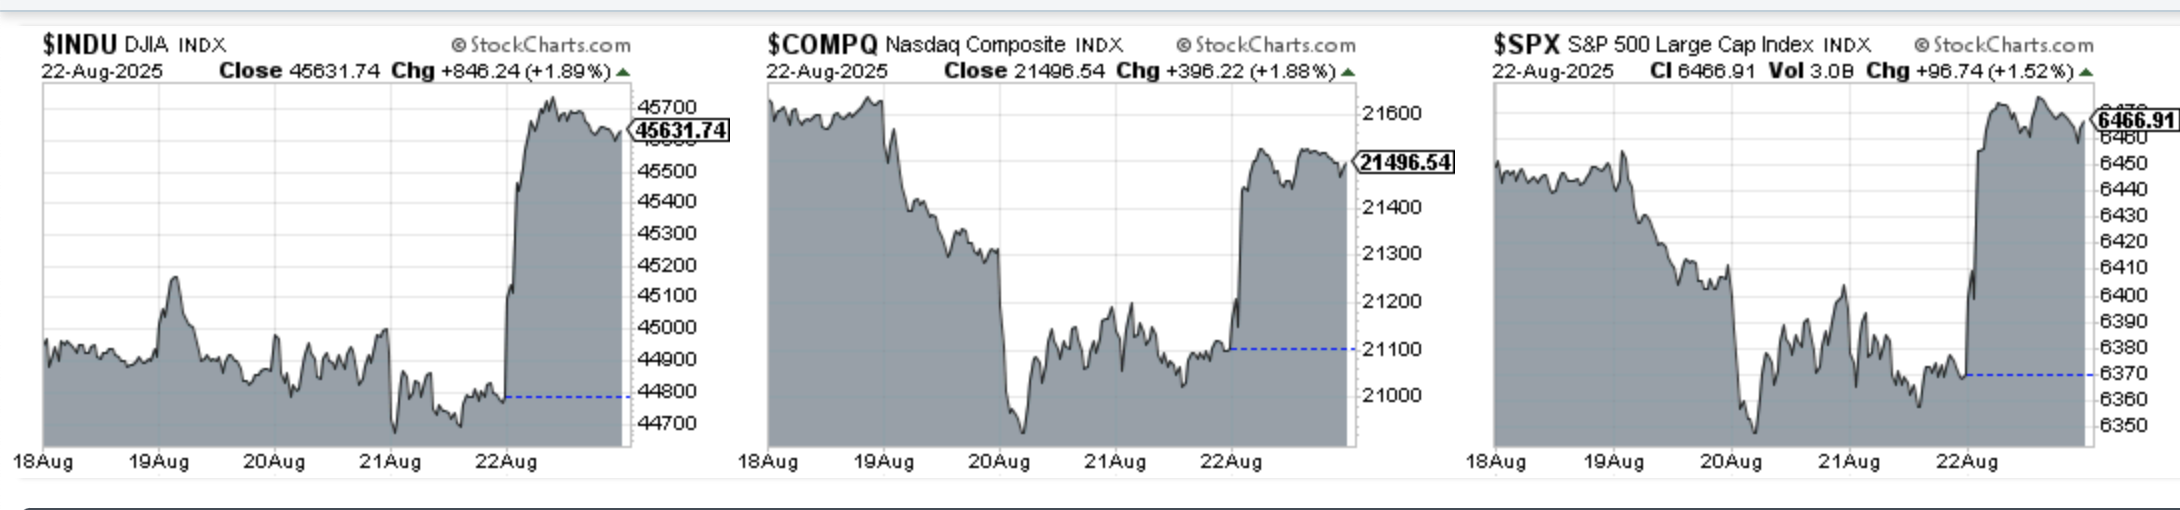
Dow Jones advanced 1.52% in the last week
S&P 500 advanced 0.26% in the last week
Nasdaq Composite decline 0.69% in the last week
IWM advanced 3.29% in the last week (Notable!)
Key upcoming events:
Monday, 25th August
Chicago Fed National Activity Index
Dallas Fed Manufacturing Index
Tuesday, 26th August
Durable Goods Orders
S&P/Case-Shiller Home Price Index
CB Consumer Confidence
Thursday, 28th August
Gross Domestic Product (GDP) Growth Rate - 2nd Estimate:
Markets will be watching closely to see if any significant revisions from the initial reading,
Pending Home Sales
Friday, 29th August
Core PCE Price Index: Note this is the Fed’s preferred Inflation metric!
Personal Income and Spending
University of Michigan Consumer Sentiment - Final Reading
Upcoming Earnings
Last week was a quiet one for the portfolio but this week there are a couple of Portfolio names reporting. Also, there is NVDA on Wednesday which is the main one traders will be watching to see if the AI trade has legs to run yet!
Below is the infographic by Earnings Whispers for the upcoming week:

Charts
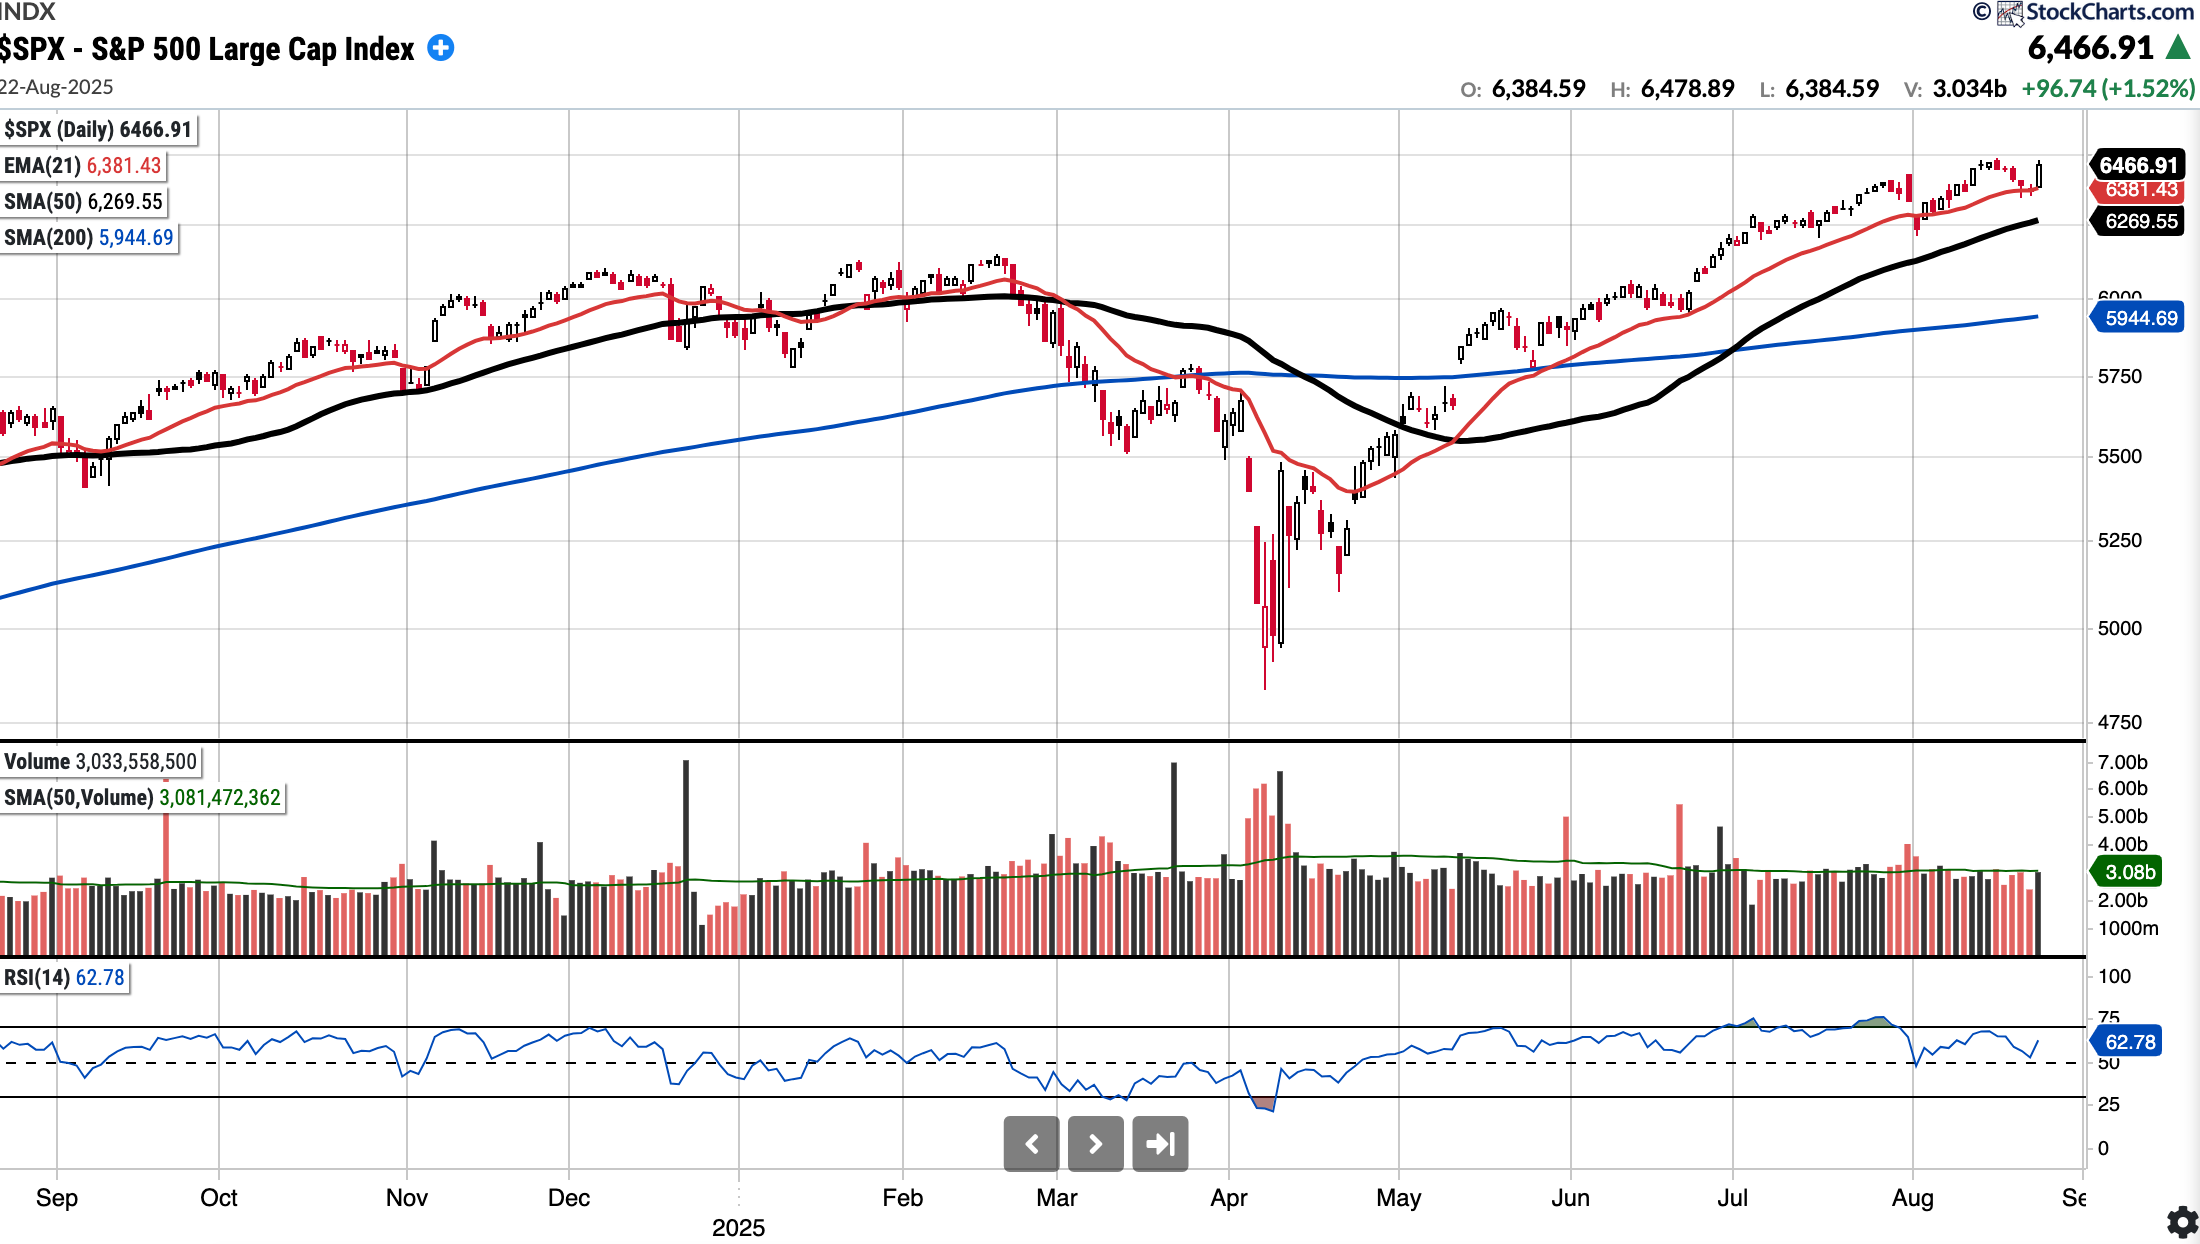
SPX
Sits currently at 6466.91, RSI 62.78 3.15% above a rising 50SMA.
10.2% YTD
Still in a strong uptrend amidst the seasonally weak period. We did get a pullback to the EMA 21 at the start of the month which was held and rebounded nicely from. Snapped a 5 consecutive red day streak with a big green day on Friday. Let’s see if there is follow through on Monday.
0 Distribution days in the last week.
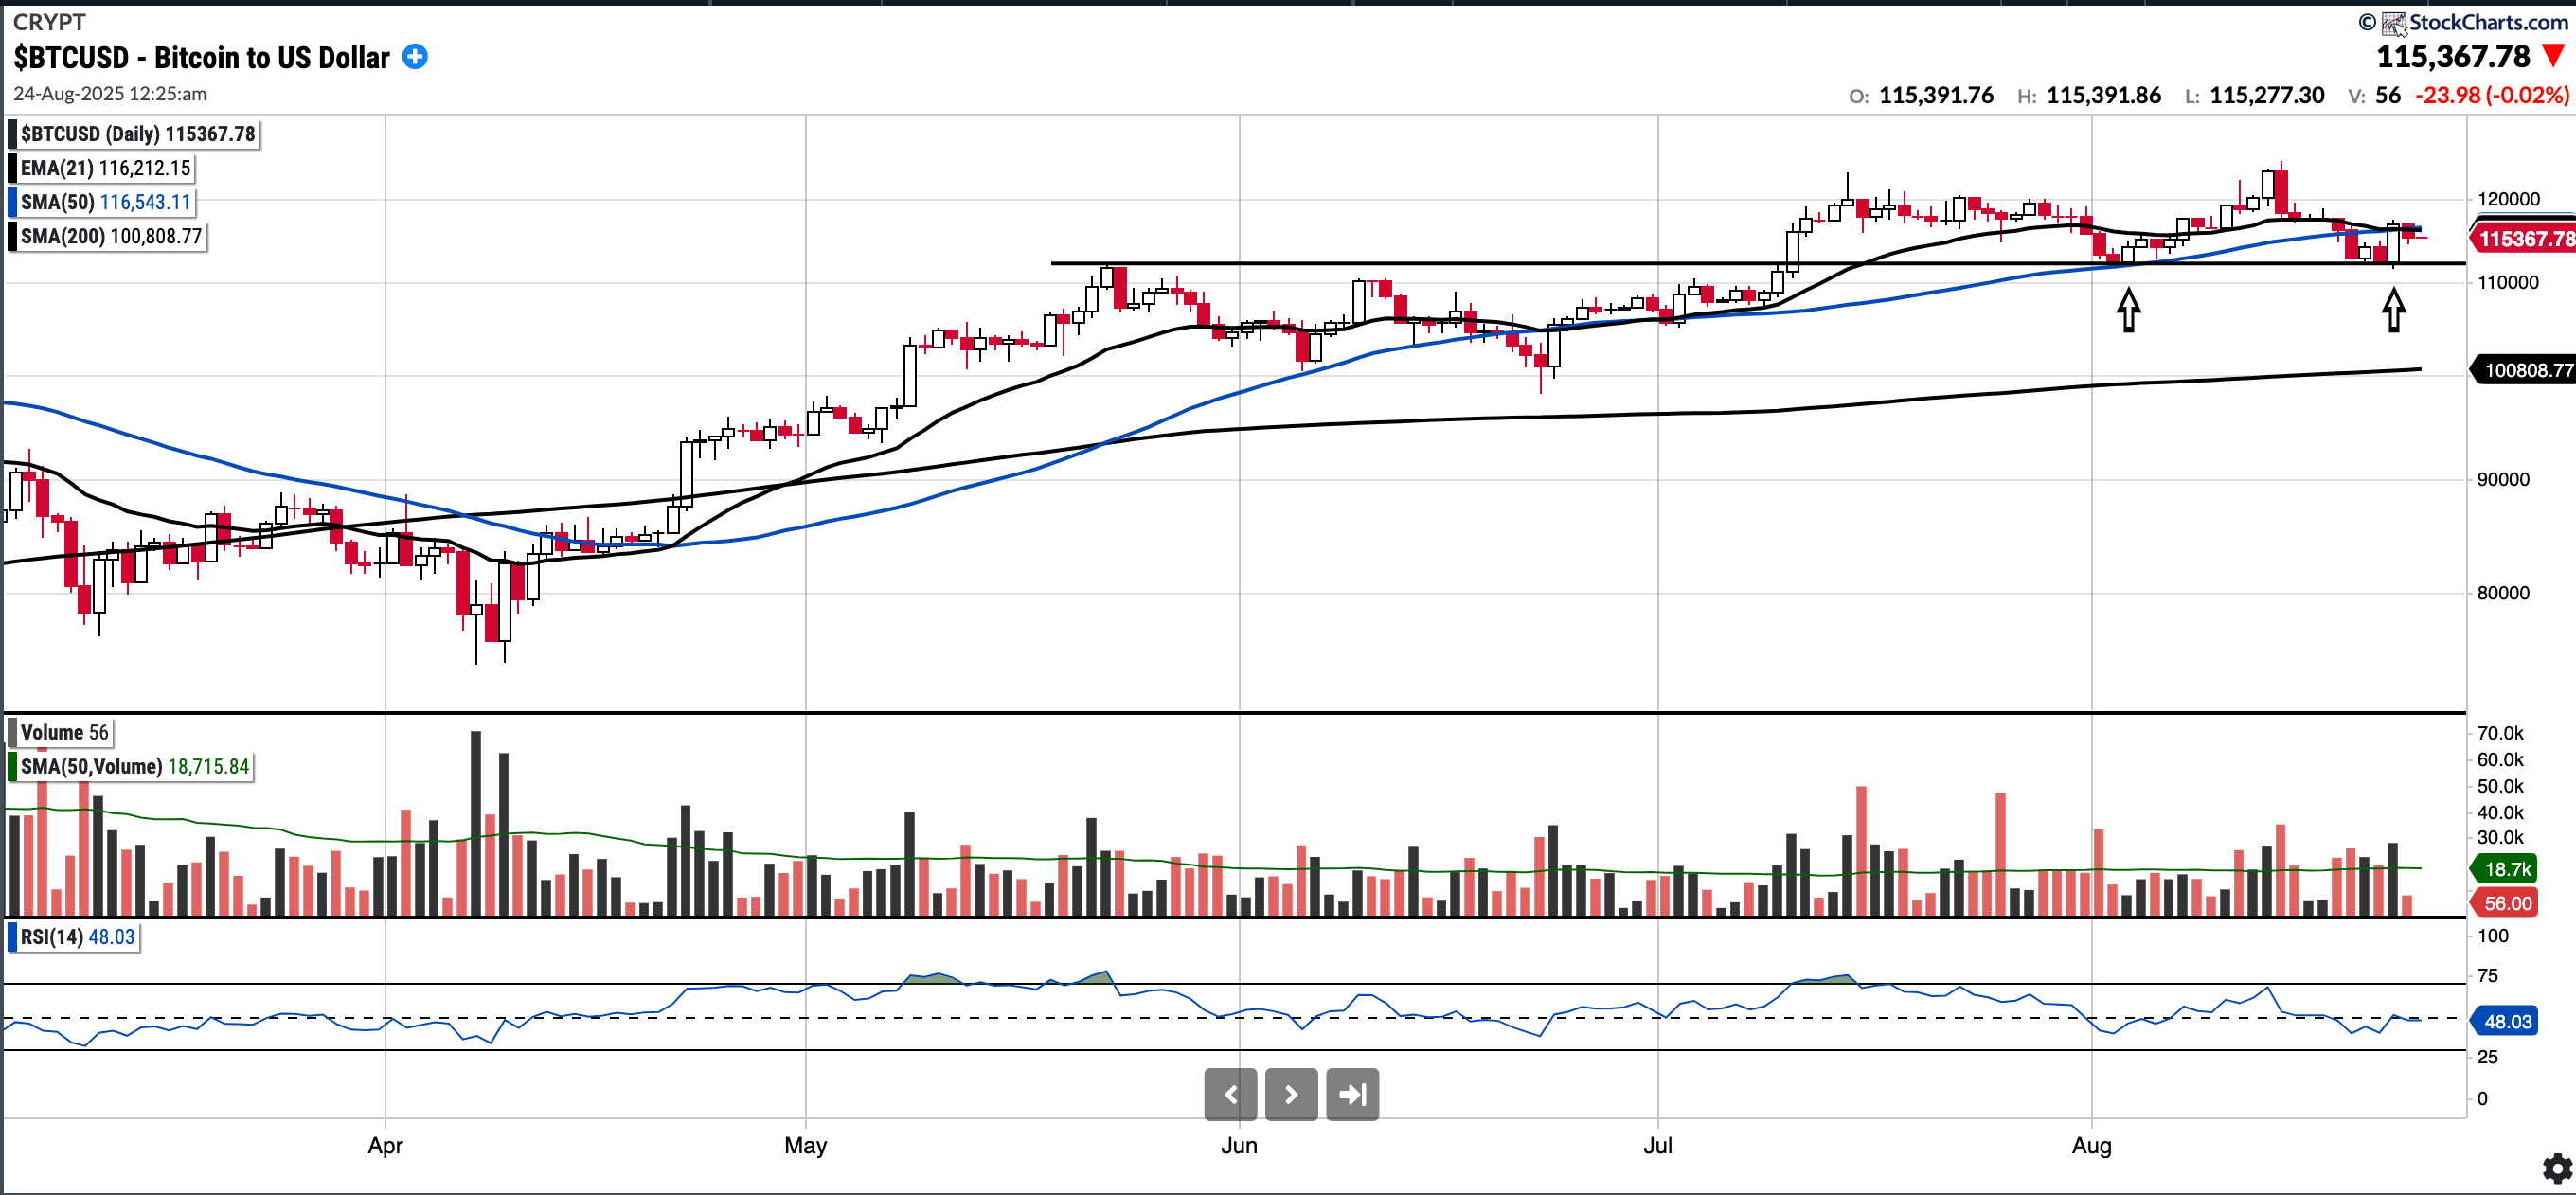
BTC (currently Long)
Currently $115,367.78. 1% below50 SMA and 14.44% above 200SMA.
22.15% YTD.
BTC had somewhat of a quiet week, +2% on the week. As per the chart below we can see we got another re-test of the 112k level which has held as support of late. The perceived dovishness by Powell did lead to a rally in risk assets, let’s see if this translates to a new ATH for BTC in upcoming weeks. A significant break below 112k and we could see a move to 100k at the very least.
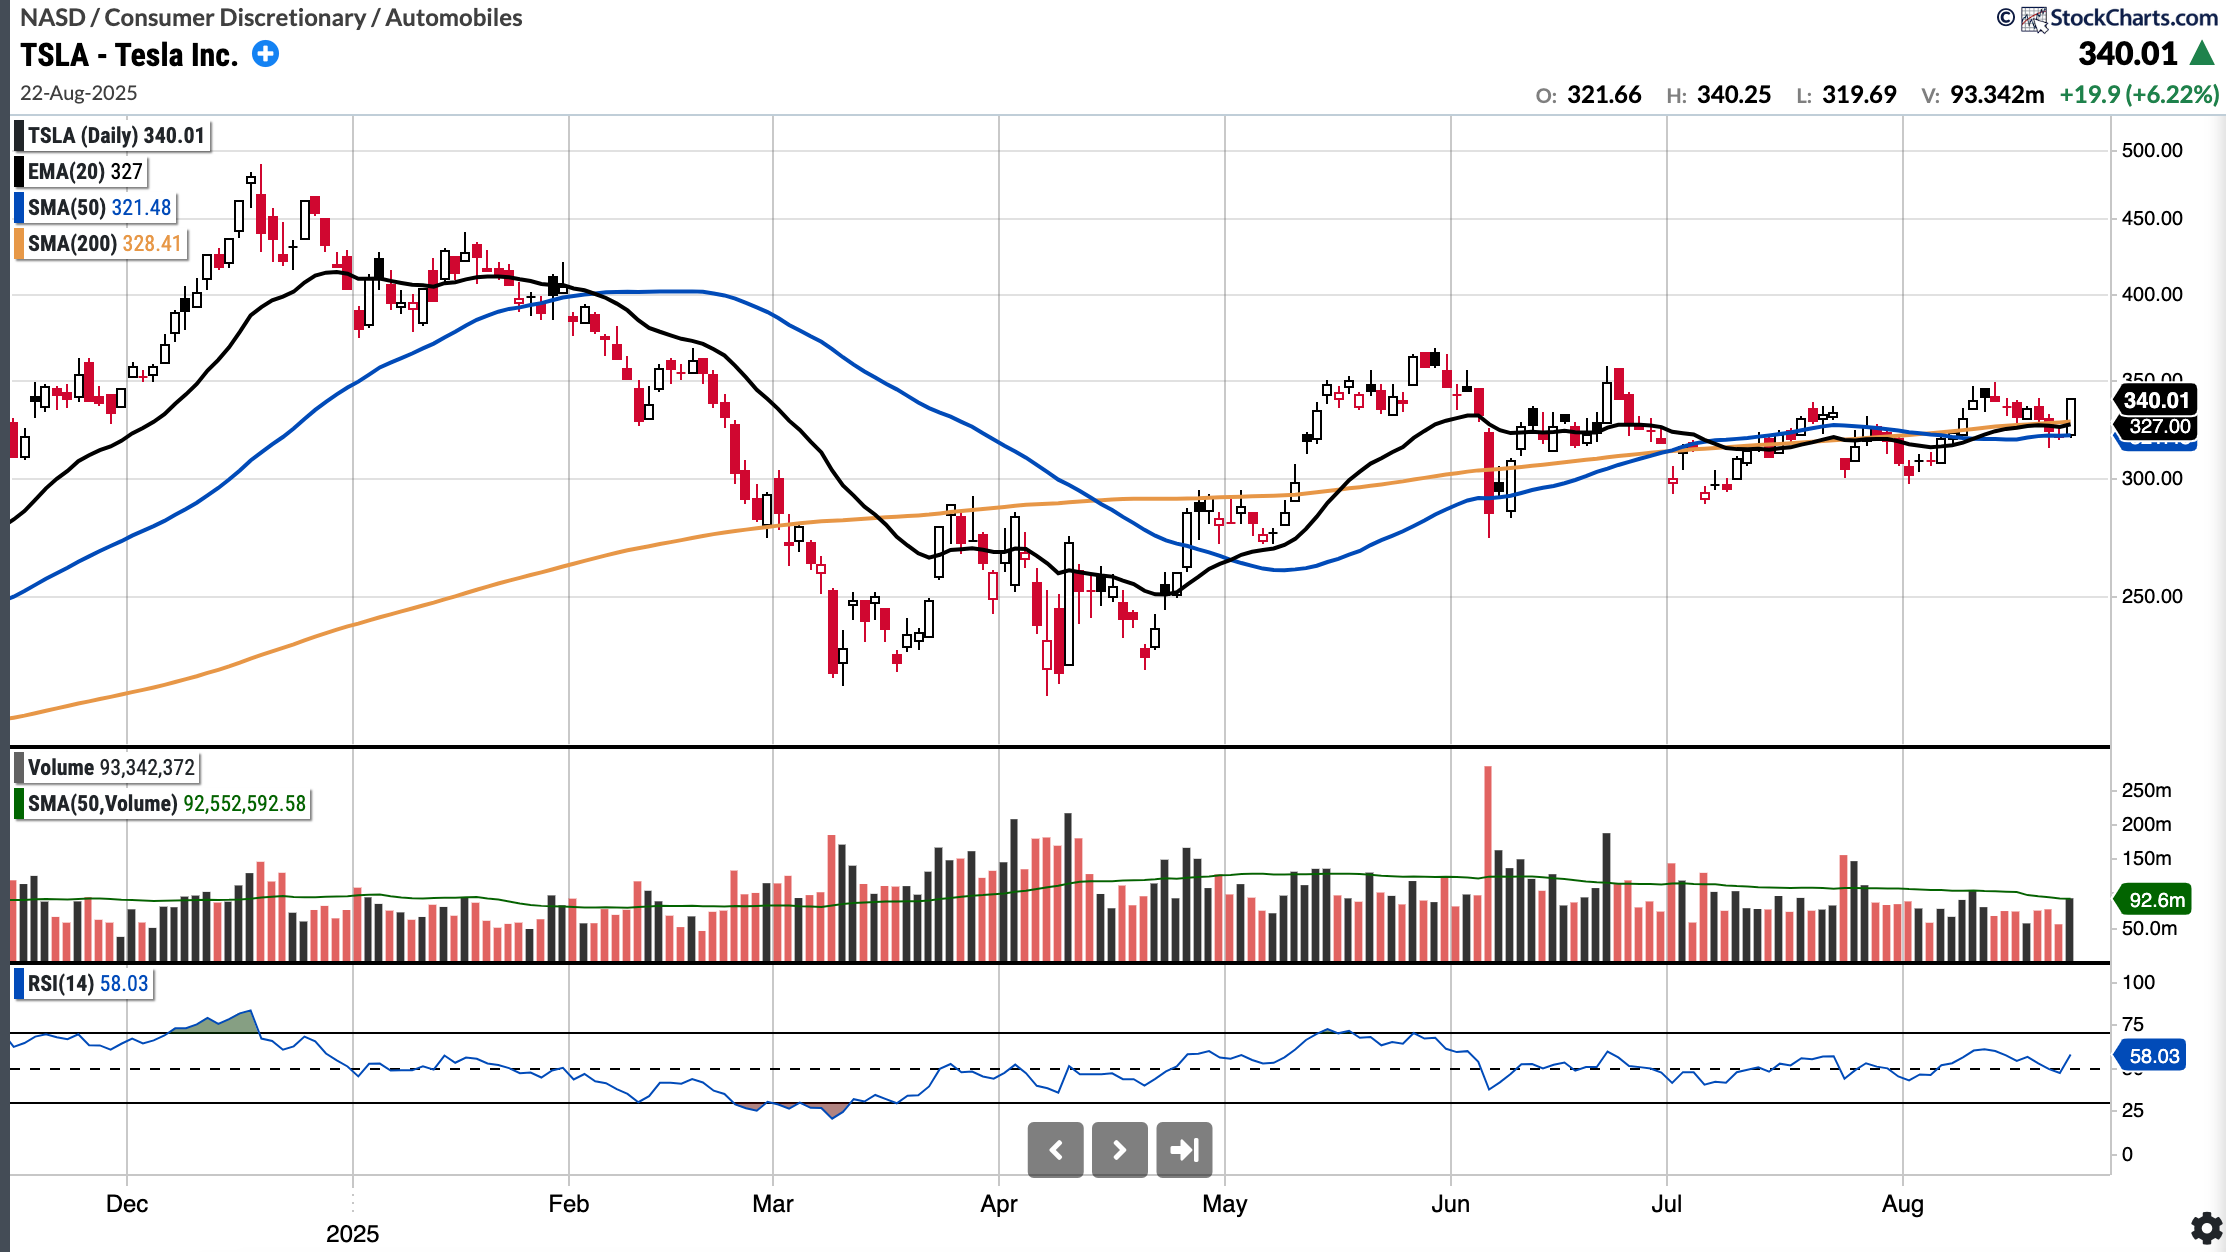
TSLA (No position)
Currently trades at $340.01 RSI 56.03 and 5.76% above 200SMA.
-10.35% YTD
TSLA has reclaimed all its key moving averages (which are coming to a confluence now) and has shrugged off a lot of bad news in recent weeks, such as poor earnings reports, poor delivery numbers, the unimpressive launch of its Robotaxi, and, last but not least, Elon's kerfuffle with the sitting U.S. president. That is notable.
I would not be surprised to see TSLA test near term resistance of 365-368 above. If that range is broken cleanly, a run to 420 could be next.
However, tight price action does not necessarily have to resolve to the upside and in that case range lows of 280’s may be in play on market weakness.
I have no position but think upside move is more likely to be in play based on my experience with this stock. NFA.
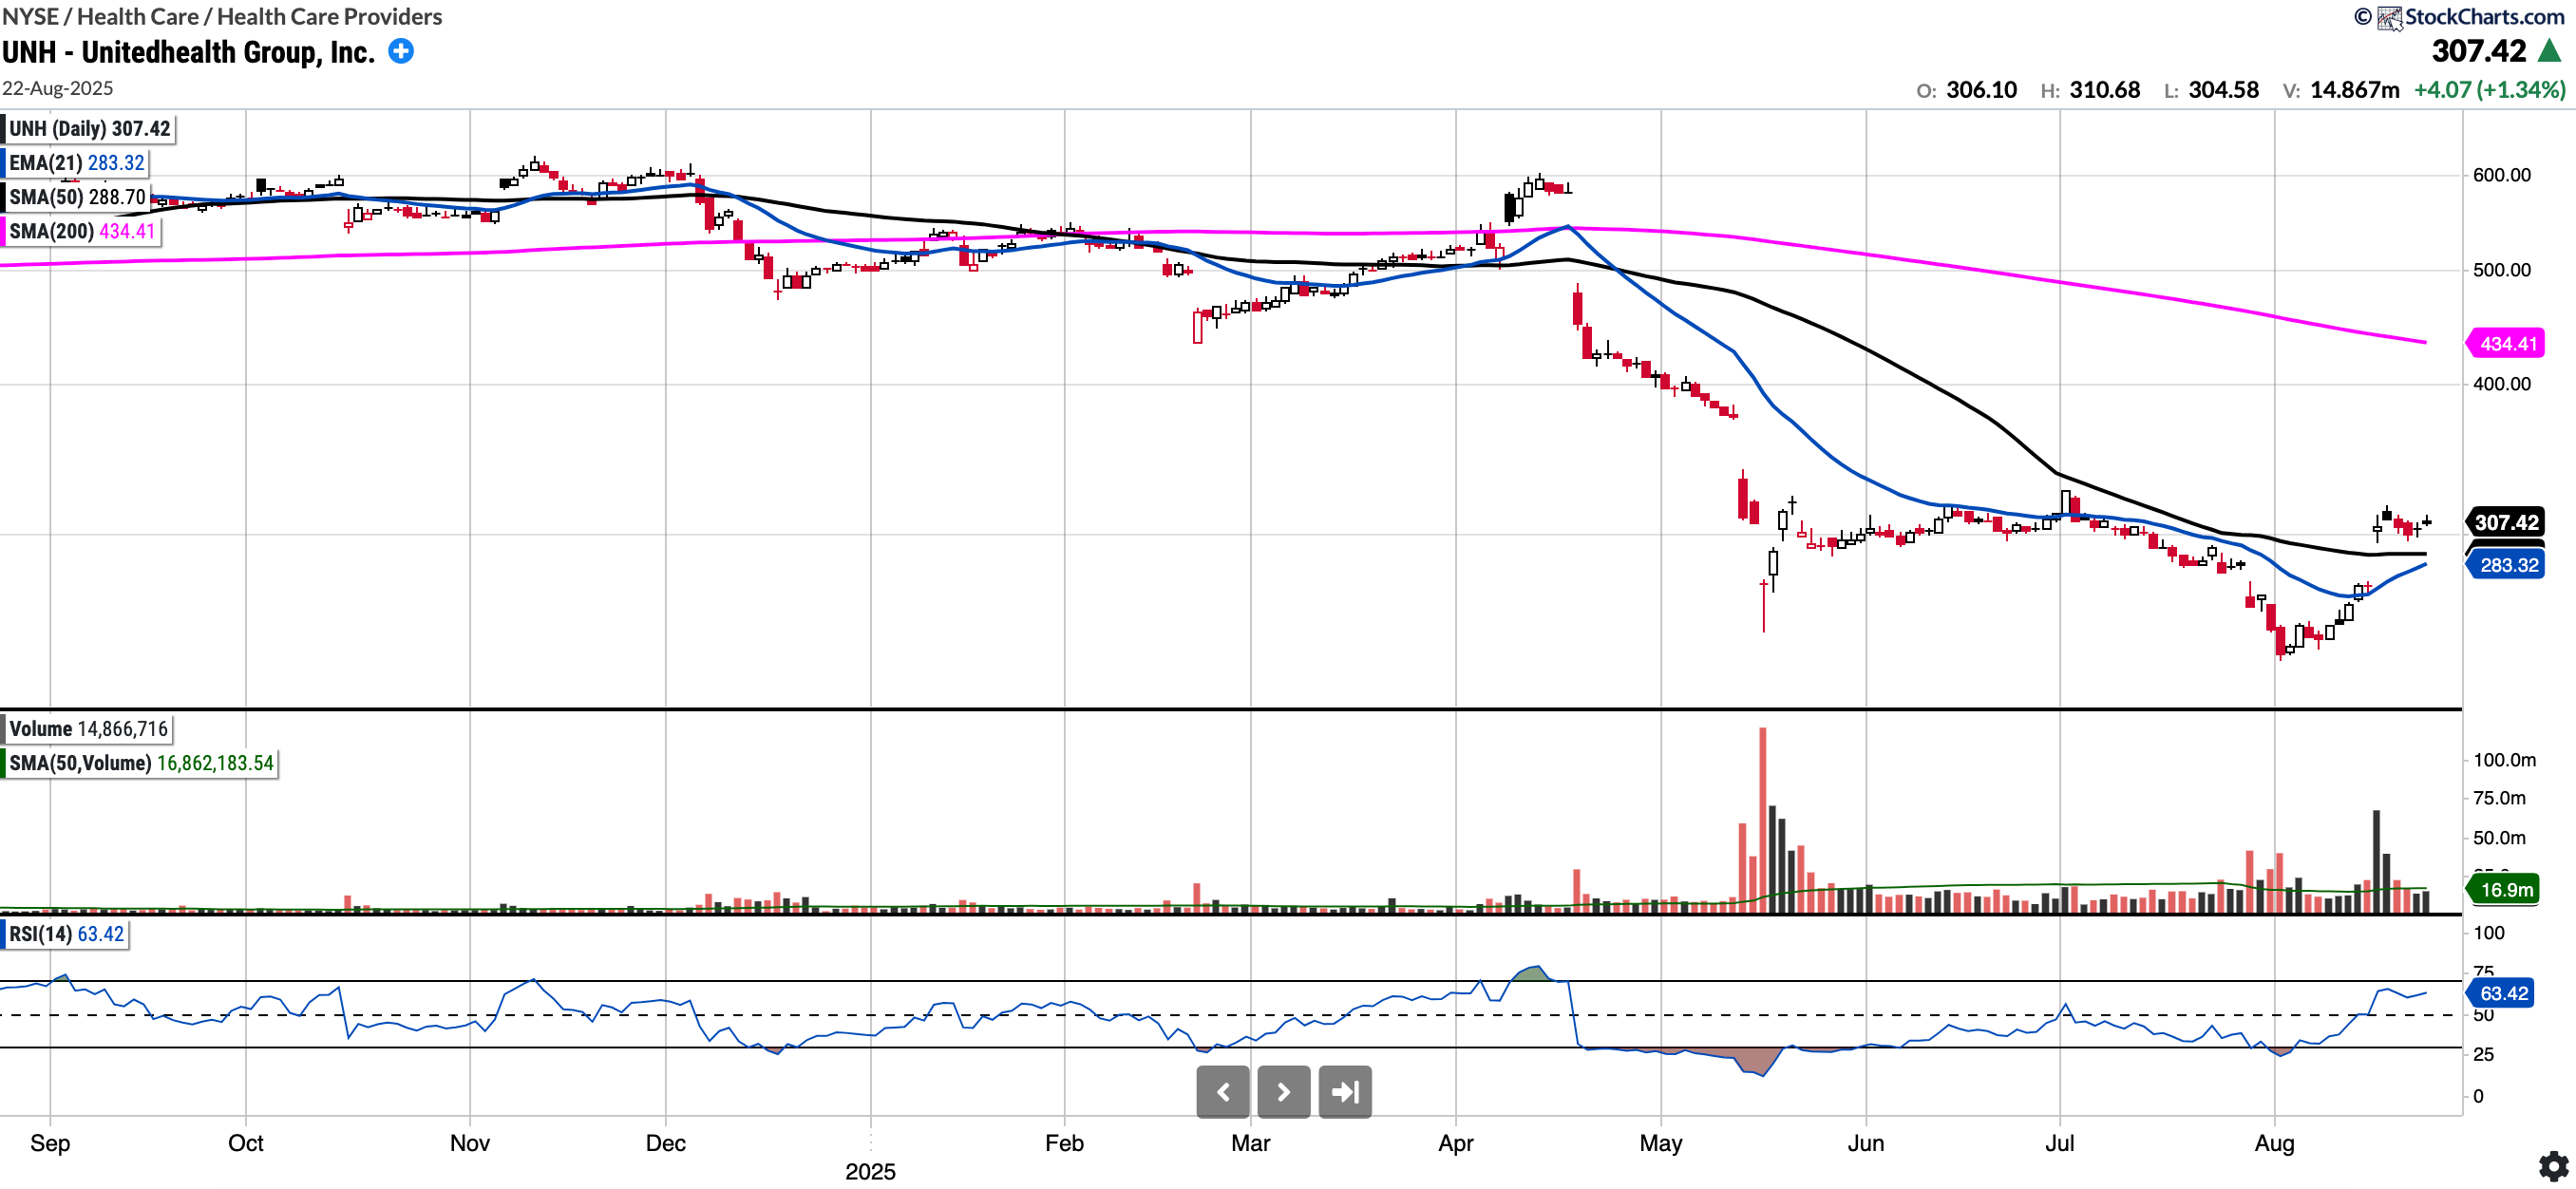
UNH (Currently Long)
Currently trades at $307.42, RSI 63.42 and 8.48% above 50SMA but -29.23% below the 200SMA.
-39.07% YTD
UNH has had an interesting few weeks with a post earnings crash, a new CEO and then reaching a low of 234.6. We initiated a position with an average of close to 240.
News broke late recently that Buffett had been buying in Q1 and Q2 and so likely has a much higher average than current levels. Likewise Tepper, Burry and others were buying. We could speculate that this could be the signal for some value-oriented firms to feel confident to buy.
Despite this, I said last week that the chart will need sometime to become more constructive. This week was somewhat of a quieter week. Near term I expect 320-325 to be resistance but filling the gap to 370 is a logical upside target. On Market weakness levels I will be watching is 289/290 for the SMA 50 re-test and below that the 274 level for the “Buffett Buying UNH” gap fill.
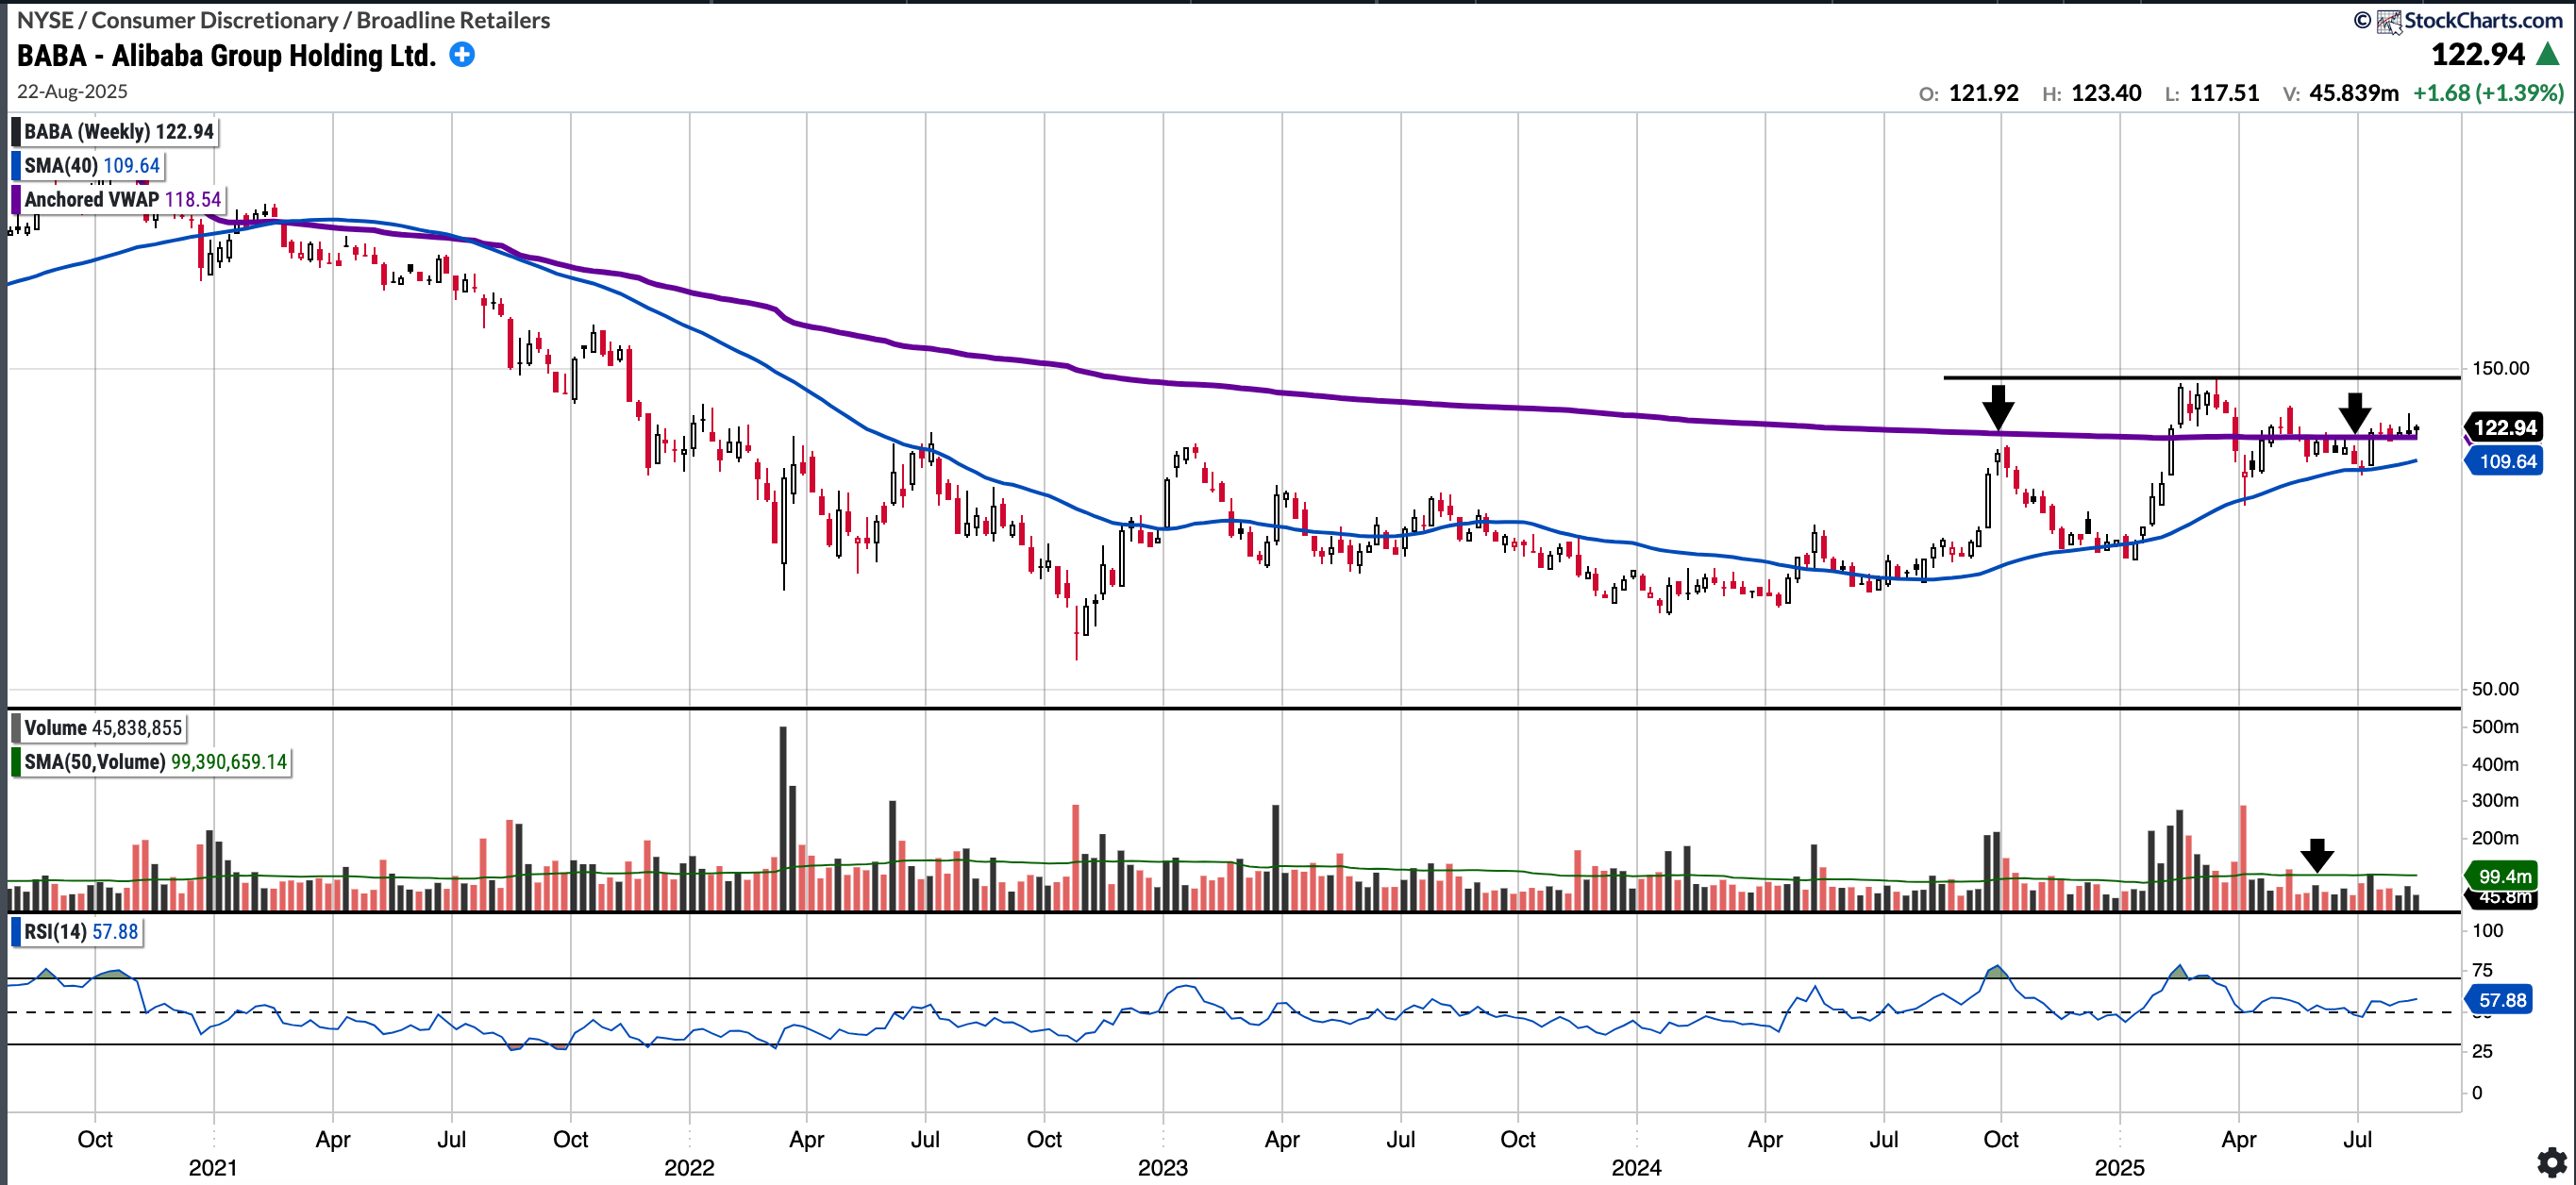
BABA (currently Long)
Currently trades at $122.94 RSI 56.35 and 12.56% above 200SMA.
+44.72% YTD
BABA has had a decent run this year but found resistance in the mid 140 level where I reduced some of the position BABA trim March 17th 2025
However, since then it has been flipping mostly between the SMA 200 and AVWAP from ATH. Earnings Friday could serve as a catalyst to get this moving again into a stage 2 breakout.
Notable portfolio changes in previous week (all updated live in subscriber channels):
