
Preview of the Week Ahead
W/C September 8, 2025

Hope you all are having a good weekend. Below we will be previewing the upcoming week.
Format for what is covered in this weekly preview:
A look at the indices
Key upcoming economic events
Upcoming earnings reports
Charts
Notable portfolio changes from the previous week
Current Portfolio Holdings
If it is your first time here, check out the post below on how to navigate the SixSigmaCapital Website:

I also recommend checking the “Monthly Portfolio Update” for my thoughts on the Market plus my own Portfolio.

Indices
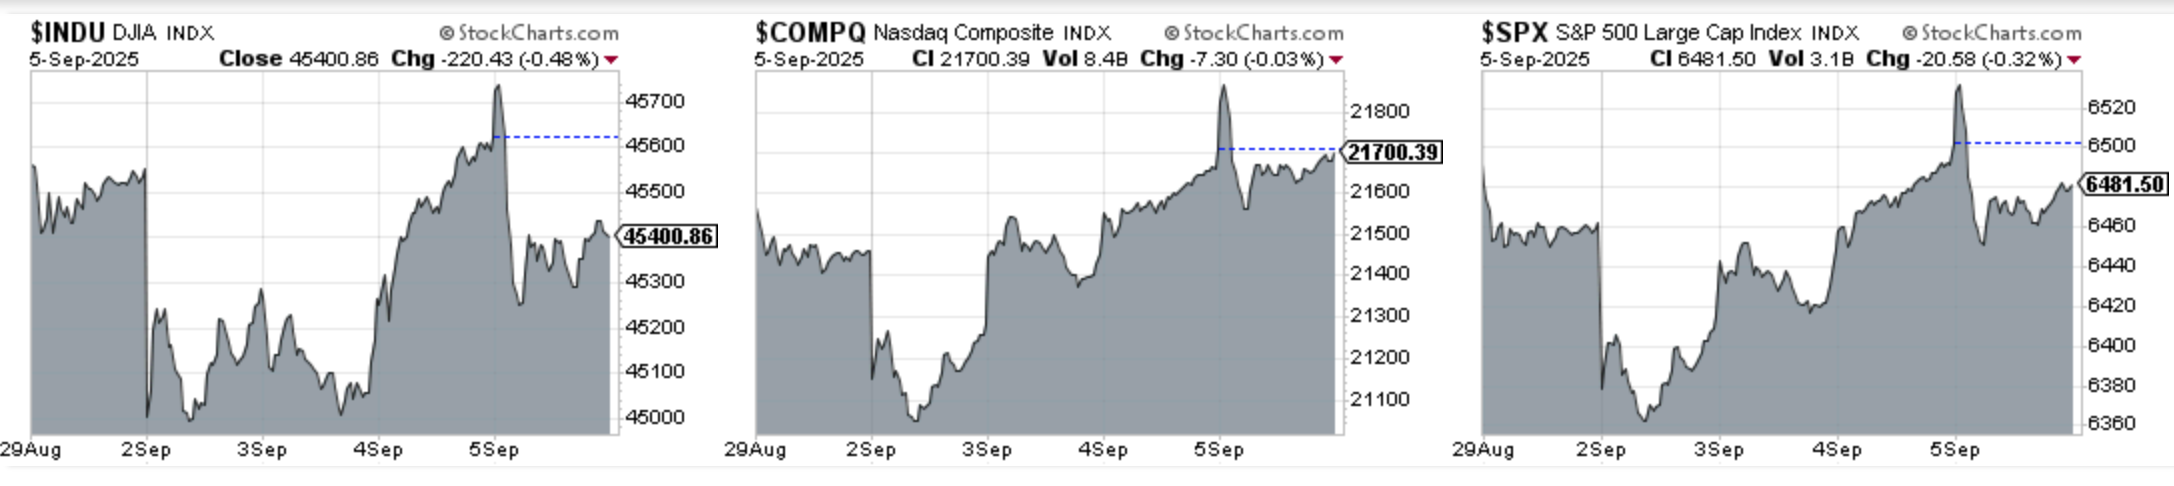
Dow Jones declined 0.32% in the last week
S&P 500 declined 0.07% in the last week
Nasdaq Composite advanced 0.36% in the last week
IWM advanced 0.50% in the last week
Key upcoming events:
Wednesday, September 10
Producer Price Index (PPI) for August
Thursday, September 11
Consumer Price Index (CPI) for August:
Retail Sales for August:
Weekly Initial Jobless Claims
Friday, September 12
University of Michigan Consumer Sentiment (Preliminary for September)
Note this week contains the last major inflation reports before the Federal Reserve's interest rate decision on the 17th of September.
Upcoming Earnings
Last week was a very quiet week with no portfolio positions reporting. Likewise, no portfolio positions reporting this week.
Below is the infographic by Earnings Whispers for the upcoming week:

Charts
SPX
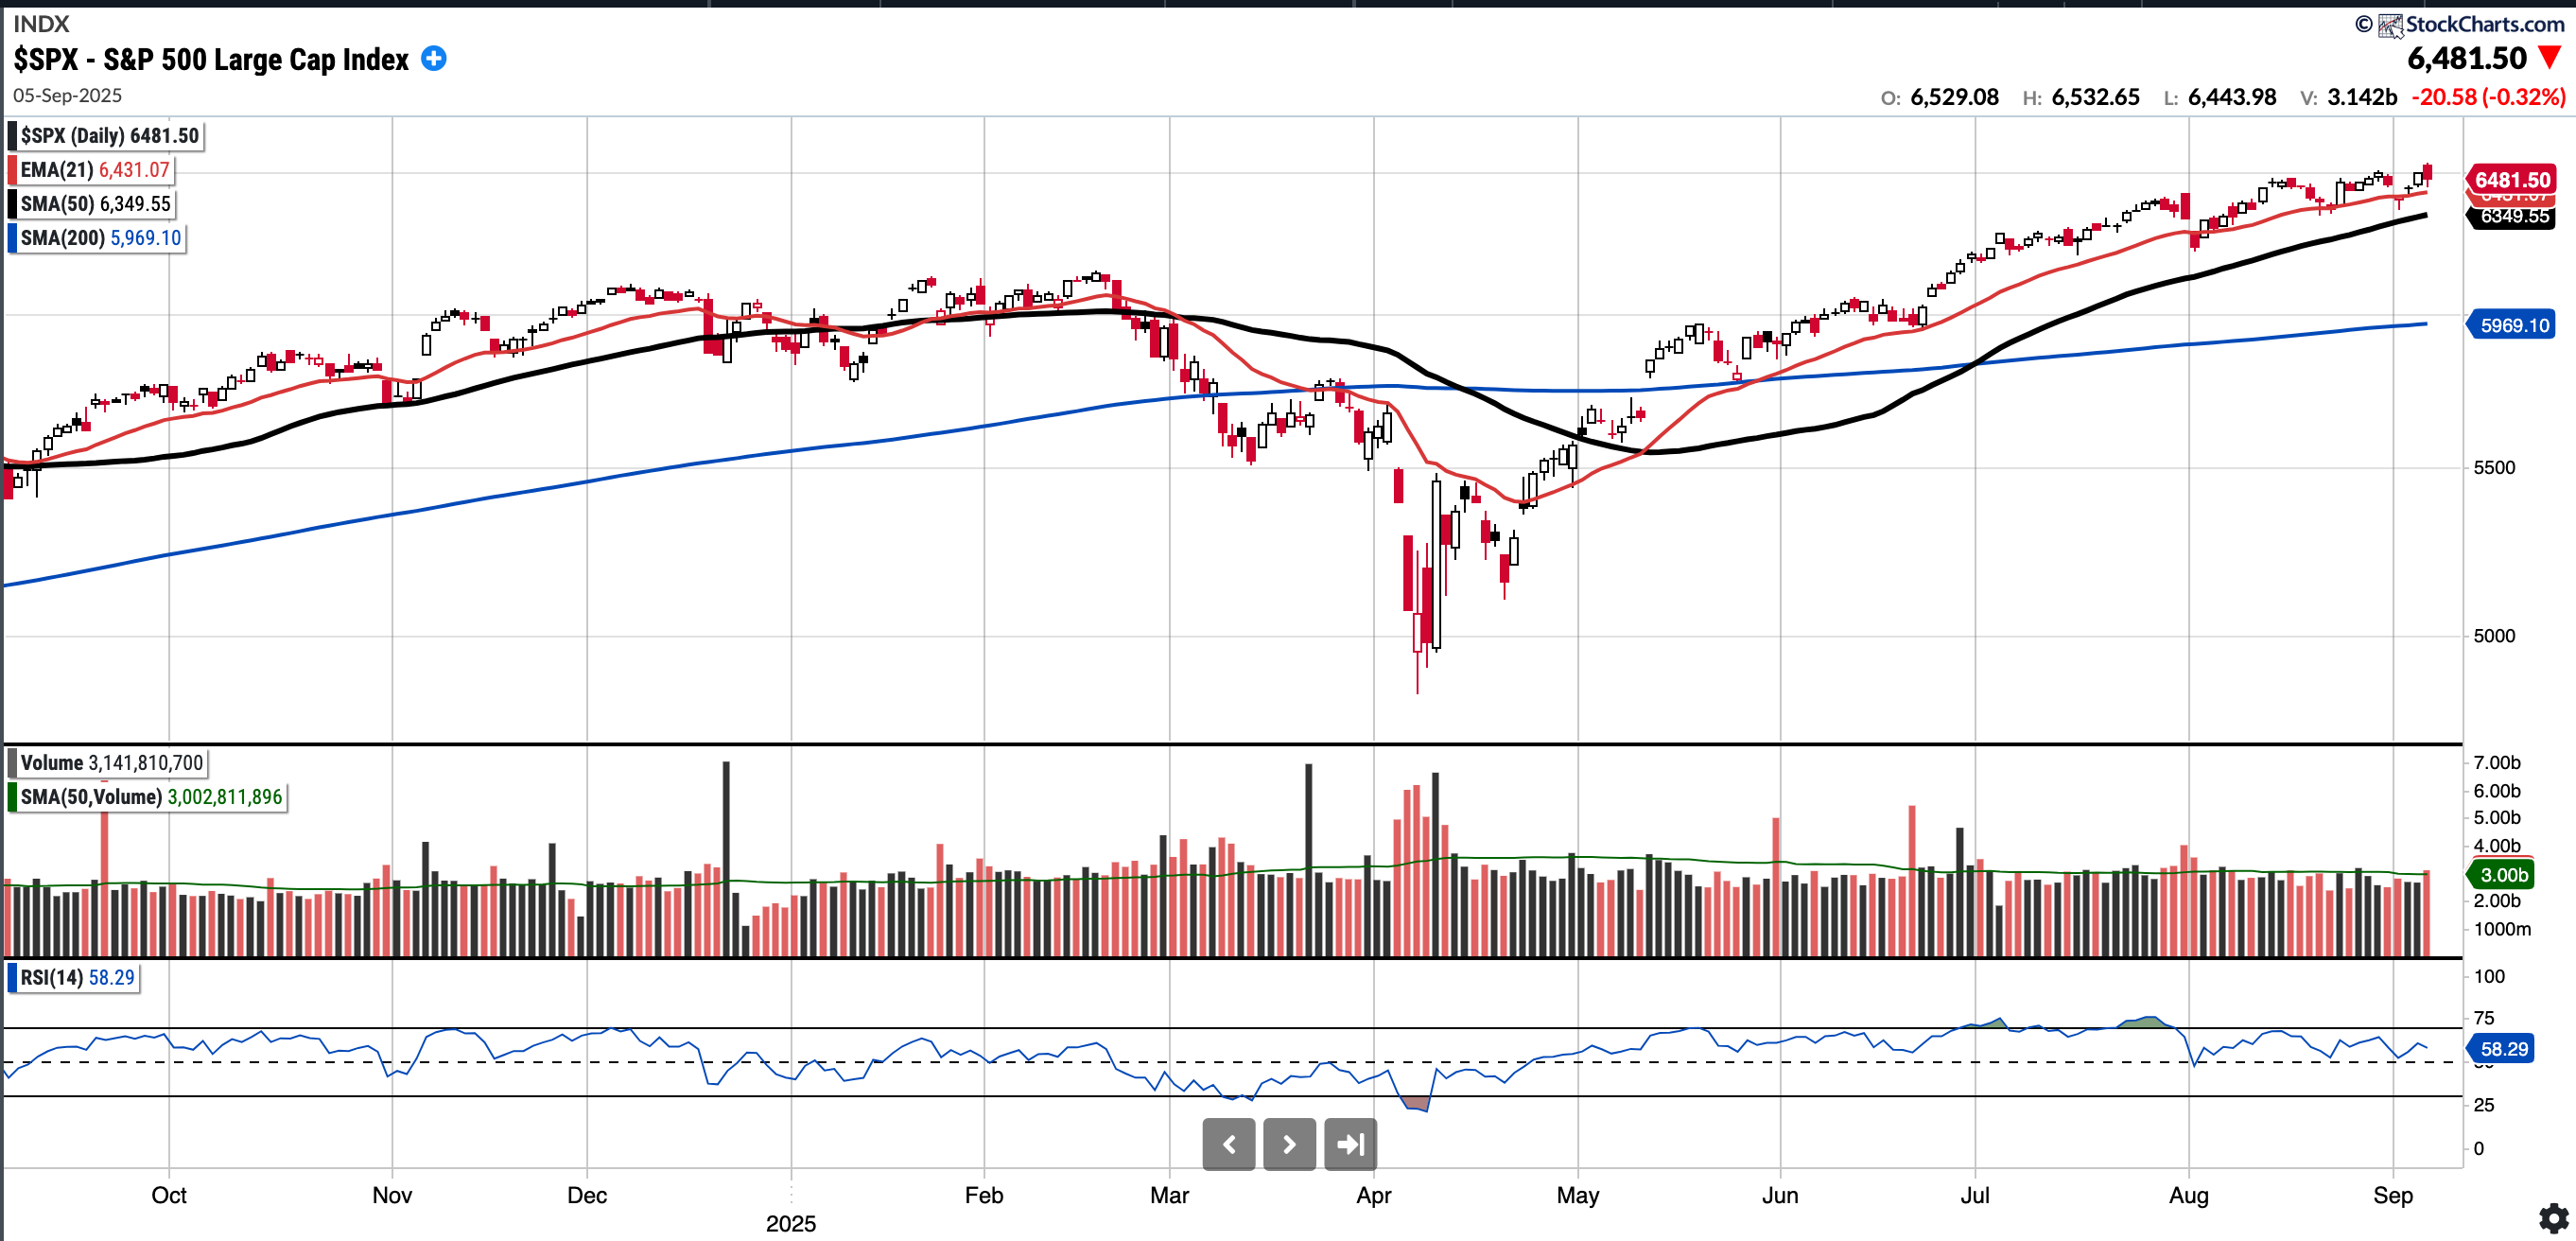
Sits currently at 6481.5, RSI 58.29, 2.08% above a rising 50SMA.
10.44% YTD
We had another week in which the S&P 500 made a new ATH. On Tuesday 2nd September we also got a dip below and reclaim of the EMA 21.
Distribution days in the last week: 1 (Friday the 5th of September)
BTC (currently Long)
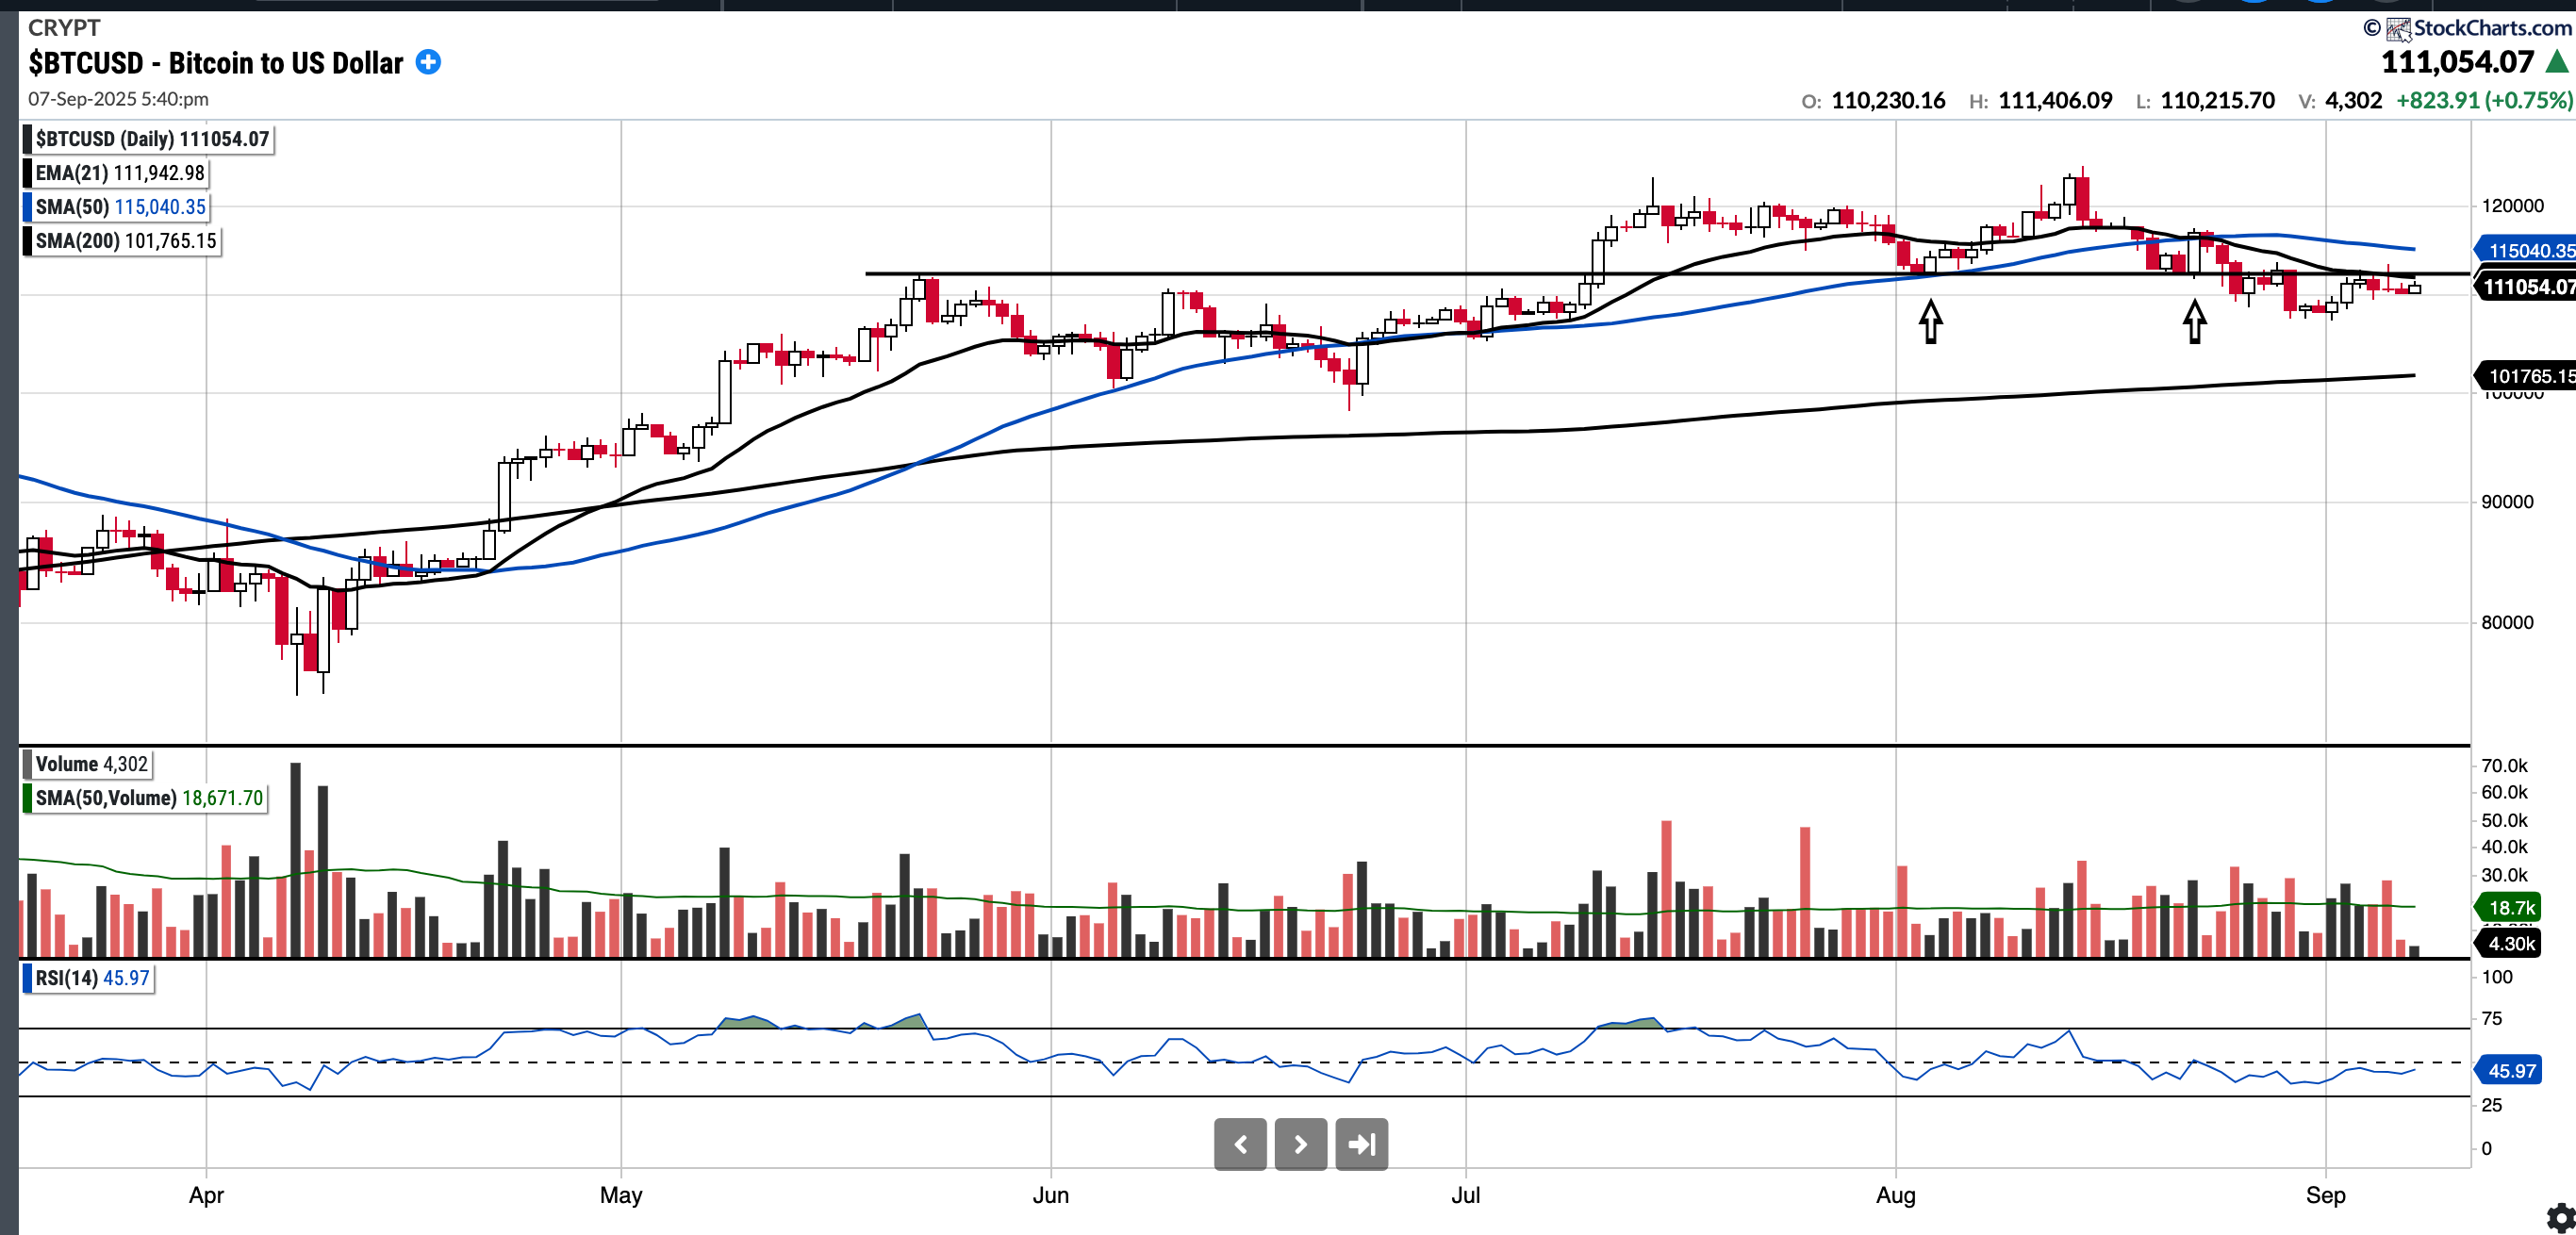
Currently $111,054.07, -3.47% below 50 SMA and 9.13% above 200SMA.
17.59% YTD.
BTC has traded flat in the last week but is up from last weeks post.
I have mentioned that 112k was a level to hold and if broken then we could see a move to 100/101k. We did not get a flush to the low 100’s yet but the 112k level has flipped from support to resistance. Bulls would want to see a break above 112k whereas if BTC continues to show weakness then 100/10k is a logical re-test level to watch.
BABA (currently Long)
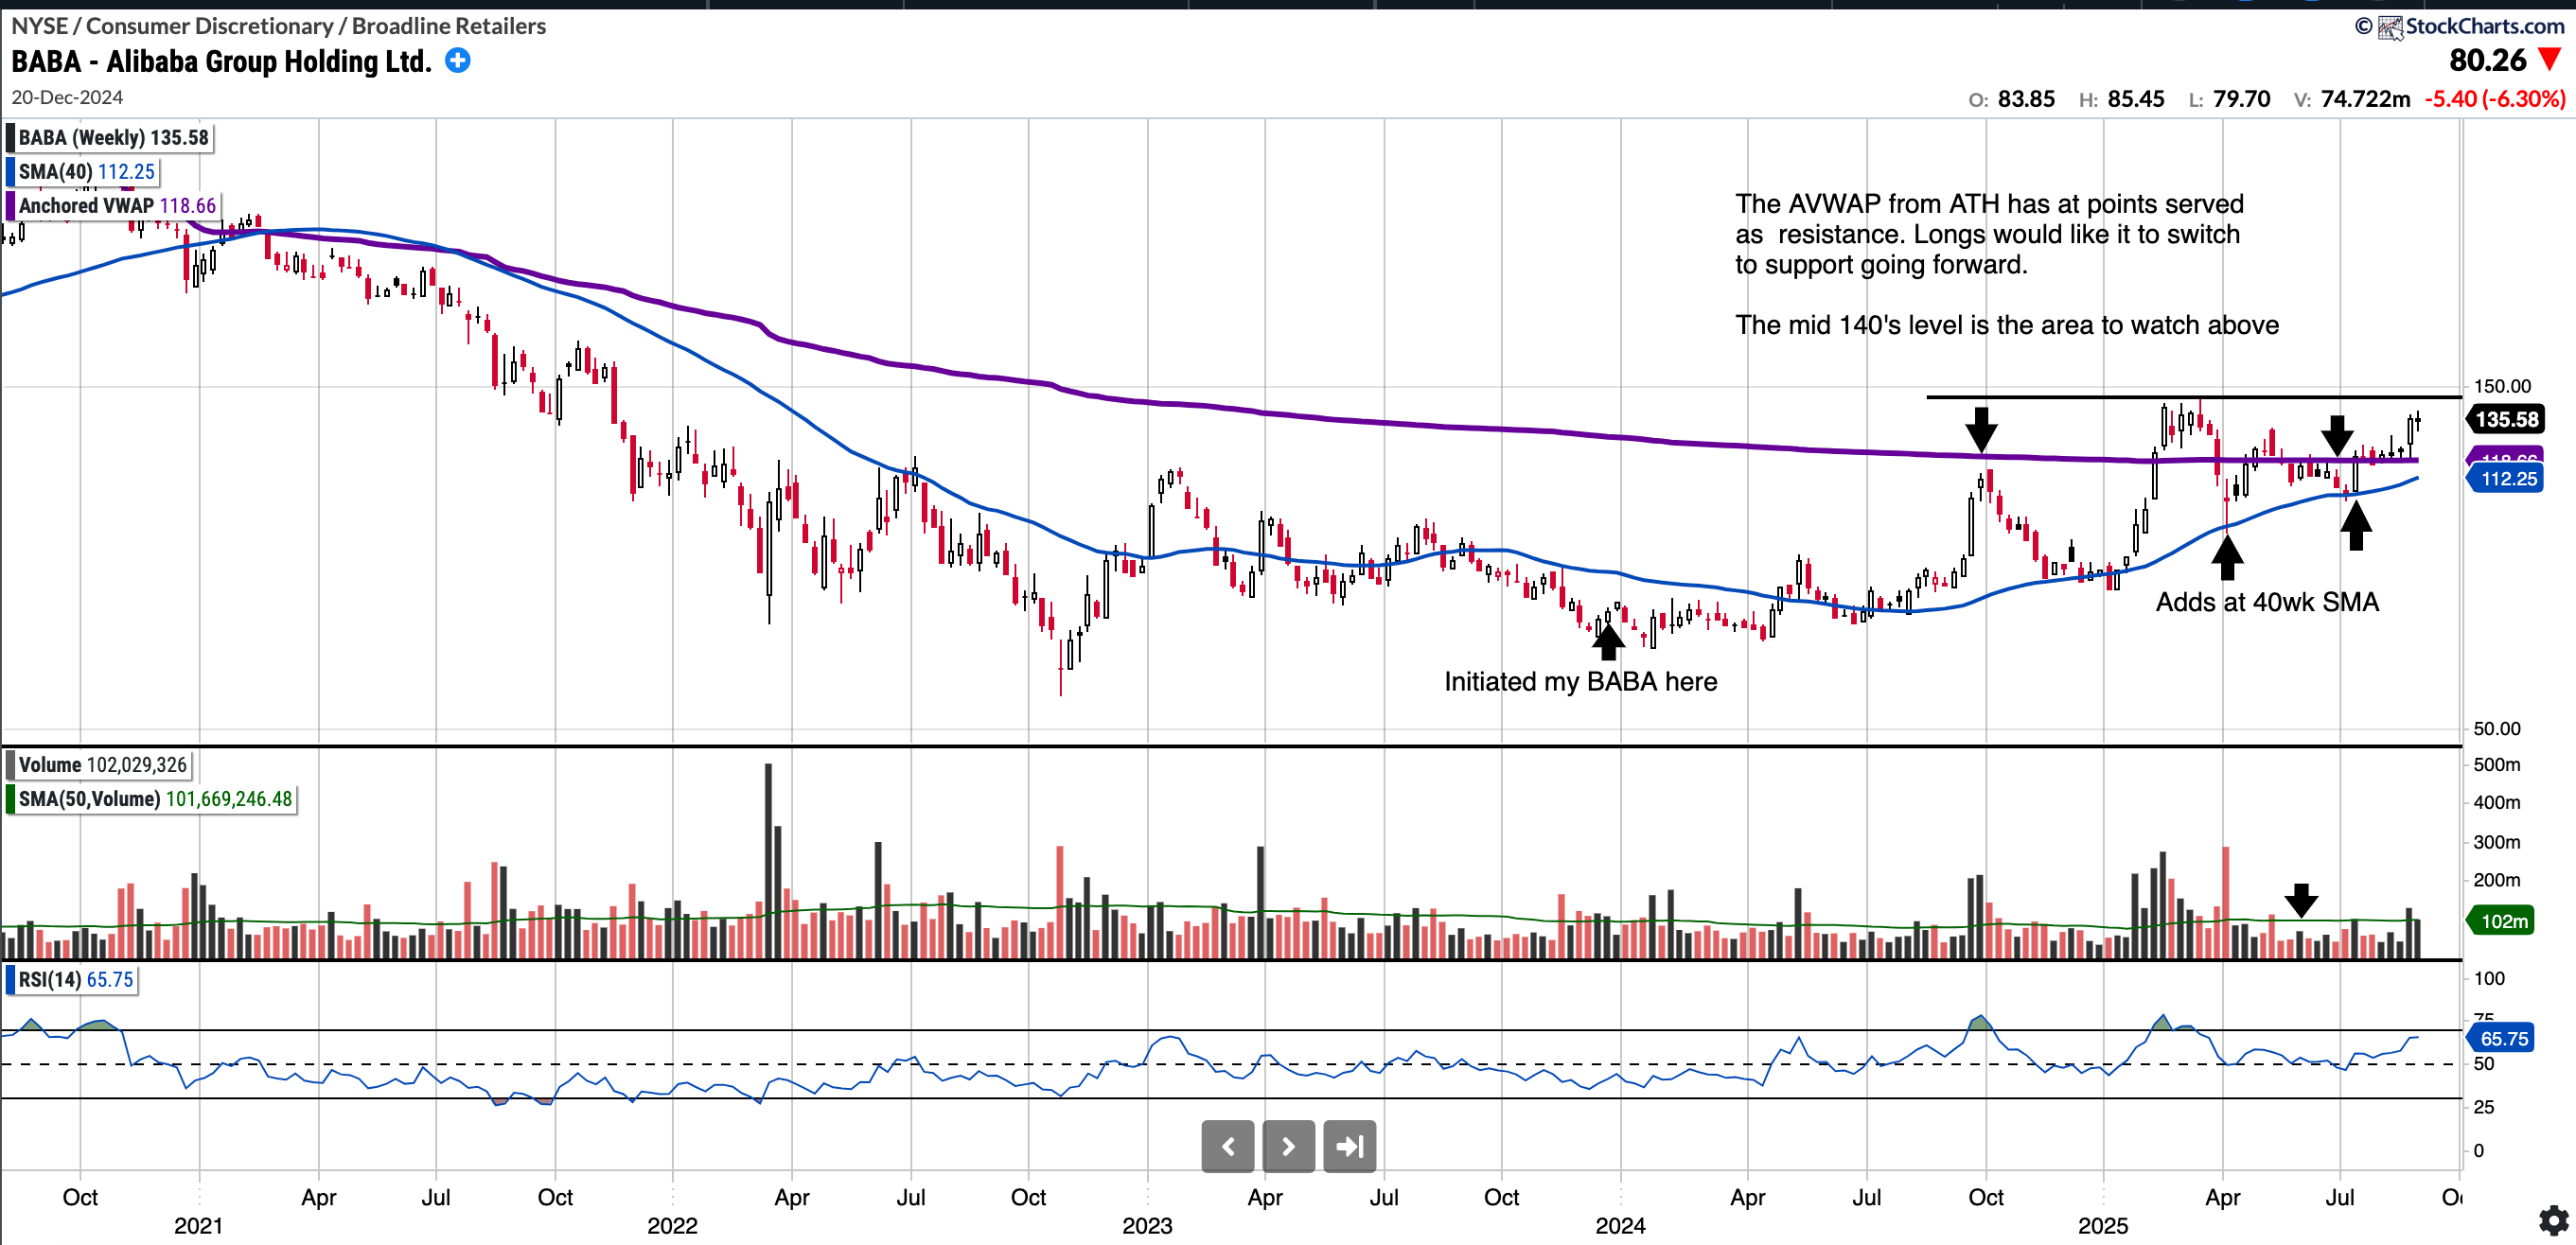
Currently trades at $135.58 RSI 65.75 and 22.28% above 200SMA.
+59.6% YTD
BABA had a decent run earlier in the year but found resistance in the mid 140 level where I previously reduced some of the position BABA trim March 17th 2025
The recent earnings were a boon for the stock as it rose >10% and looks like a candidate for a stage 2 breakout. The mid 140’s high from earlier this year is the near term upside target to watch but above that, my realistic target IF business remains robust plus upside catalysts play out like like US-China deal is ~180. At this level would be ~17x next years earnings and a PEG of <1 still.
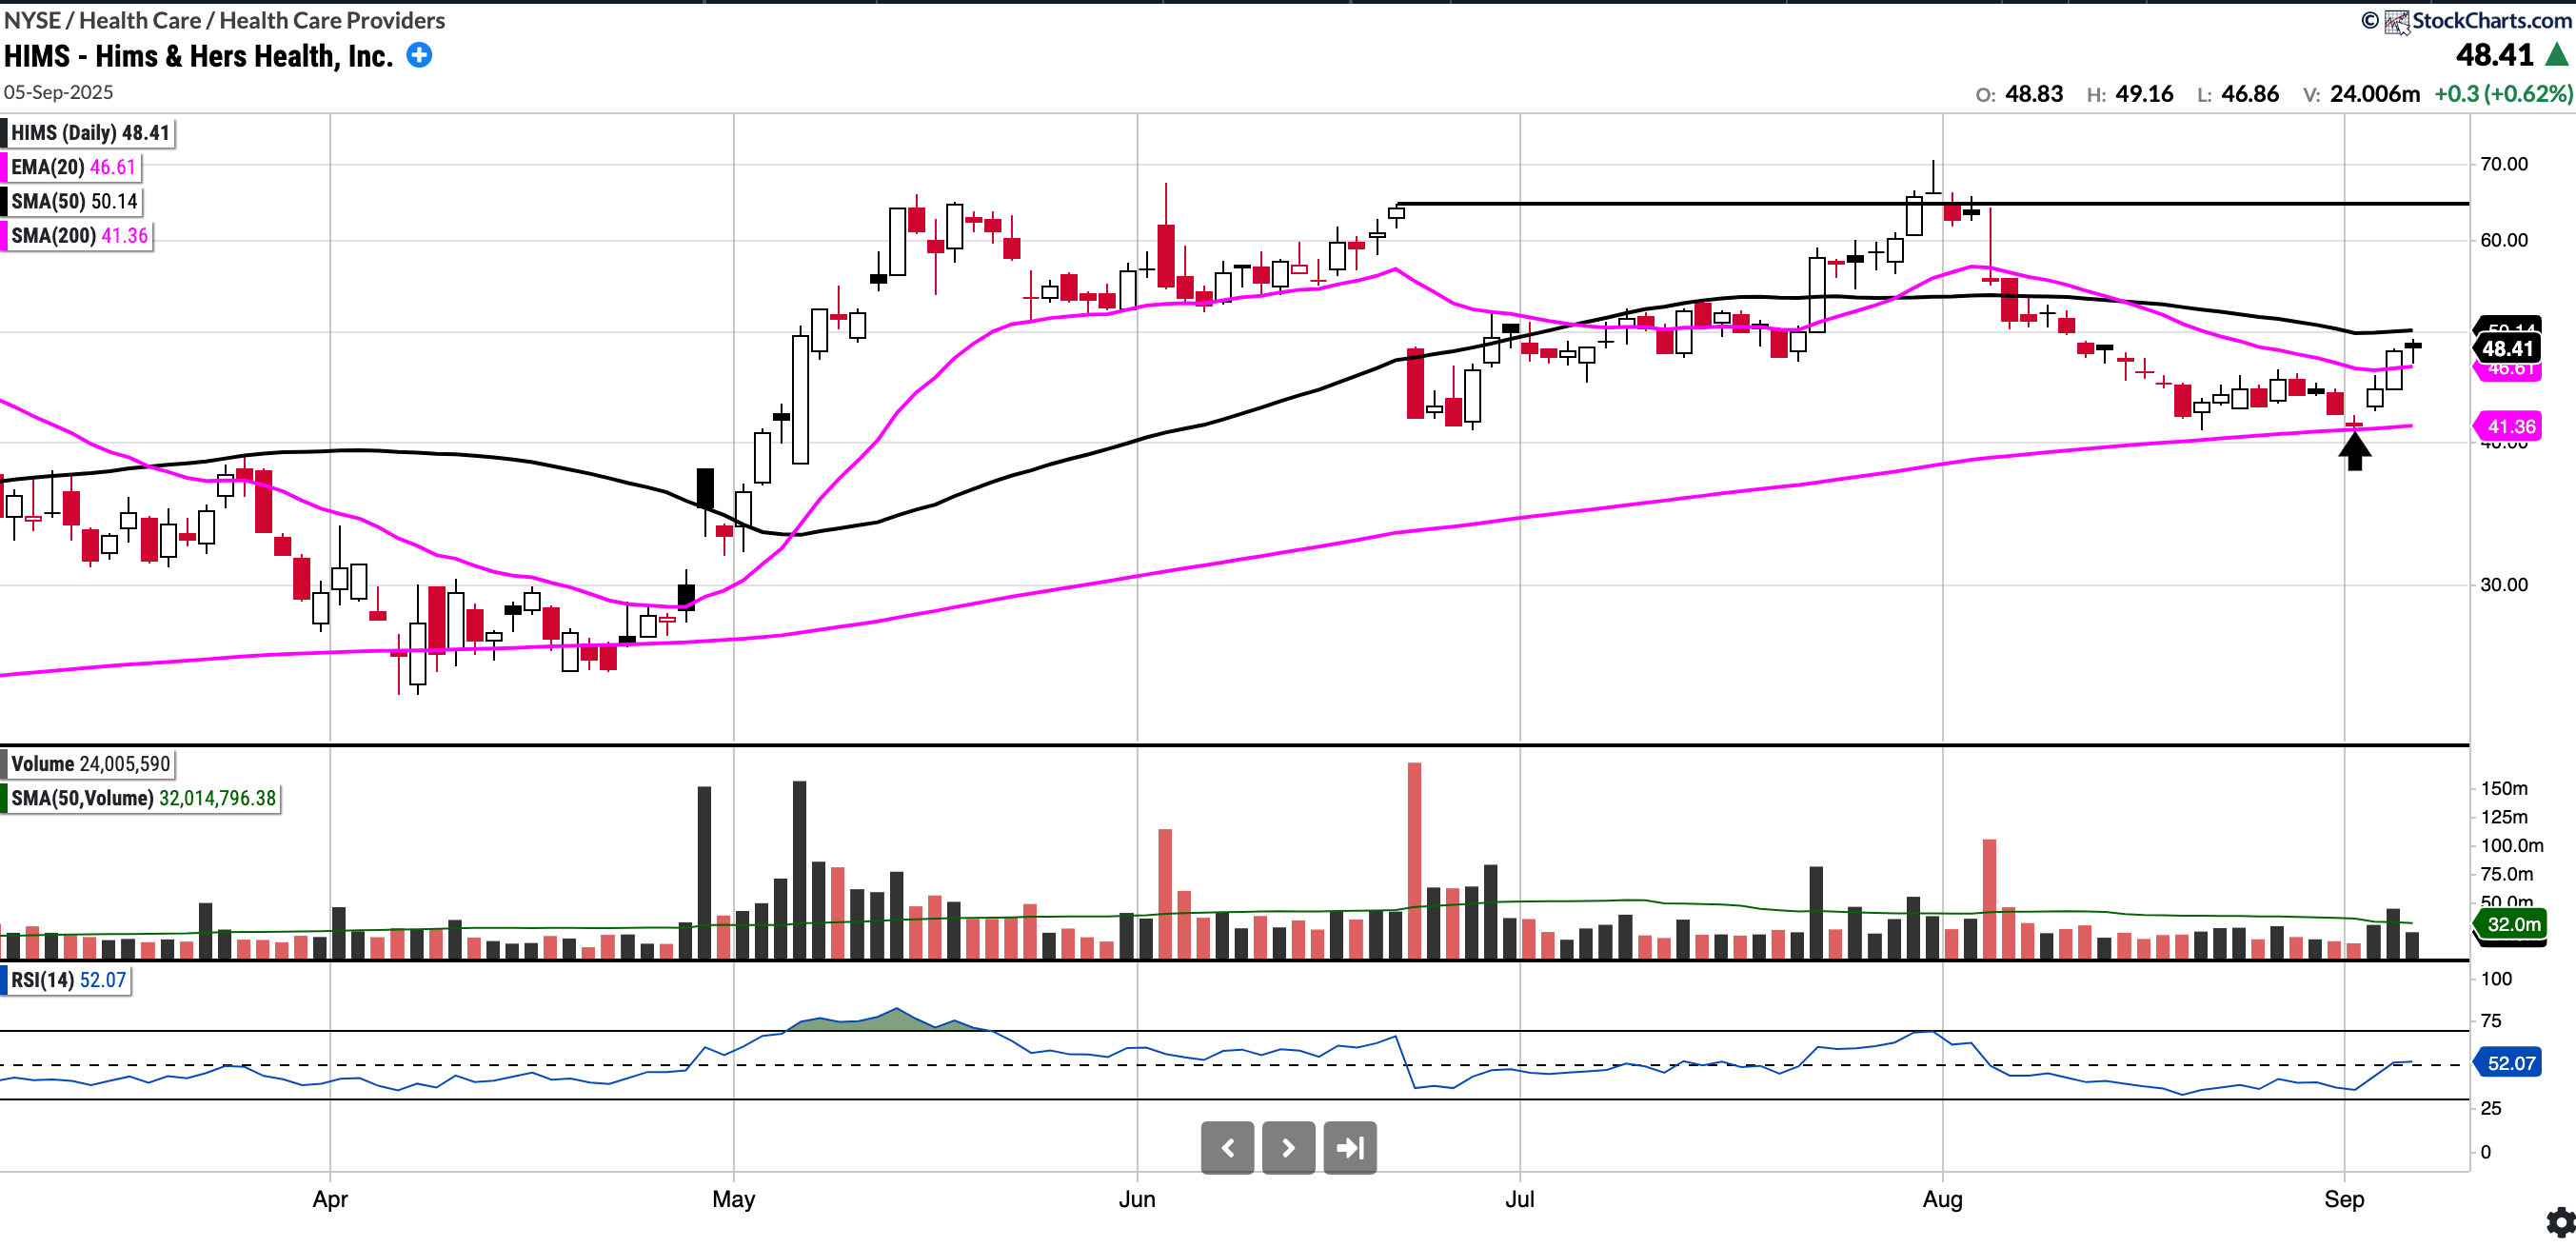
HIMS (Currently Long)
Currently trades at $48.41 RSI 52.07 and 17.40% above 200SMA.
92.1% YTD
HIMS has been a stock that has treated me really well in recent years and I have made money every time I have traded this one. Recently picked it up again, for a trade, on the 200SMA re-test. I have booked partial profits at 48.00 but letting the rest run for now. A key level to watch above is the overhead 50-day SMA. If that is surpassed, the next area of interest would be the $64 level. Another thing to mention is the 30% short interest which could add some velocity to any moves.
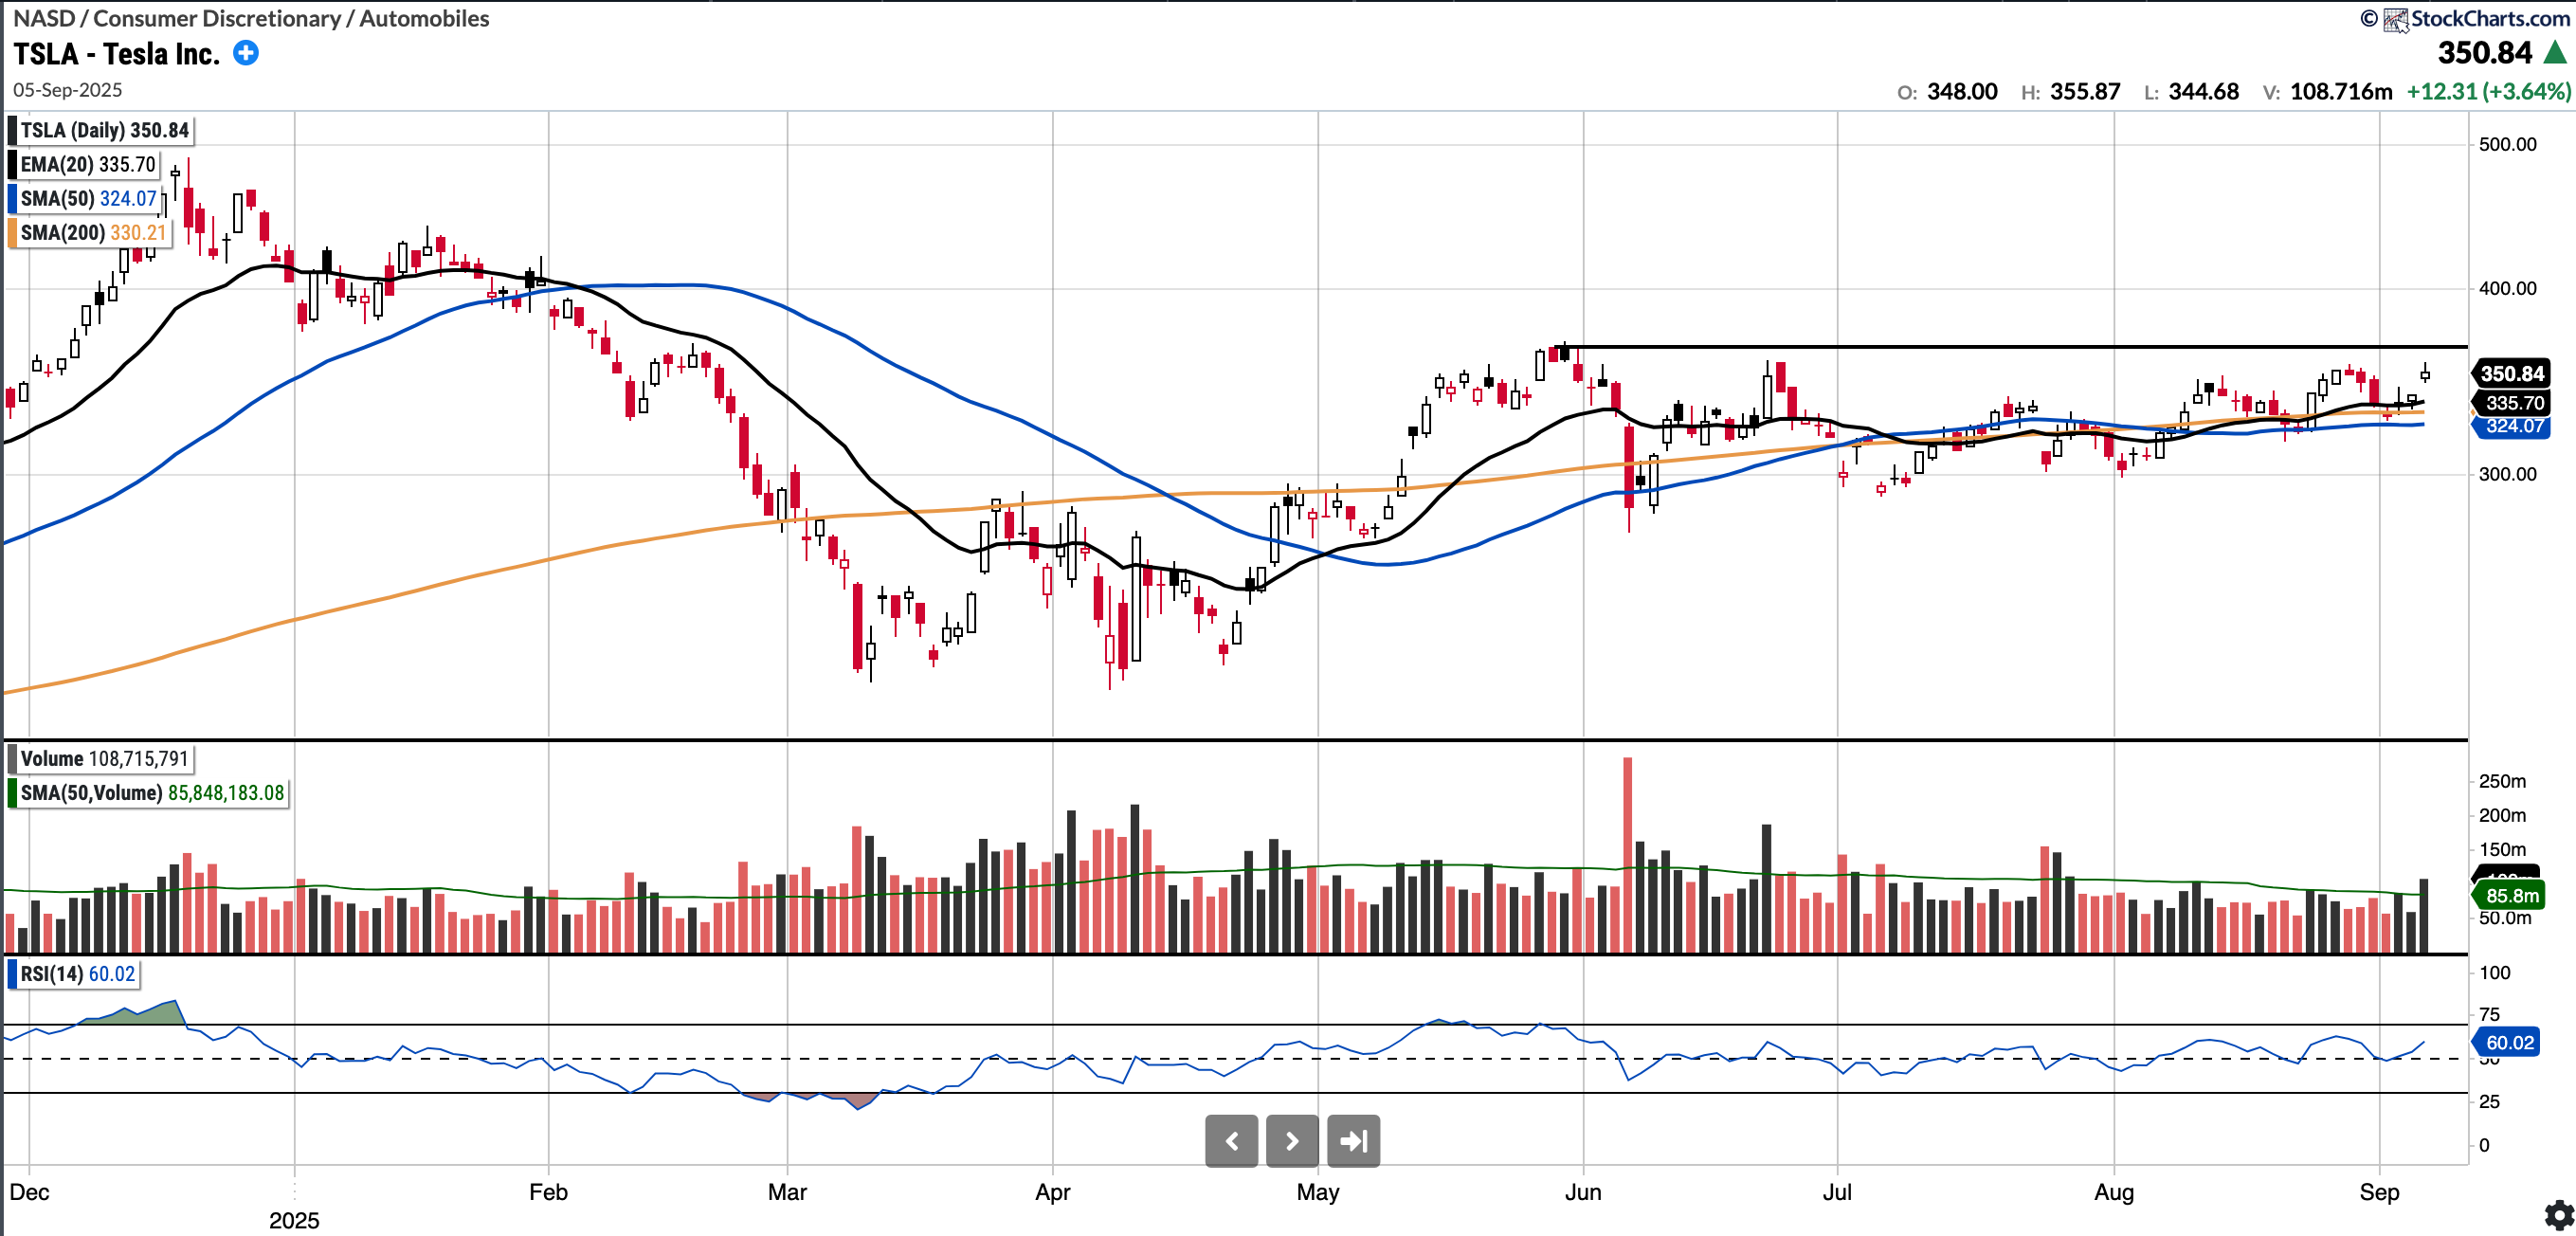
TSLA (No position)
Currently trades at $350.84 RSI 60.02 and 6.25% above 200SMA.
-7.5% YTD
TSLA stock has been range for the last 4 months oscillating between 280 and 365 but now price action is starting to compress. Furthermore, the stock has shrugged off a lot of bad news such as poor earnings reports, poor delivery numbers, the unimpressive launch of its Robotaxi, and, last but not least, Elon's misgivings with the sitting U.S. president. That is notable.
I still do see TSLA testing near term resistance of 365-368 above and if that range is broken cleanly, a run to 420 could be next.
However, tight price action does not necessarily have to resolve to the upside and if we get widespread market weakness then range lows of 280’s may be in play.
Notable portfolio changes in previous week (all updated live in subscriber channels :
