
Preview of the Week Ahead
W/C September 1, 2025

Hope you all are having a good weekend. Below we will be previewing the upcoming week.
Format for what is covered in this weekly preview:
A look at the indices
Key upcoming economic events
Upcoming earnings reports
Charts
Notable portfolio changes from the previous week
Current Portfolio Holdings
If it is your first time here, check out the post below on how to navigate the SixSigmaCapital Website:

I also highly recommend checking the “Monthly Portfolio Update” for my thoughts on the Market plus my own portfolio.

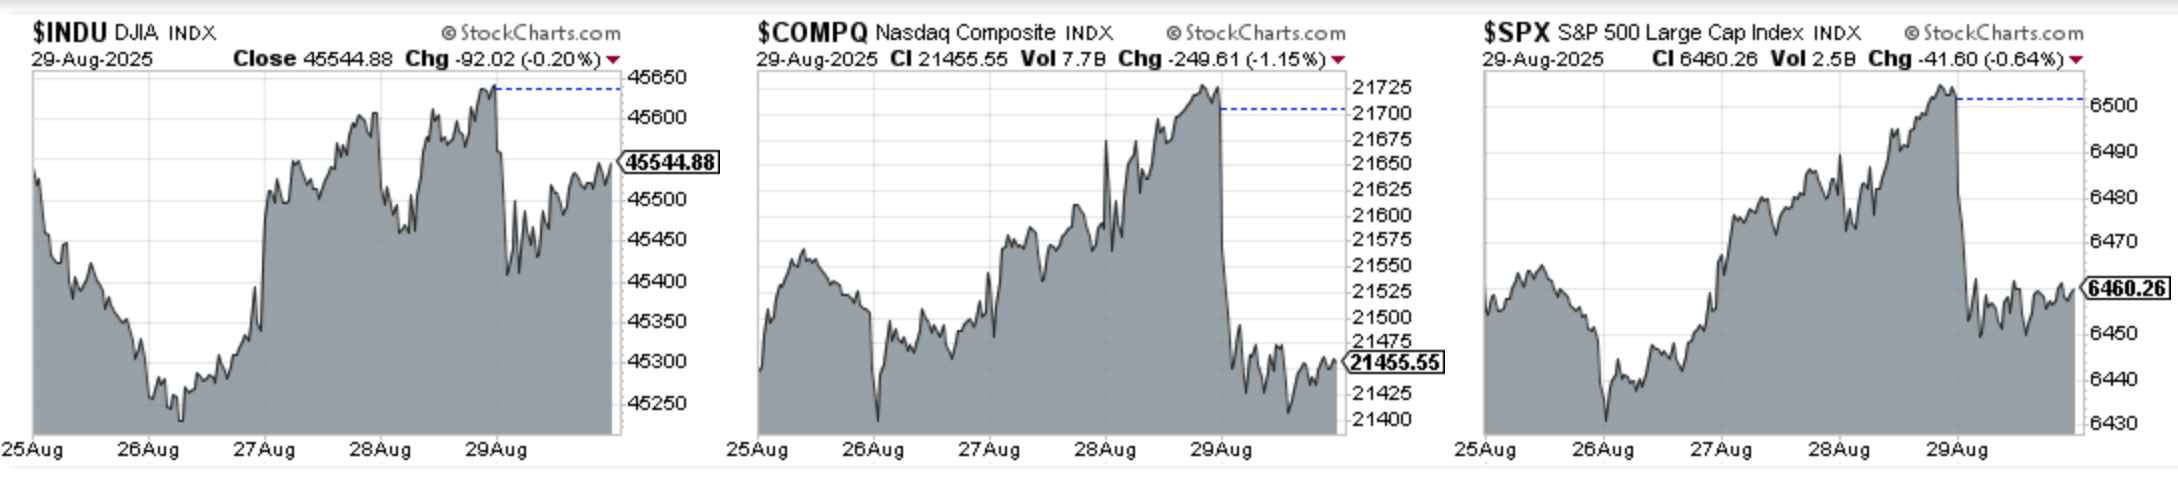
Indices
Dow Jones decline 0.01% in the last week
S&P 500 advanced 0.14% in the last week
Nasdaq Composite advanced 0.09% in the last week
IWM advanced 0.58% in the last week
Key upcoming events:
Monday, September 1:
Labor Day
Tuesday, September 2:
ISM Manufacturing PMI (August): A reading above 50 indicates expansion, while a reading below 50 signifies contraction.
Wednesday, September 3:
ISM Services (Non-Manufacturing) PMI (August)
The Federal Reserve's Beige Book
Thursday, September 4:
Weekly Initial Jobless Claims
U.S. Trade Balance
Friday, September 5:
Jobs Report (August): This is the most significant economic release of the week! Includes:
Non-Farm Payrolls (NFP)
Unemployment Rate: The percentage of the labor force that is jobless.
Average Hourly Earnings: A key indicator of wage inflation.
Upcoming Earnings
Last week was a quieter week although did have a few portfolio names reporting and of course, NVDA. No portfolio positions reporting this week!
Below is the infographic by Earnings Whispers for the upcoming week:

Charts
SPX
Sits currently at 6501.86.91, RSI 58.36, 2.28% above a rising 50SMA.
10.79% YTD
Still in a strong uptrend and made a new ATH last week.. We did get a pullback to the EMA 21 at the start of August which was held and we rebounded nicely from. Whilst traders are expecting a weak September, our job is to yes to have a plan but ultimately to trade price.
Distribution days in the last week: 0

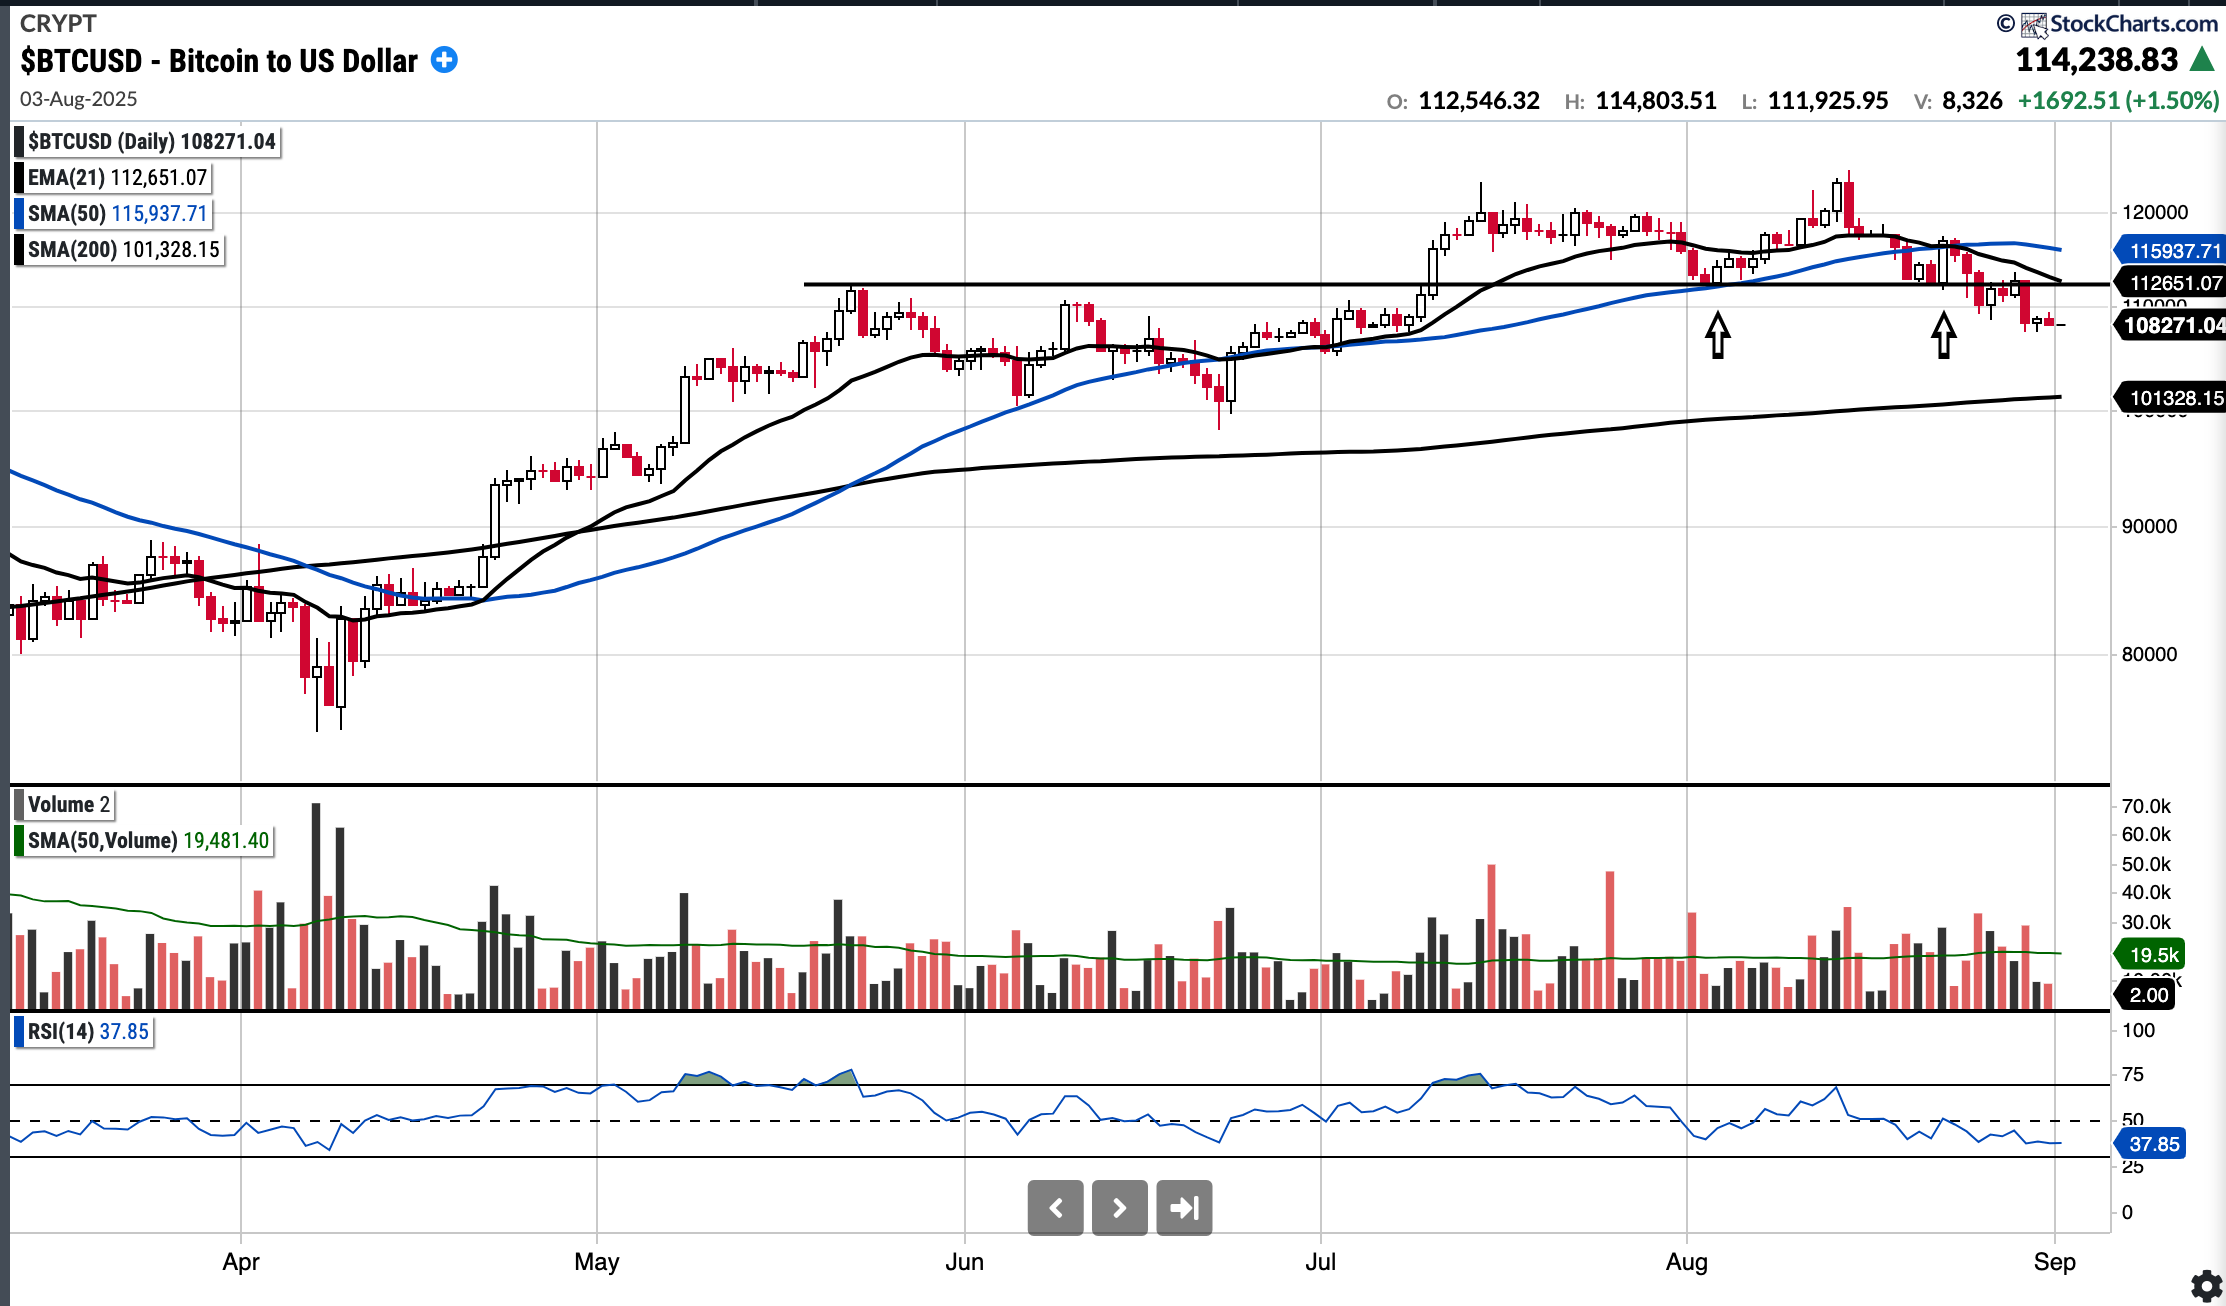
BTC (currently Long)
Currently $108,271.01, -6.61% below 50 SMA and 6.85% above 200SMA.
14.67%% YTD.
BTC sold off 2.7% in the last week, on above average volume on each of Monday, Wednesday and Friday. Last week I mentioned that 112k was the level to hold and if broken then we could see a move to 100/101k. This could be a logical re-test level if BTC continues to show weakness and would correspond with the SMA 200 also.
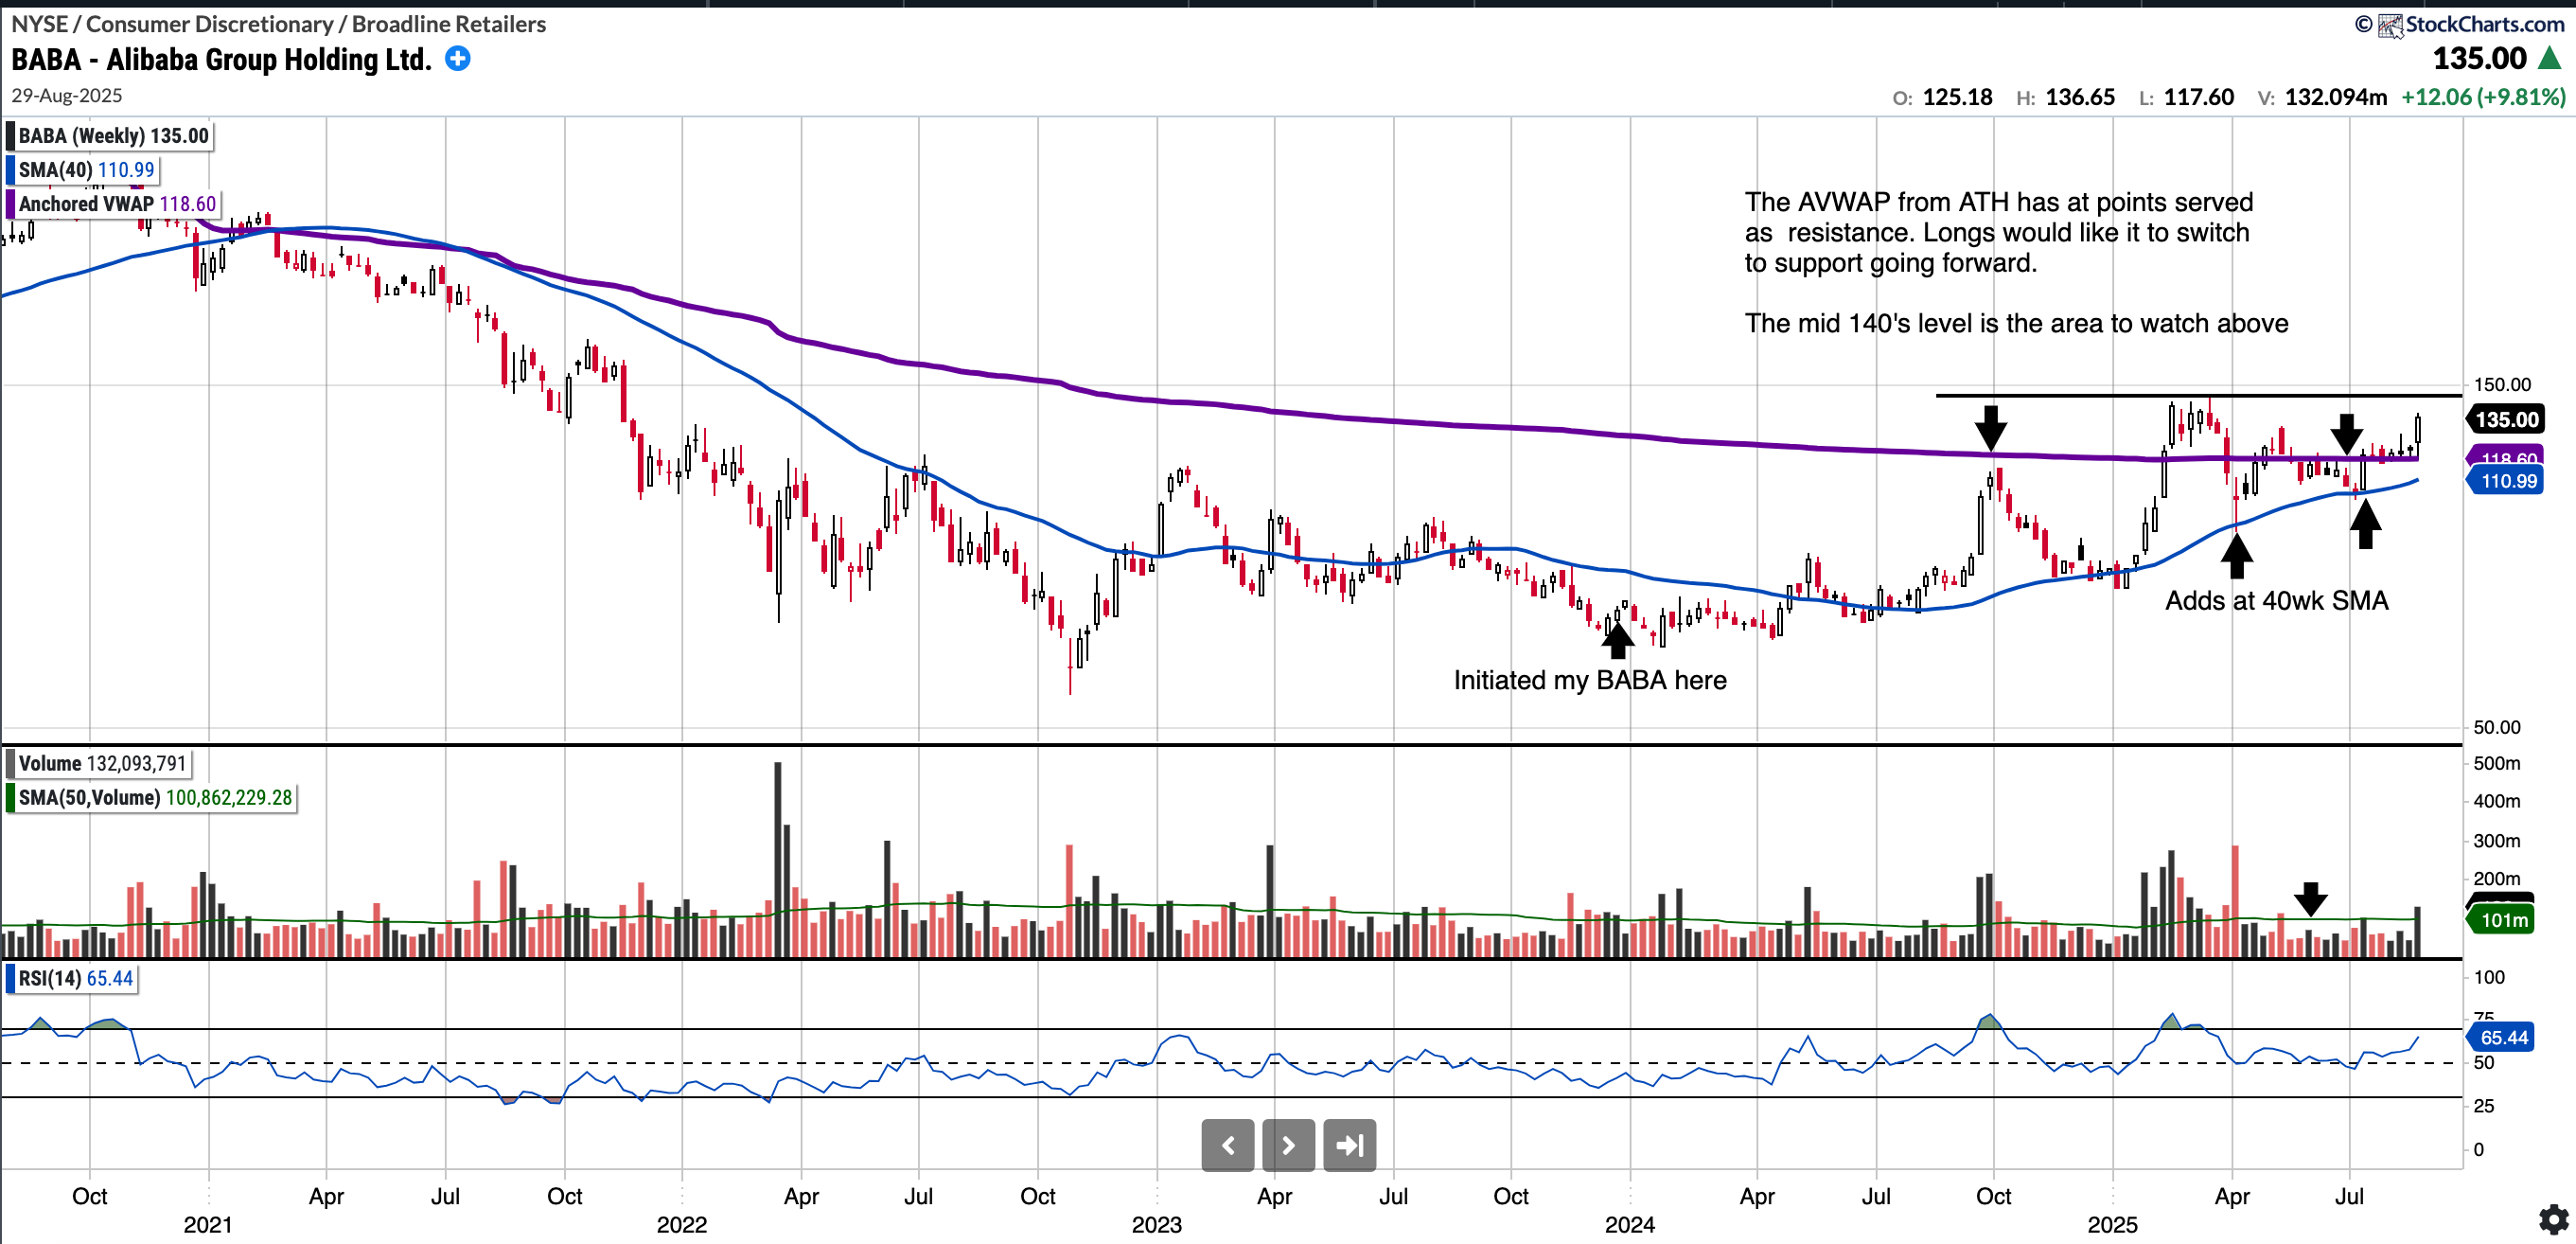
BABA (currently Long)
Currently trades at $135.00 RSI 65.44 and 22.76% above 200SMA.
+58.92% YTD
BABA had a decent run earlier in the year but found this year but found resistance in the mid 140 level where I previously reduced some of the position BABA trim March 17th 2025
Last week I wrote “Earnings Friday could serve as a catalyst to get this moving again into a stage 2 breakout”. On Friday, the market was buoyed by Baba’s cloud growth and commitment to AI projects.
Stock could be at the start of a stage 2 breakout now and I feel the mid 140’s high from earlier this year is the near term upside target to watch. Above that, my realistic target IF business remains robust plus upside catalysts play out like like US-China deal is ~180. At this level would be ~17x next years earnings and a PEG of <1 still.
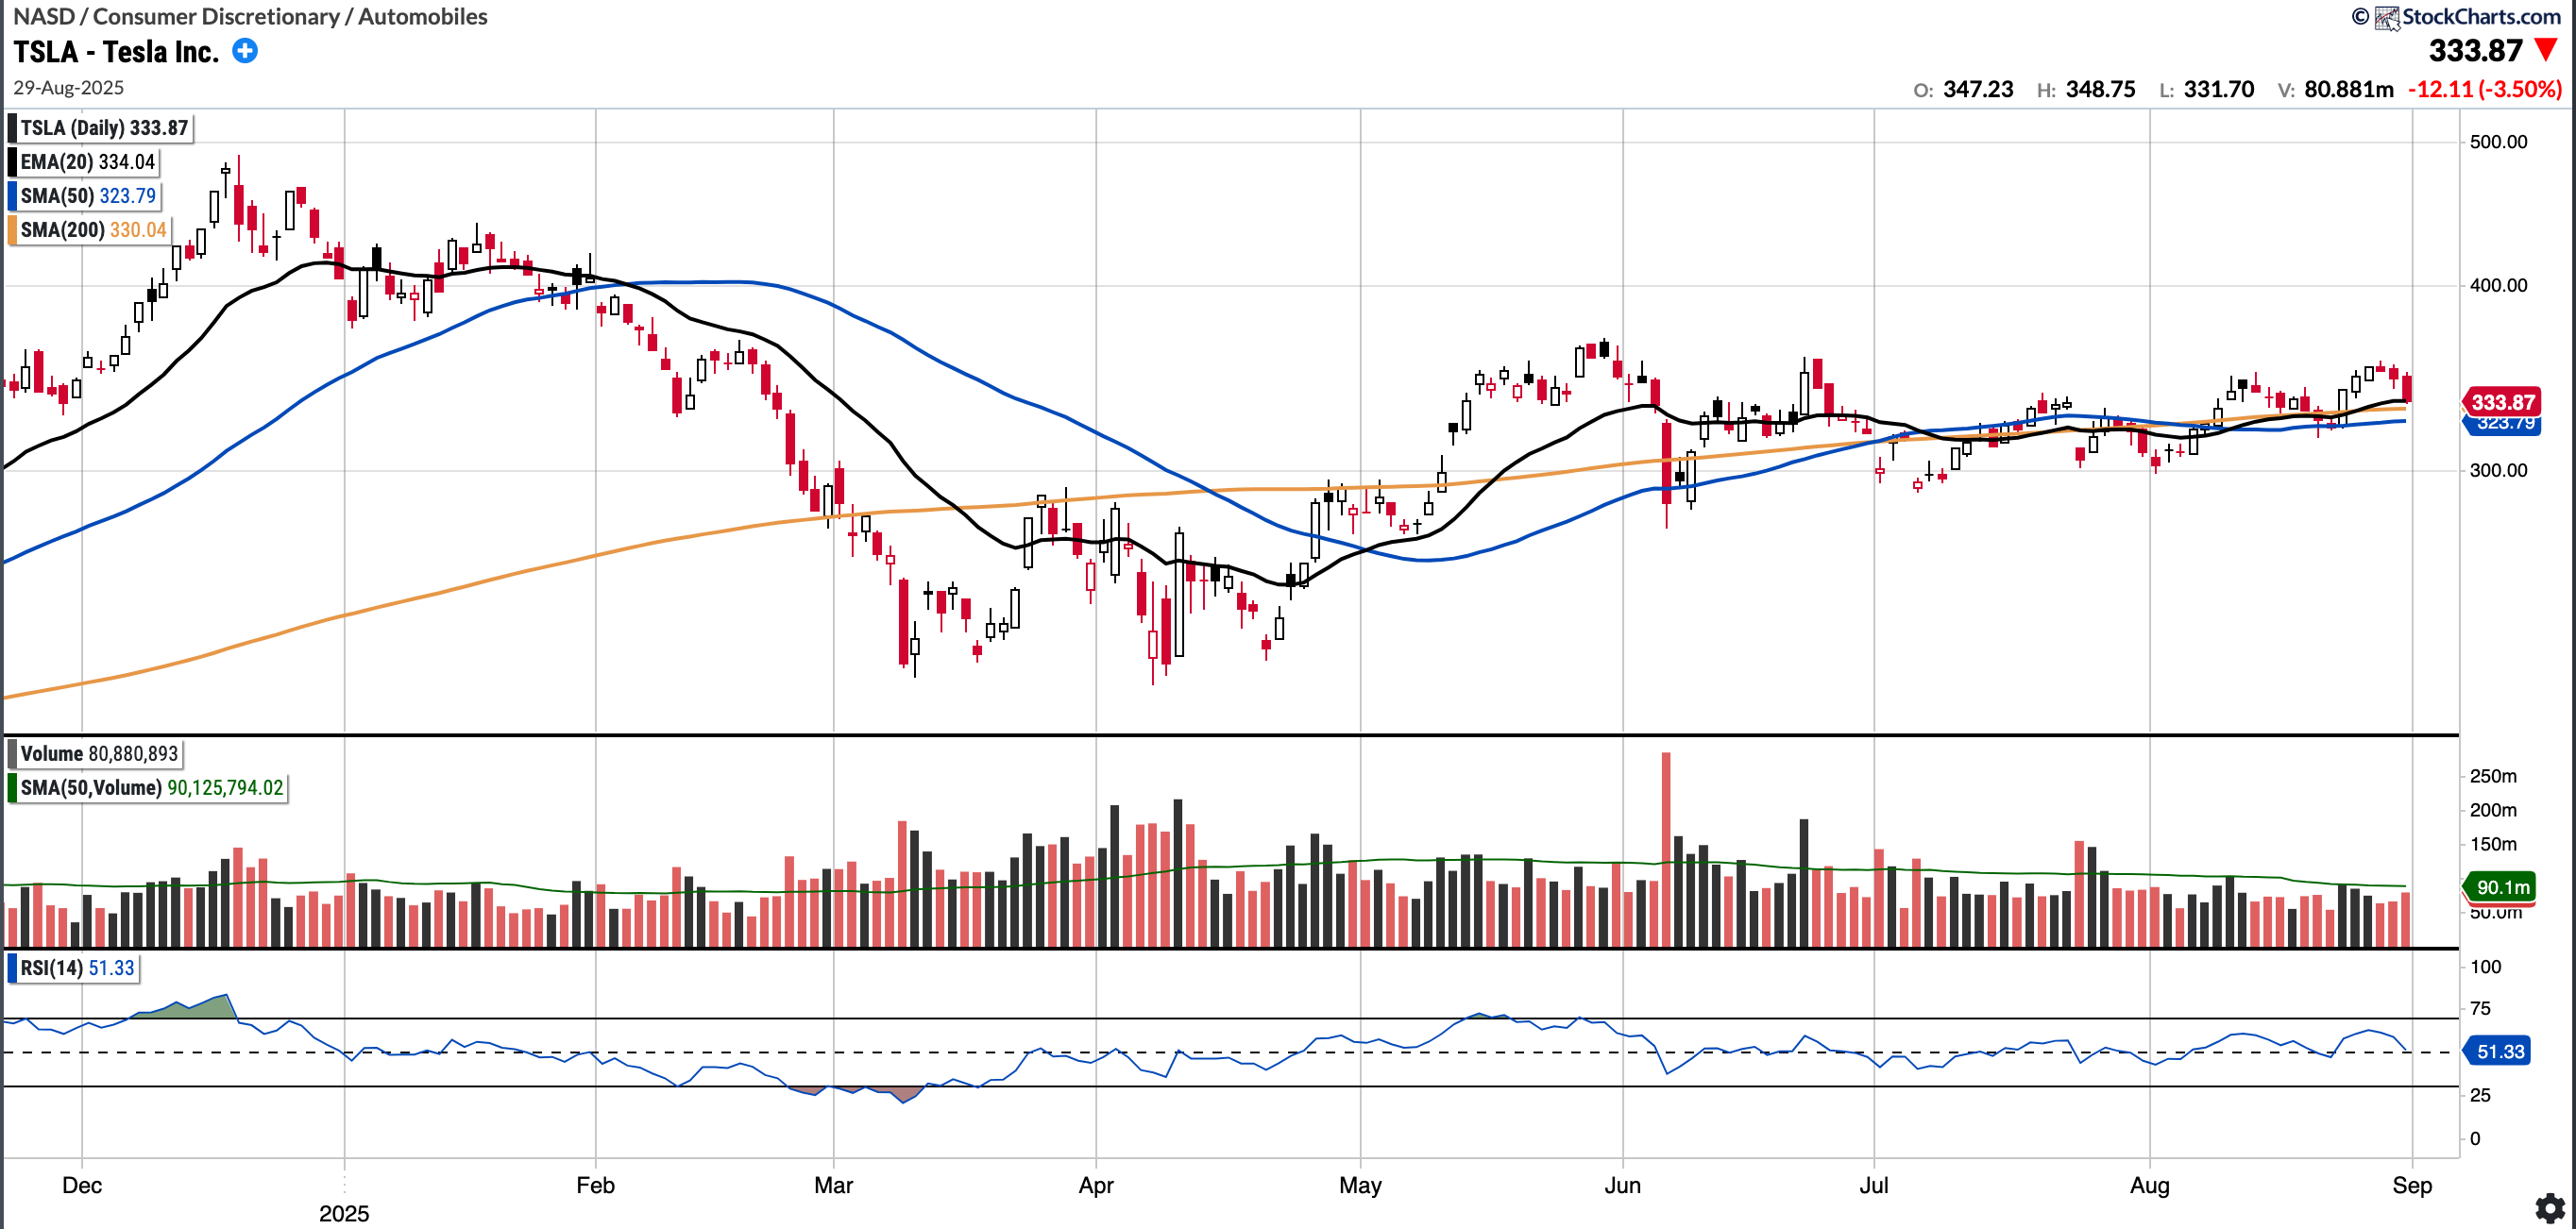
TSLA (No position)
Currently trades at $333.87 RSI 51.33 and 1.16% above 200SMA.
-11.97%% YTD
TSLA key moving averages are coming to a confluence at ~330 and the stock has shrugged off a lot of bad news in recent weeks, such as poor earnings reports, poor delivery numbers, the unimpressive launch of its Robotaxi, and, last but not least, Elon's misgivings with the sitting U.S. president. That is notable.
Whilst TSLA was down this week, I would not be surprised to see TSLA test near term resistance of 365-368 above. If that range is broken cleanly, a run to 420 could be next.
However, tight price action does not necessarily have to resolve to the upside and if we get widespread market weakness then range lows of 280’s may be in play.
Notable portfolio changes in previous week (all updated live in subscriber channels):
