
Preview of the Week Ahead
W/C October 27, 2025

Hope you all are having a good weekend. Below we will be previewing the upcoming week and providing a portfolio update as usual.
Format for what is covered in this weekly preview:
A look at the indices
Key upcoming economic events
Upcoming earnings reports
Charts
Notable portfolio changes from the previous week
Current Portfolio Holdings (Position size, cost basis, and commentary on each holding regarding the intended holding period and any planned activity)
If it is your first time here, check out the post below on how to navigate the SixSigmaCapital Website and subscribe to the option that suits.

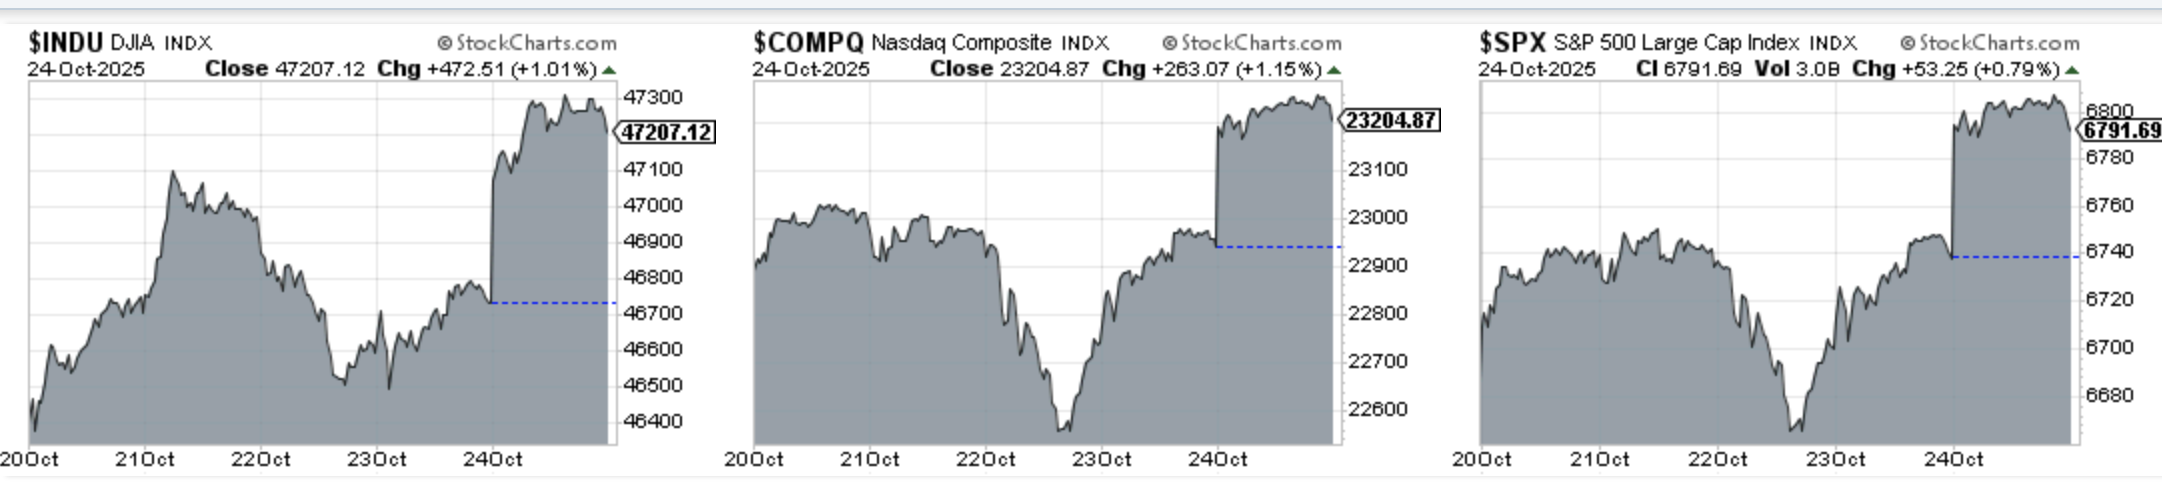
Indices
Dow Jones advanced 1.75% in the last week
S&P 500 advanced 1.27% in the last week
Nasdaq Composite advanced 1.49% in the last week
IWM advanced 0.93% in the last week
Key upcoming events:
Monday, October 27
Durable Goods Orders (September)
Tuesday, October 28
S&P/Case-Shiller Home Price Index (August)
Consumer Confidence (October)
Wednesday, October 29
Pending Home Sales (September)
FOMC Interest Rate Decision (2:00 PM ET)
FOMC Press Conference (2:30 PM ET)
Thursday, October 30
Gross Domestic Product (GDP) Advance Estimate (Q3)
Friday, October 31
Employment Cost Index(Q3)
Personal Income and Spending, Core PCE Price Index (September)
Chicago PMI (October)
This week is packed with key economic events especially FOMC Wednesday, GDP Thursday and then PCE on Friday (Fed’s preferred inflation metric)
Upcoming Earnings
This week we have a busy schedule notably with the hyper-scalers reporting plus other key names. I have portfolio names reporting this week.
Below is the infographic by Earnings Whispers:

Charts
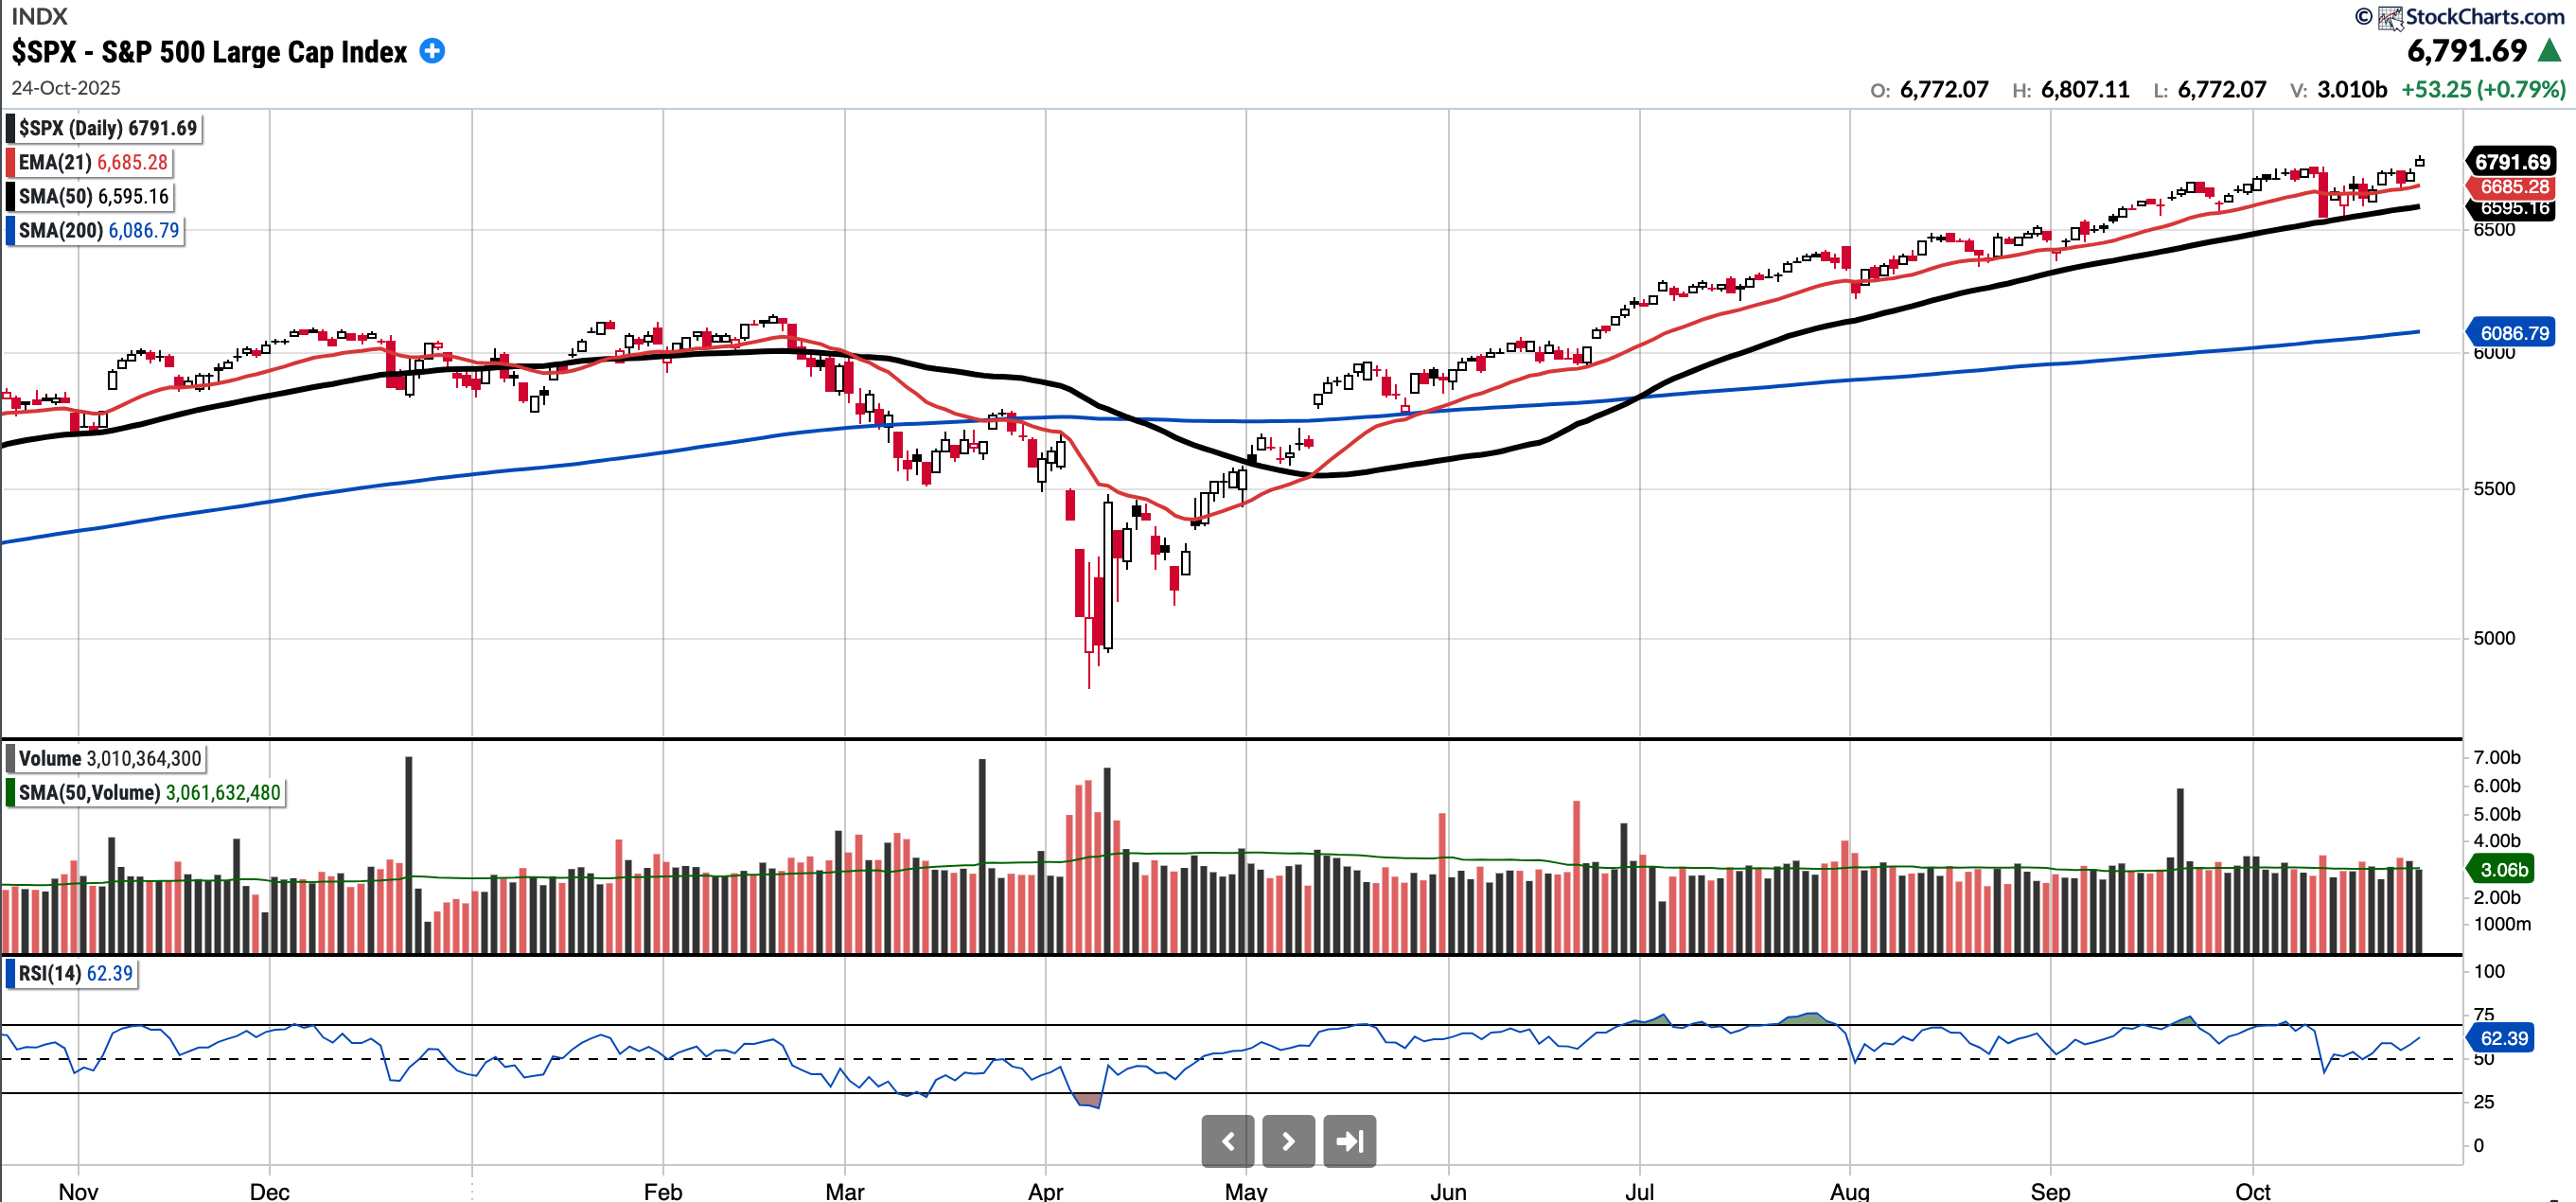
SPX
Currently trades at 6791.69, 2.98% above a rising 50SMA and 11.58% above 200SMA.
RSI 62.39
15.73% YTD
SPX closed at an ATH and 6800 level was even surpassed.
Distribution days in the last week: 1
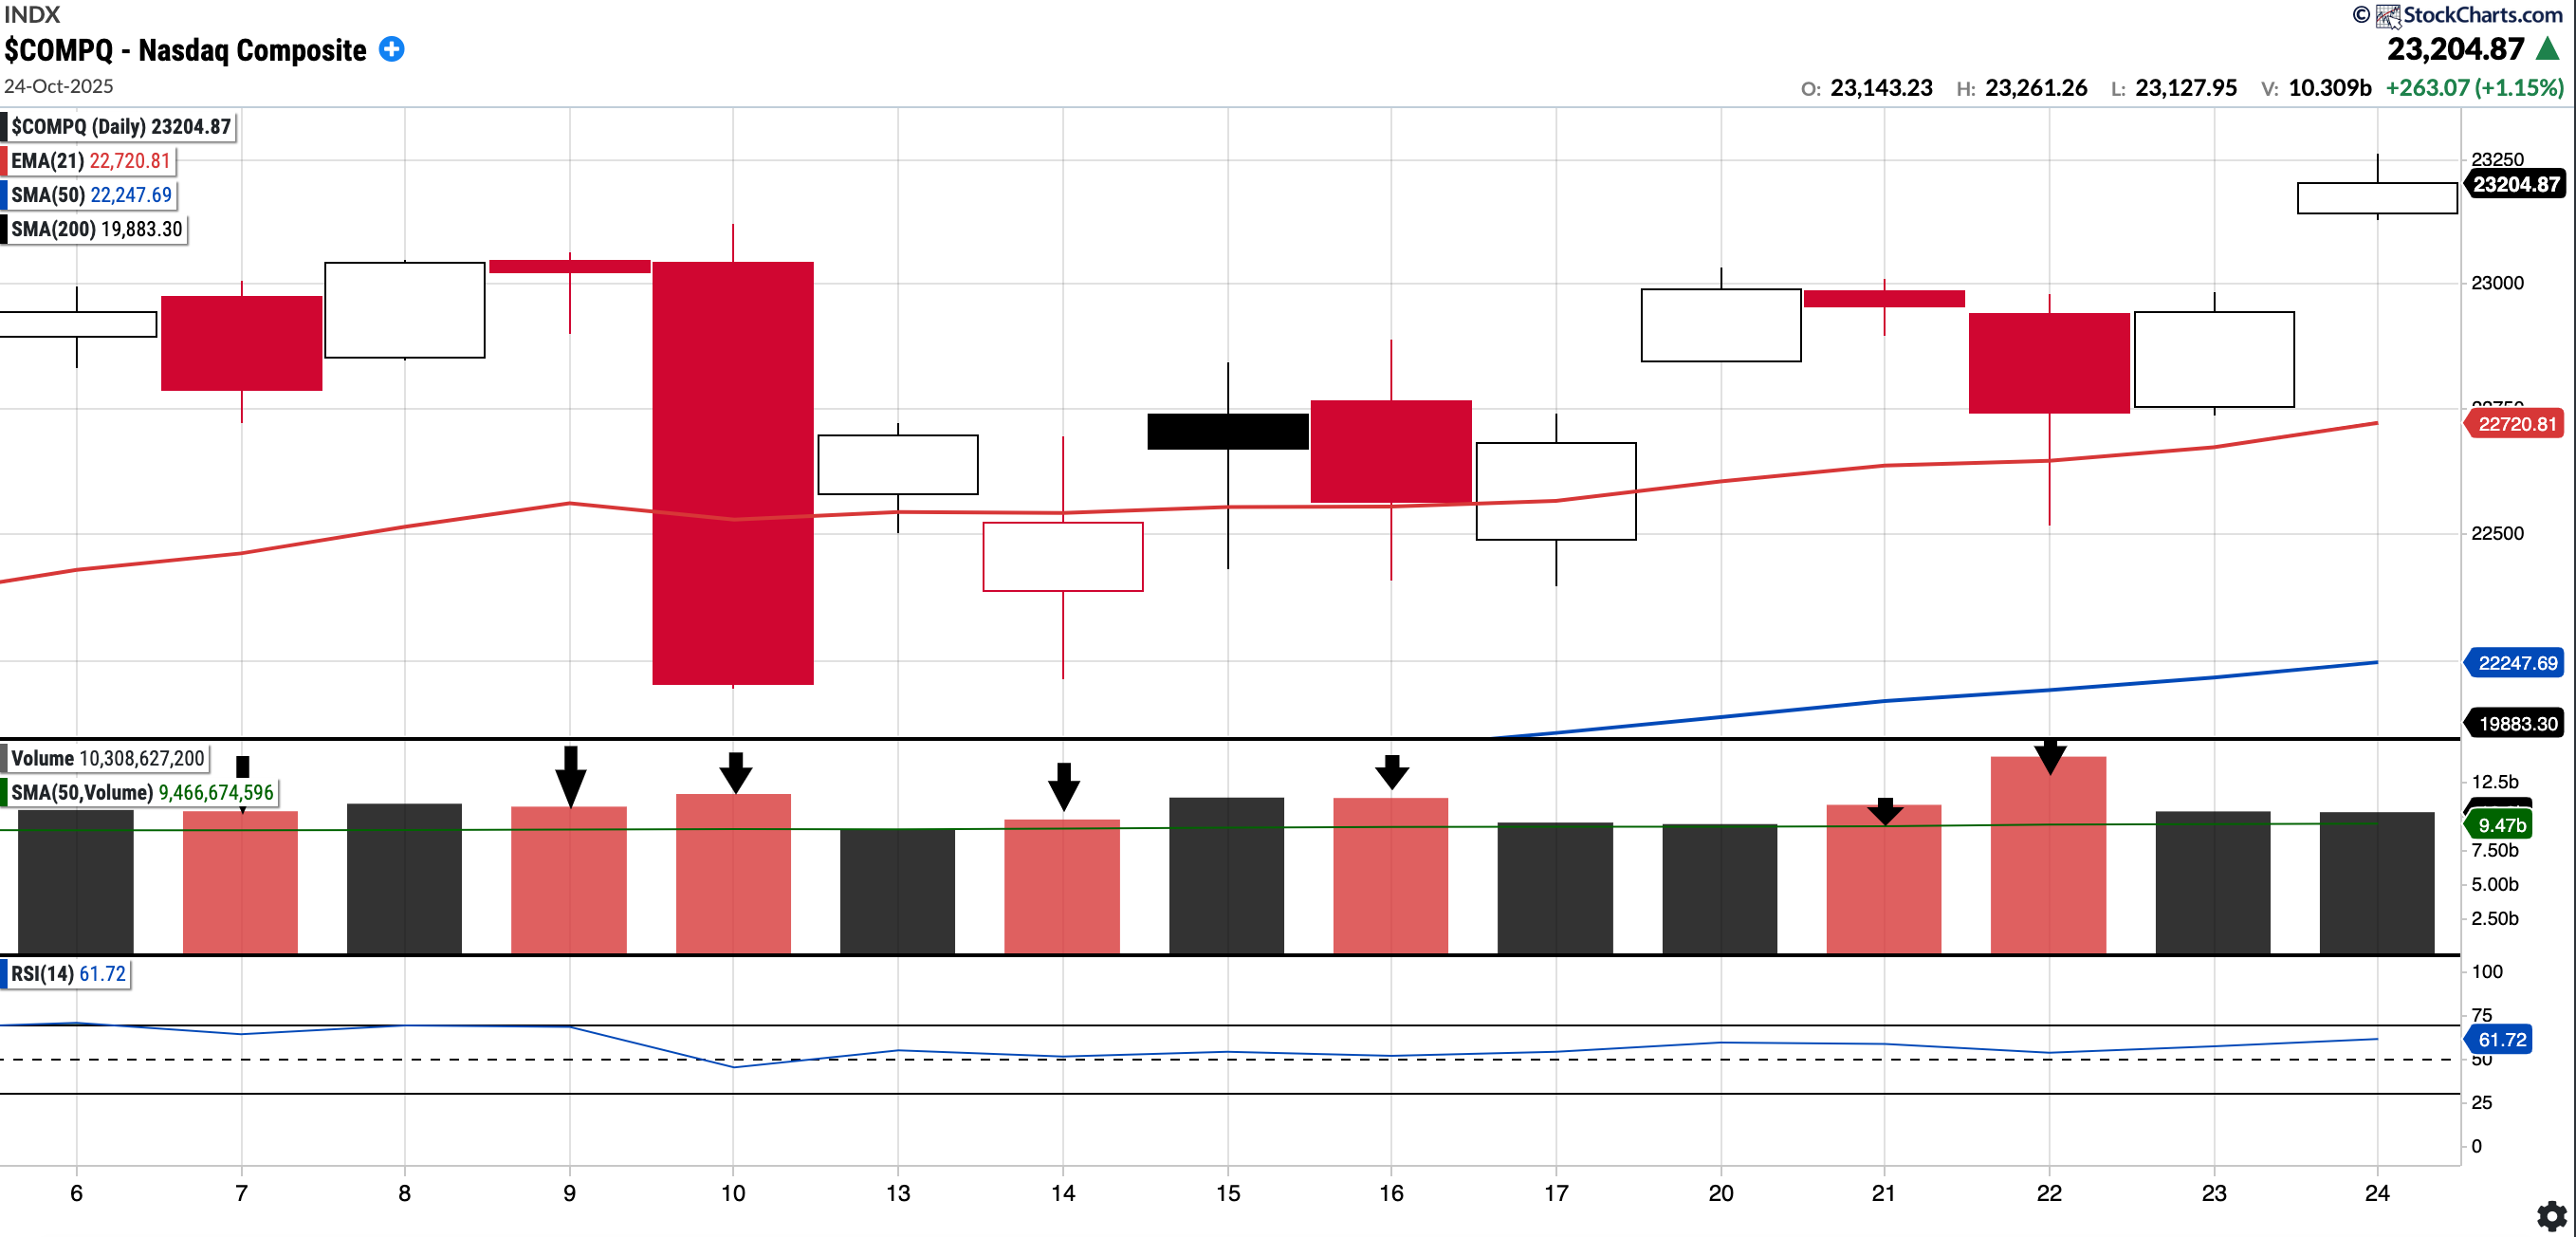
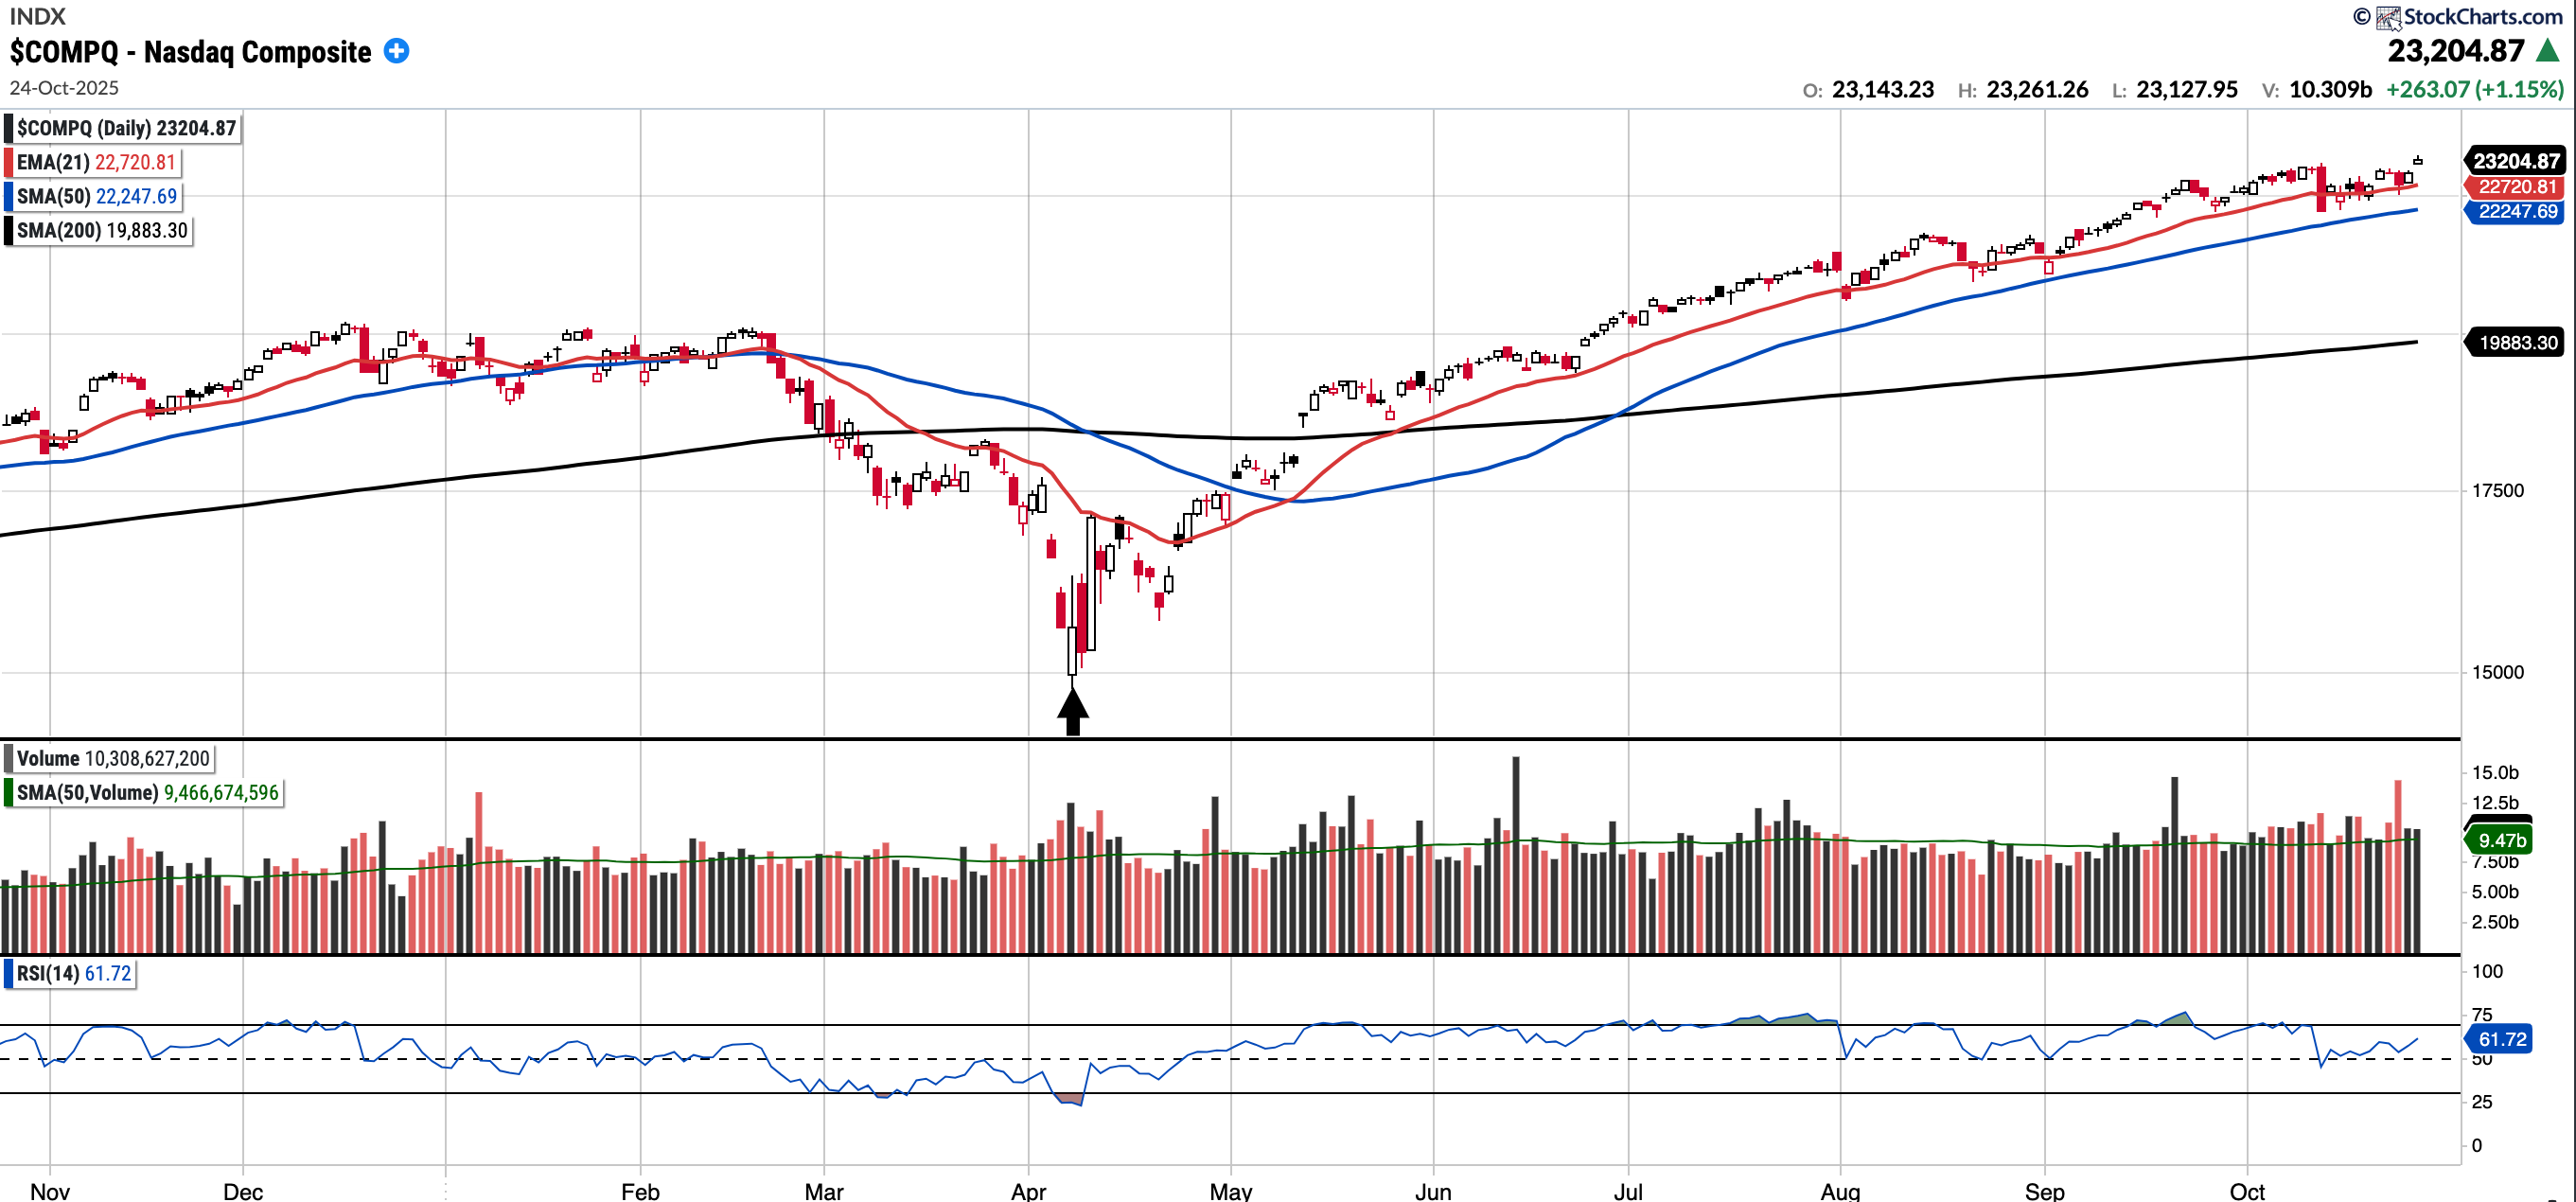
COMPQ
Currently trades at 23,204.87, 4.3% above a rising 50SMA and 16.71% above 200SMA.
RSI 61.72
20.35% YTD
Distribution days in the last week: 2 in the last week and 7 in the last 15 days. Notable
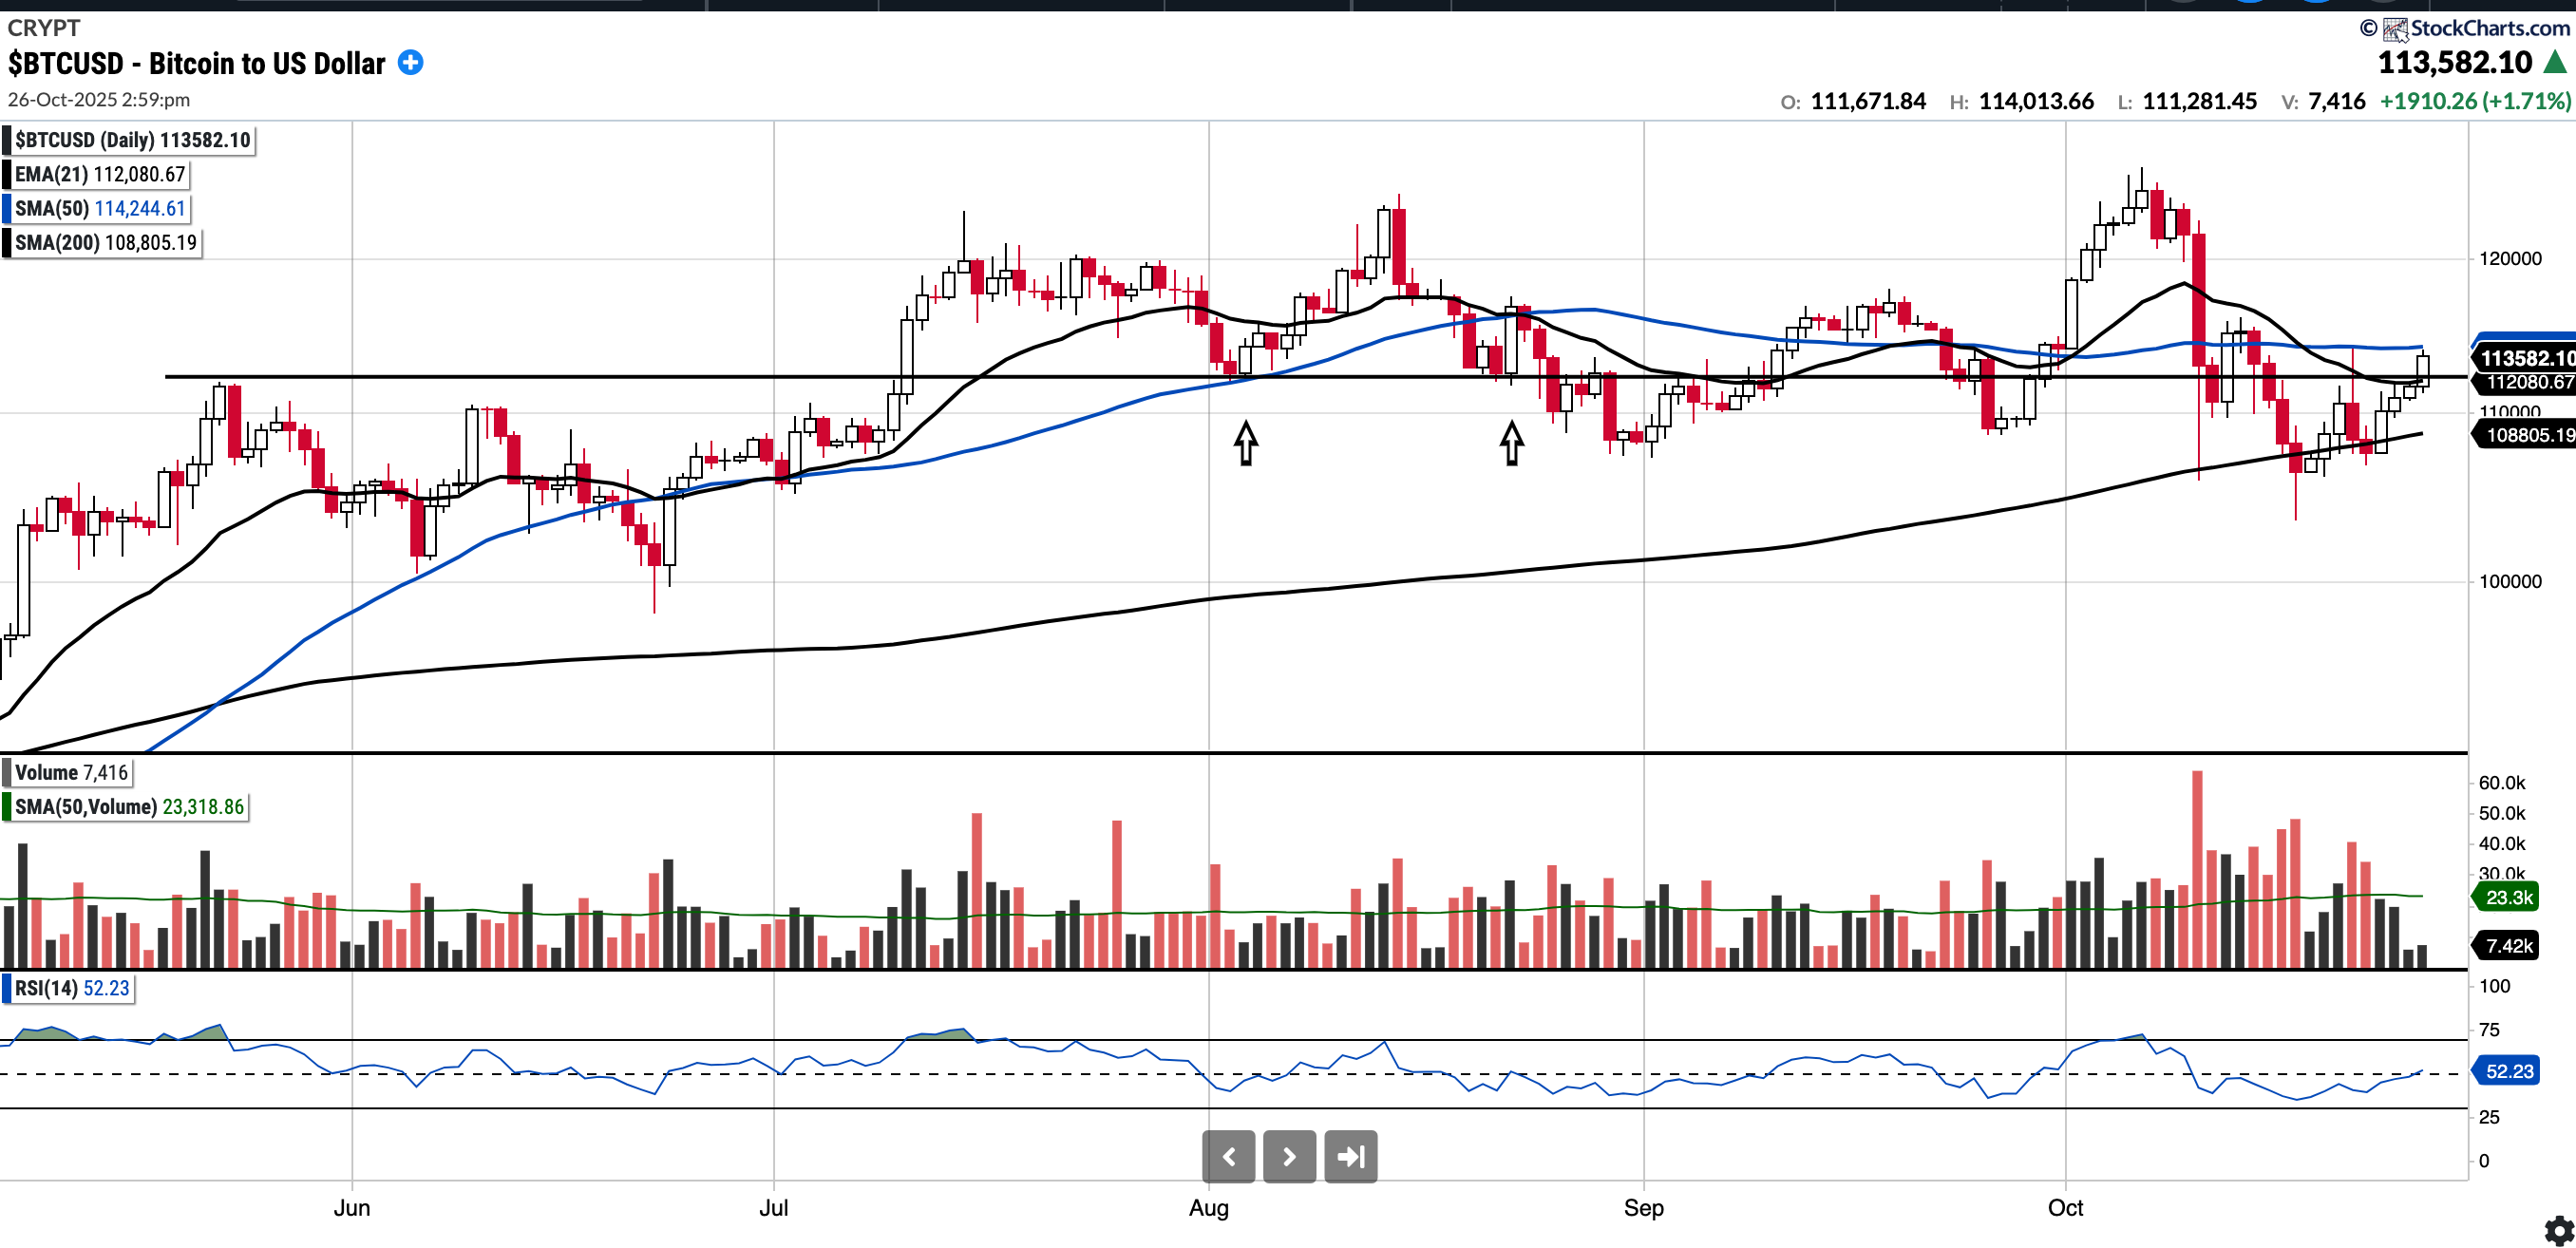
BTC (currently Long)
Currently trades at $113,465.92, 0.59% below the 50SMA and 4.39% above 200SMA.
RSI 52.23
20.28% YTD.
BTC is up ~4.7% in the last week and is currently testing the underside of the SMA 50 ($114,244). At the time of writing, BTC has reclaimed the $112k level of interest. The positive US and China news could serve as a boon in the short term for a move up for BTC. 120k will be the initial level to watch on the upside and on the downside to ensure 200SMA is defended.
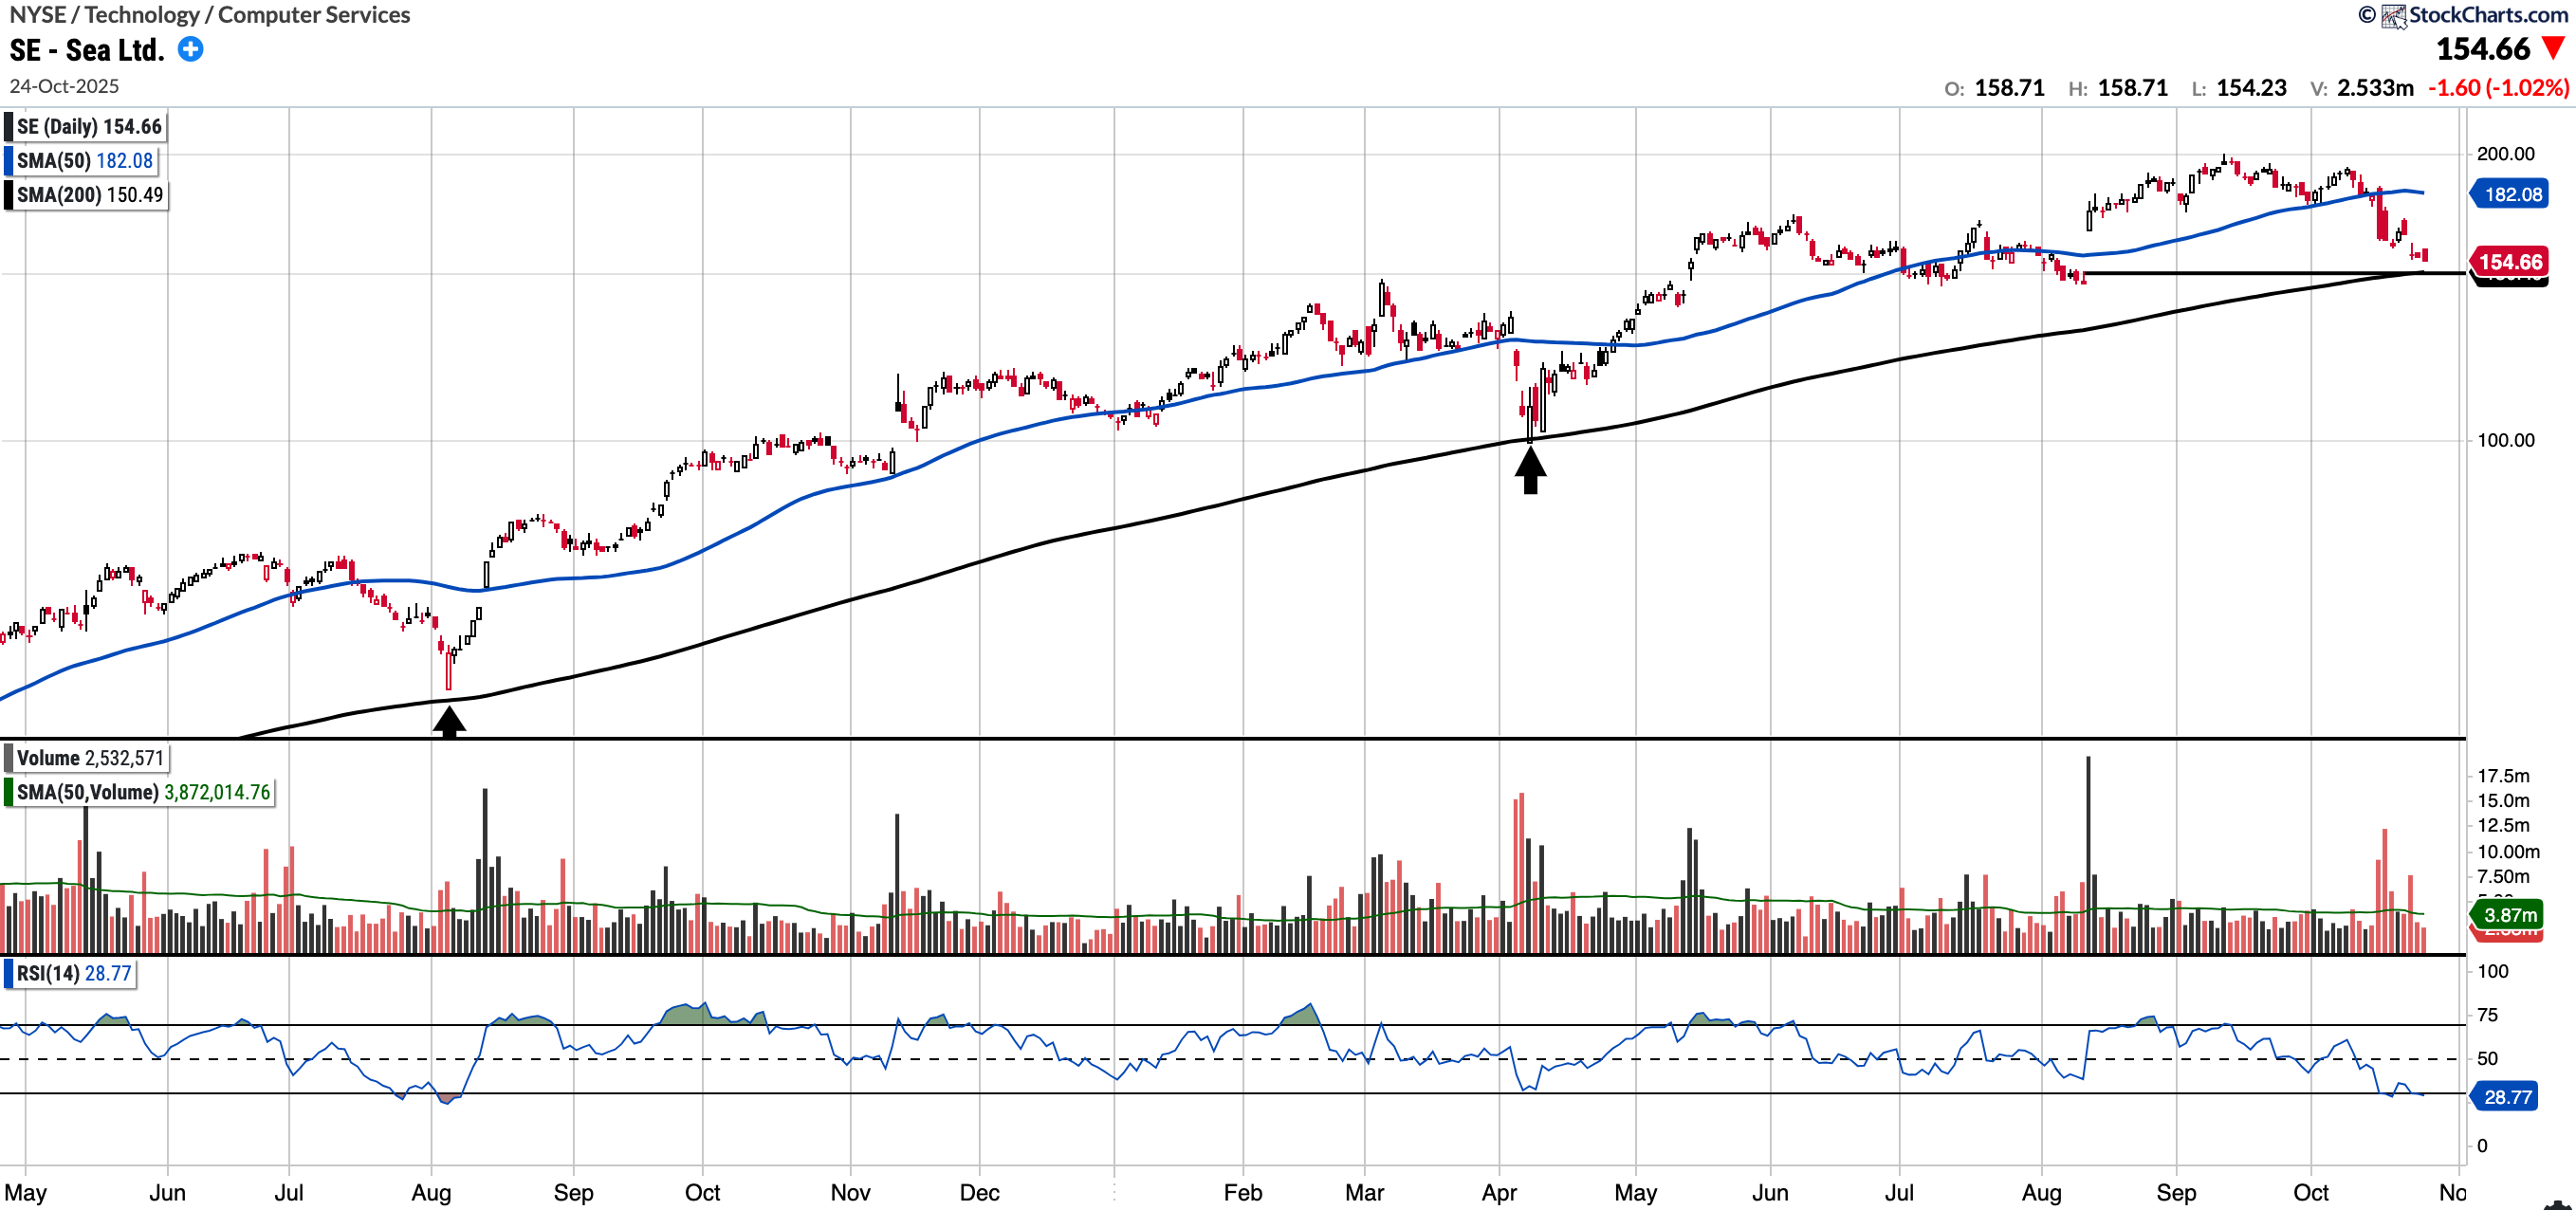
SE (currently Long)
Currently trades at $154.66, 15.06% below the 50SMA and 2.77% above the 200SMA.
RSI 28.77
+47.48% YTD
SE has had a strong couple of years and remains in an uptrend. It has pulled back from its recent high of 199 on almost no known news. Notable level to watch in my view is ~$150 which coincides with gap fill and SMA 200 level.
Remarkably it trades at PEG of ~0.6 and at current prices ~28x FY26 earnings and ~20x FY27 earnings. I will probably be looking to add some for the long term at such levels.
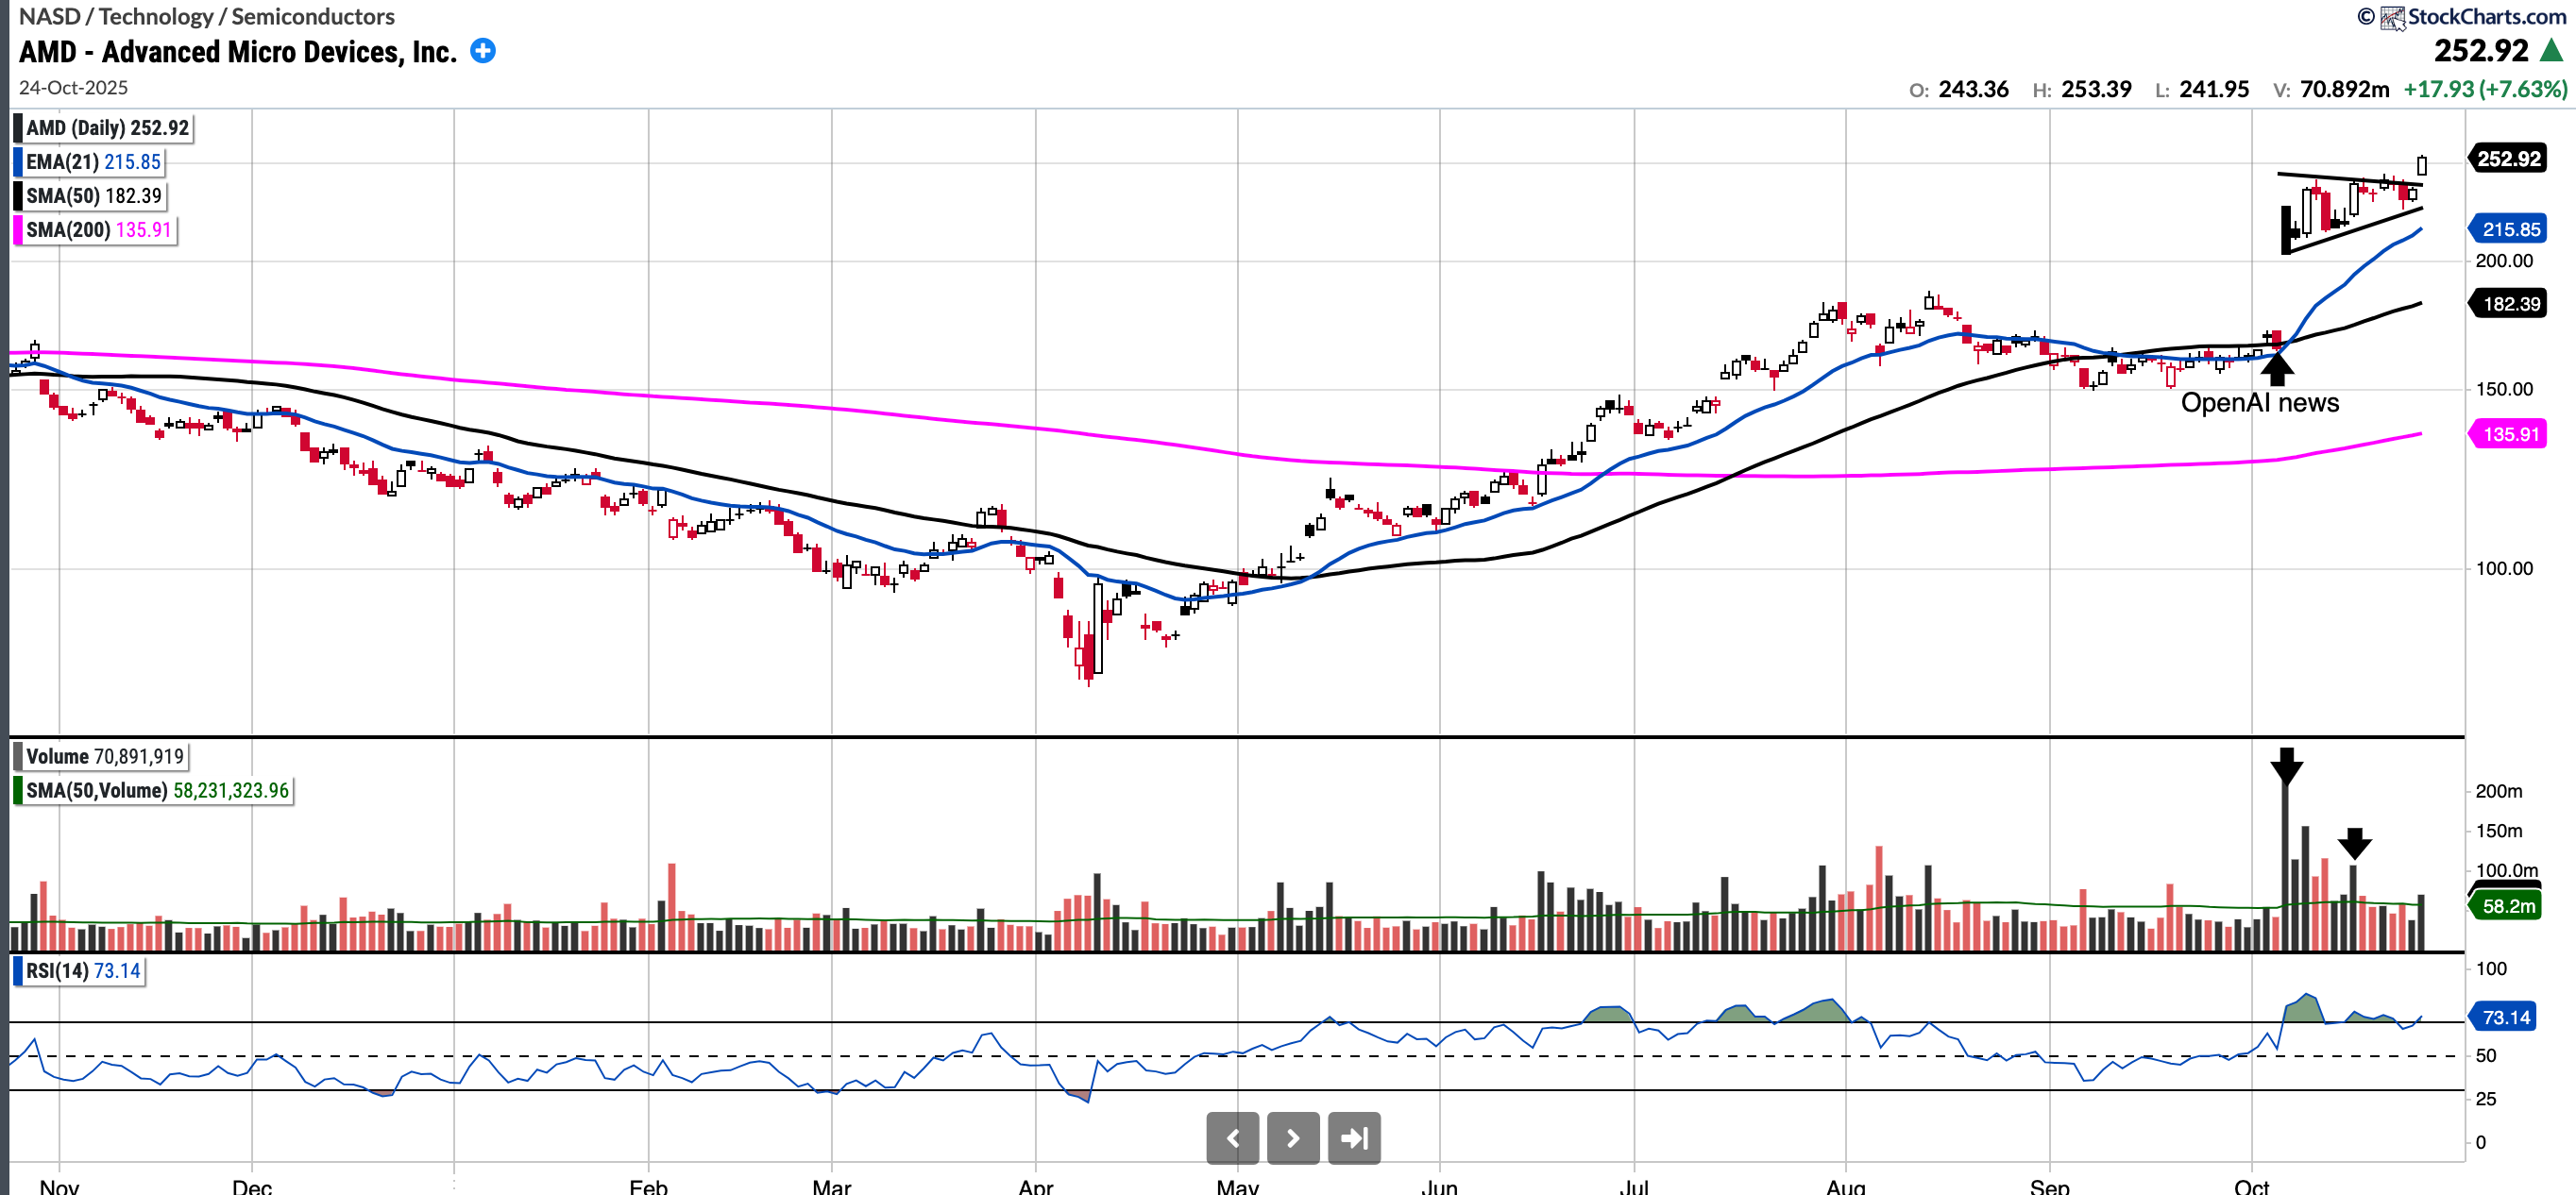
AMD
Currently trades at $252.92, 38.67% above the 50SMA and 86.1% above 200SMA.
RSI 73.14
109.67% YTD
AMD was trading at around $165 last Monday when the news of it’s multiyear partnership with OpenAI hit the tape.
Since then, the stock is up approximately $87 and has become the 25th largest company in the World by market-cap! Huge volume has entered the stock serving as proof of a notable sentiment shift.
The stock is overbought although appears to be breaking out of a bull flag/ascending wedge and could continue to run. Maybe 280 is in the cards?
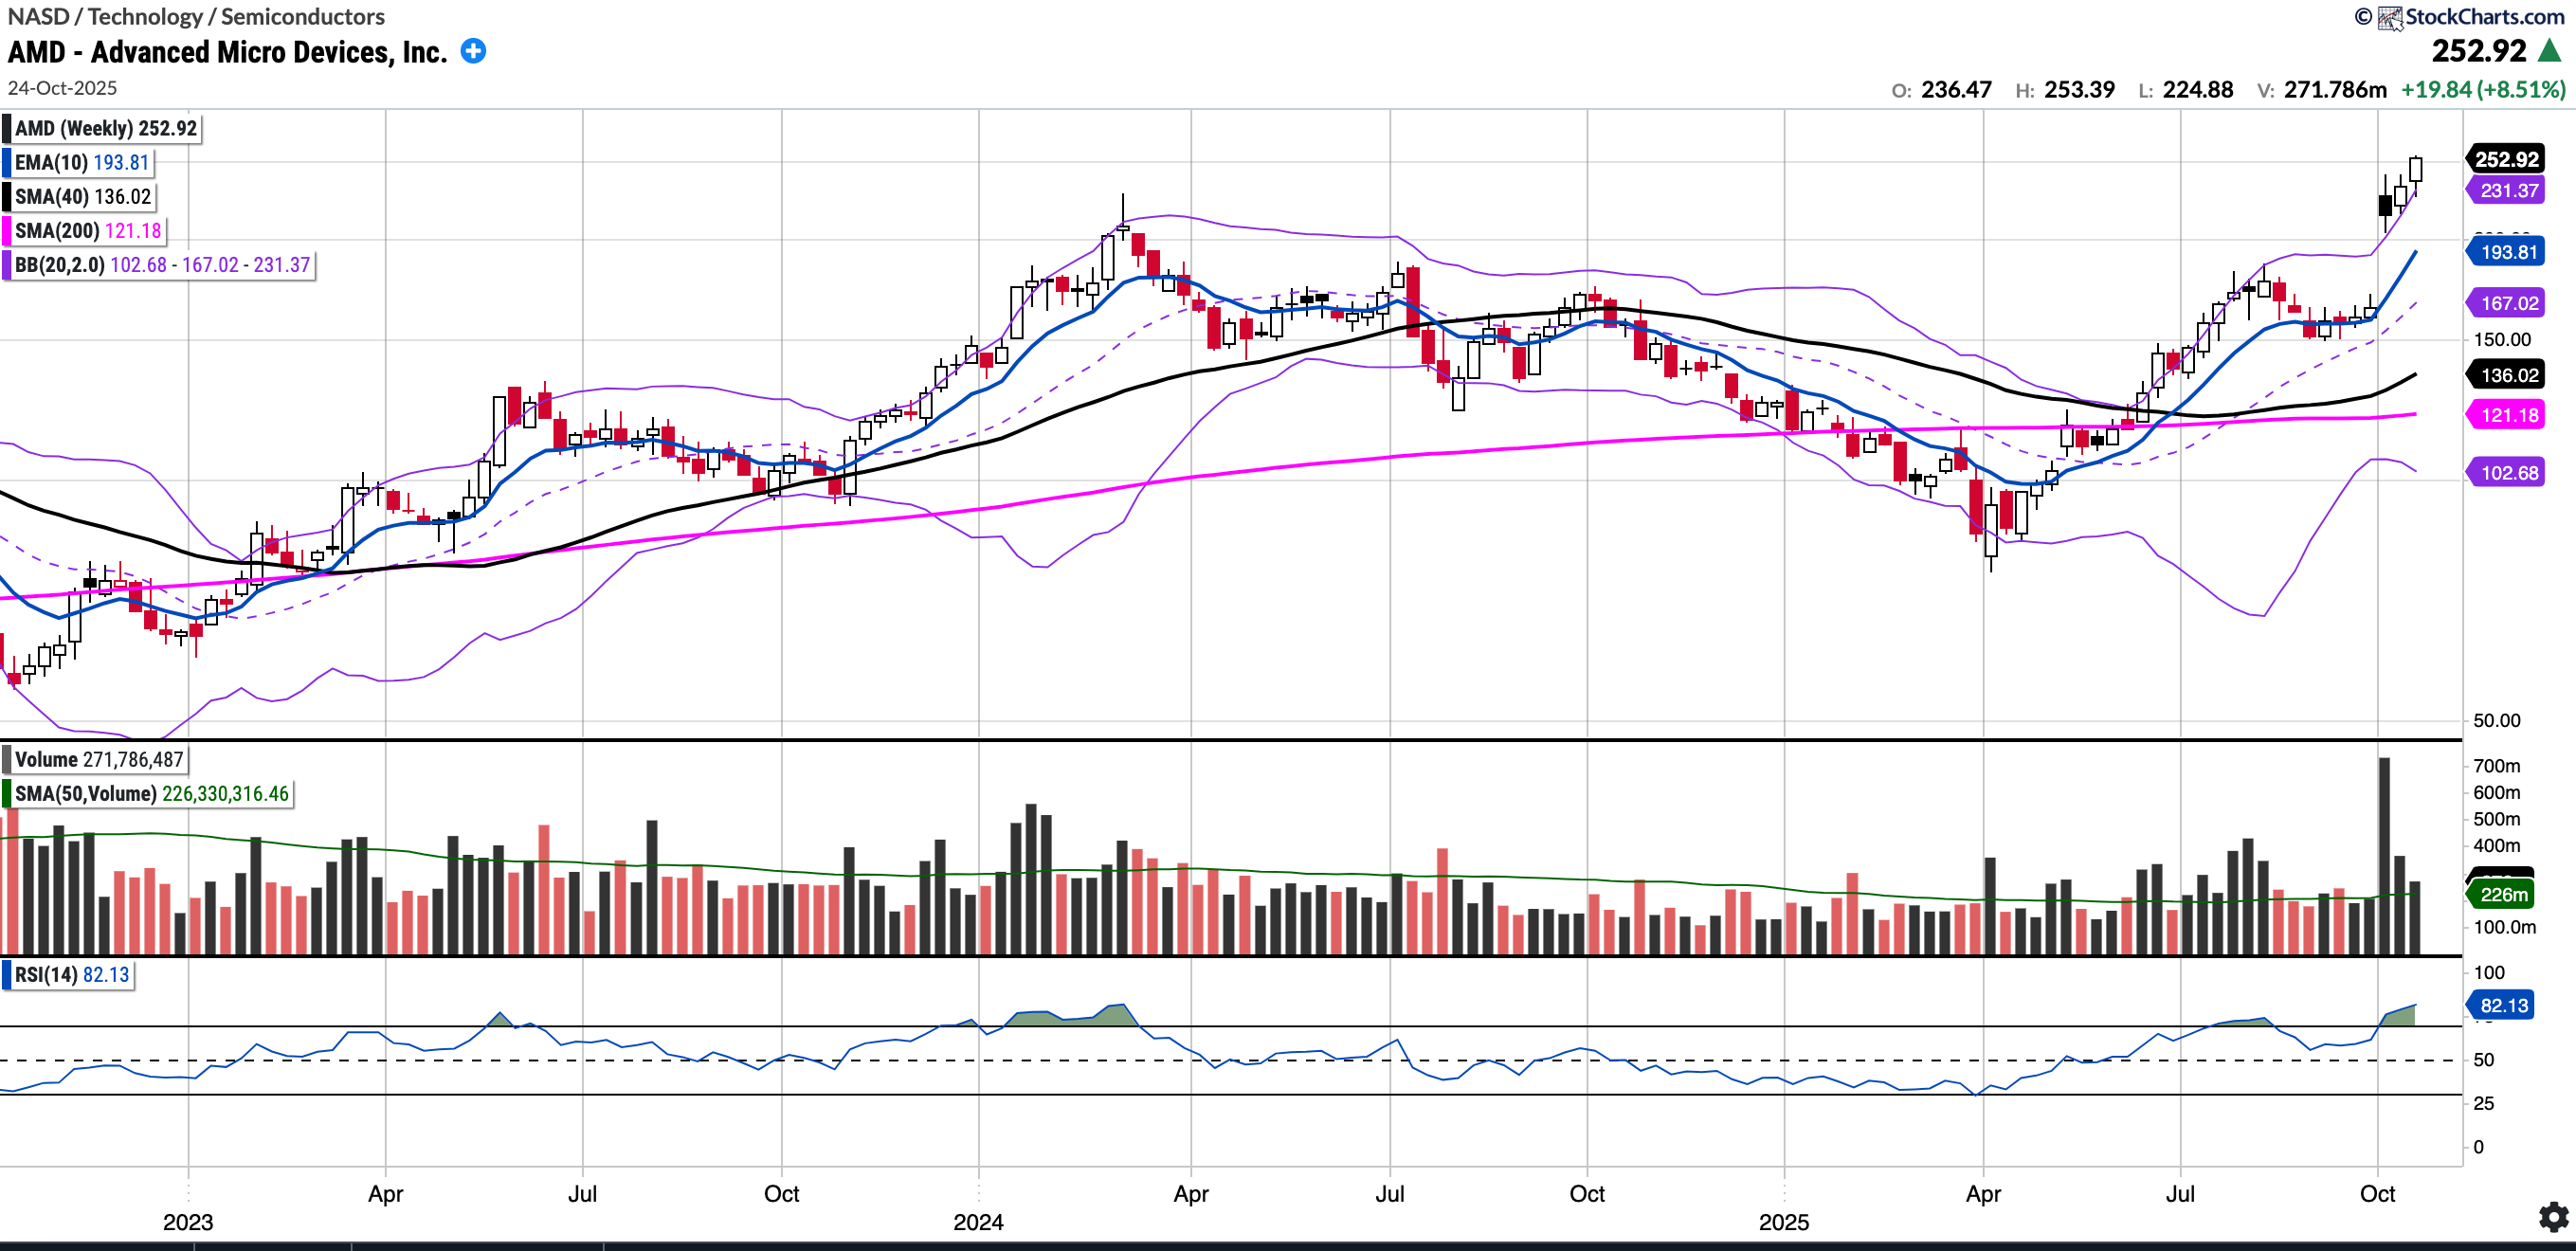
The weekly chart shows AMD trading outside of the Upper Bollinger Bands and has an RSI of 82. I don’t pay much weight on RSI when it comes to deciding if something is going to pullback but curiously 82 is the same as when AMD put in an interim top in March 2024. Furthermore, we would not expect it to trade outside the BB for a prolonged period.
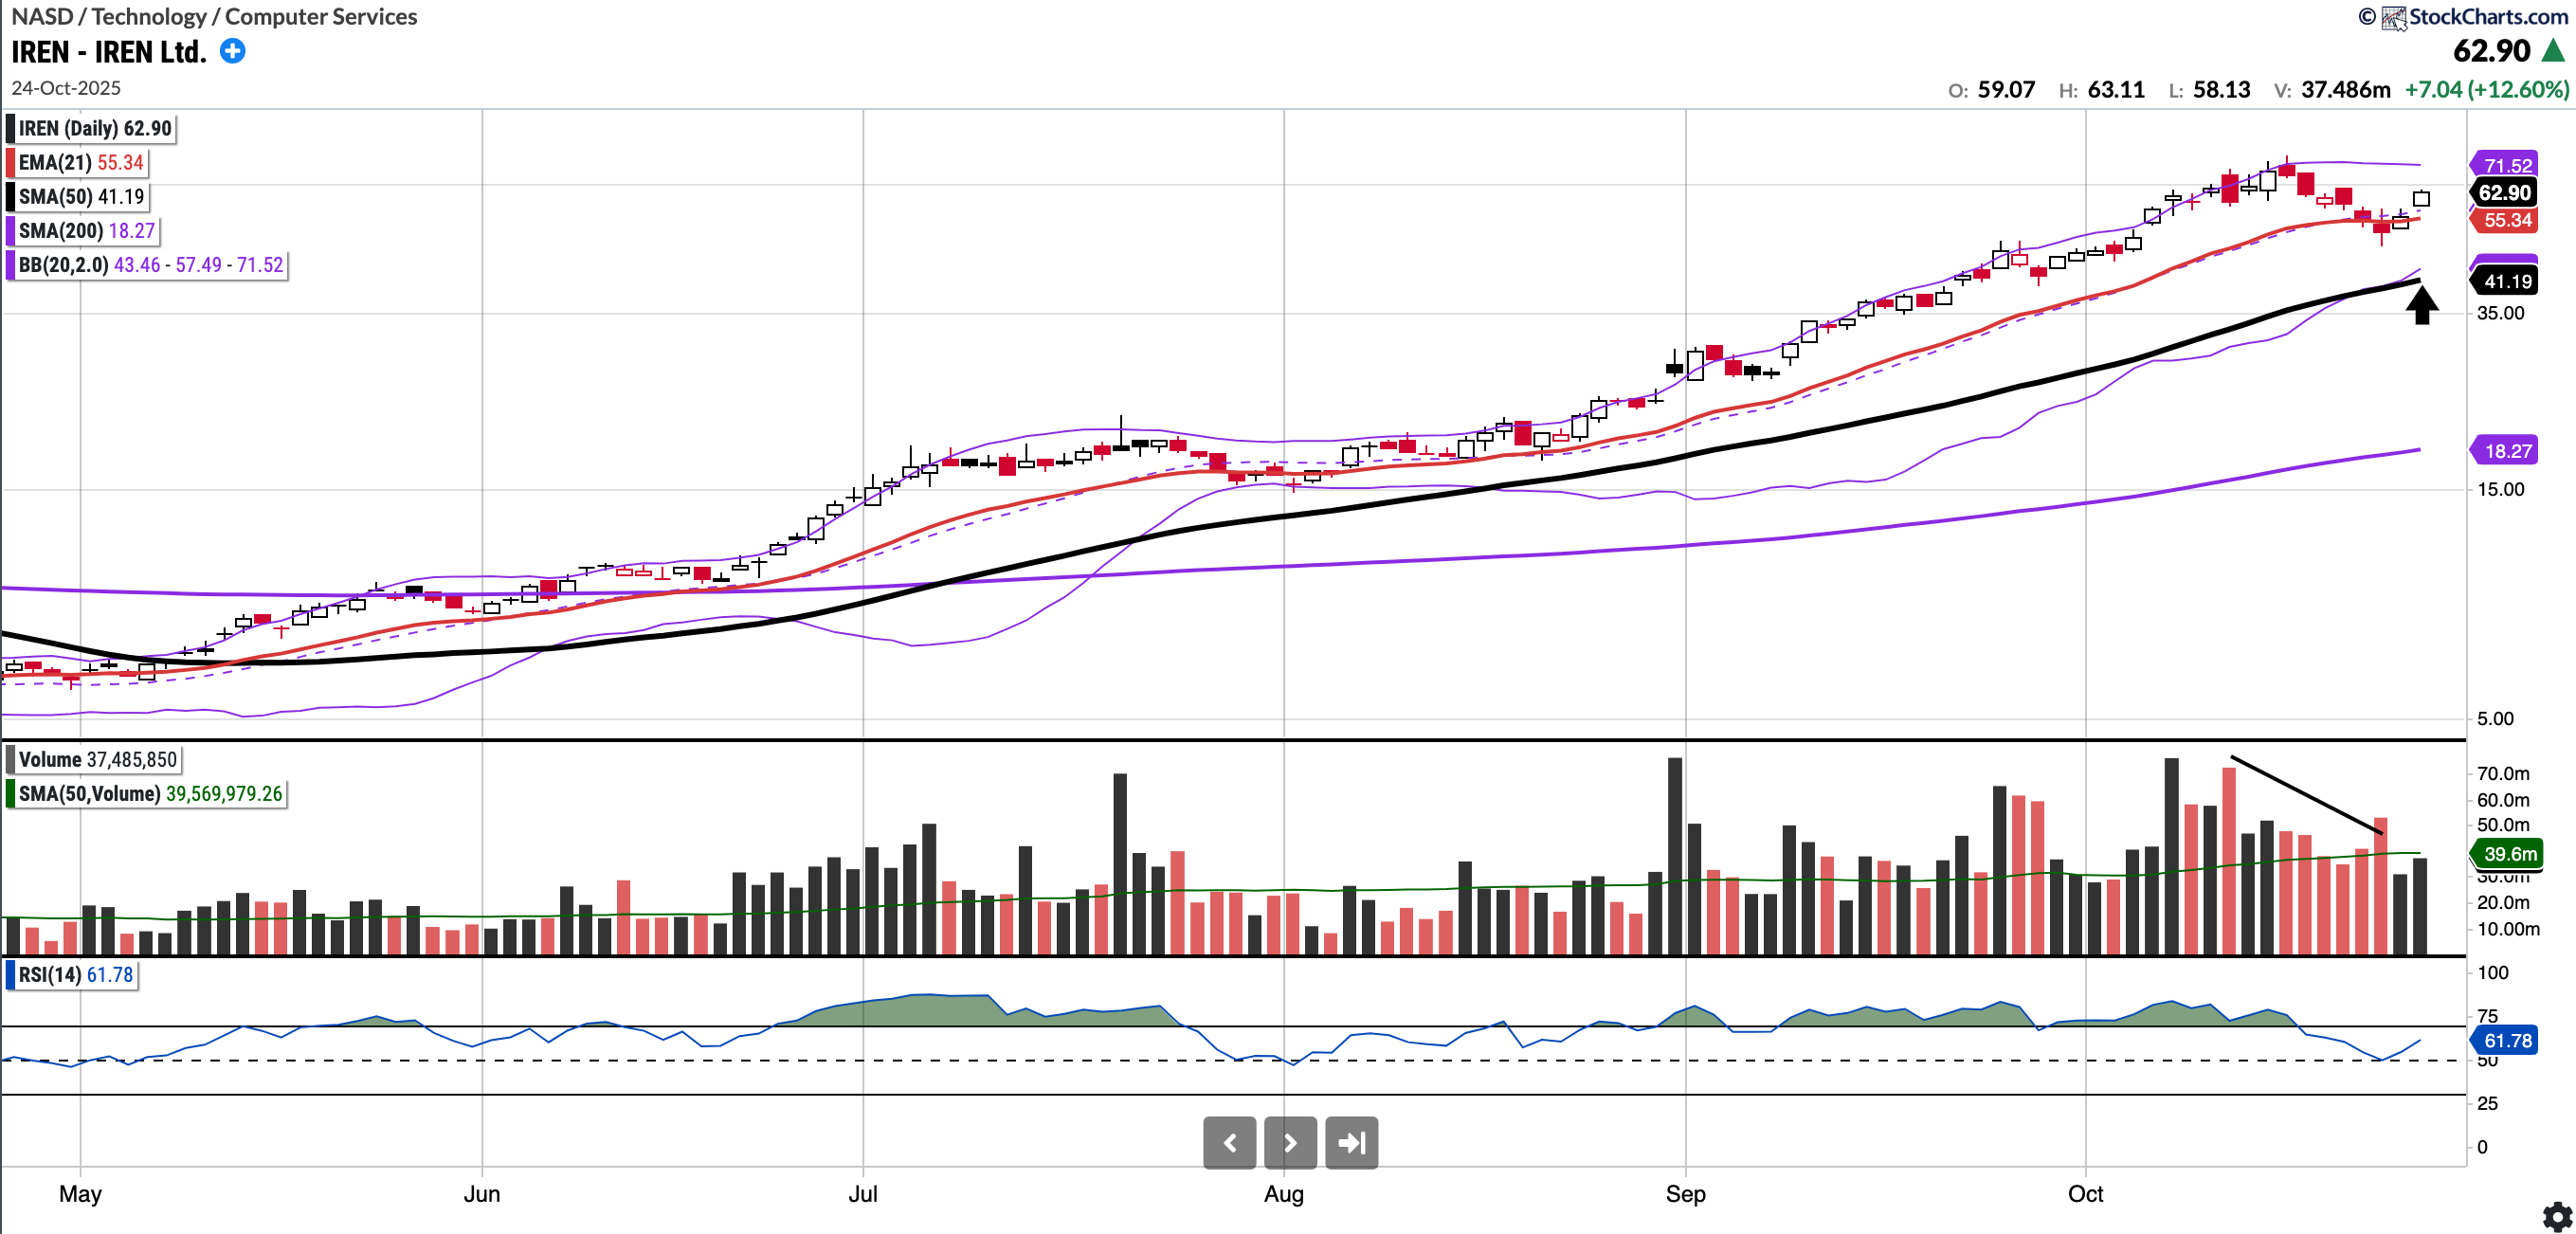
IREN (Currently Long)
Currently trades at 62.9, 52.71% above a rising 50SMA and 244.26% above the 200SMA.
RSI 61.78
501.34% YTD
IREN has been a tremendous winner this year and kudos goes to those who have captured the move. On a personal level, I only entered at average of ~51 2 sessions ago after waiting for an entry at the 49/50 support level.
For new buyers, given how extended the chart is and the recent heavy selling (see bottom right of chart), buying up here may not offer the best Risk/Reward.
A better entry point may be closer to the 50-day SMA, which currently sits at $41.19. From a fundamental perspective, this price would put IREN at approximately 40x NTM earnings and 23x 2027 projected earnings, resulting in a PEG comfortably below 1.
Either way at some point IREN will consolidate, either over time or by price.
Notable portfolio changes in previous week (all updated live in subscriber channels):
