
Preview of the Week Ahead
W/C October 20, 2025

Hope you all are having a good weekend. Below we will be previewing the upcoming week and providing a portfolio update as usual.
Format for what is covered in this weekly preview:
A look at the indices
Key upcoming economic events
Upcoming earnings reports
Charts
Notable portfolio changes from the previous week
Current Portfolio Holdings (Position size, cost basis, and commentary on each holding regarding the intended holding period and any planned activity)
If it is your first time here, check out the post below on how to navigate the SixSigmaCapital Website and subscribe to the option that suits.

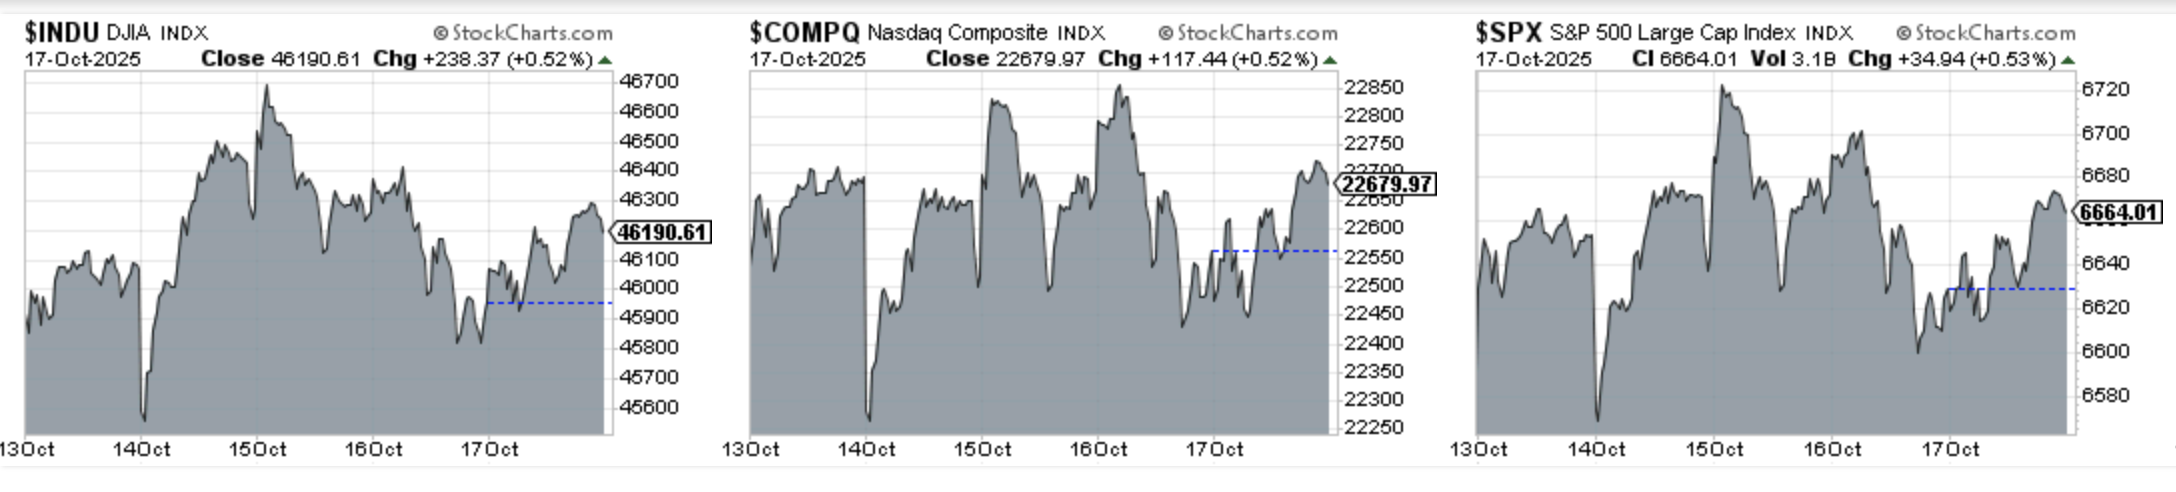
Indices
Dow Jones advanced 0.51% in the last week
S&P 500 advanced 0.52% in the last week
Nasdaq Composite advanced 0.65% in the last week
IWM advanced 0.48% in the last week
Key upcoming events:
Monday, October 20th
The Conference Board Leading Index (September)
Wednesday, October 22nd
EIA Crude Oil Stocks Change
Thursday, October 23rd
Chicago Fed National Activity Index (September)
Existing Home Sales (September)
Friday, October 24th
Consumer Price Index (September)
S&P Global Flash Manufacturing PMI
S&P Global Flash Services PMI
New Home Sales (September)
University of Michigan Consumer Sentiment Index (October Final)
This week is particularly notable for the release of the Consumer Price Index (CPI) on Friday.
Upcoming Earnings
Last week Q3 earnings season kicked off in earnest. This week we have a packed schedule and I will be watching NFLX, TSLA, VRT, INTC plus many others.
Below is the infographic by Earnings Whispers for the upcoming week:

Charts
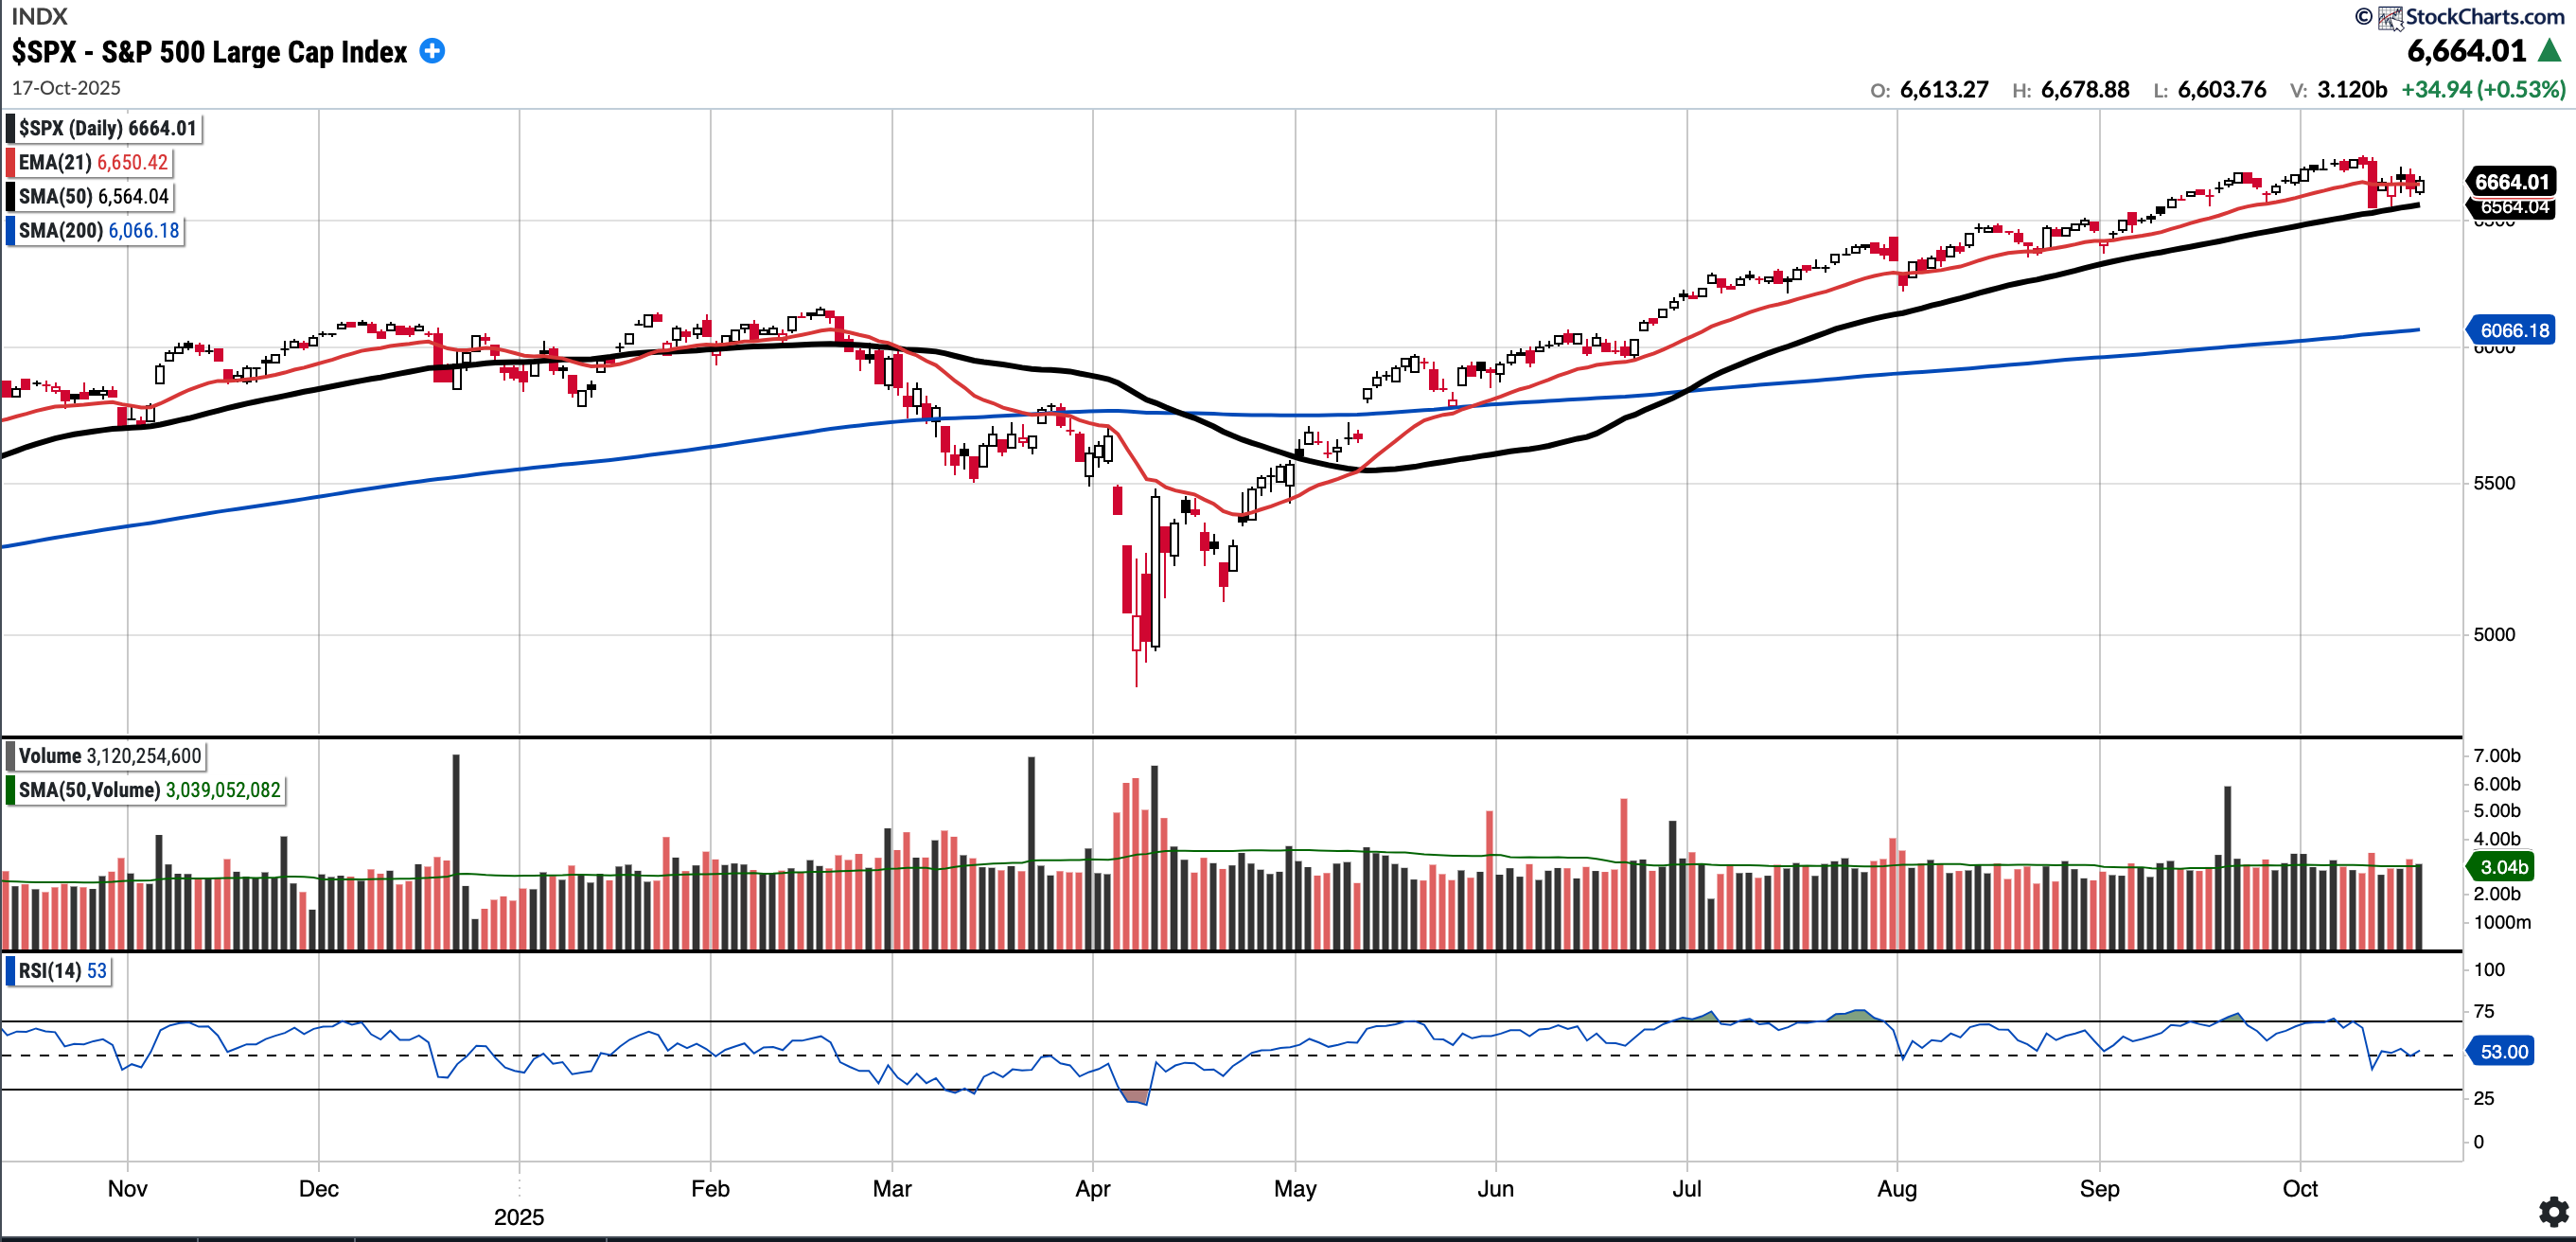
SPX
Currently trades at 6664.01, 1.52% above a rising 50SMA and 9.86% above 200SMA.
RSI 53.00
13.55% YTD
After last Fridays sharp decline, this week was somewhat uneventful and we remain within 2% of ATH.
Distribution days in the last week: 1
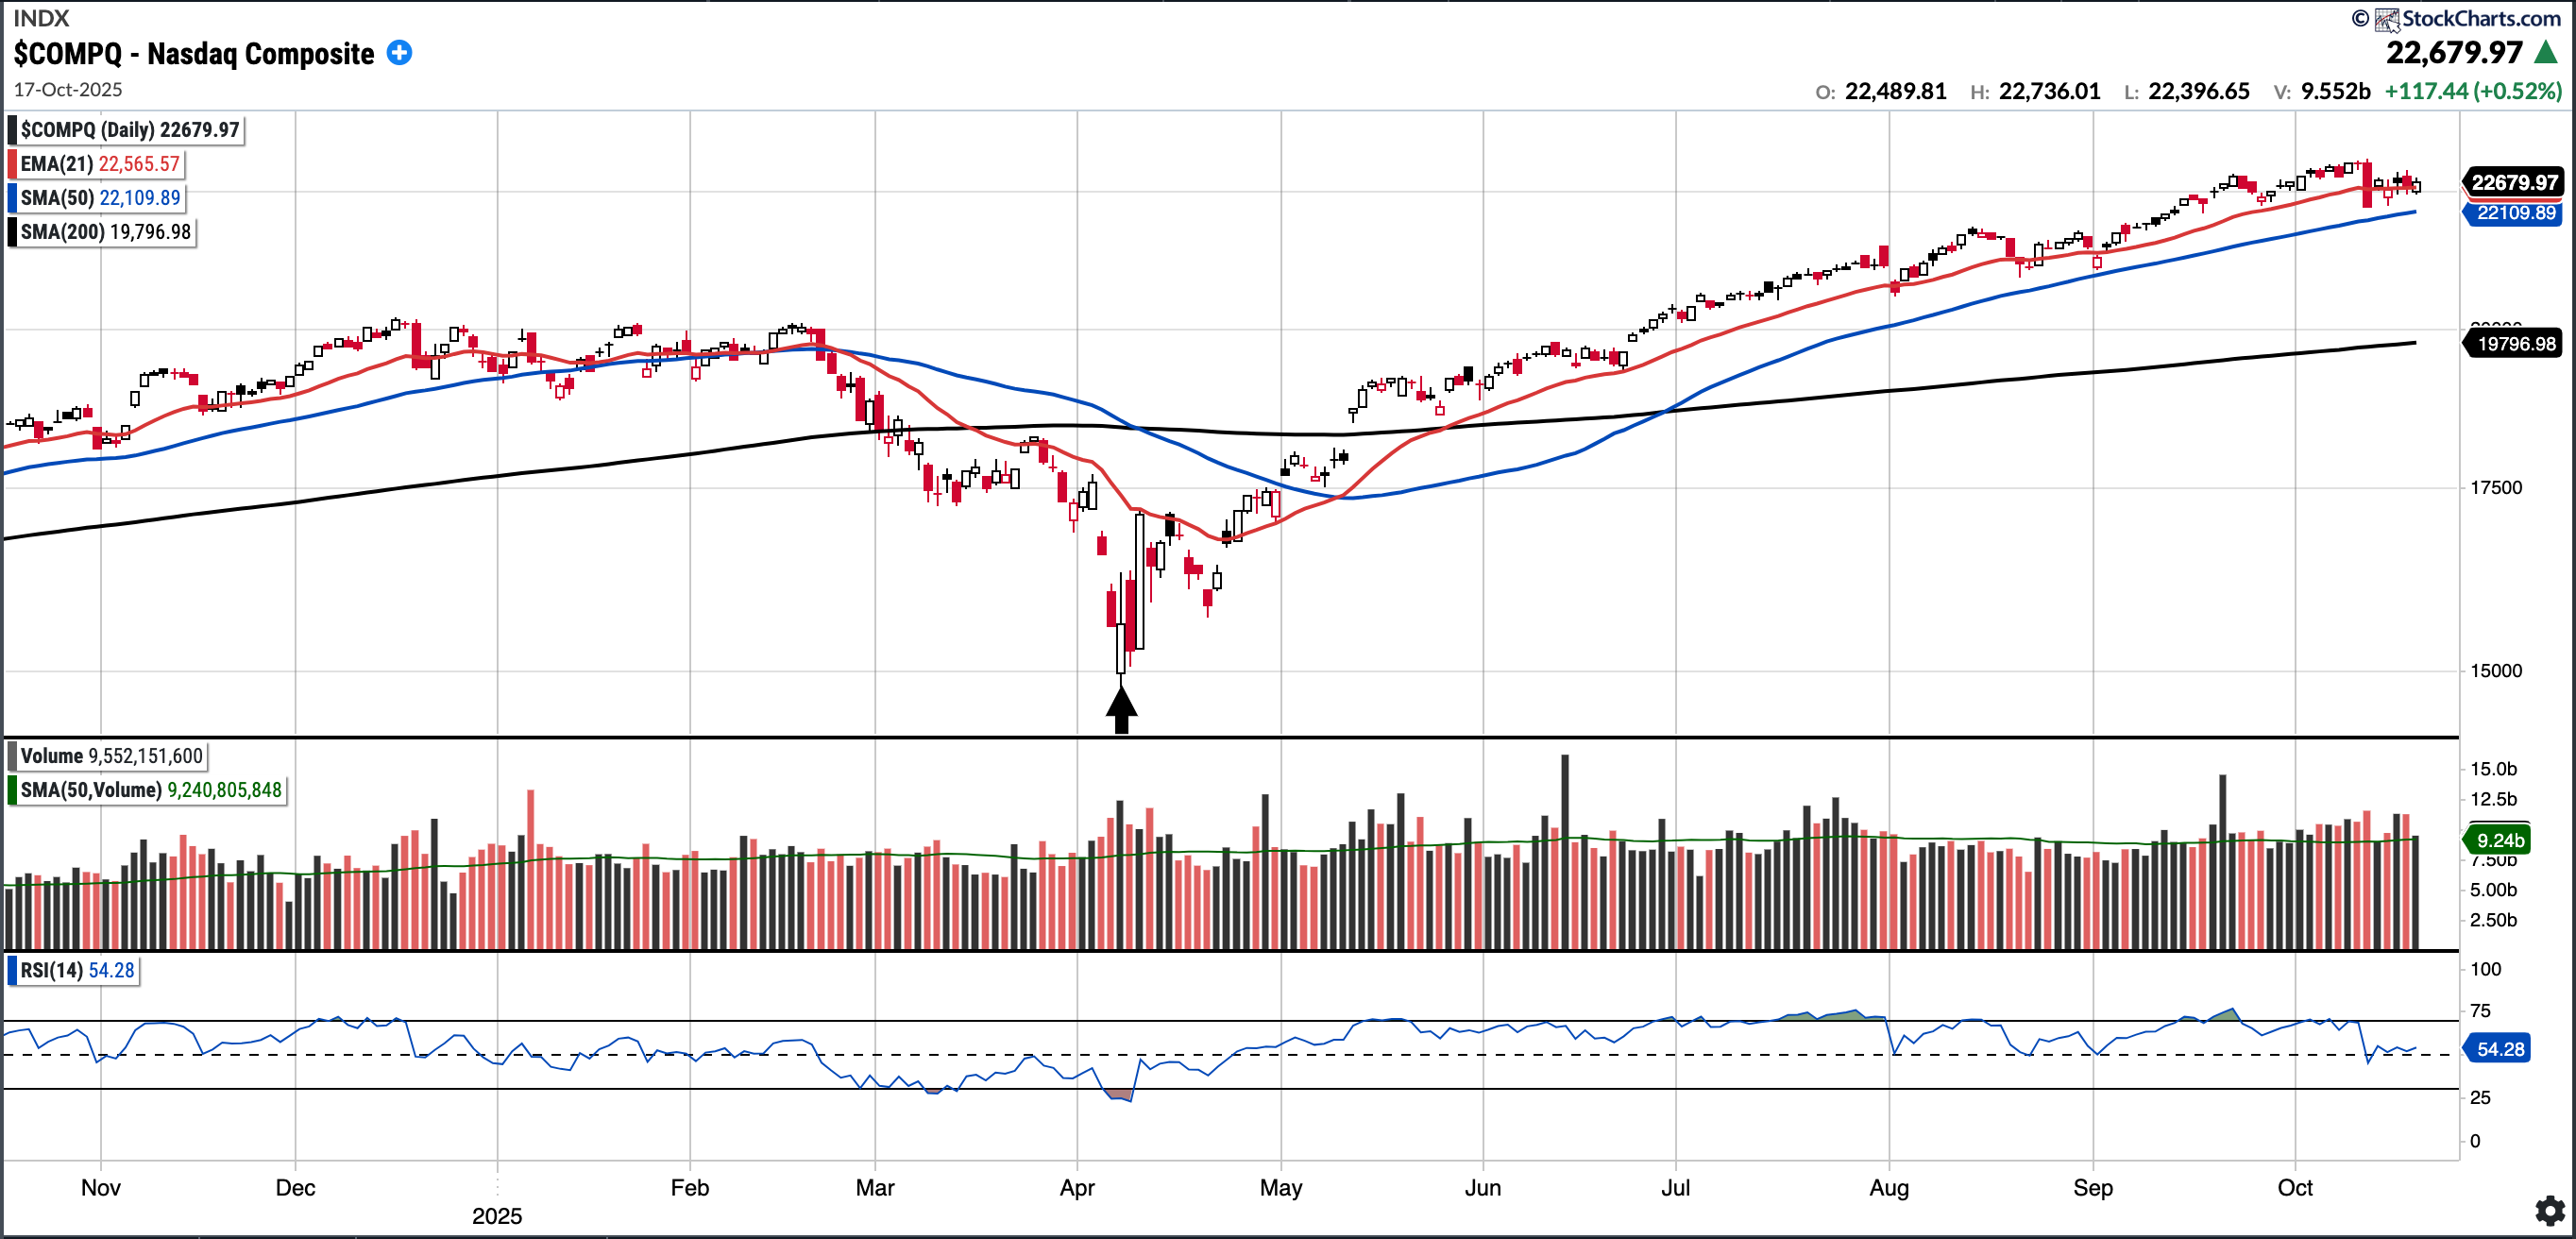
COMPQ
Currently trades at 22679.98, 2.58% above a rising 50SMA and 14.56% above 200SMA.
RSI 54.28
17.63% YTD
Distribution days in the last week: 2 and 5 in the last 10 sessions(!)
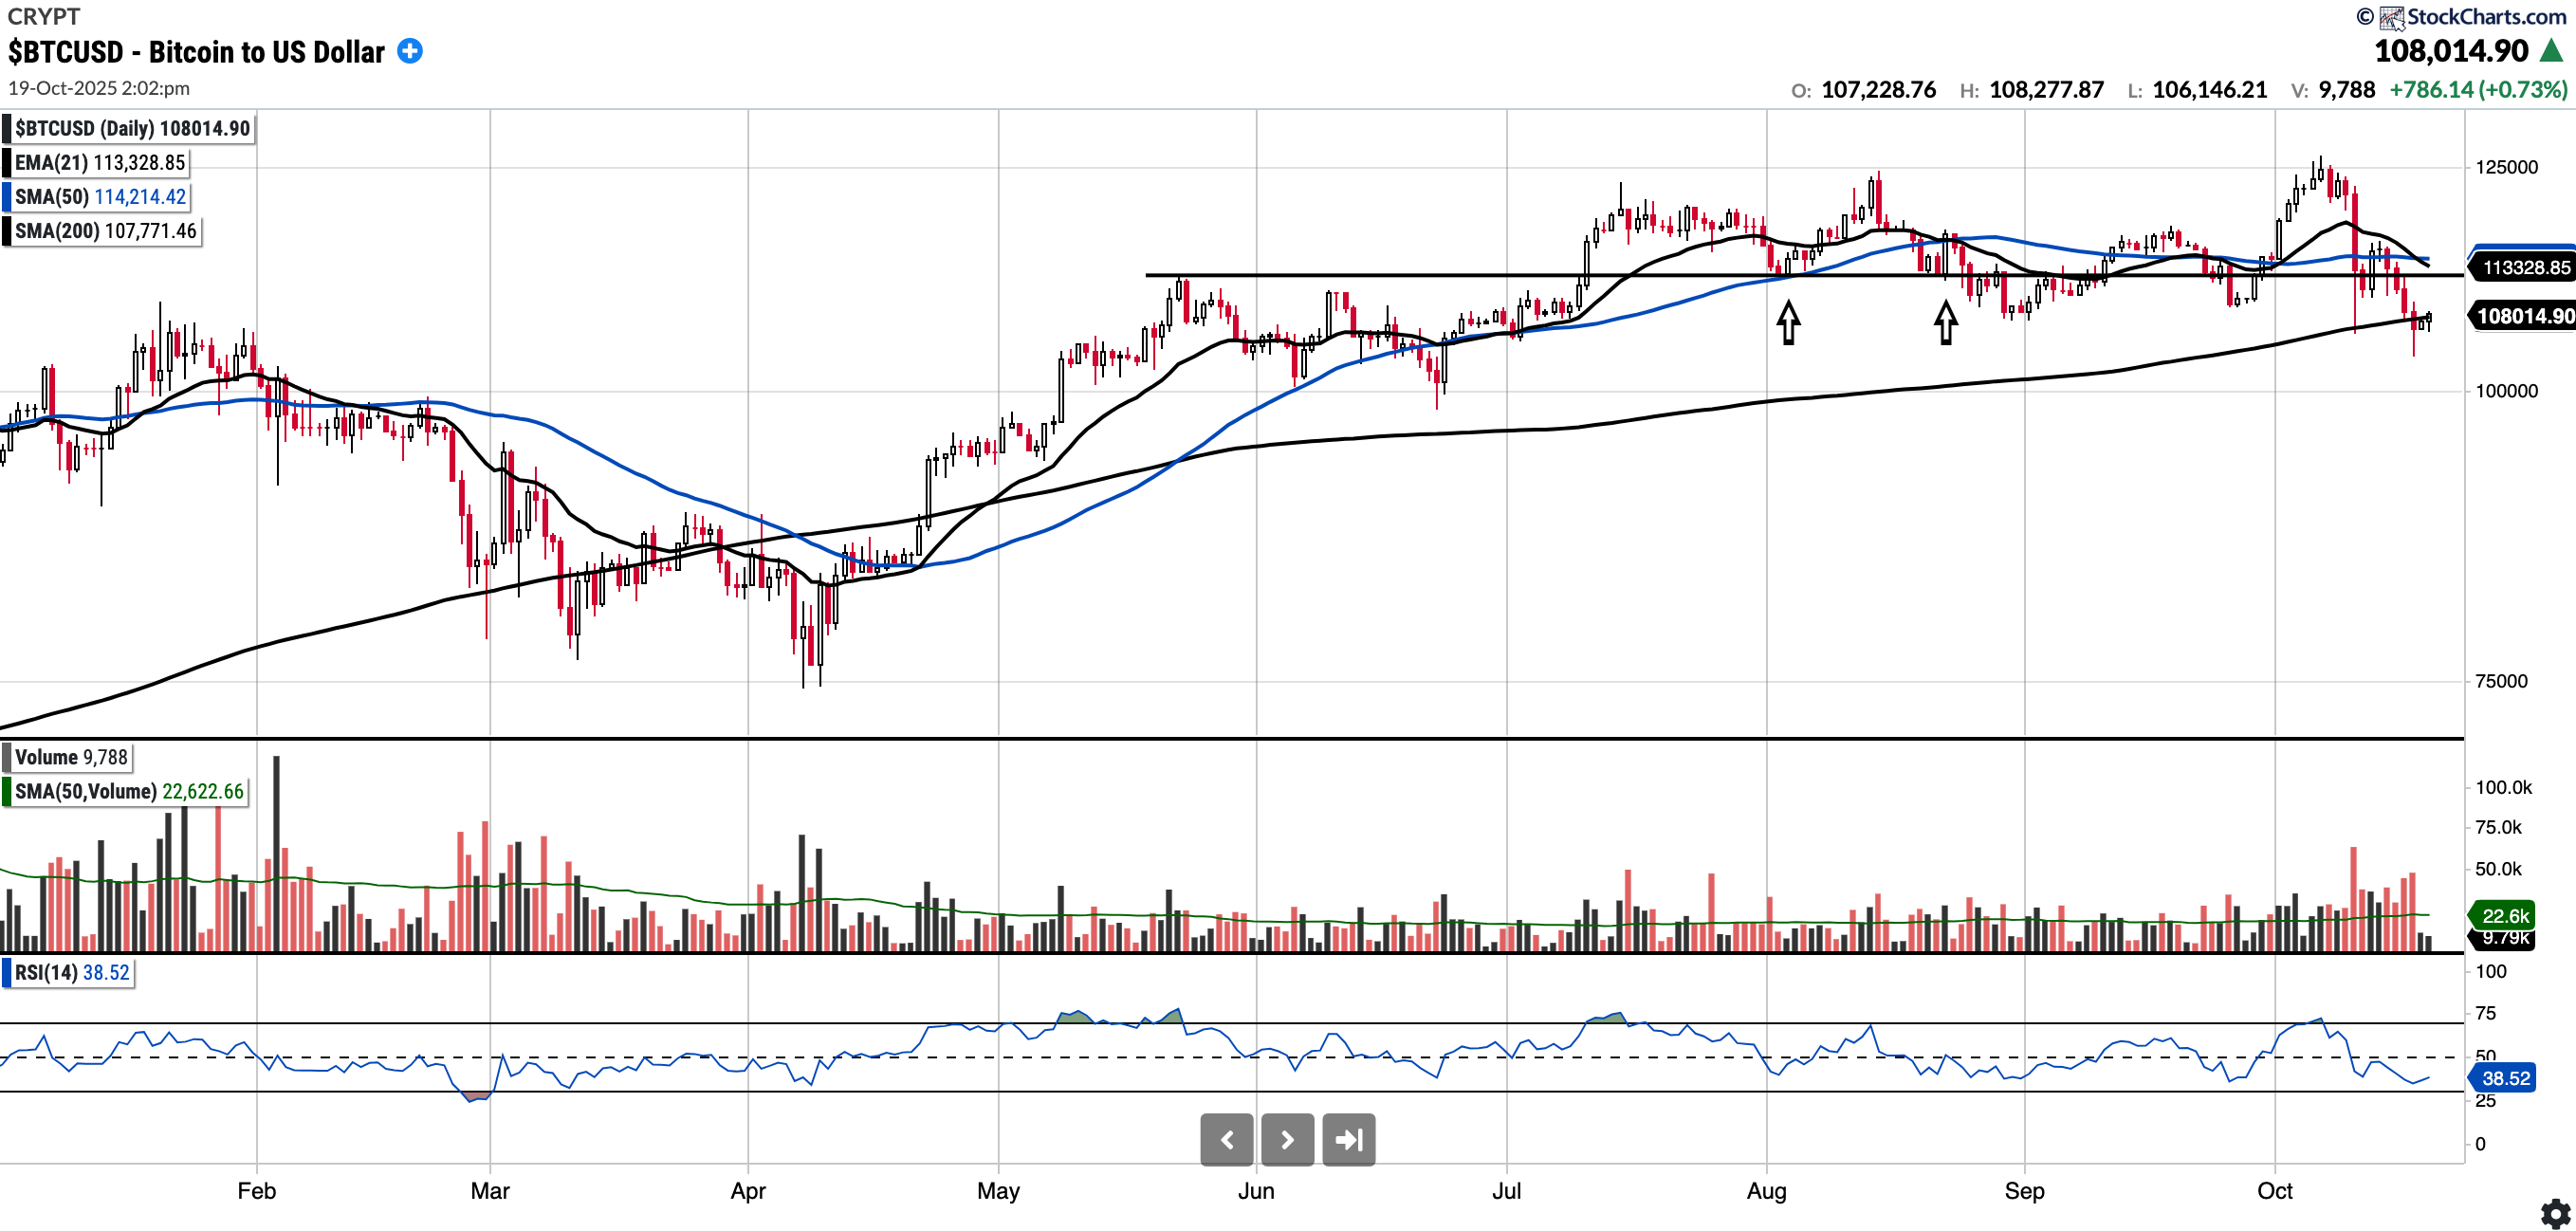
BTC (currently Long)
Currently trades at $108,128, 5.33% below the 50SMA and 0.34% above 200SMA.
RSI 38.52
14.52% YTD.
BTC had made an ATH in the previous week until the deleveraging on Friday at which point we saw BTC drop from 123k to below 106k in hours.
Since then, we have seen a bounce that tested the underside of the EMA 21. The EMA 21 has undercut the SMA 50, and BTC is having a tough time reclaiming the SMA 200. Once the SMA 200 is reclaimed, bulls would want to see a reclaim (and hold) of the $112k level of interest.
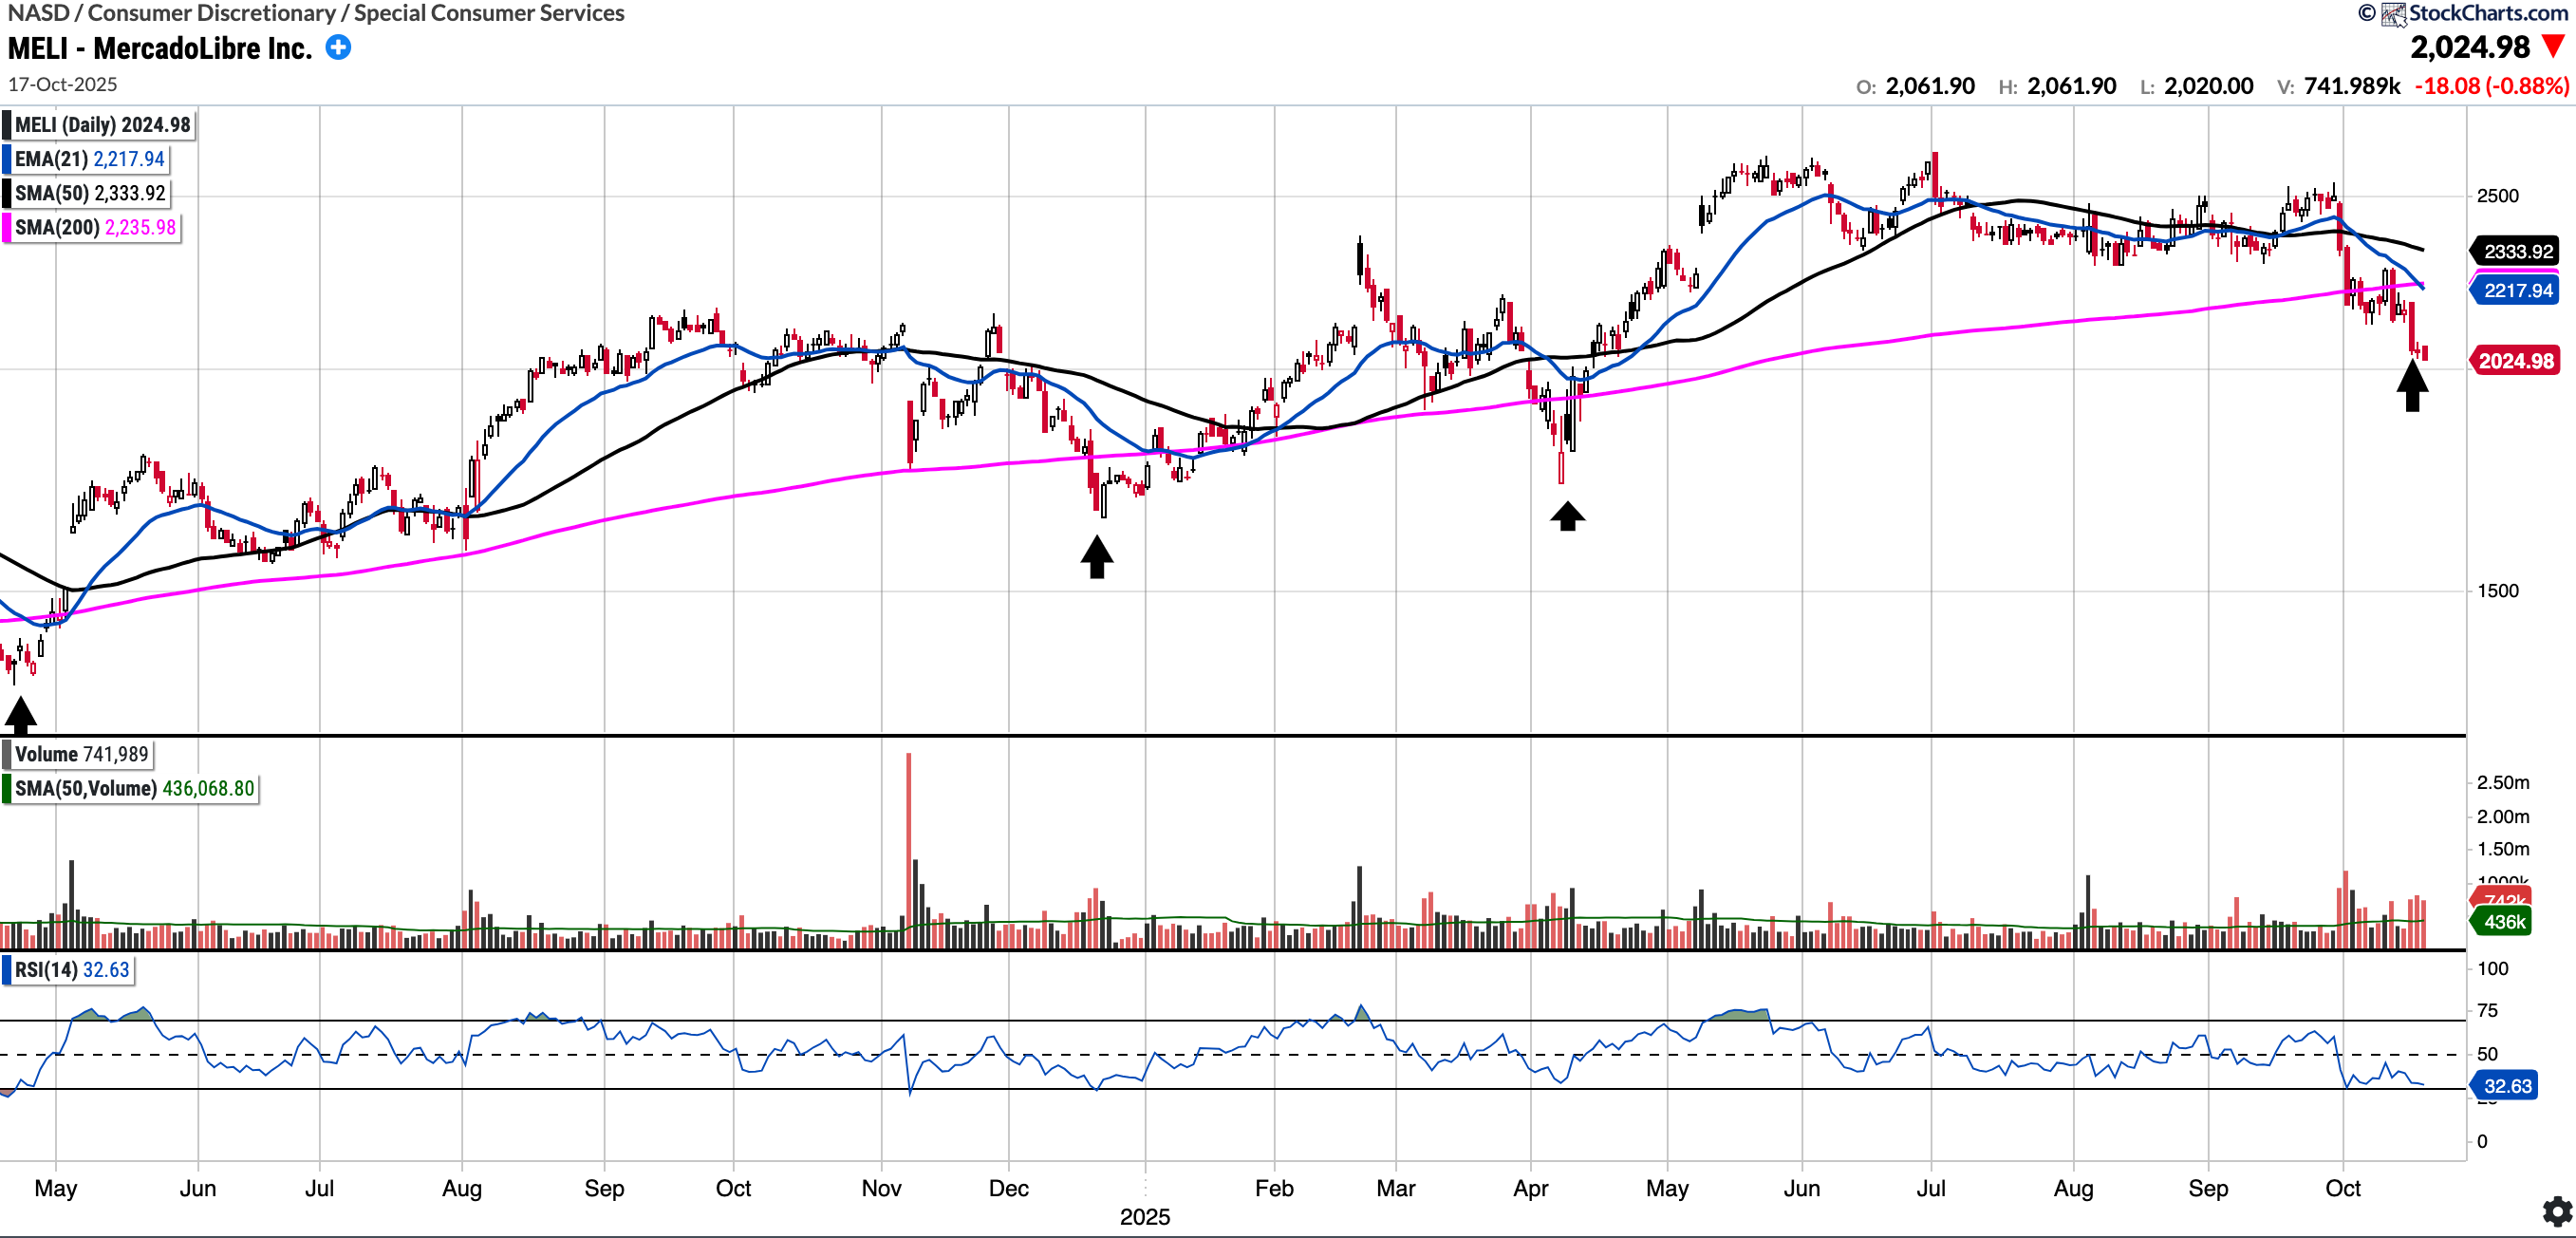
MELI (no position)
Currently trades at $2,024.98, 13.24% below the 50SMA and 9.44% below the 200SMA.
RSI 32.63
+14.73% YTD
MELI has been a perennial winner over the last 17 to 18 years, rising nearly 72x during that period. However, over the last five years, its 59% gain is much lower than both the QQQ (94.32%) and the S&P 500 (91.29%) respectively. Separately, MELI is down >17% in the last month.
It has lost the SMA 200 but over the last few years you can see it does not stretch too far below the SMA 200 and it usually is a buying opportunity, at least thats what recent history tells us. Valuation is not “cheap” albeit PEG of <1 and lowest decile PE multiple.
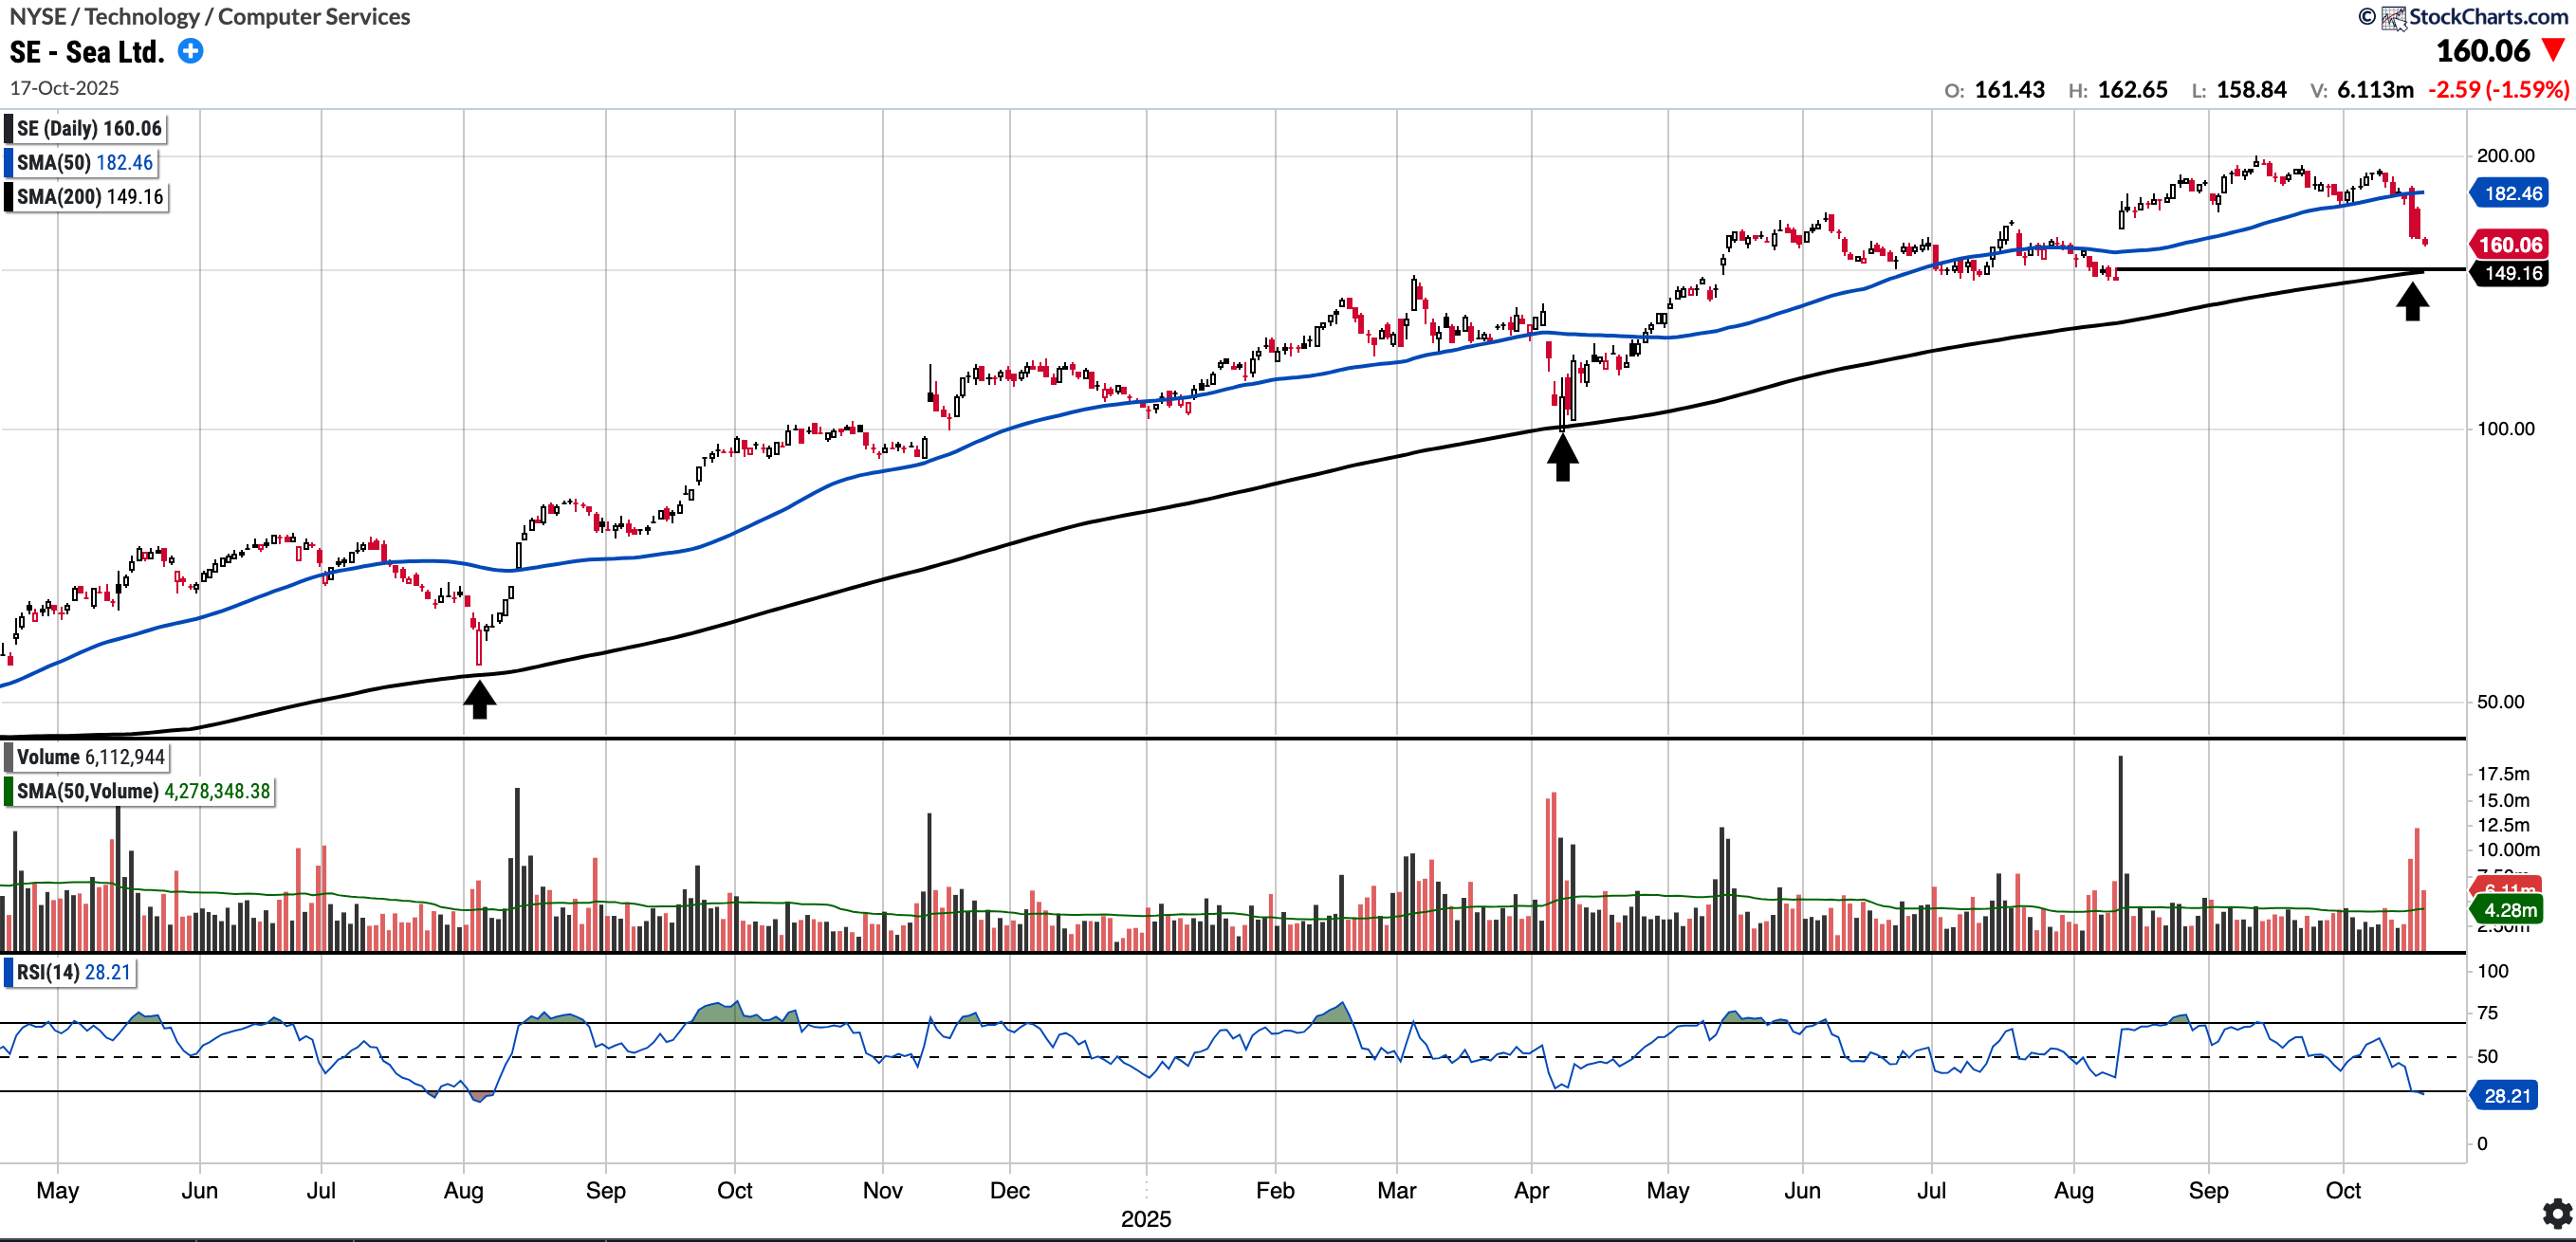
SE (currently Long)
Currently trades at $160.06, 12.27% below the 50SMA and 7.31% above the 200SMA.
RSI 28.21
+52.63% YTD
SE has had a strong couple of years and remains in an uptrend. It did pullback 15.35% this week on no known news and I will probably be looking to buy in the 150 and below (gap fill and SMA 200 level). Remarkably it trades at PEG of 0.6 and at current prices ~30x NTM earnings and 20x FY27 earnings.
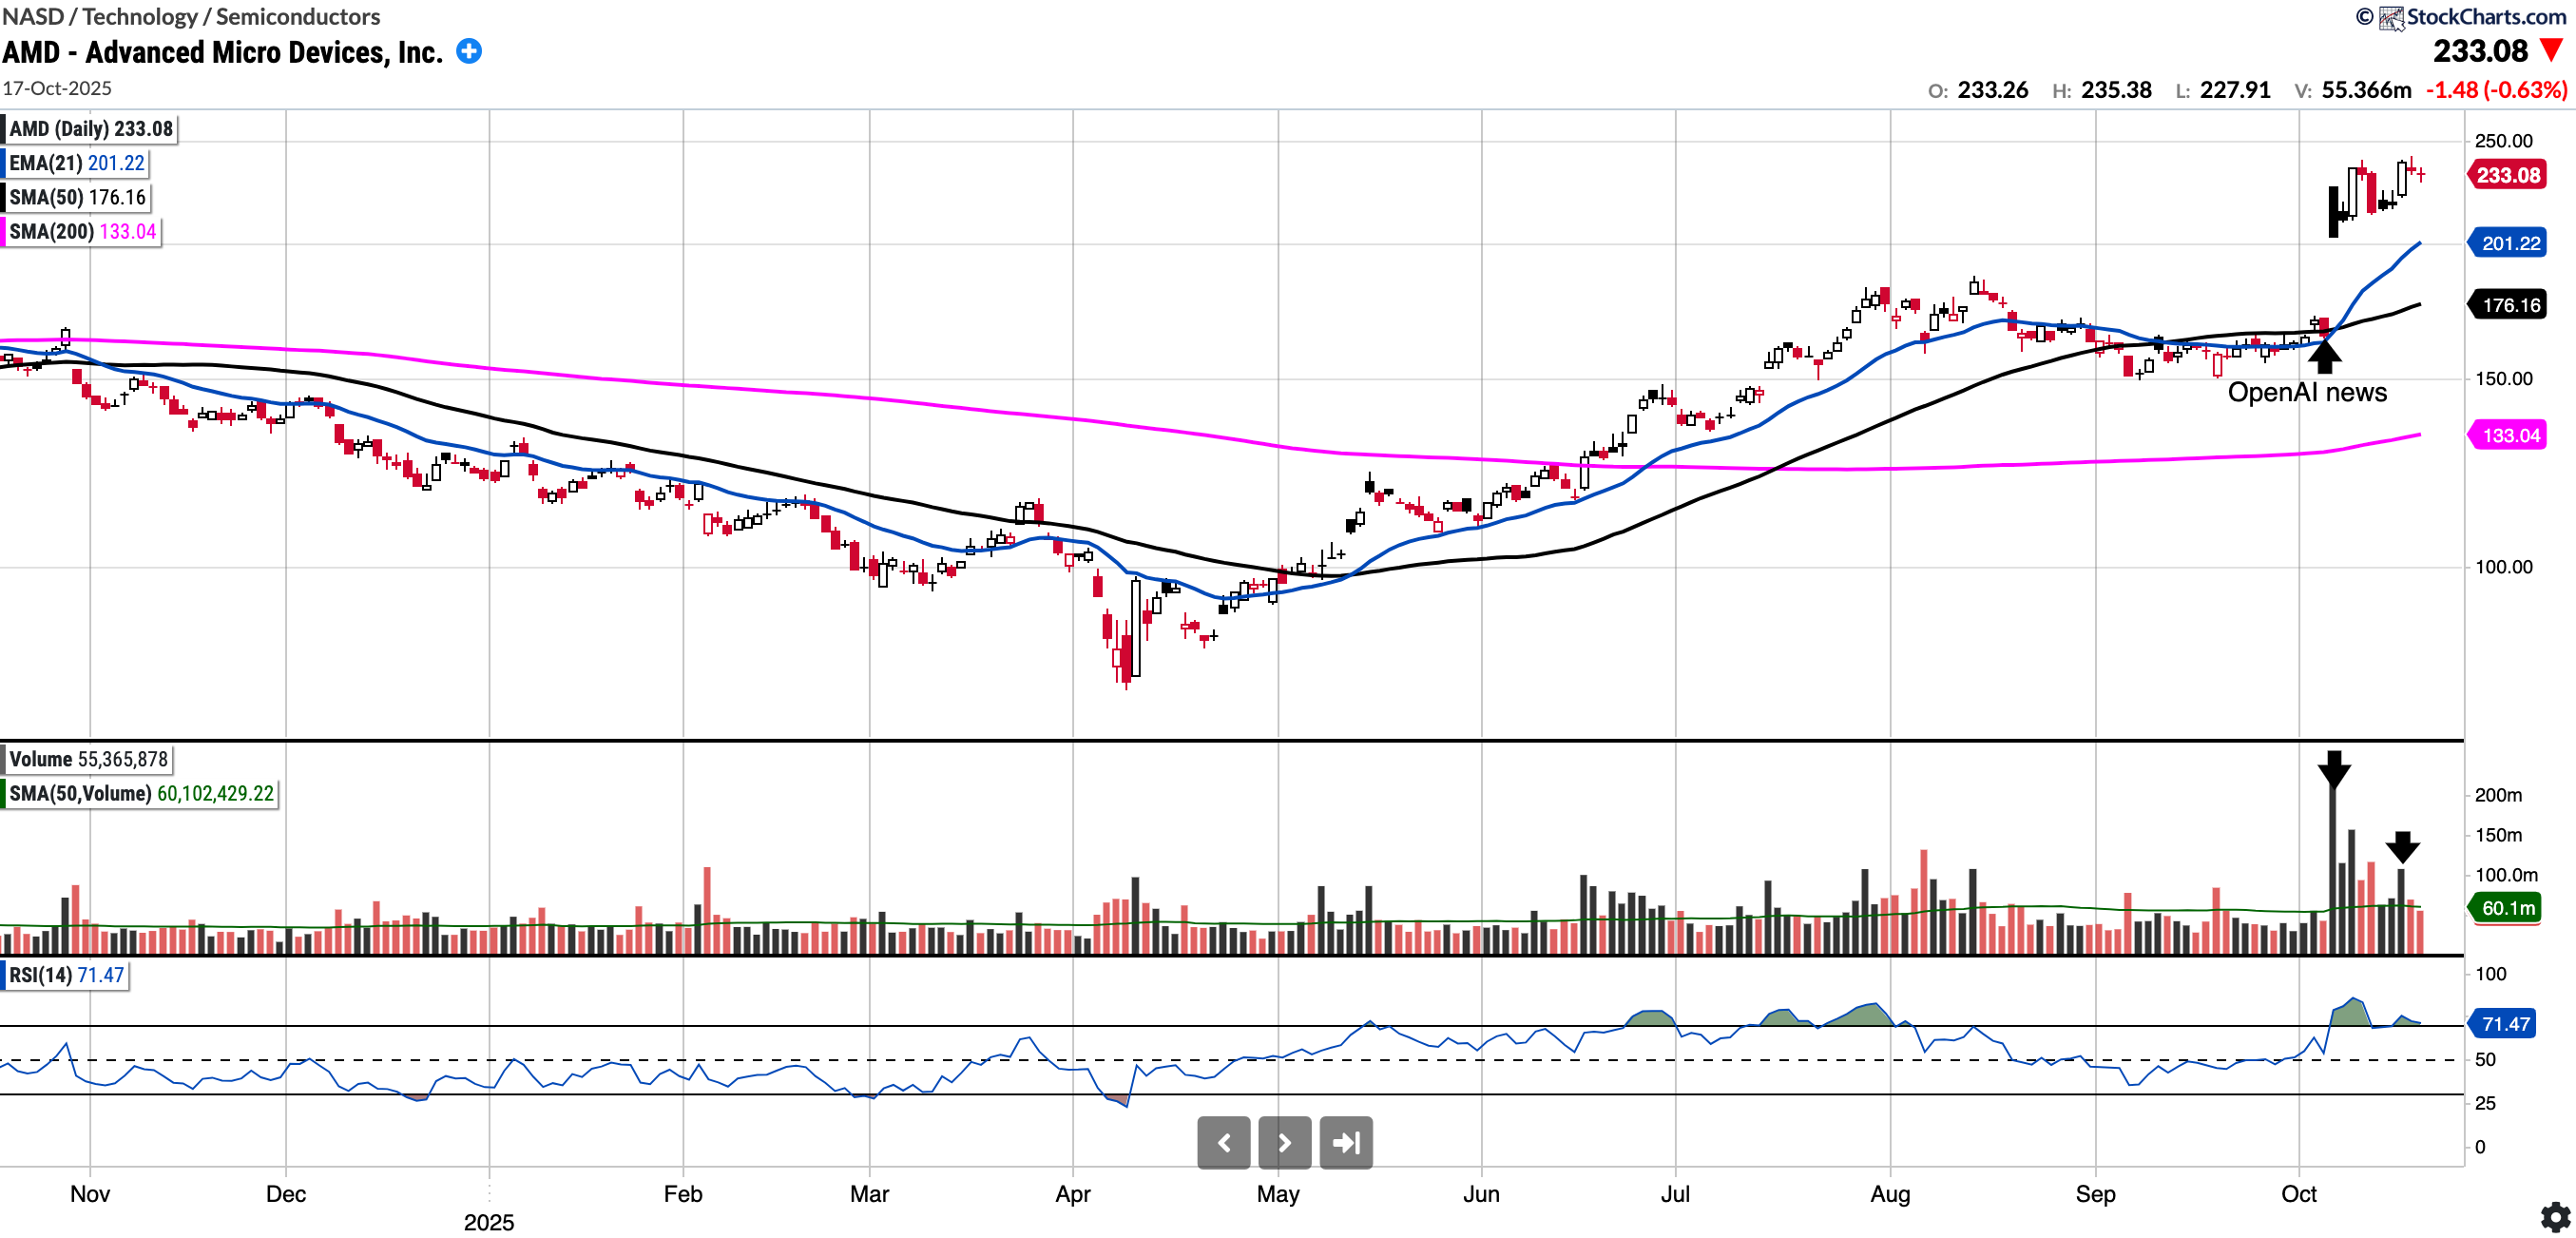
AMD (currently Long)
Currently trades at $233.08, 32.31% above the 50SMA and 75.19% above 200SMA.
RSI 71.47
93.22% YTD
AMD was trading at around $165 last Monday when the news of it’s multiyear partnership with OpenAI hit the tape.
Since then, the stock is up approximately $68. Although AMD is technically overbought, the huge volume entering the stock serves as proof of a notable sentiment shift.
The stock appears to forming a bull flag. While the stock needs a period of consolidation, if this bull run continues, I could see it moving north of $280.
Notable portfolio changes in previous week (all updated live in subscriber channels):
Exited CRWV for 13% gains. May revisit.
