
Preview of the Week Ahead
W/C Feb 16, 2026

Hope you all are having a good weekend. Below we will be previewing the upcoming week and providing a portfolio update as usual.
Format for what is covered in this weekly preview:
A look at the indices
Key upcoming economic events
Upcoming earnings reports
Charts
Notable portfolio changes from the previous week
Current Portfolio Holdings (Position size, cost basis, and commentary on each holding regarding the intended holding period and any planned activity)
Closing Thoughts
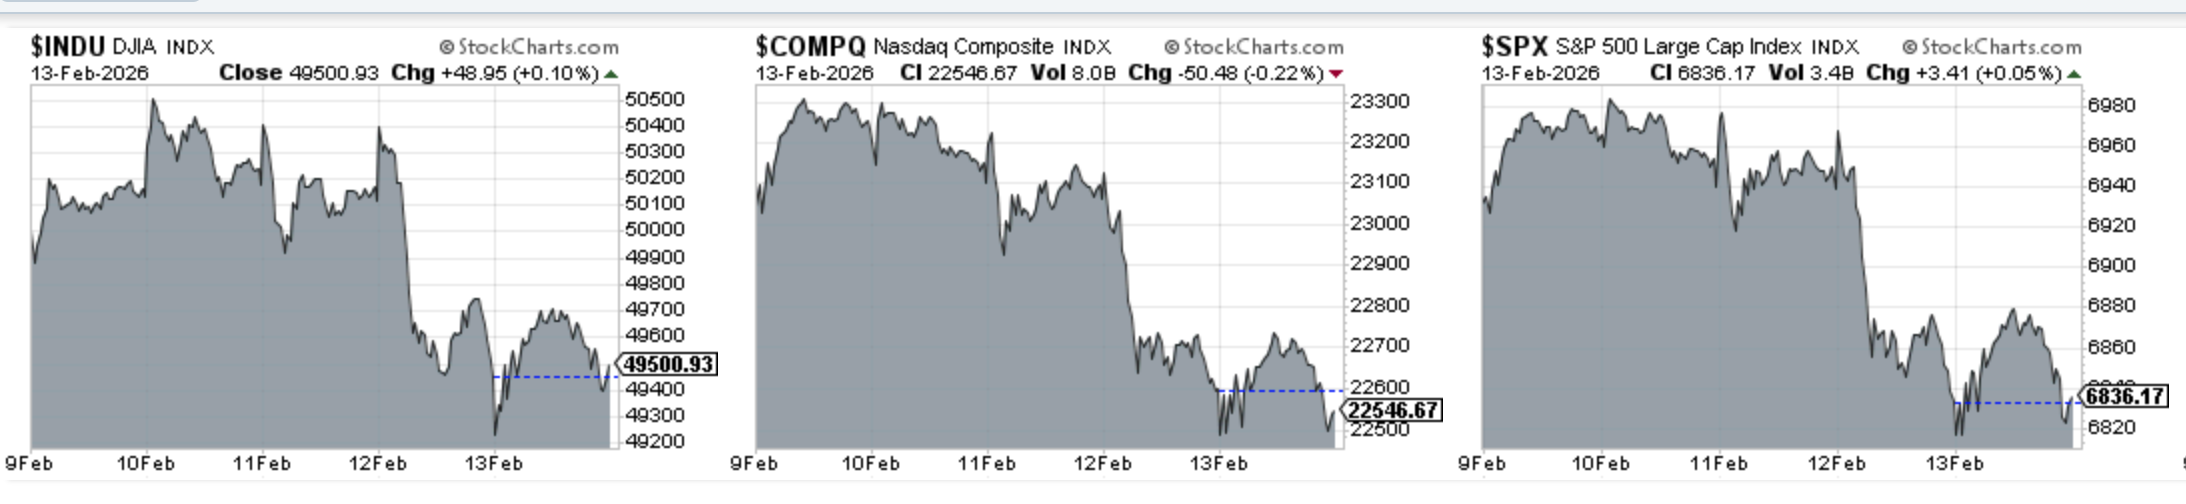
Indices
Dow Jones declined 1.05% in the last week
S&P 500 declined 1.23% in the last week
Nasdaq Composite declined 1.84% in the last week
IWM decline 0.28% in the last week
Key upcoming economic events:
Monday, February 16
Presidents’ Day (Washington’s Birthday): U.S. markets are closed.
Tuesday, February 17
Empire State Manufacturing Index (Feb)
Fed Governor Bowman Speech
Wednesday, February 18
Industrial Production (Jan)
FOMC Meeting Minutes (Jan 27-28 Meeting)
Thursday, February 19
Weekly Initial Jobless Claims
Philly Fed Manufacturing Index (Feb):
Friday, February 20
Q4 GDP (Advance Estimate/Revision)
PCE Price Index (Dec): Note, Markets expect both headline and core figures to rise roughly 0.3% M/M
Personal Income & Spending (Dec)
Existing Home Sales (Jan)
Upcoming Earnings
The schedule this week is again a full one but I have no portfolio companies reporting. Below is the infographic by Earnings Whispers:

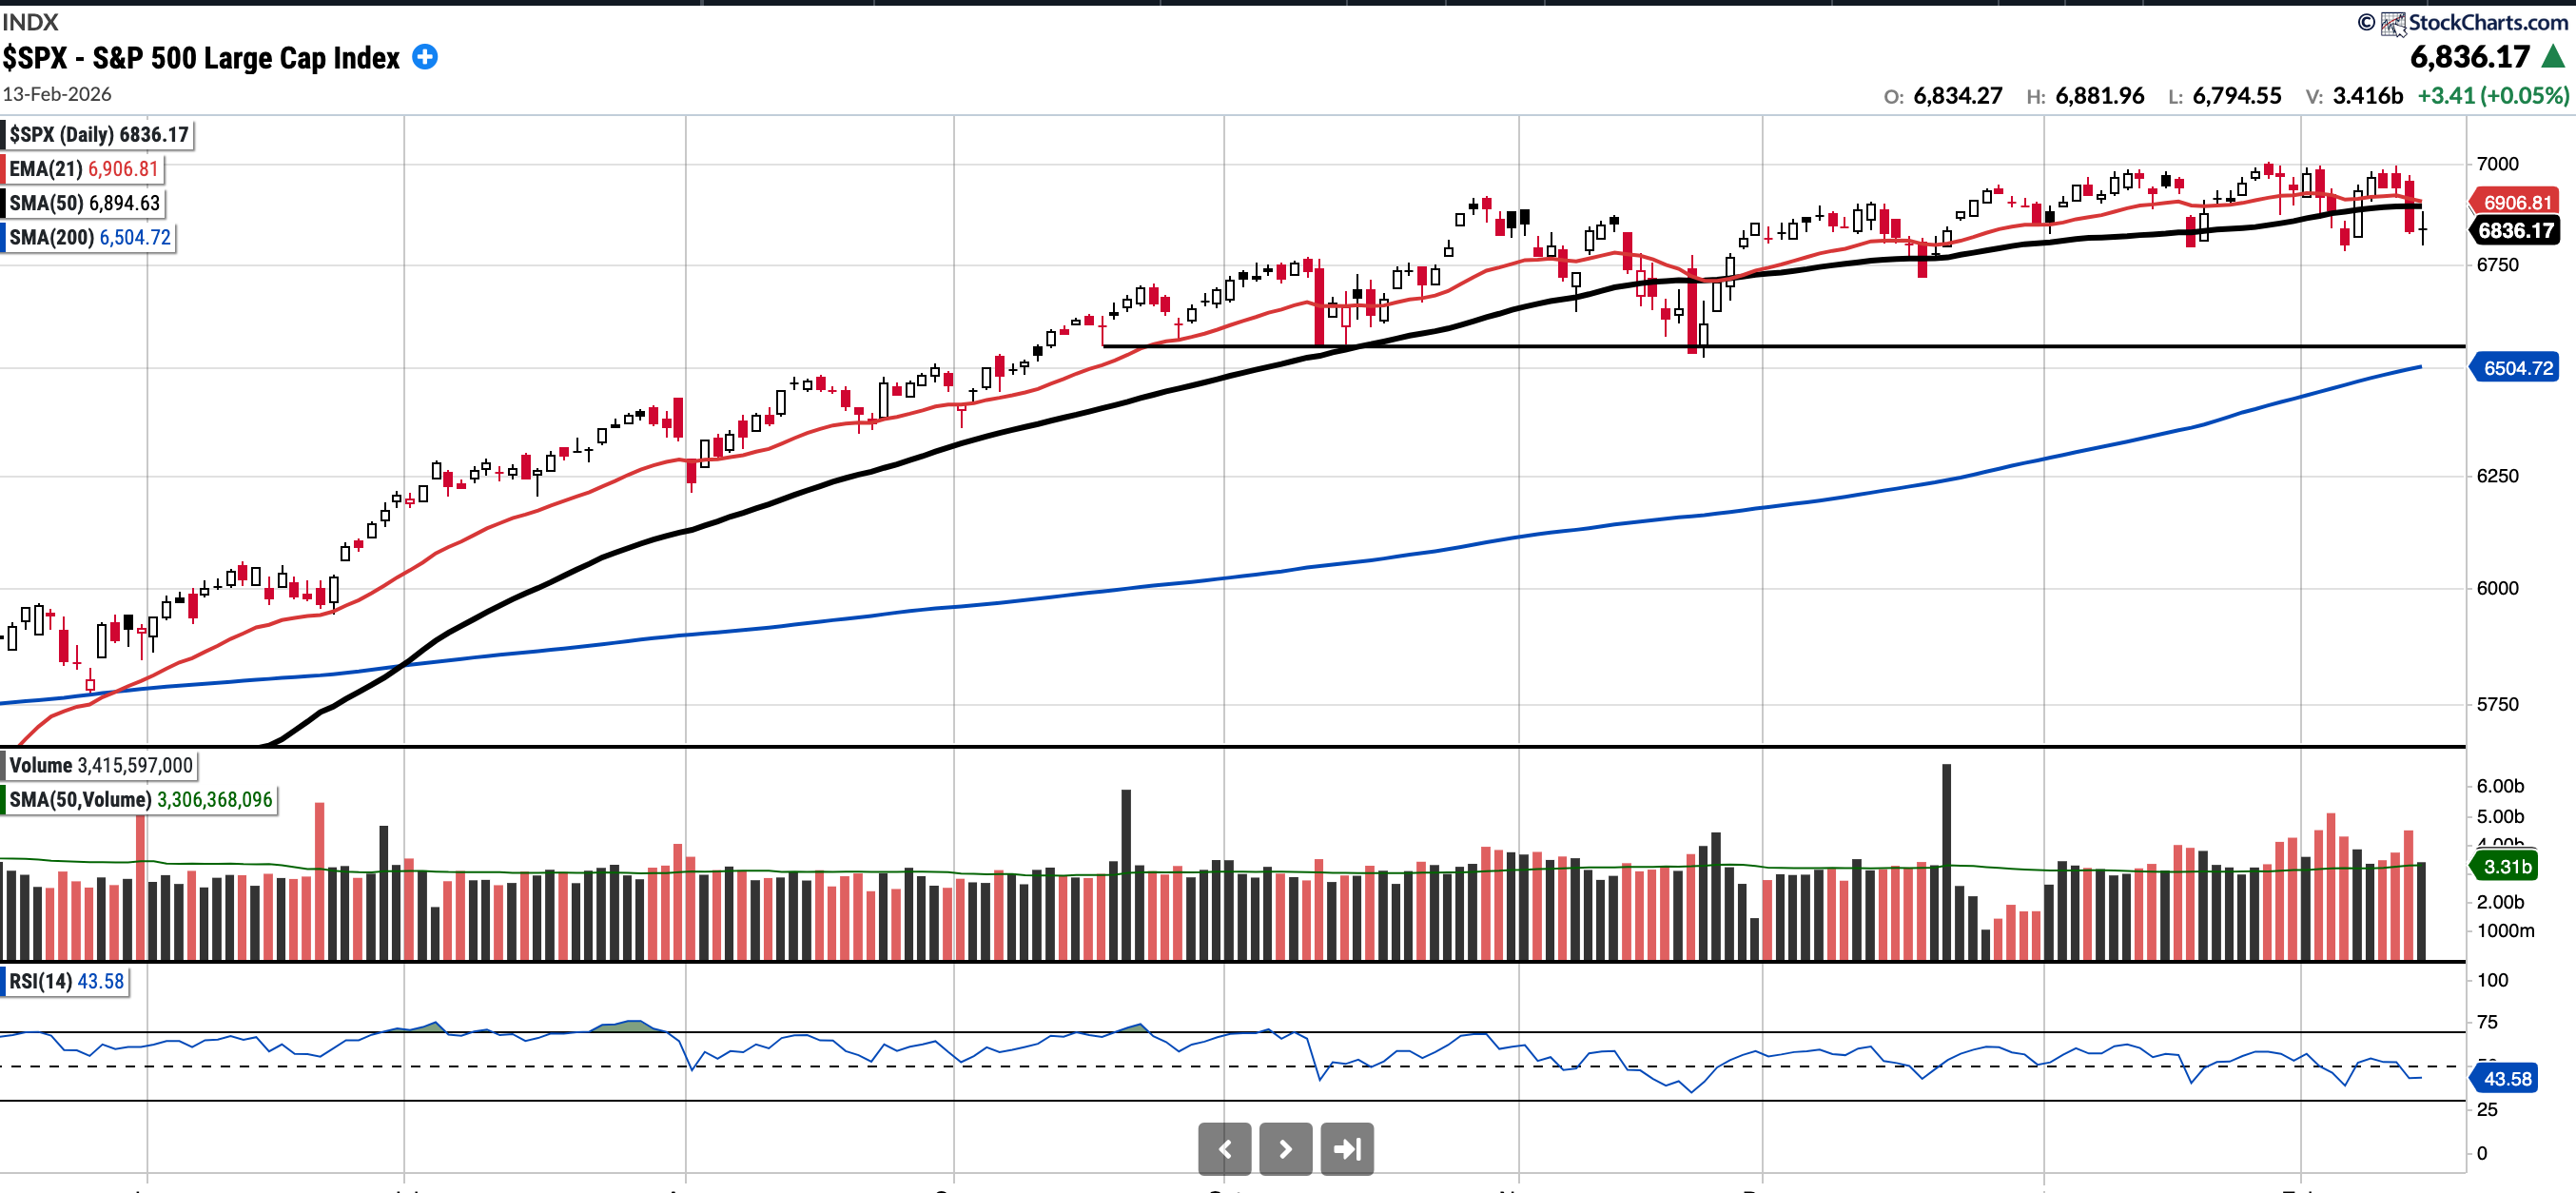
SPX
Currently trades at 6836.17, 0.85% below a rising 50SMA and 5.10% above the 200SMA.
RSI 43.58
-0.33 YTD
Distribution days in the last week: 2
There was again heavy distribution and the SPX had a turbulent week closing below the SMA 50.
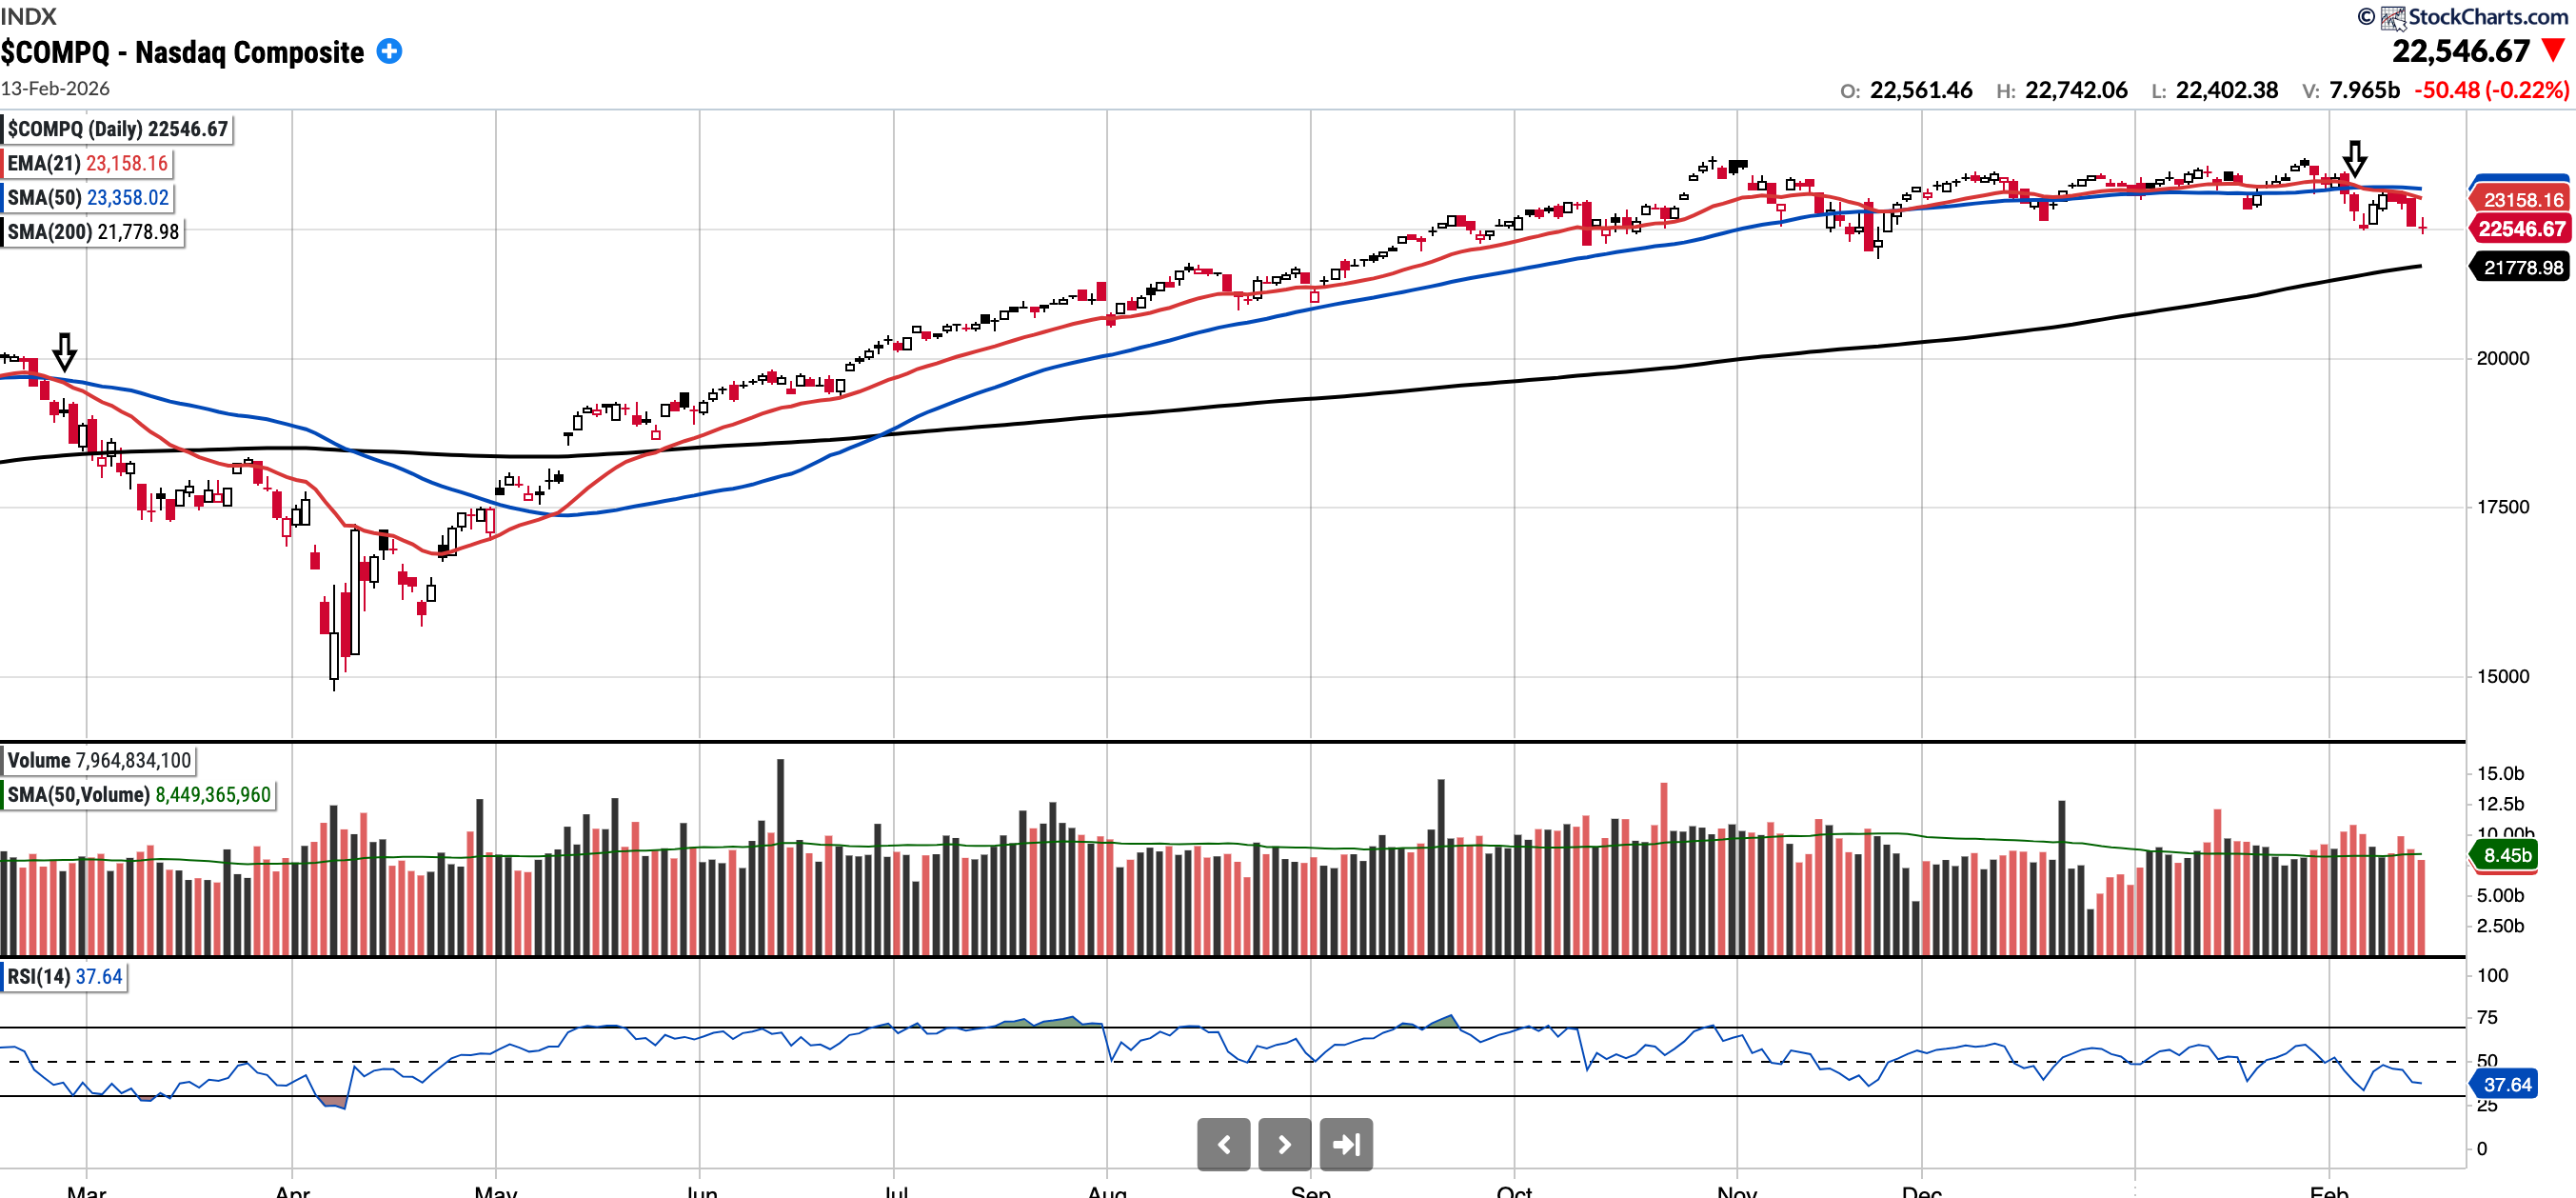
COMPQ
Currently trades at 22,546.67, 3.47% below a flat 50SMA and 3.52% above the 200SMA.
RSI 37.64
-2.97% YTD
Distribution days in the last week: 1
The Nasdaq Composite had another volatile week and closed below both the EMA 21 and SMA 50. The EMA 21 has also undercut the SMA 50 now(see arrows), the last time this happened was late Feb 2025. Caution is warranted.
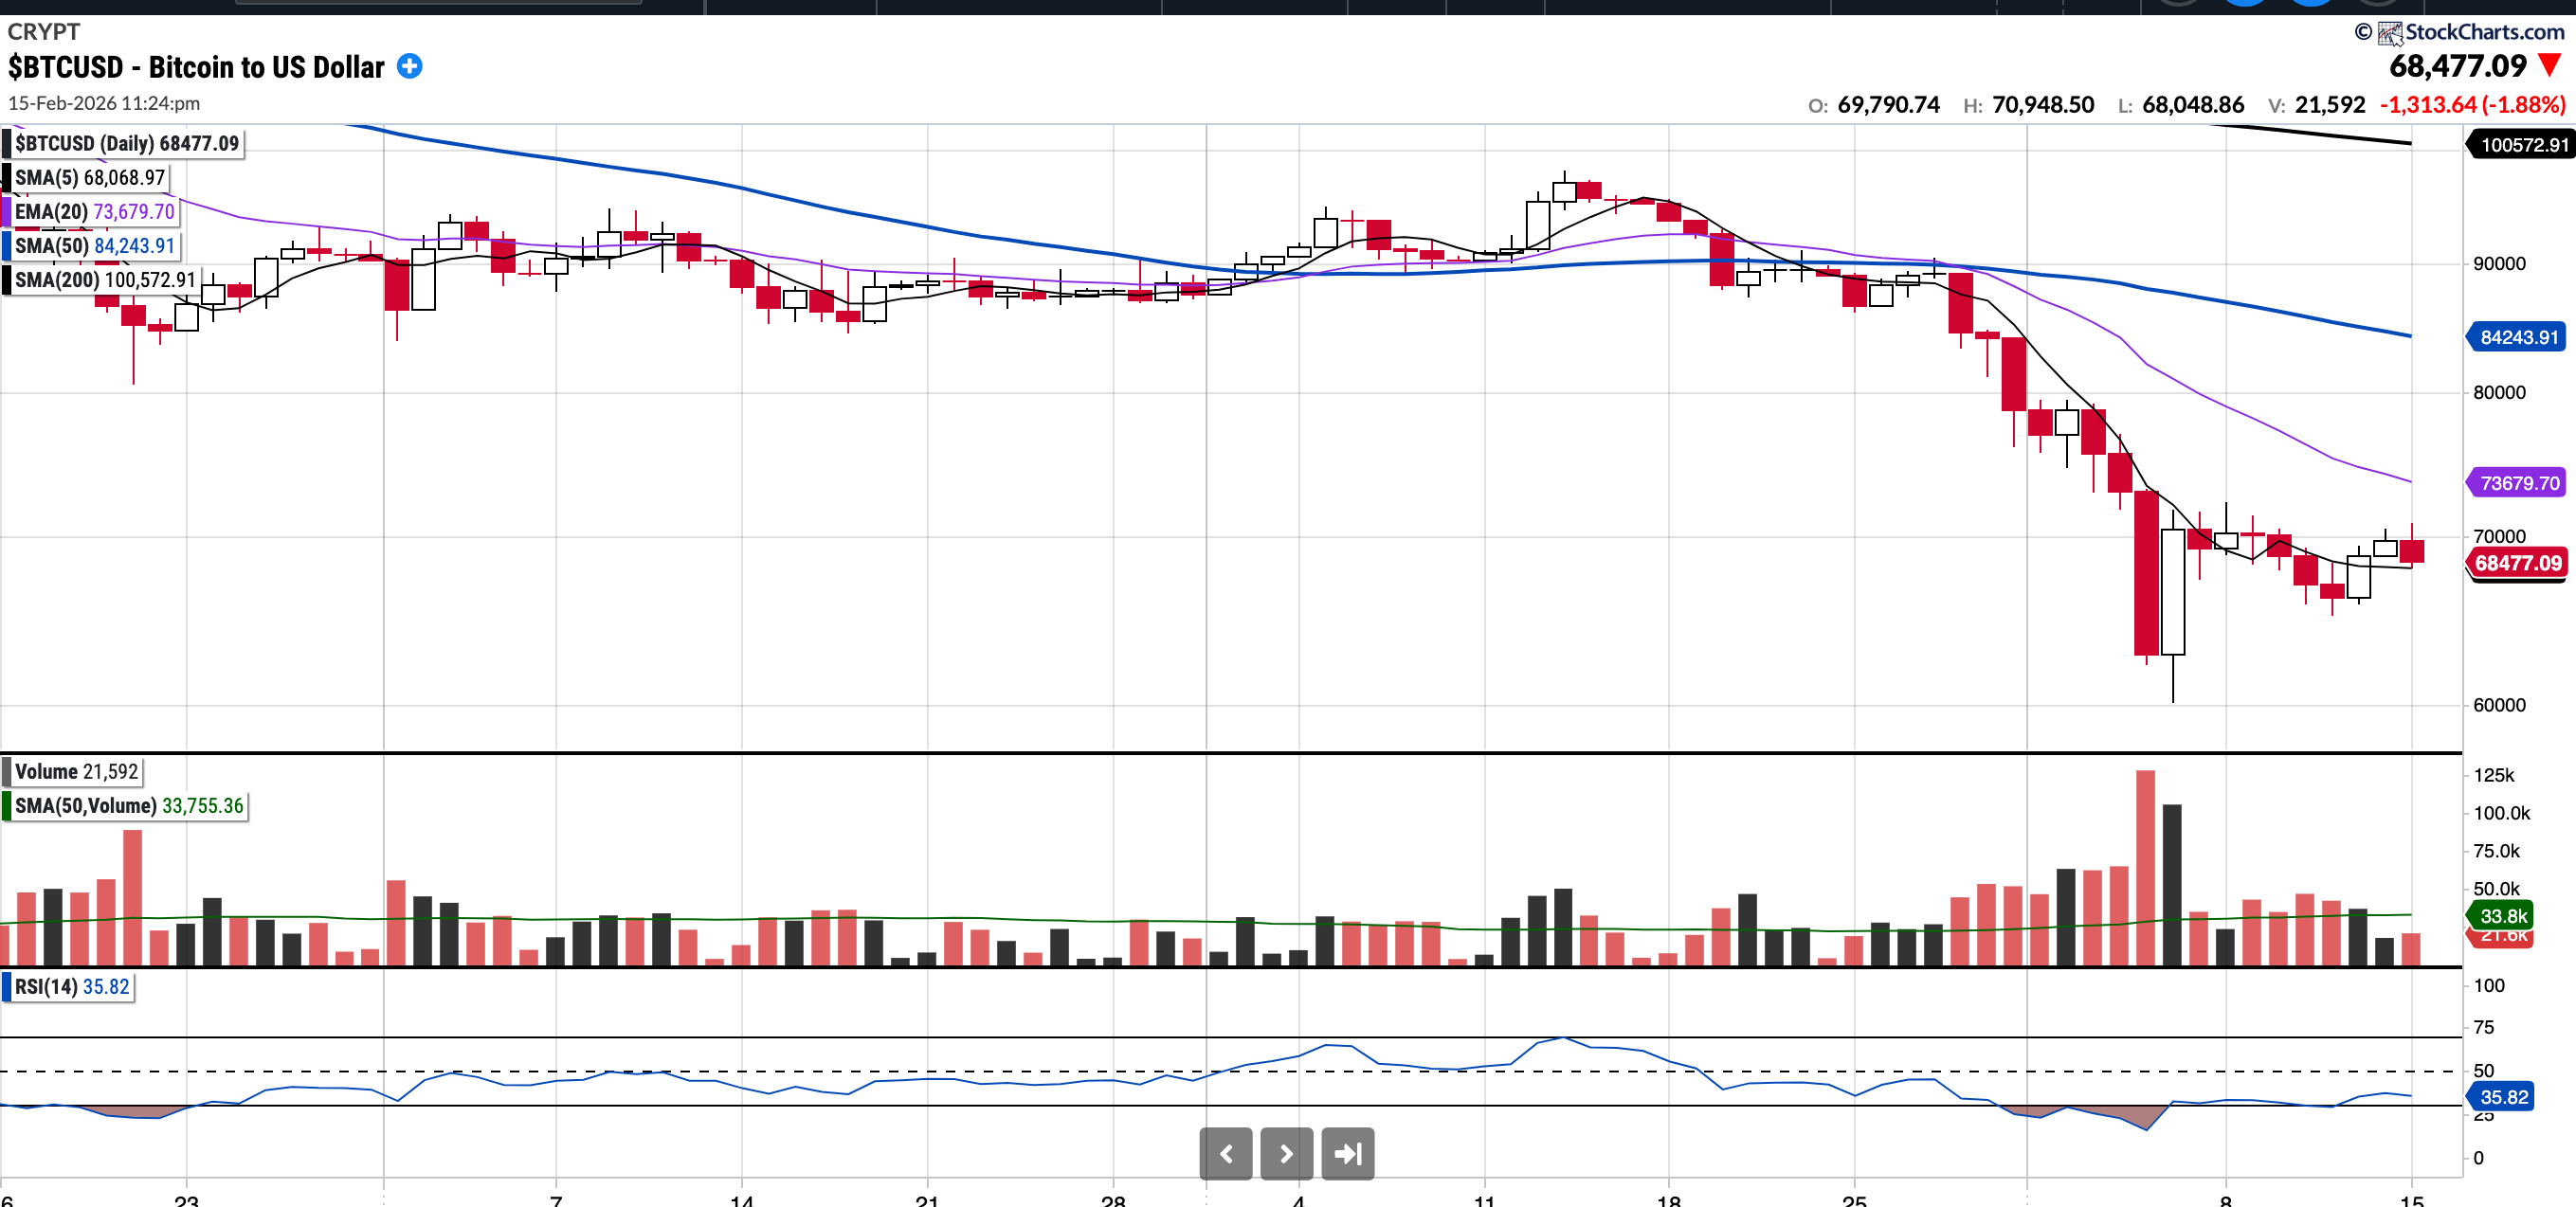
BTC (currently Long)
Currently trades at $68,477.09 ~18.72% below the 50SMA and ~31.91% below the 200SMA.
RSI 35.82
-22.8% YTD.
Last Thursday Bitcoin fell as low as 59k and in the process tested the 200wk moving average. It bounced more than $10,000 on the subsequent Friday and has since traded in the 68-71k range. It remains above the 5 day moving average and whilst it could see further mean reversion, significant technical work remains before the chart looks constructive again.
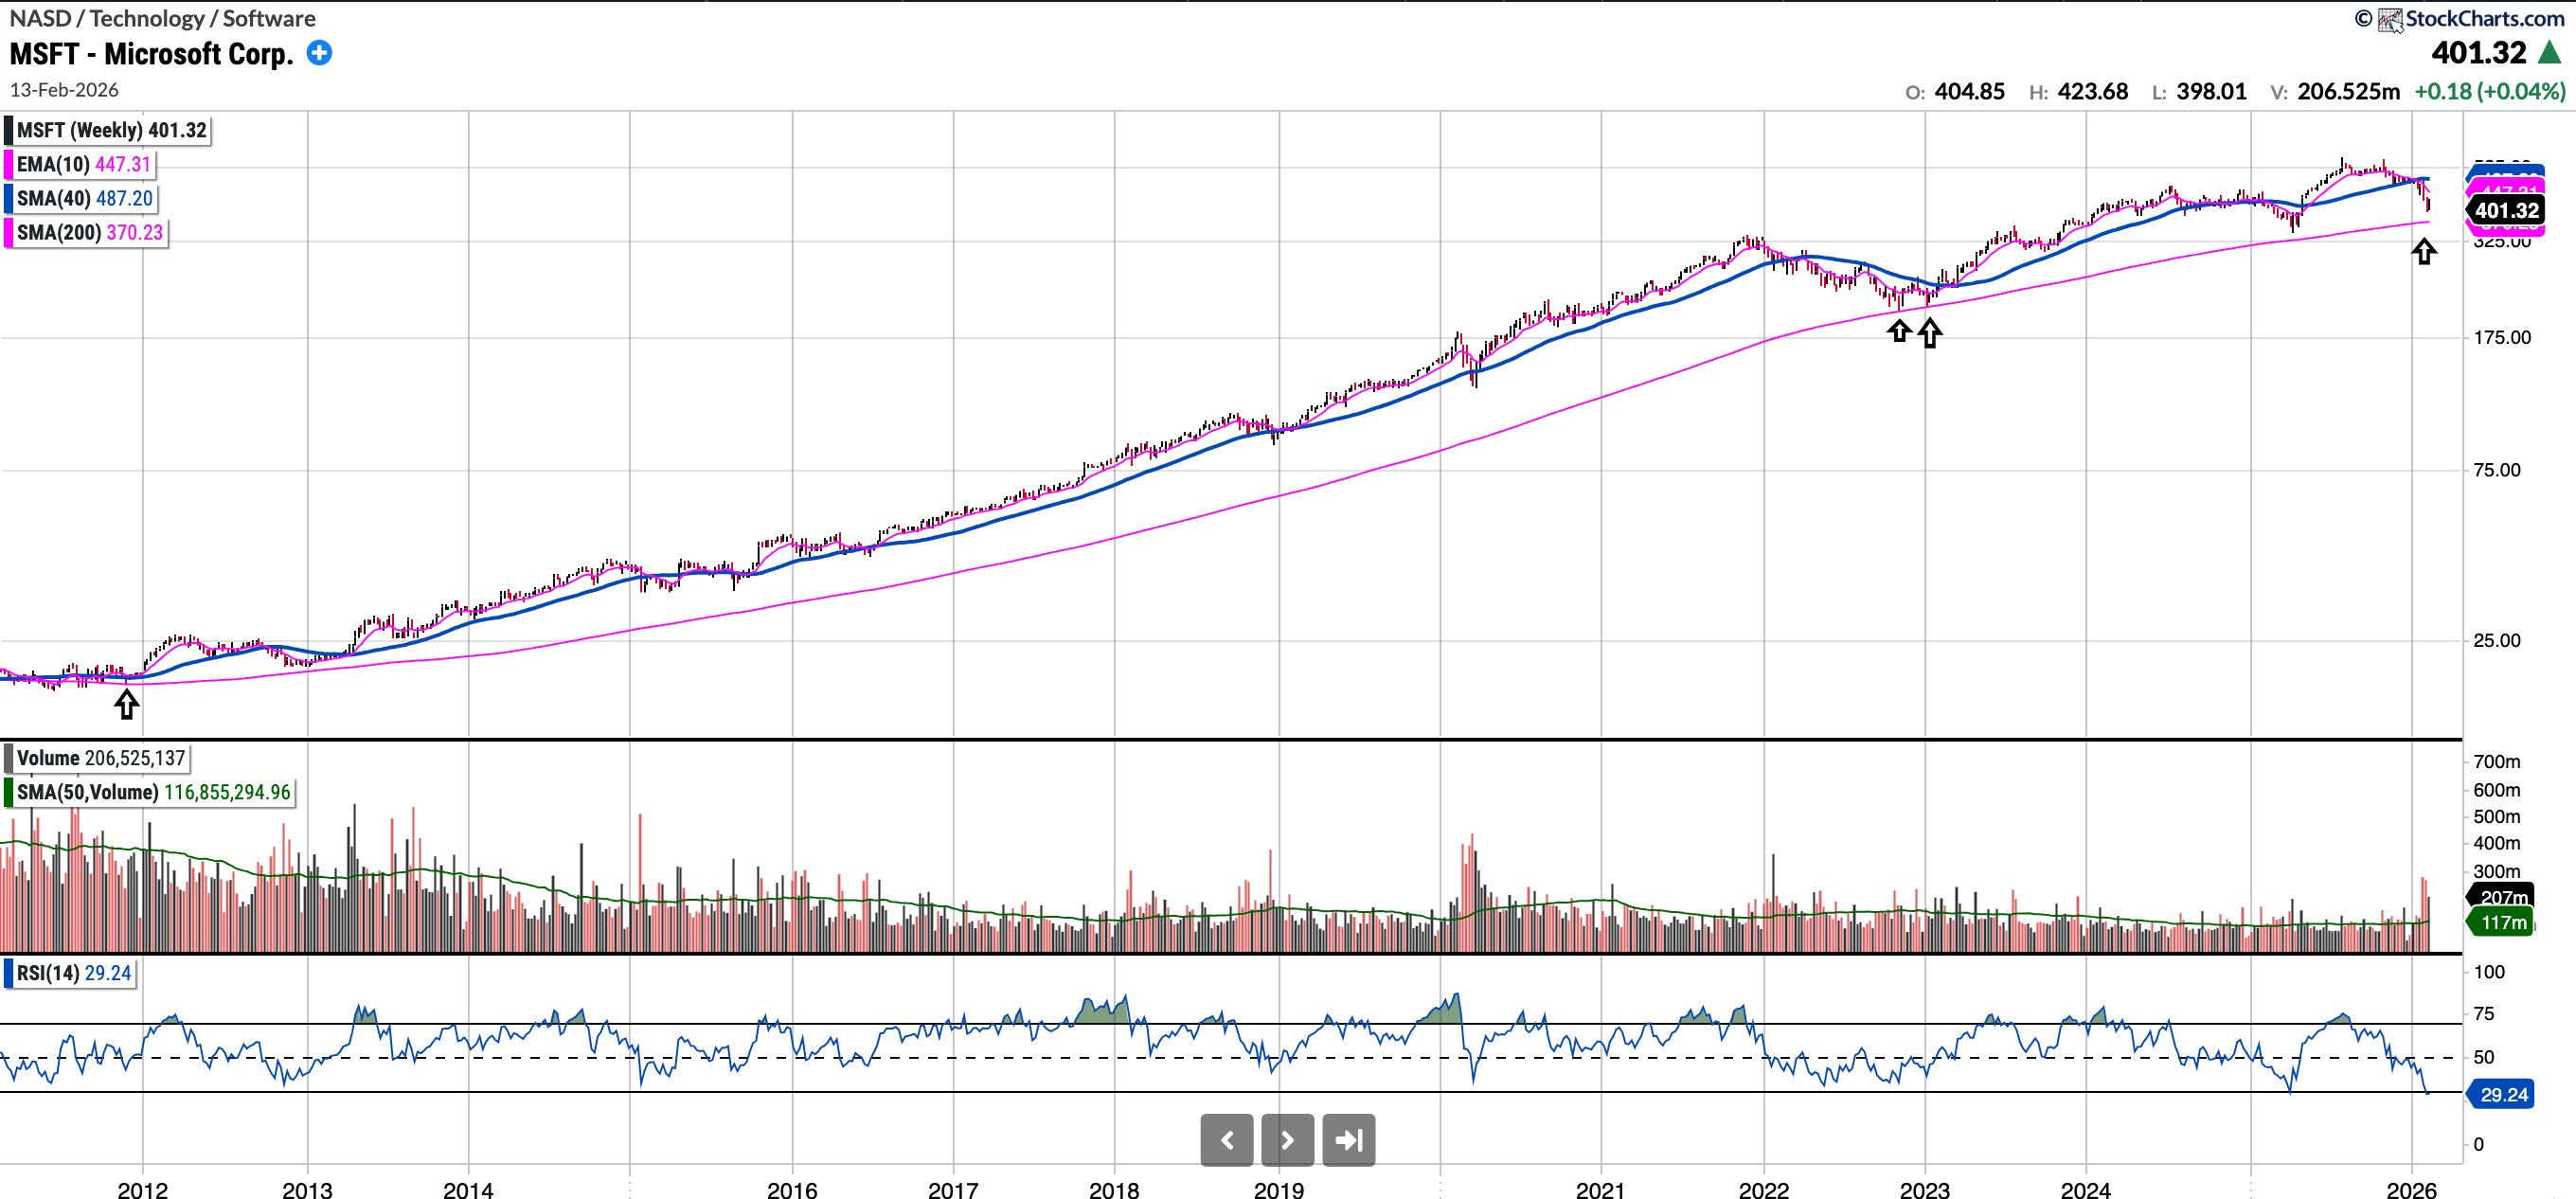
MSFT (currently Long)
Currently trades at $401.32, 12.94% below the 50SMA and 17.49% below the 200SMA.
RSI 32.29
-15.14% YTD.
Despite finishing up for the week, the MSFT chart still does not look especially constructive for longs, and it shows that the stock is more oversold than at any point since the GFC. During that timeframe, it has only tested the 200-week Moving Average a handful of times and it may do so again soon if it reaches the $370 level.
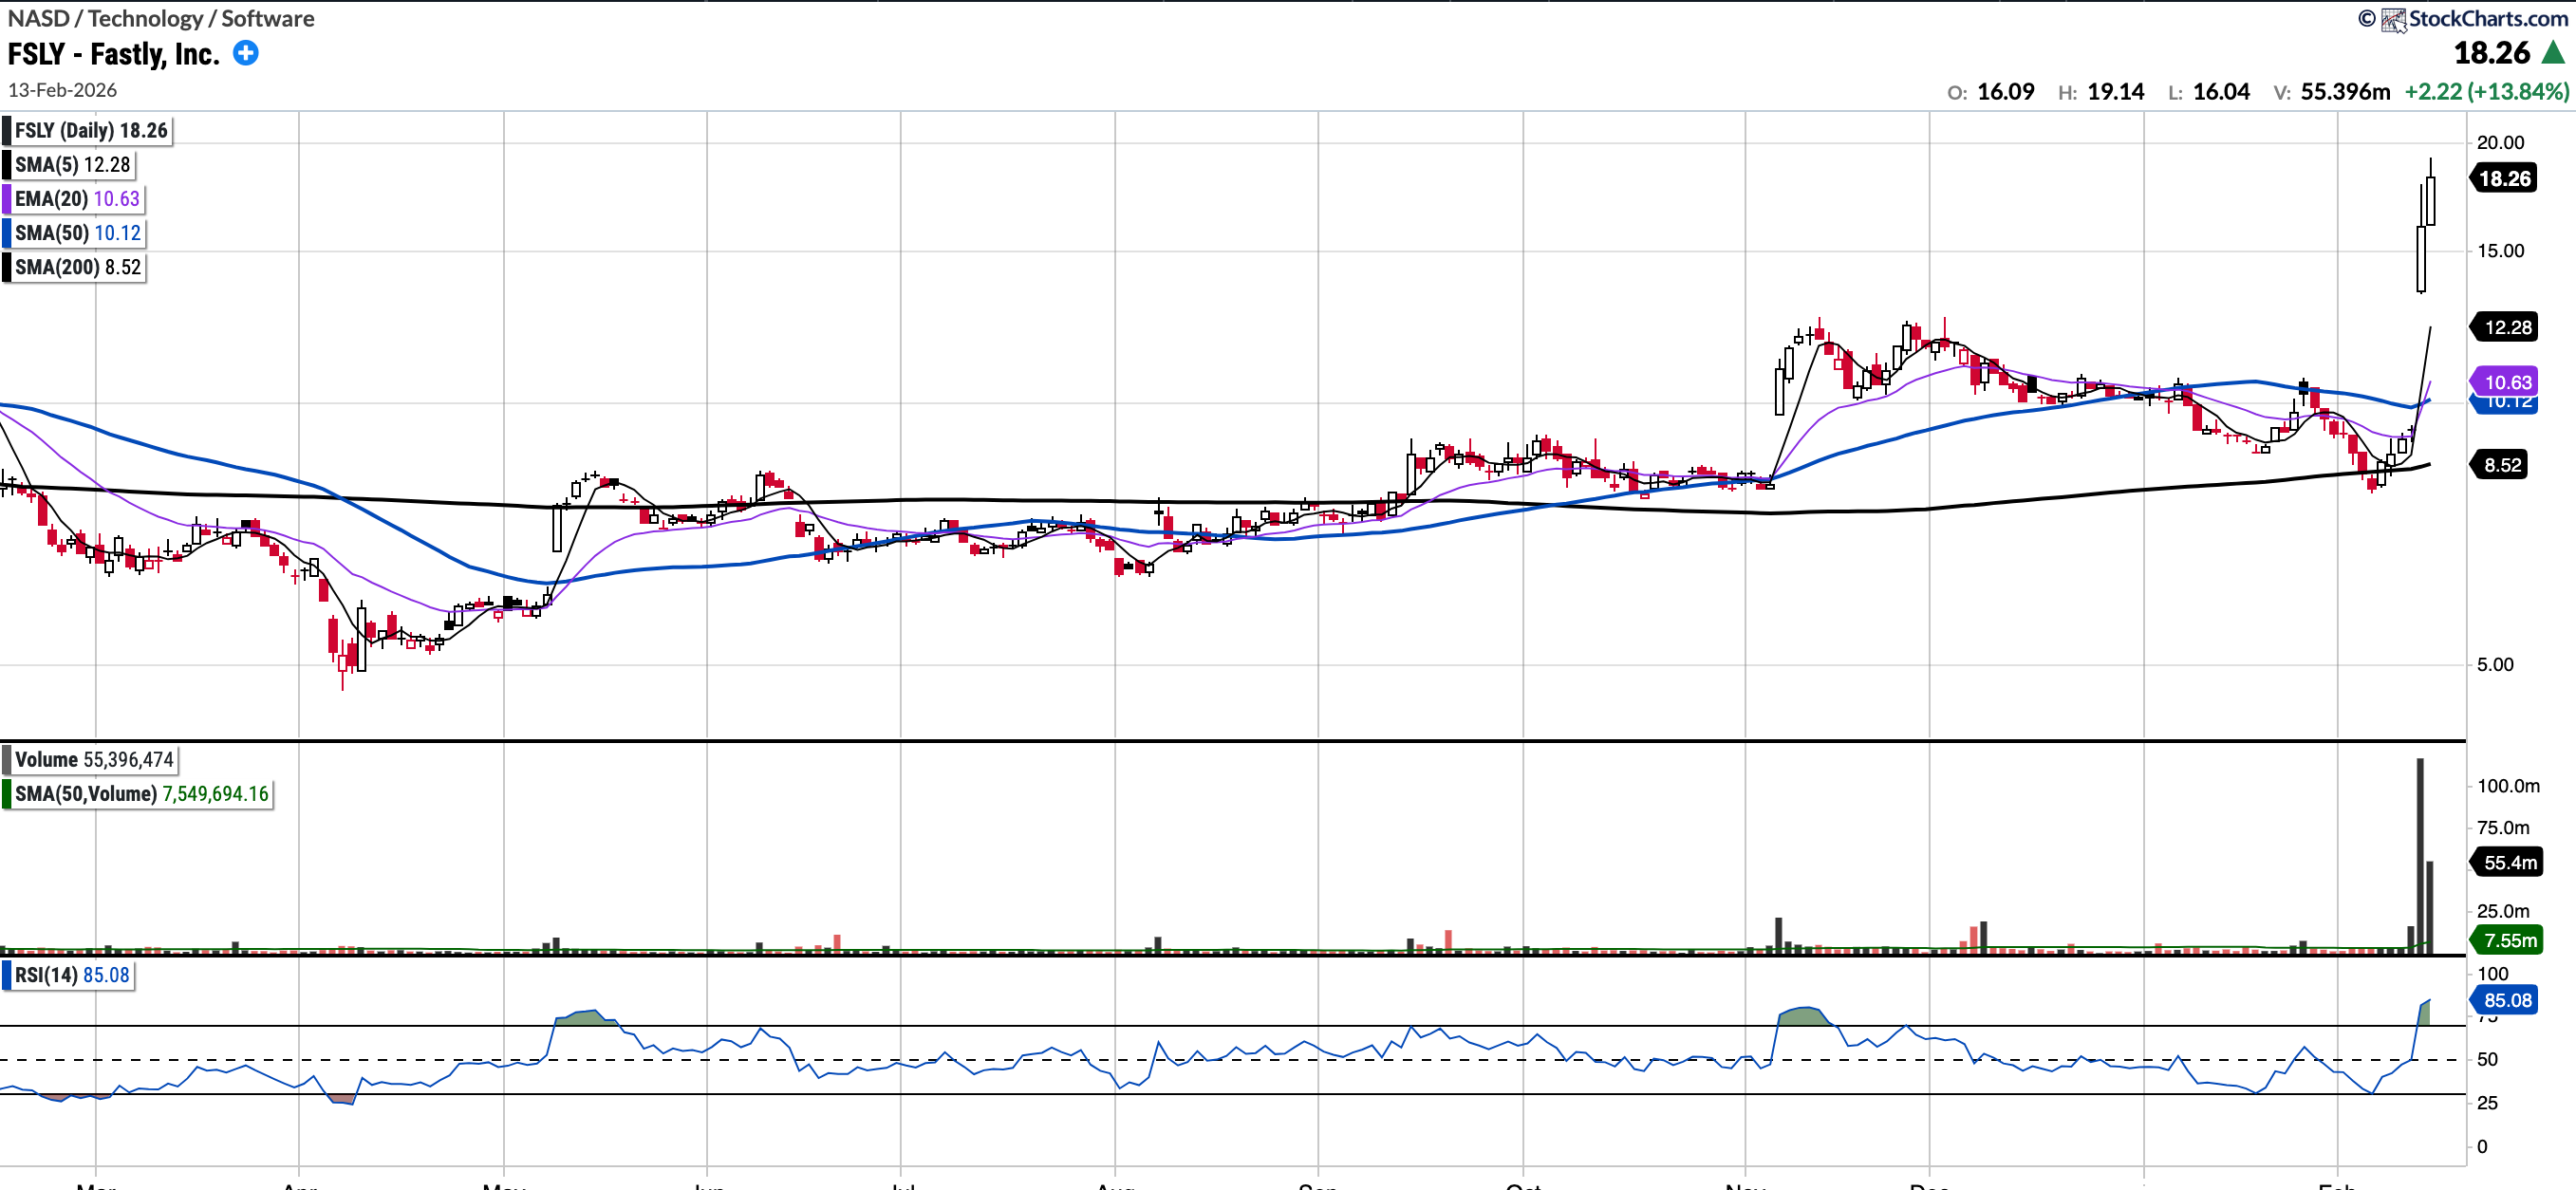
FSLY (No position)
Currently trades at $18.26, 80.44% above the 50SMA and 114.27% above the 200SMA.
RSI 54.68
79.2% YTD.
Fastly is an infrastructure software firm that offers cloud computing, image optimisation, security, edge computer technology, and streaming solutions. They are positioned to benefit from Agentic AI Boom.
They reported earnings this week, beating analysts expectation significantly and raised forward guidance. The chart shows a classic breakaway gap and Thursday was in fact a highest ever volume day. Extended near term but I will be adding this to my watchlist.
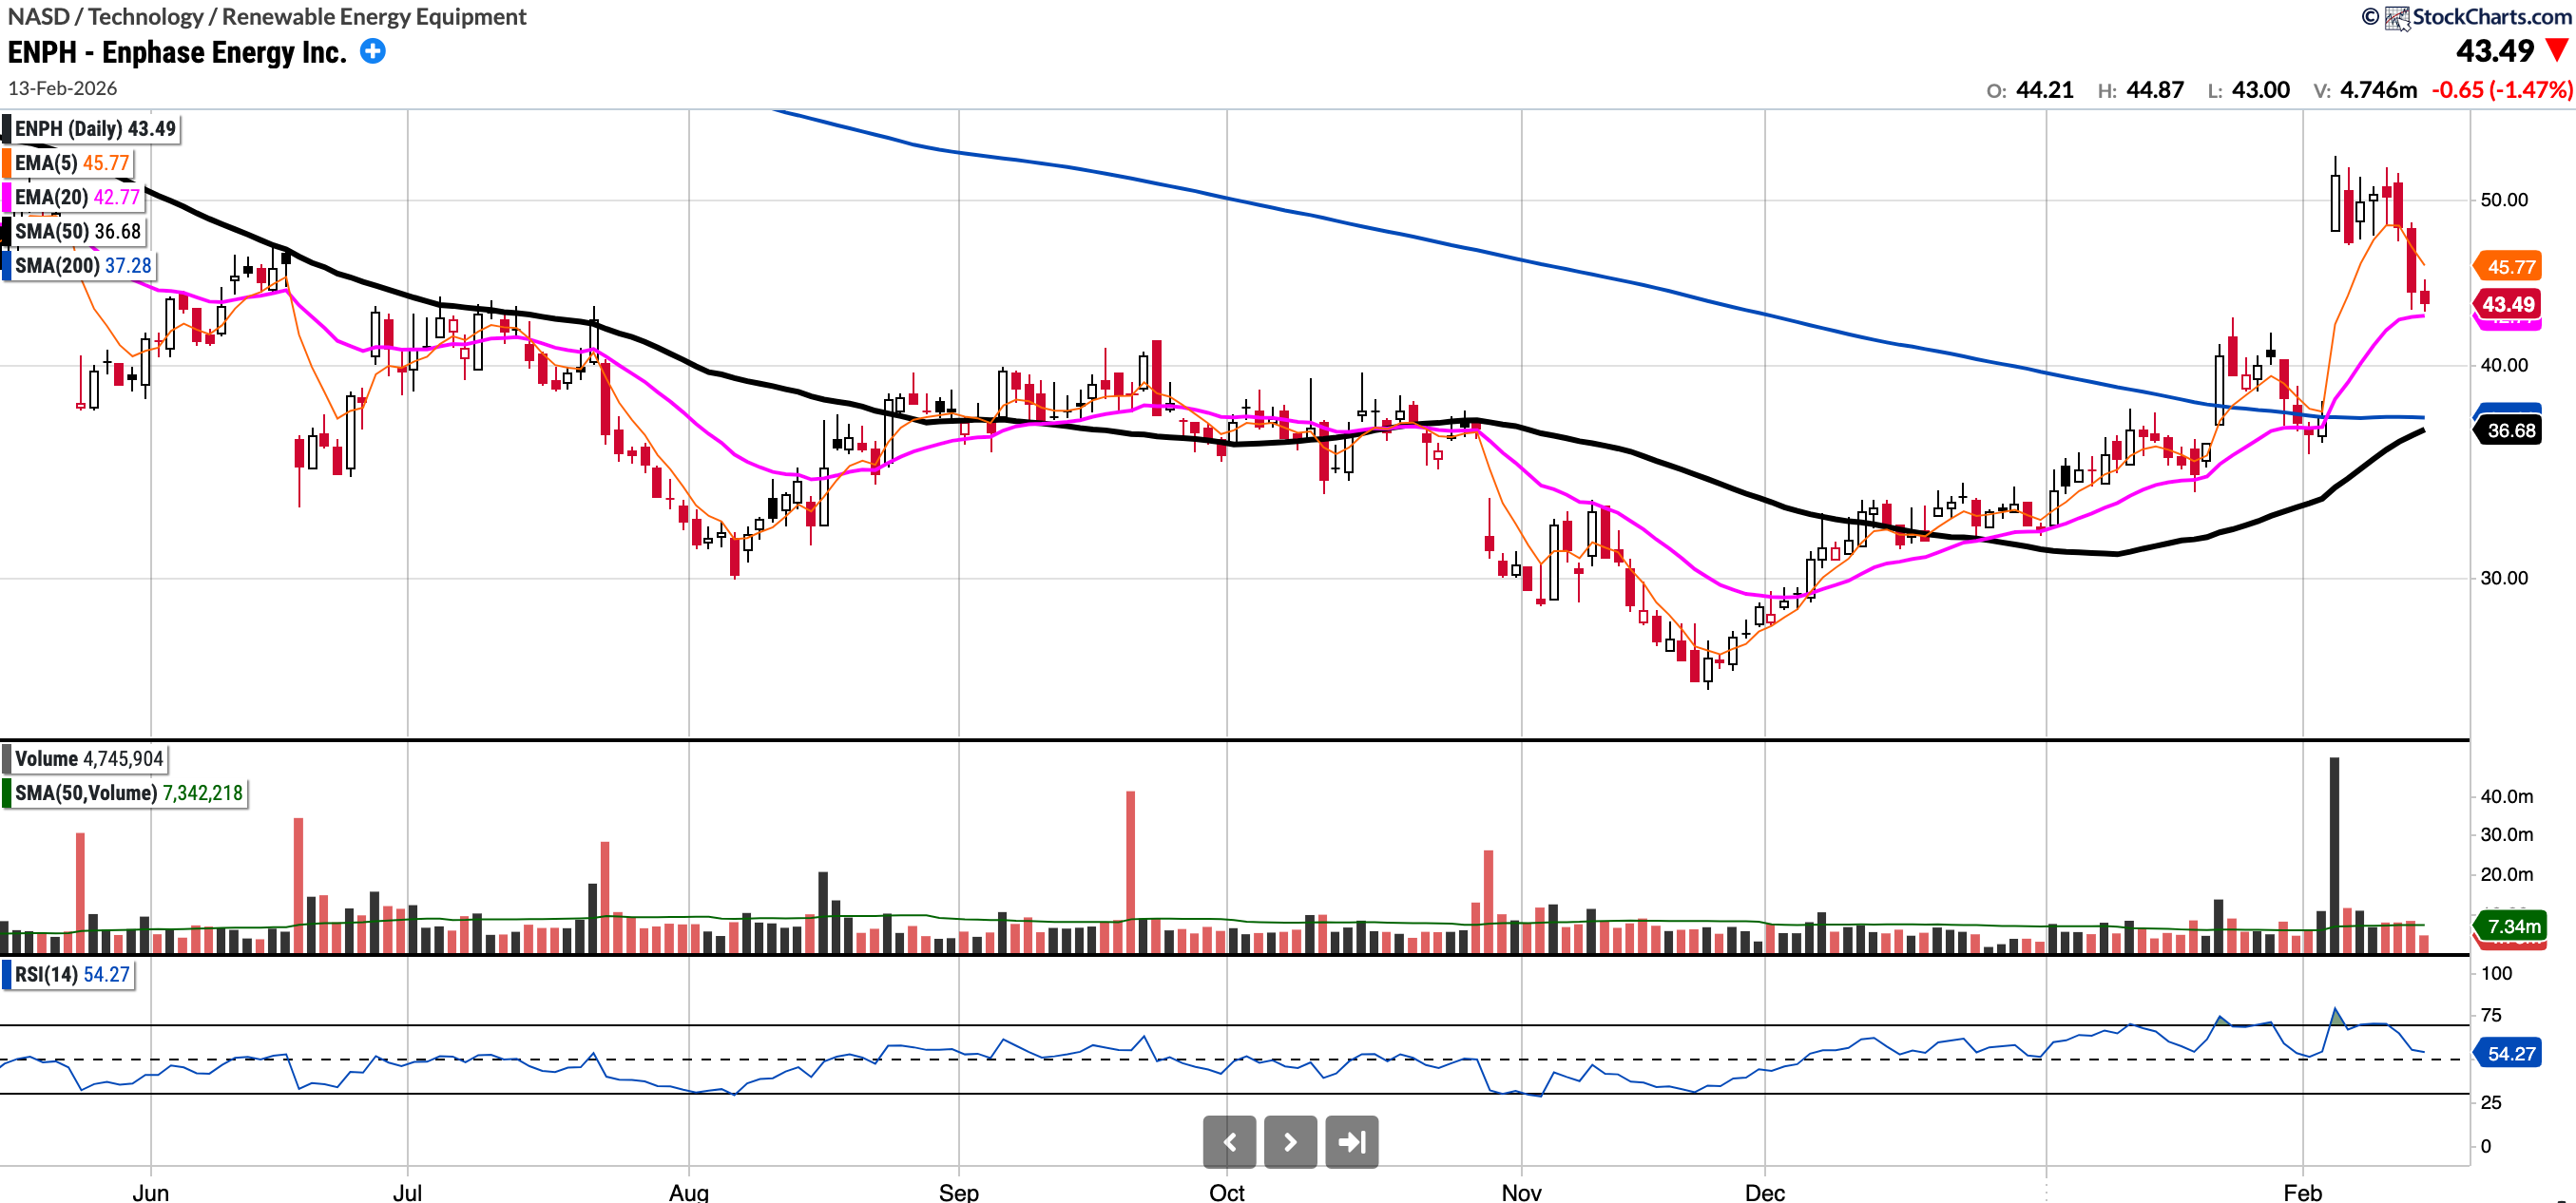
ENPH (No position)
Currently trades at $43.49, 18.57% above the 50SMA and 16.66% above the 200SMA.
RSI 54.27
28.86% YTD.
Enphase recently reported a "double beat," initially surging over 20% on high volume following news of inventory normalisation and stronger-than-expected guidance.
While the stock has since begun to pull back on lower volume, the technical setup is shifting. After several failed counter-rallies over the last 18 months, this move marks a potential trend reversal: the weekly 10EMA has crossed above the 40SMA, and the price is holding above the 200-day moving average for the first time since December 2024.
I have added $ENPH to my watchlist and eyeing a long entry near the 20-day EMA.
Notable portfolio changes in previous week (all updated live in subscriber channels):
