
Preview of Week Ahead
W/C August 18, 2025

Hope you all are having a good weekend. Below we will be previewing the upcoming week.
Format for what is covered in this weekly preview:
A look at the indices
Key upcoming economic events
Upcoming earnings reports
Interesting charts and setups
Notable portfolio changes from the previous week
Current Portfolio Holdings
If it is your first time here, check out the post below on how to navigate the SixSigmaCapital Website:

Indices
Dow Jones advanced 1.58% in the last week
S&P 500 advanced 0.97% in the last week
Nasdaq Composite advanced 0.87% in the last week
IWM advanced 2.74% in the last week
Key upcoming events:
Monday, August 18:
NAHB Housing Market Index
Tuesday, August 19:
Building Permits (July)
Housing Starts (July)
State Employment and Unemployment (July)
Speech by Fed Governor Michelle Bowman
Wednesday, August 20:
Release of the Federal Open Market Committee (FOMC) July Meeting Minutes
Thursday, August 21 - Saturday, August 23:
Jackson Hole Economic Policy Symposium (Main event!)
Friday, August 22:
Keynote address by Fed Chairman Powell at the Jackson Hole Symposium
Preliminary Manufacturing & Services PMI (August)
Upcoming Earnings
Last week was an action packed one for the portfolio and we had Harrow, Tecogen, Sea Limited and PagSeguro. This week there is BABA on Thursday but no other portfolio names reporting to the best of my knowledge.
Below is the infographic by Earnings Whispers for the upcoming week:

Charts
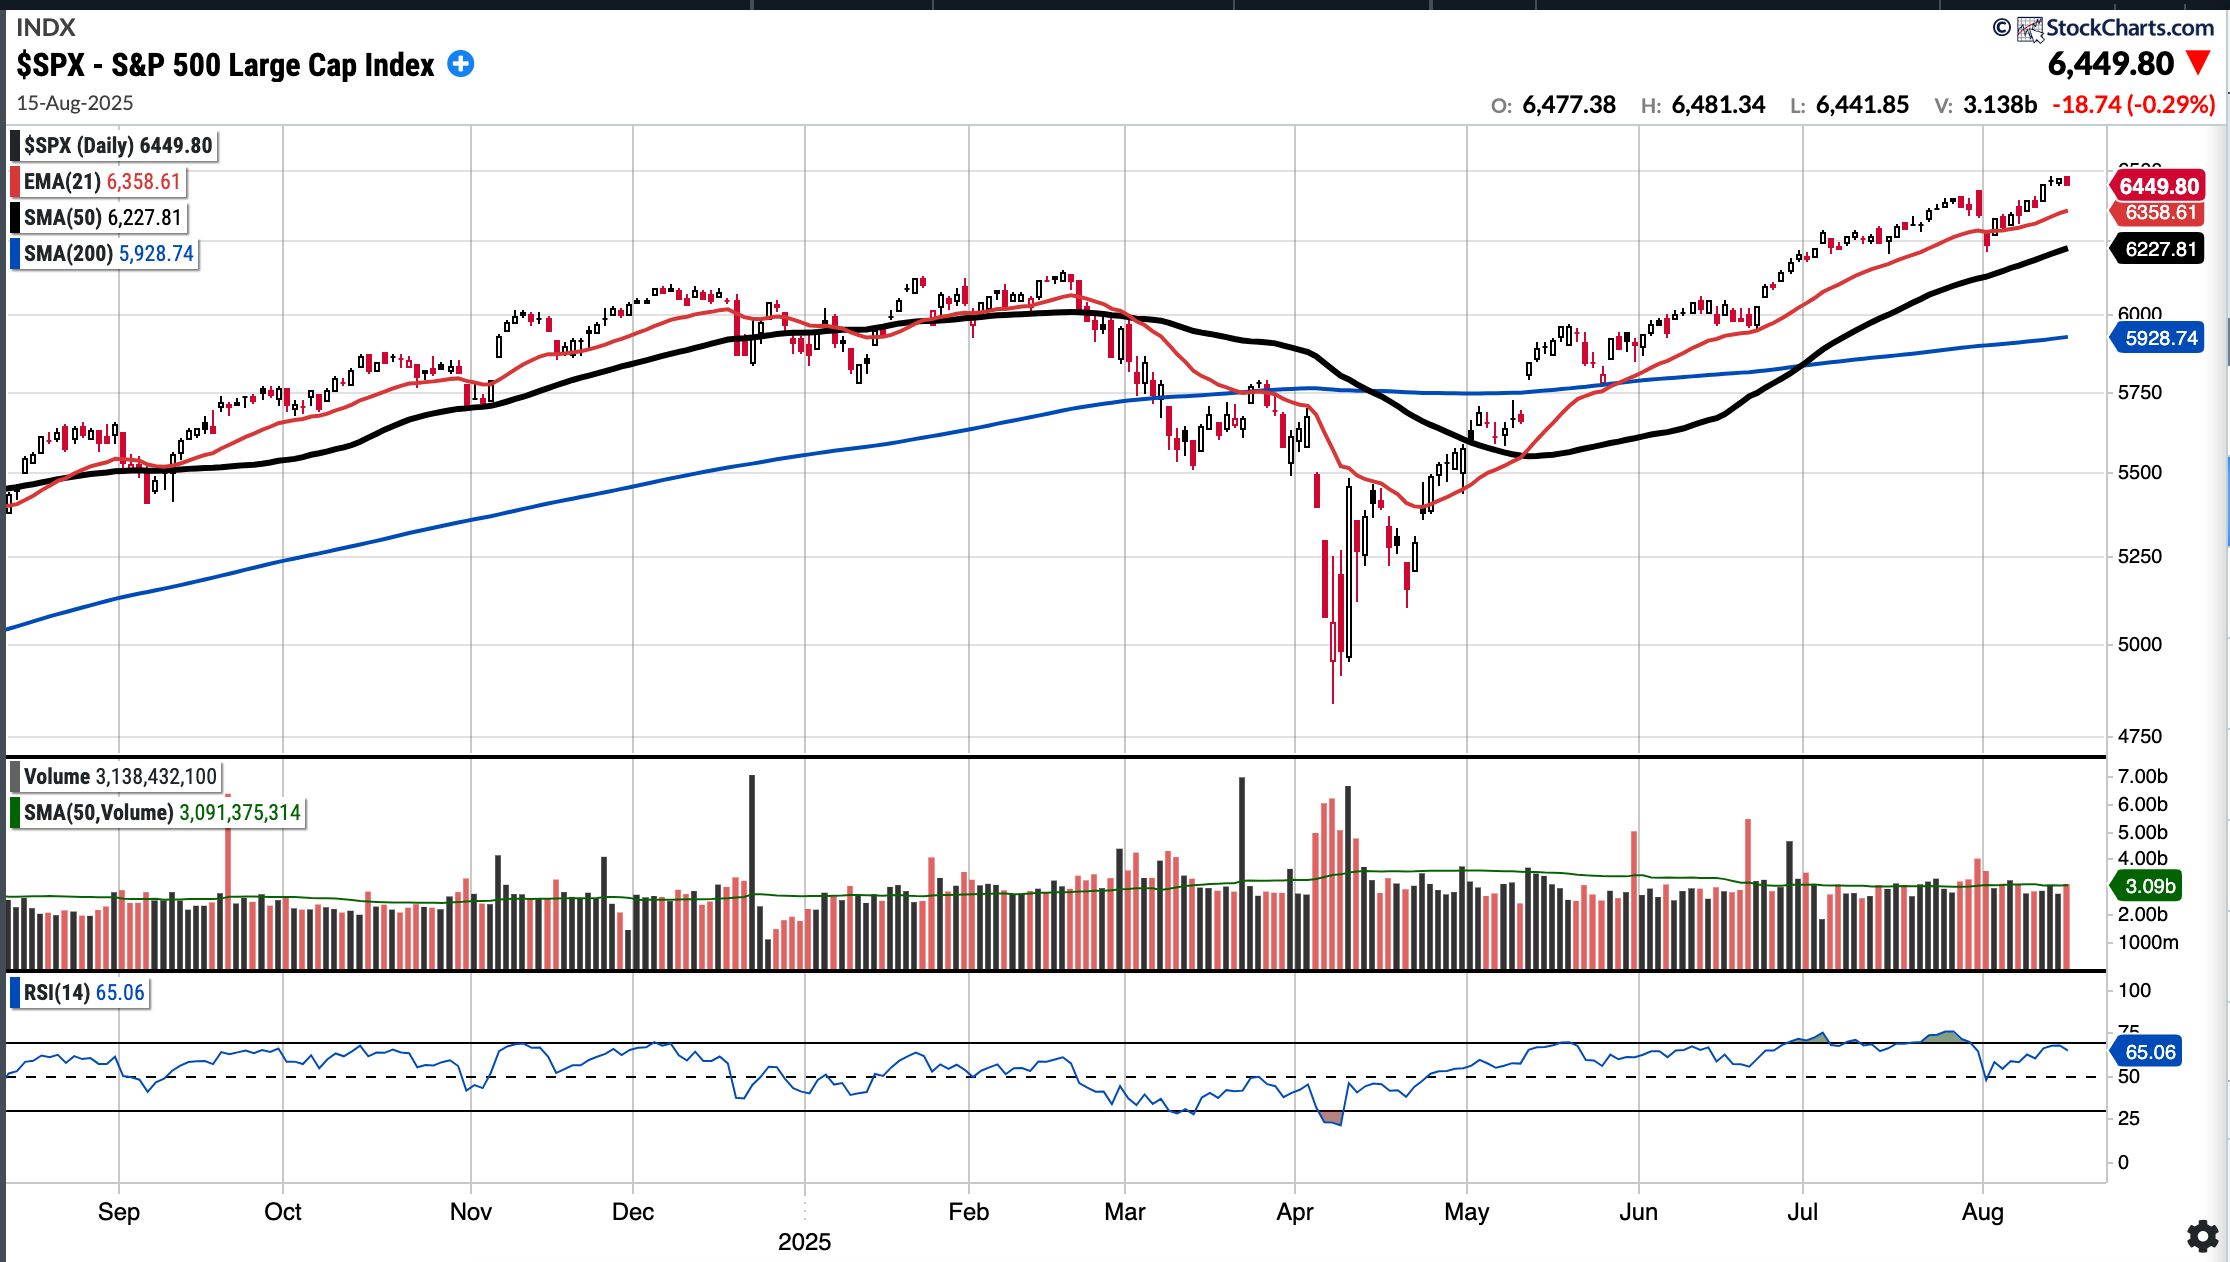
SPX
Sits currently at 6449.8, RSI 65.06. 3.56% above a rising 50SMA.
9.9% YTD
Still in a strong uptrend amidst the seasonally weak period. We did get a pullback to the EMA 21 at the start of the month which was held and rebounded nicely from.
0 Distribution days in the last week.
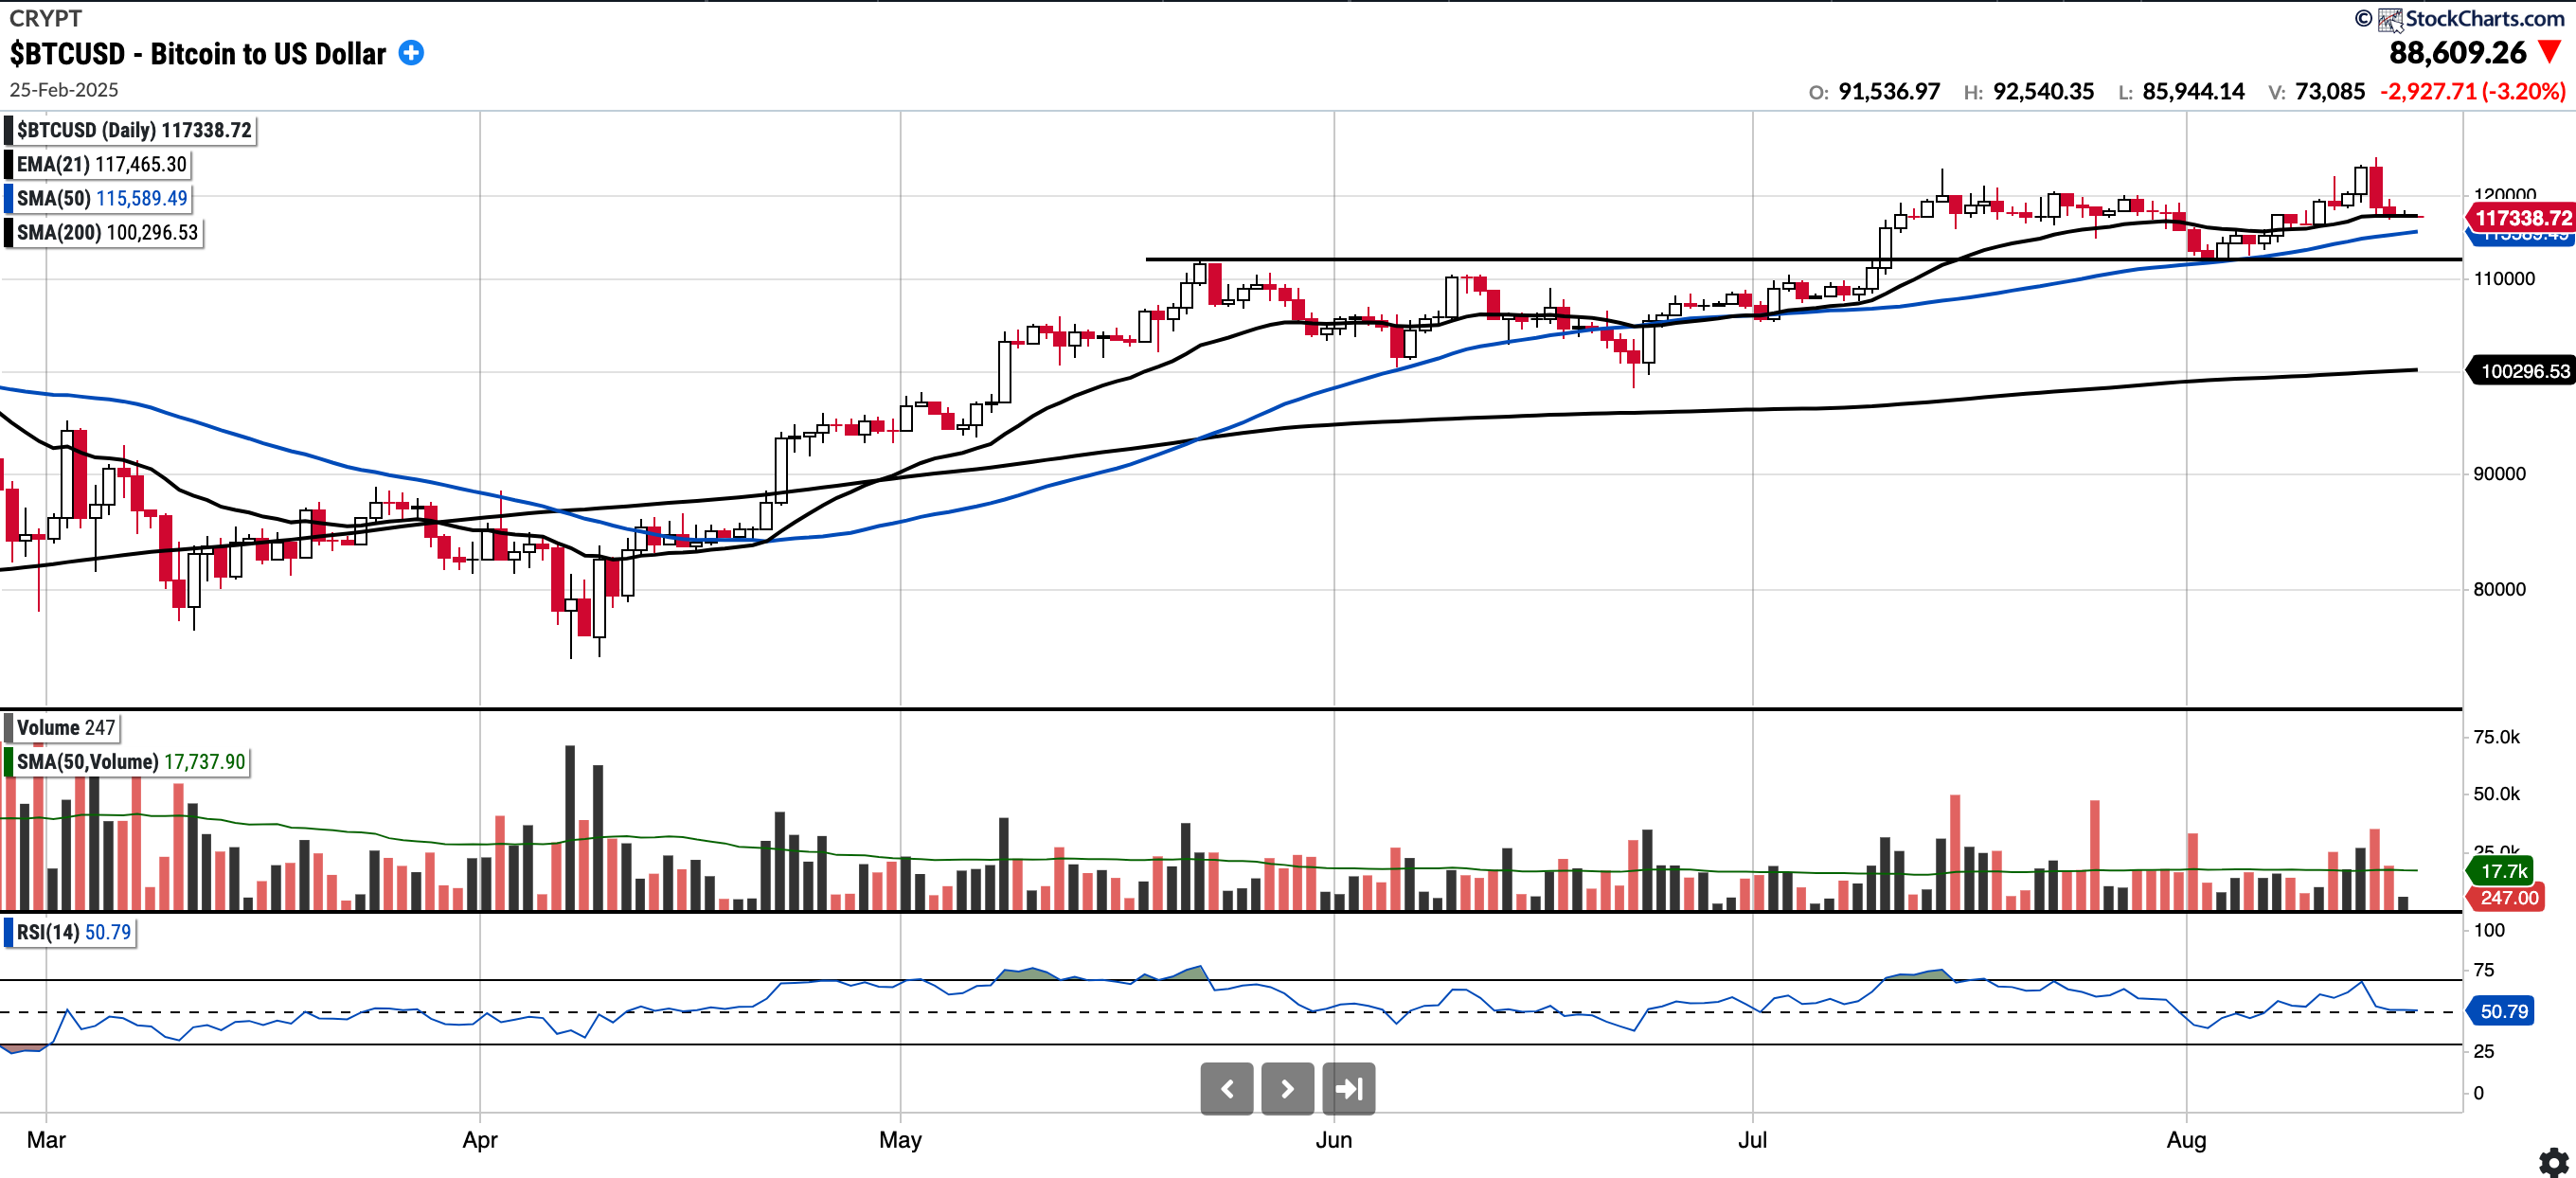
BTC (currently Long)
Currently $117338.72. 2.87% above 50SMA and 17.00% above 200SMA.
24.26% YTD.
Made a new ATH on Wednesday but has reversed sharply on Thursday on volume. BTC volatility would not be unexpected this week especially with the economic events later in the week!
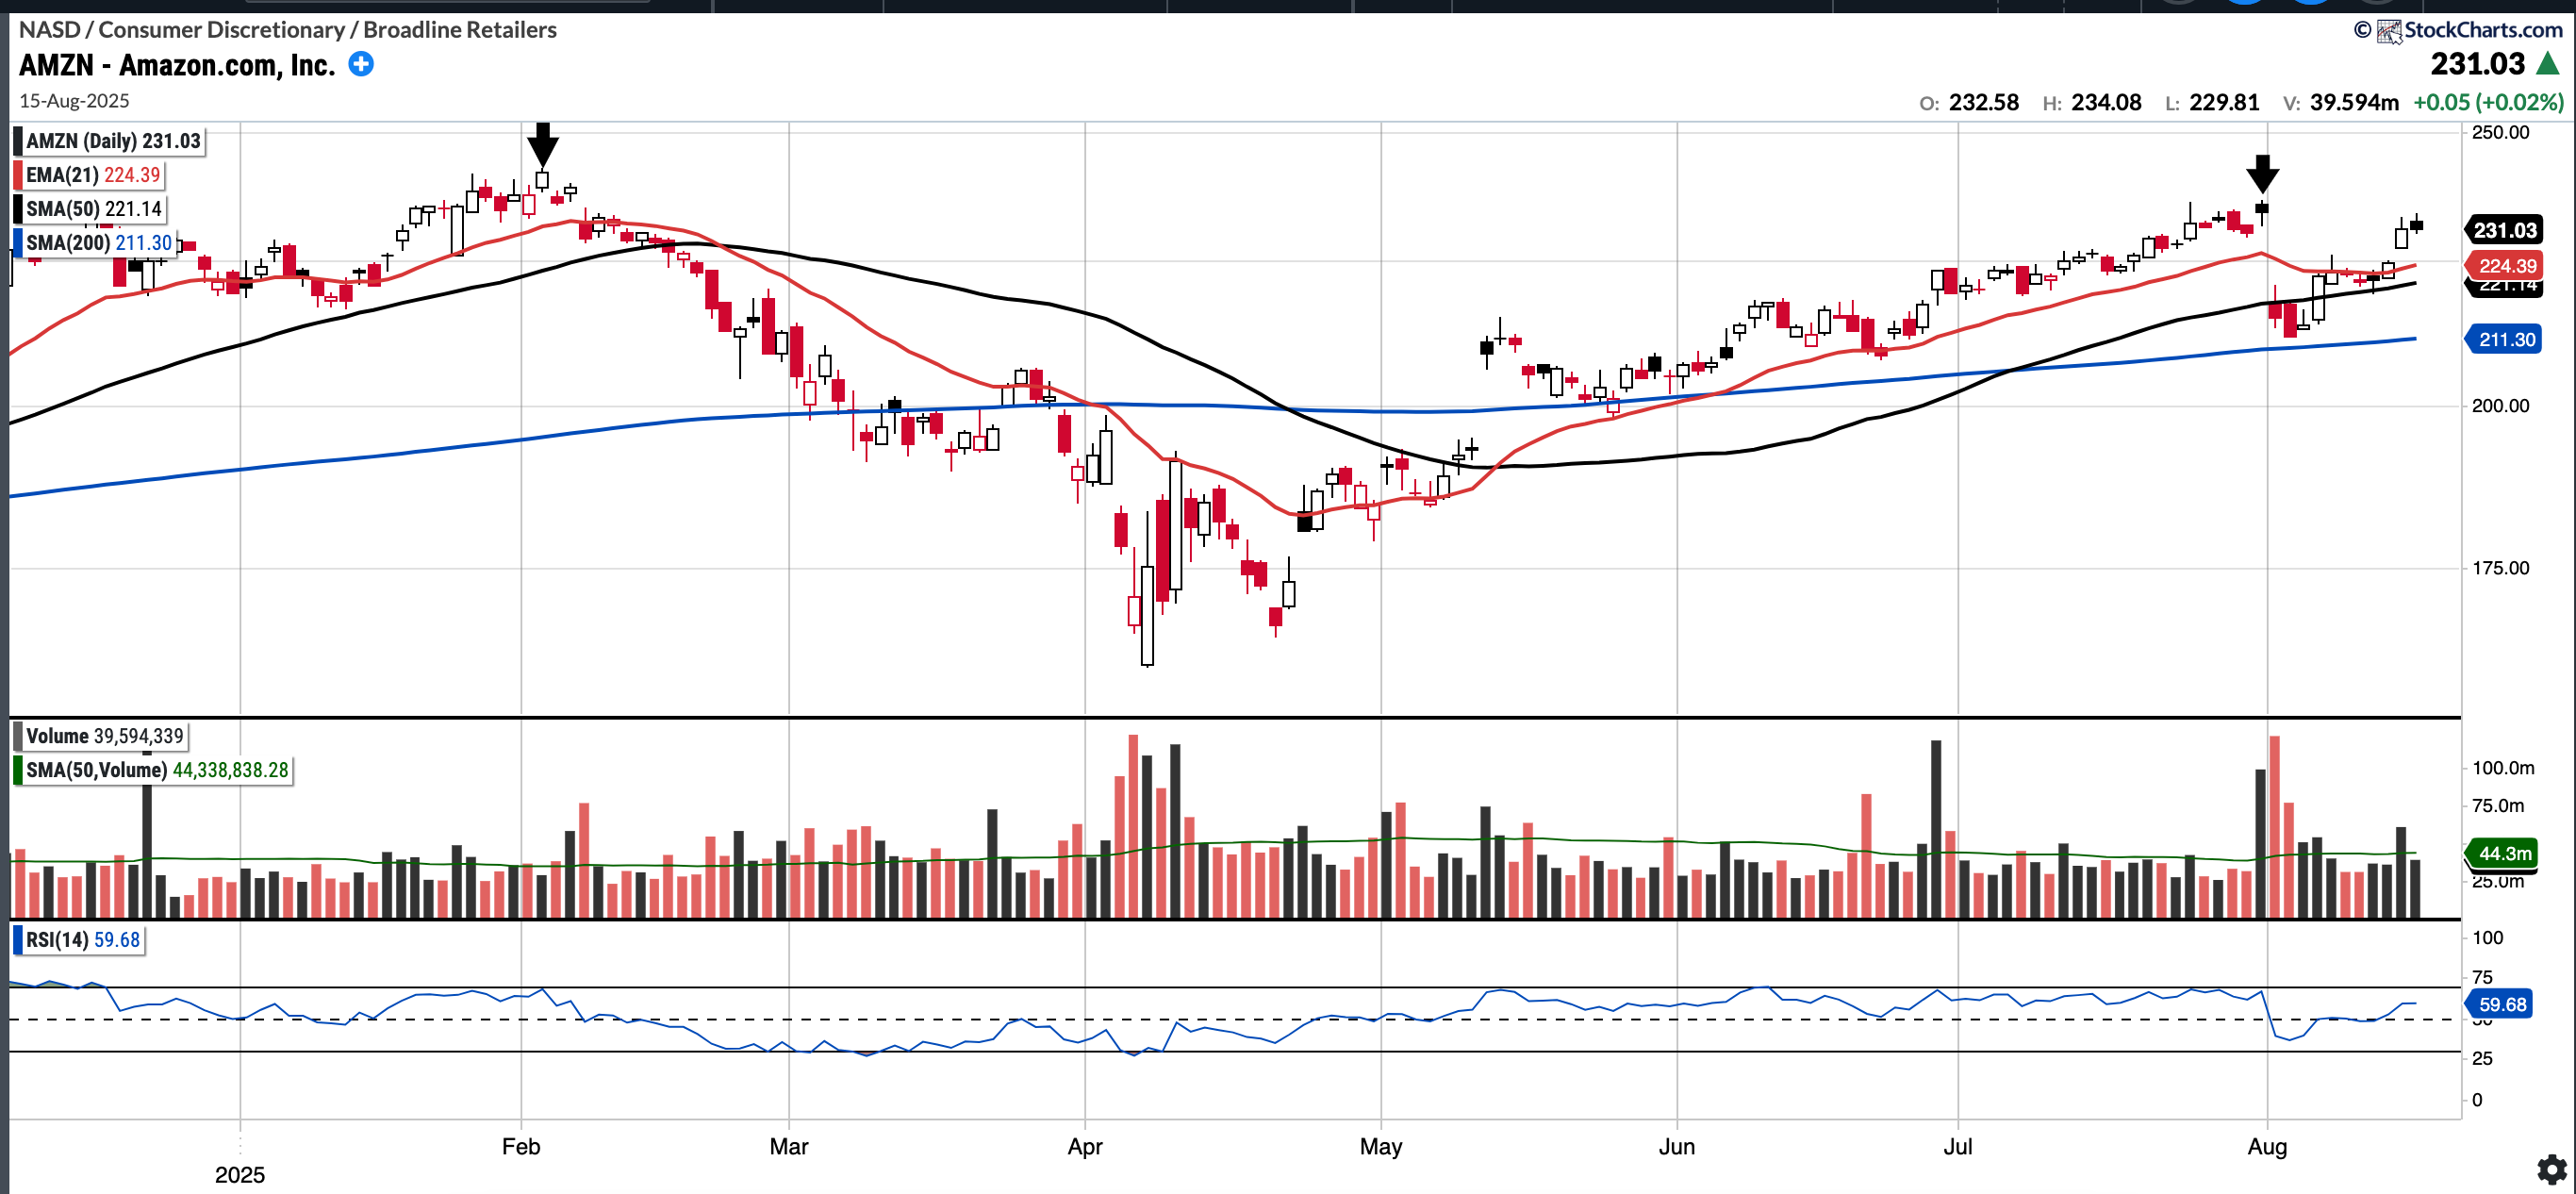
AMZN (Currently Long)
Currently trades at $231.03, RSI 59.68 and 9.34% above 200SMA.
+4.91% YTD
Reported earnings recently after which the stock sold off more than 8% the next day. Critically AMZN held the SMA 200 and last week I mentioned whether it would fill the earnings gap to 230 which it has done. Now remains to be seen if can re-test and maybe surpass prev ATH of 242.
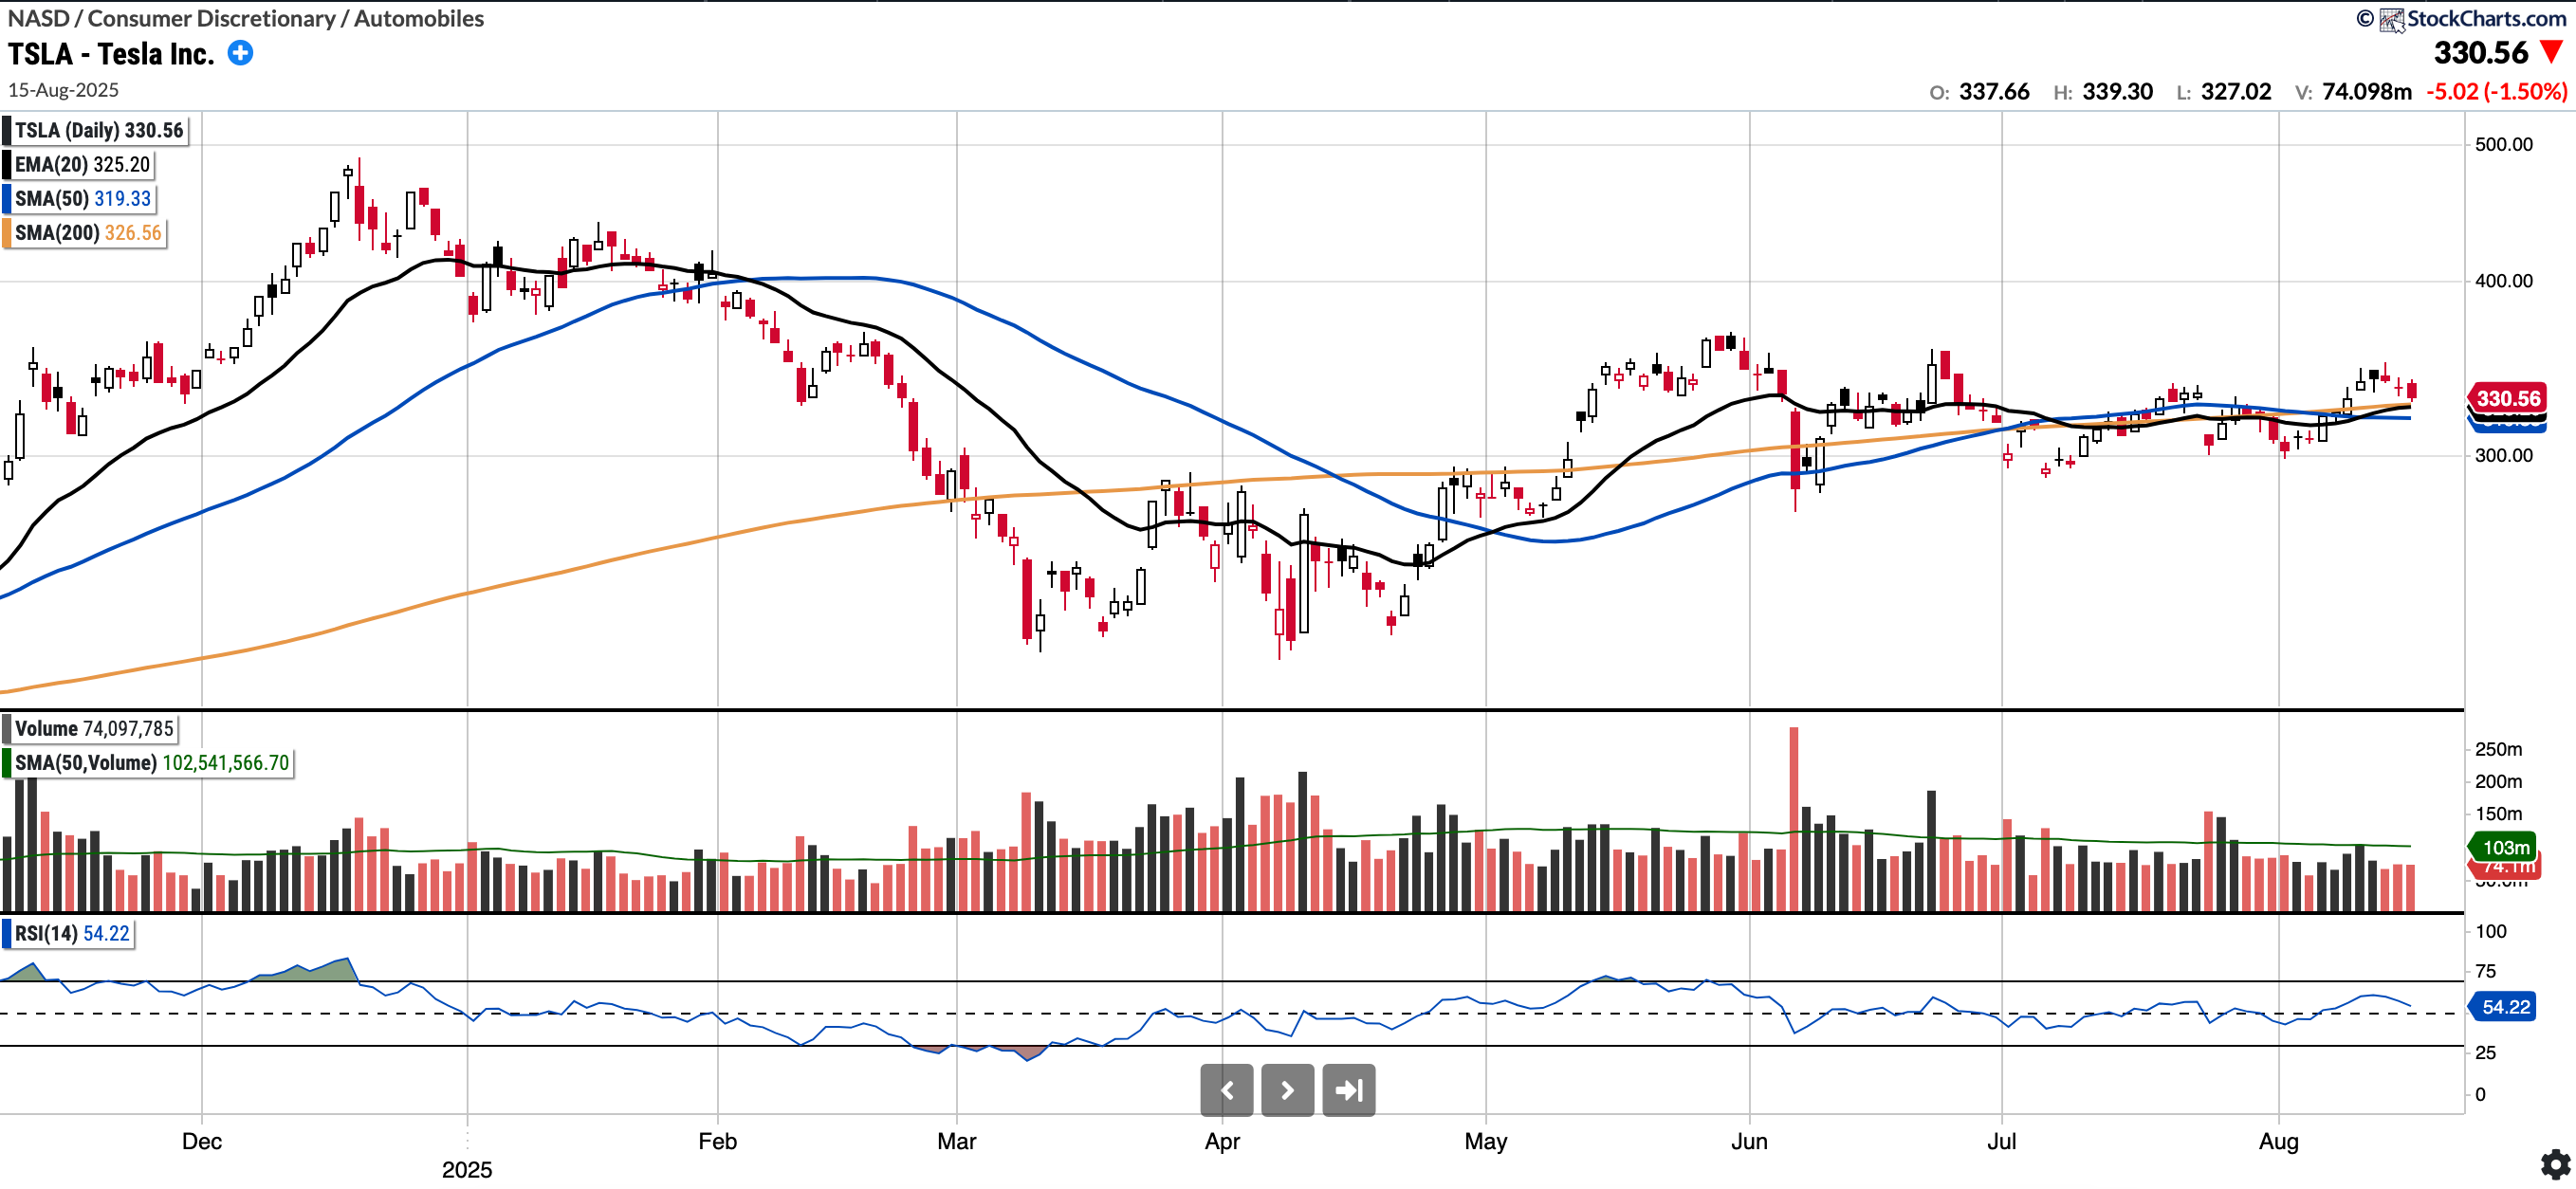
TSLA (No position)
Currently trades at $330.56 RSI 54.22 and 1.23% above 200SMA.
-12.85% YTD
TSLA has reclaimed all its key moving averages (which are coming to a confluence now) and has shrugged off a lot of bad news in recent weeks, such as poor earnings reports, poor delivery numbers, the unimpressive launch of its Robotaxi, and, last but not least, Elon's kerfuffle with the sitting U.S. president. That is notable.
Furthermore, with laggard MAG 7 stocks like GOOGL and AAPL recently getting a bid, I wouldn't be surprised to see TSLA test 360-365. If that range is broken cleanly, a run to 420 could be next.
However, tight price action does not necessarily have to resolve to the upside and in that case range lows of 280’s may be in play on market weakness.
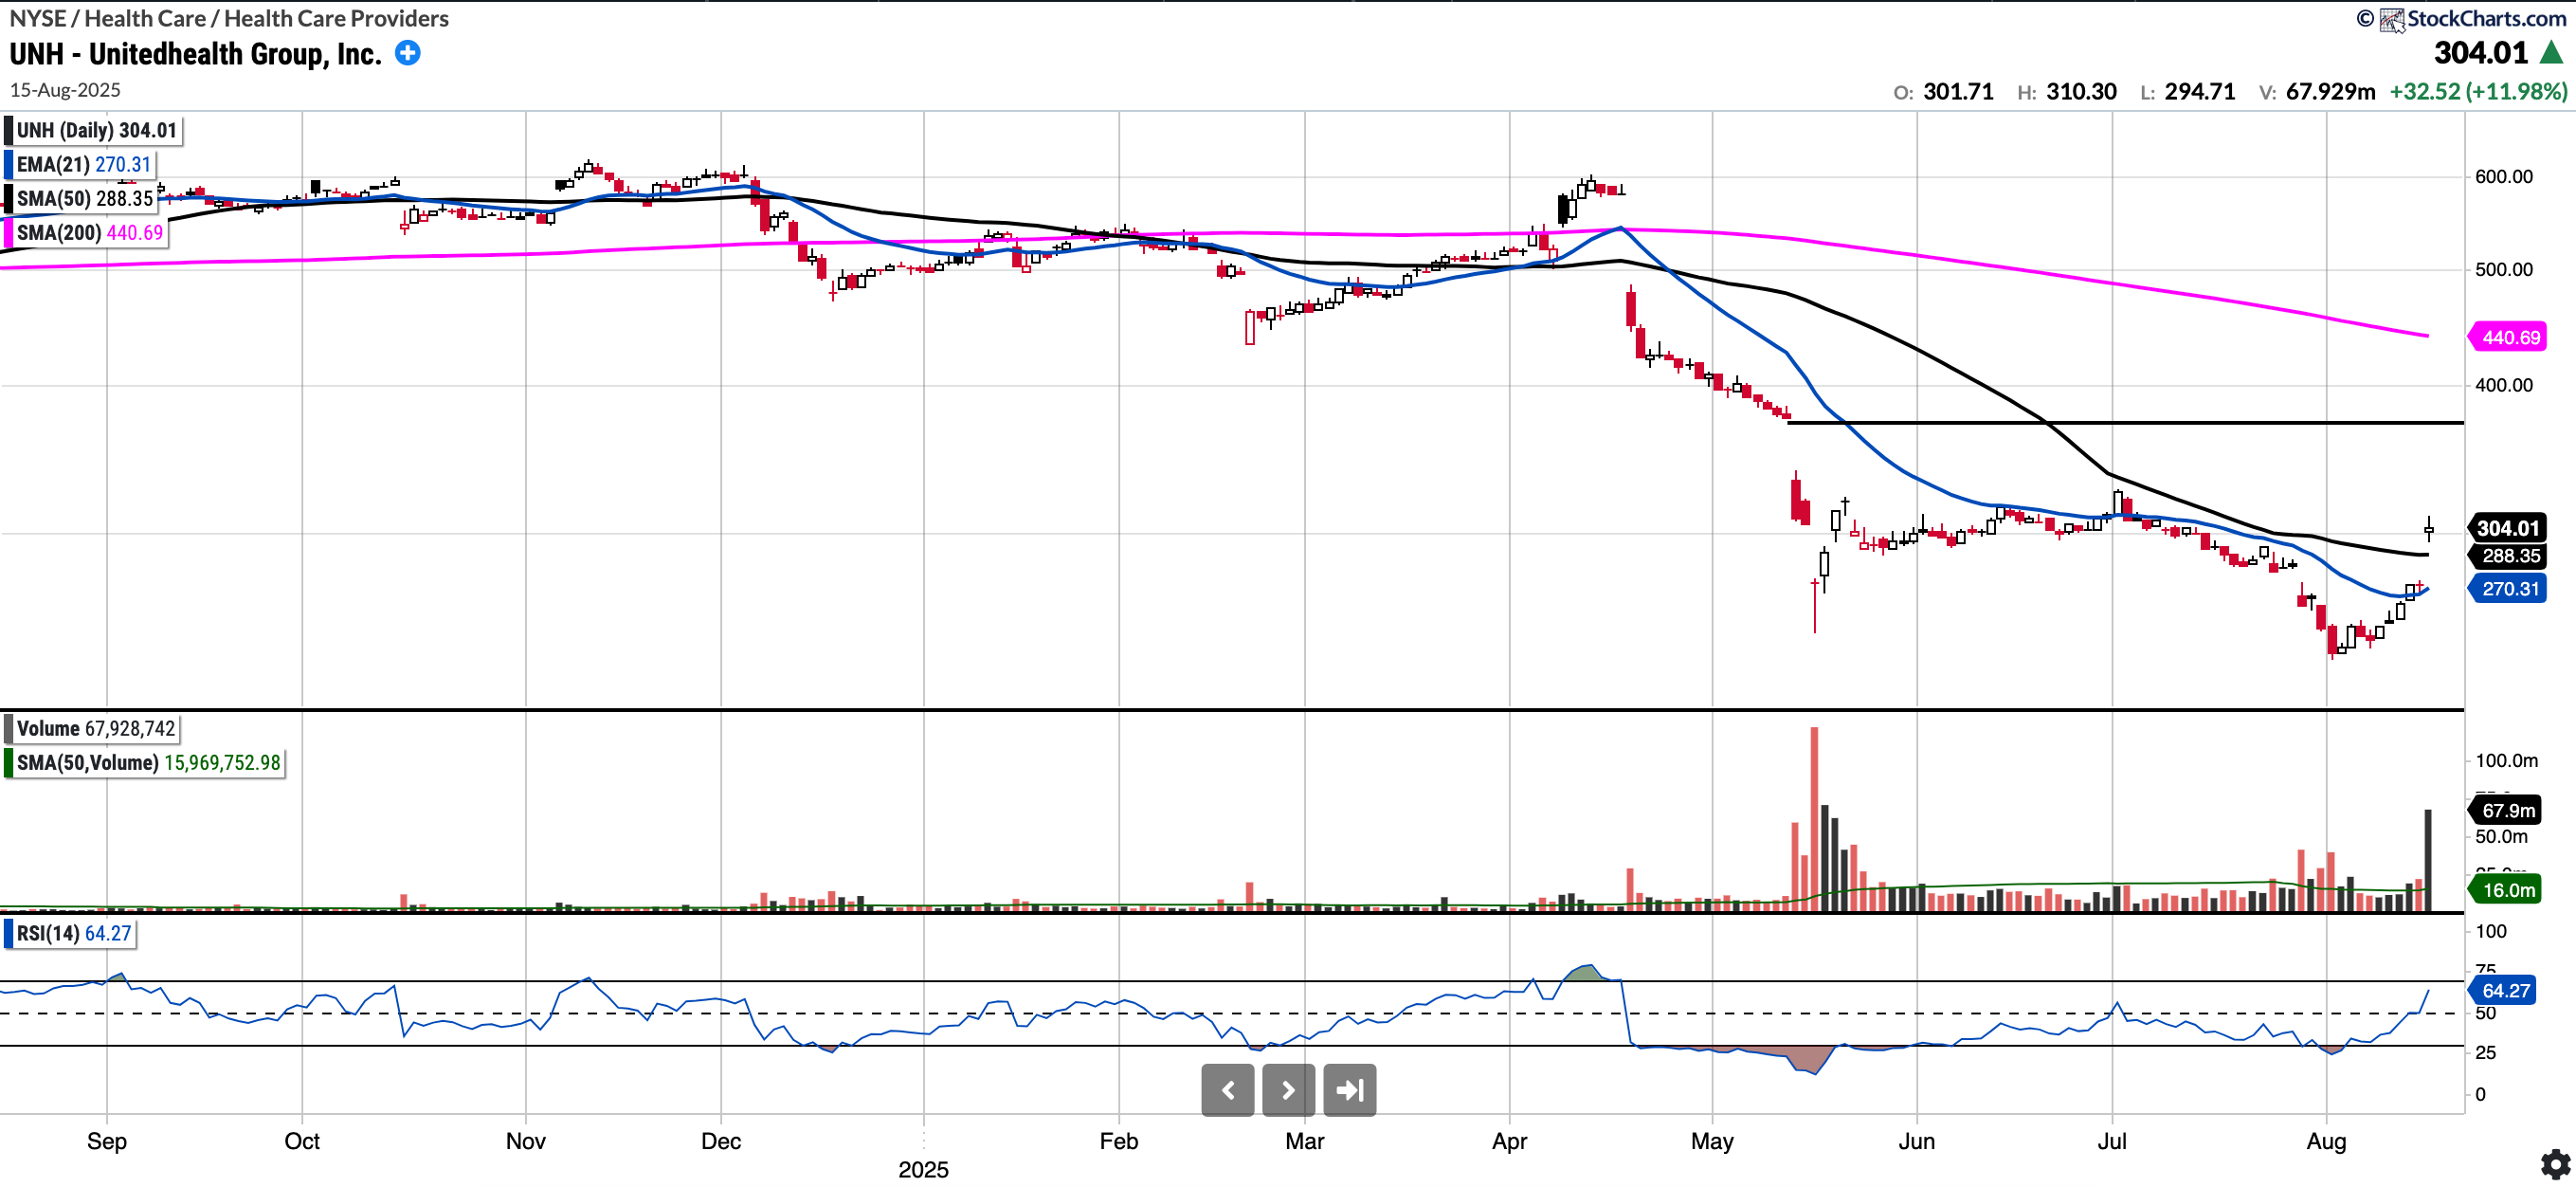
UNH (Currently Long)
Currently trades at $304.01, RSI 64.27 and 5.43% above 50 but -31% below the 200SMA.
-39.74% YTD
UNH had an interesting couple of weeks with post earnings crash, a new CEO and then reaching a low of 234.6. We initiated a position with an average of close to 240.
News broke late this week that Buffett had been buying in Q1 and Q2 and so likely has a much higher average than current levels. Likewise Tepper, Burry and others were buying. This may serve as a signal for some value-oriented firms to feel confident to buy. Notably, huge volume entered the stock on Friday.
Despite this, the chart will need sometime to become more constructive. 320-325 may be near term resistance but filling the gap to 370 from the mid-May gap down is next logical level I feel. Will be an interesting story to follow.
Notable portfolio changes in previous week (all updated live in subscriber chat):
