

I hope you are well. Below, we provide market commentary and an in-depth portfolio update.
Format for what is covered in this Monthly Portfolio Update:
Market Thoughts
Indices Review
Key Indicators
SixSigmaCapital Performance: YTD and since Inception
Featured Quote
Current Portfolio Holdings:
Sizing | Cost Basis | Timeframe | Planned Moves
Closing Thoughts
If it is your first time here, ensure to check out what SixSigmaCapital readers are saying below:

For all readers a reminder that a premium subscription includes:
Live Portfolio updates (All Buys and Sells) in Subscriber only Channels
Favourite set-up Ideas, Market Memos plus Full archive
Monthly in depth portfolio & performance updates
Annual Tier: Discord access for live trading account updates and AMAs.
Upgrade to a premium subscription via the link below:
Market thoughts:
Equity markets had a mixed month in September, with the Dow, S&P 500, and Nasdaq Composite posting month-over-month returns of -4%, -0.2%, and +2%, respectively.
Despite this broader volatility, it was a productive month for the Six Sigma Capital portfolio, resulting in a 5% portfolio appreciation. This performance was driven by capitalising on the strength of Meta, alongside upward momentum in the likes of SK Hynix, Twist Bioscience and Amkor. As these holdings reached overbought levels and extended valuations, positions were trimmed into strength to secure profits and manage the overall cost basis. Opportunistic trades also added value, such as purchasing Credo Technologies during its post-earnings pullback in the low 150’s. The cost basis was removed at $205 per share before fully exiting near the $230 target.
The image below succinctly shows what else moved equity markets in September:
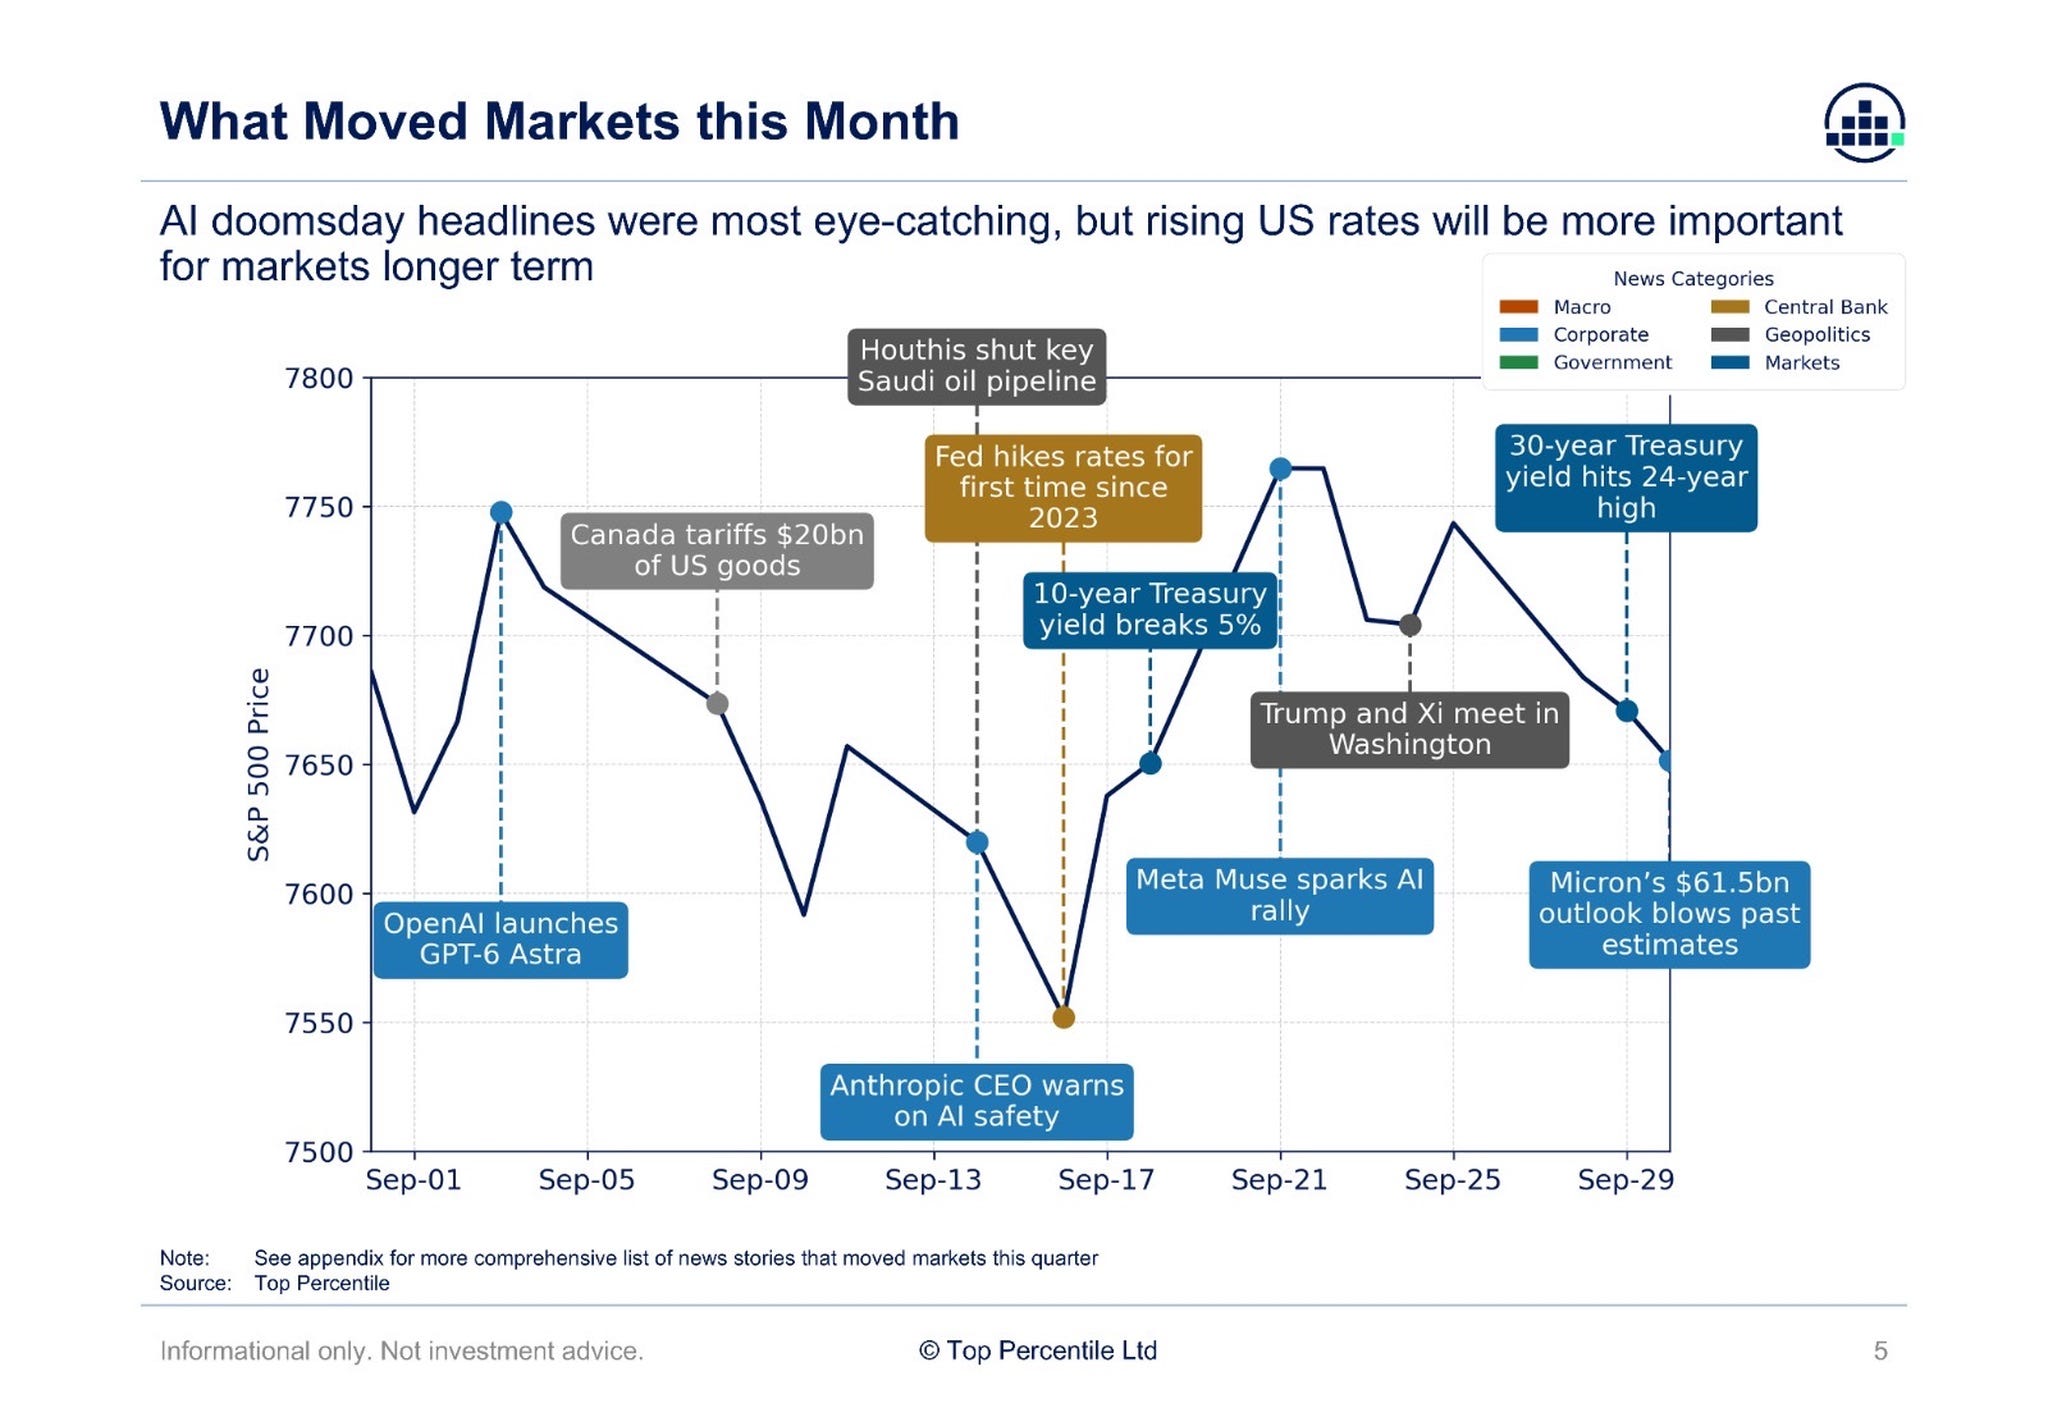
YTD Market Recap: March through August
Before looking ahead to the fourth quarter, it is helpful to frame the recent price action within the context of the year so far.
After climbing a wall of worry for most of the past year, broader indices fractured in March: the S&P 500 pulled back over 9% peak-to-trough, and the Nasdaq dropped 13%. A historic rebound followed from late-March lows through May, with the S&P 500 gaining over 15% (1,300+ points) and the Nasdaq surging more than 30% (6,300+ points). Semis and the broader tech supply chain led the move, the SOXX ETF peaked in mid-June at >110% above its March lows, pushing the sector to record overbought territory.
June and July were defined by significant rotation. Following a brutal June, the Mag 7 rebounded sharply in July while overbought AI infrastructure and semiconductor trades cooled off. Meanwhile, hyperscalers, energy, and financials demonstrated broad-based strength.
We capitalised on the hyperscaler rally to trim exposure:
GOOGL & AMZN: Cleared out higher-cost lots to let house shares ride.
MSFT: Locked in profits in the high $400s to low $500s after heavily averaging up during the sell-off.
AI Plays: Used the Leopold AI dip to scoop up beaten-down names, flipping several for quick gains.
August:
A robust month for equity markets and the SSC portfolio. Key highlights included Twist Biosciences (TWST) hitting 6-bagger status since our initial live entry, software strength lifting MSFT and NOW, selling into an early-month AI infrastructure bounce, and a strong month-end rally across crypto.
The charts below illustrate sector performance over the last three months and year-to-date (YTD), respectively:
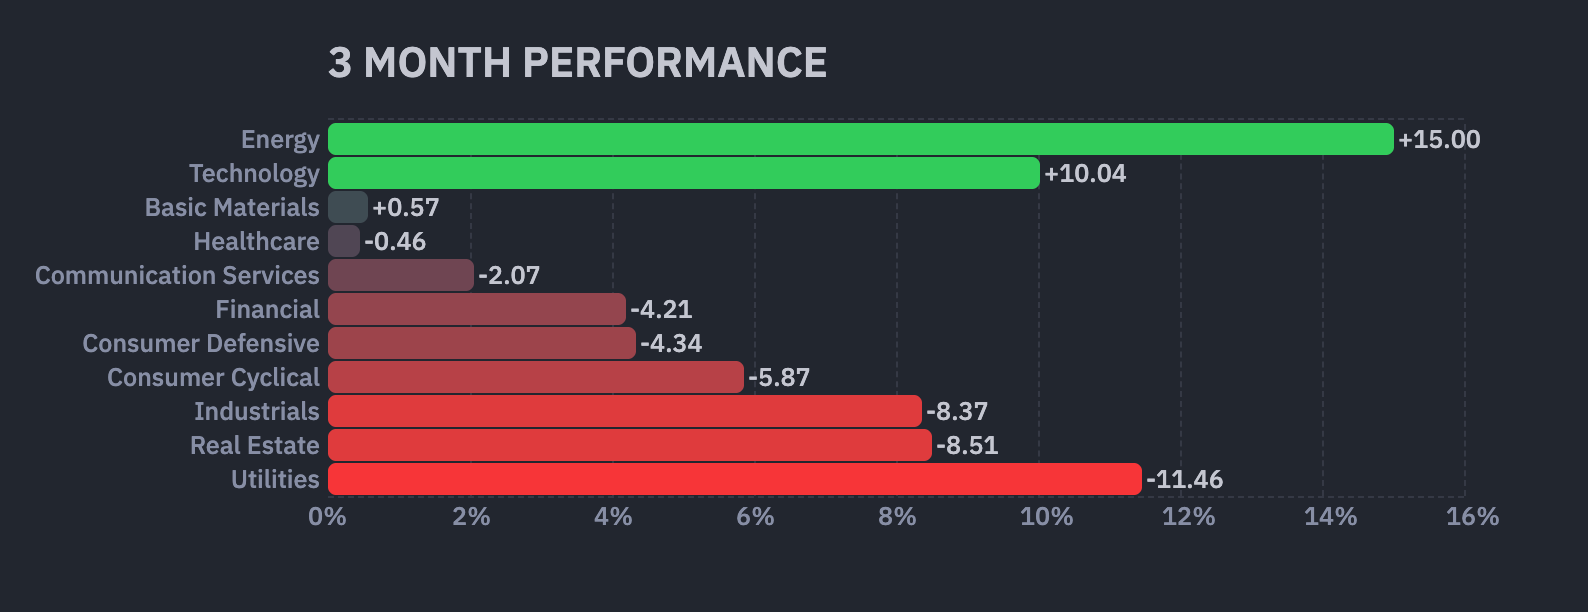
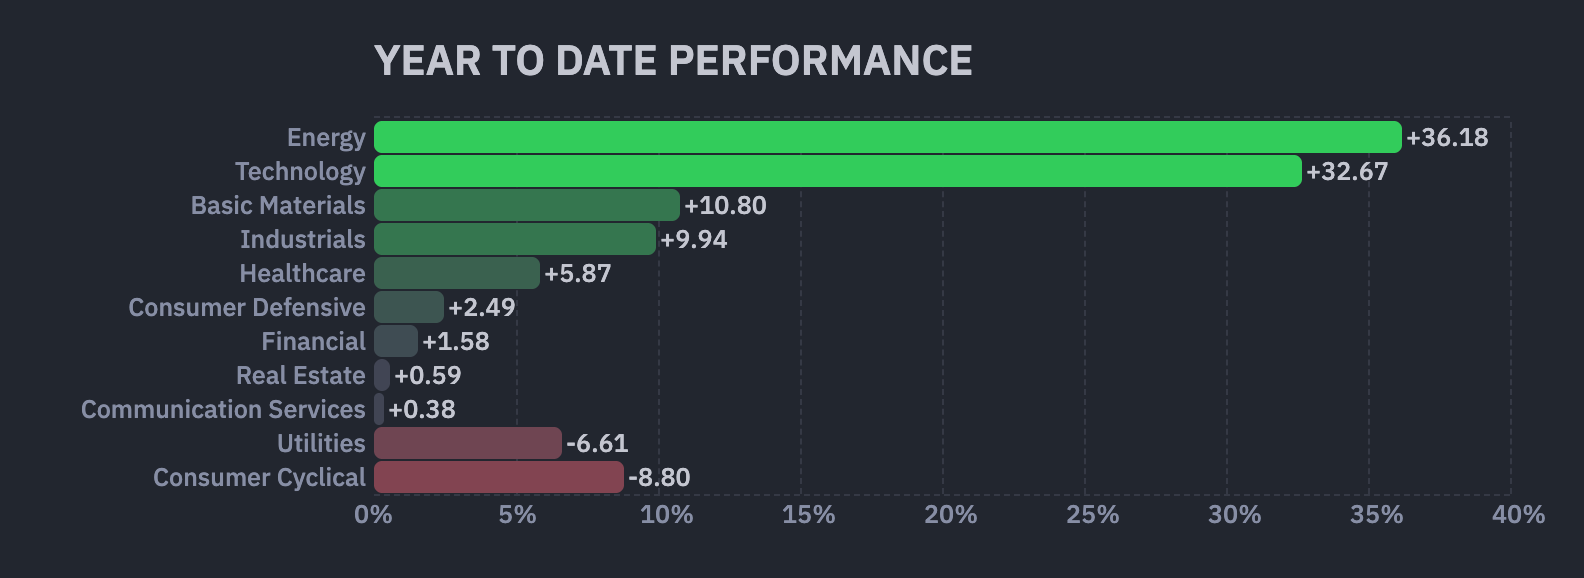
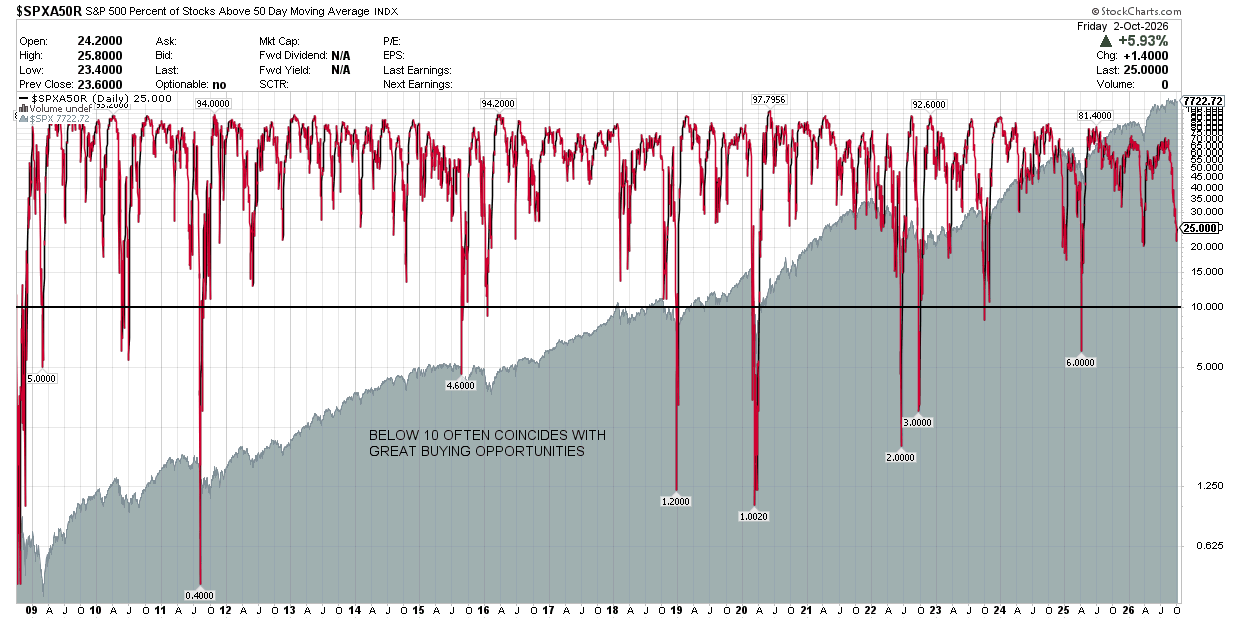
Looking ahead, the market appears to anticipate a period of heightened volatility leading into the midterm elections. Market breadth has narrowed significantly, with the percentage of stocks trading above their 50-day moving average recently dropping to 21%, a level approaching the lows observed this past April. This trend suggests a shift toward a risk-off environment as many investors look to consolidate capital into a select group of equities they believe can weather the remainder of the year.
This narrowing breadth is compounded by challenging macroeconomic factors. Interest rates have continued a steep climb, driving a sharp sell-off in the bond market, while crude oil prices have steadily risen. Given that the major indices are trading at all-time highs despite this backdrop, one interpretation of the current environment is that the market is entering a bull trap preceding a significant sell-off. Conversely, this ongoing resilience may signal that if macroeconomic conditions improve even slightly - whether through declining interest rates, a stabilising bond market, or cooling crude oil prices - the market could experience a powerful rally into the year-end.
While the near-term macroeconomic outcome remains uncertain, the portfolio remains positioned long with a decent cash position. This balanced approach ensures we stay nimble and opportunistic as market conditions remain volatile. Furthermore, recent price action leaves me with a constructive outlook into year-end.
Inflation:
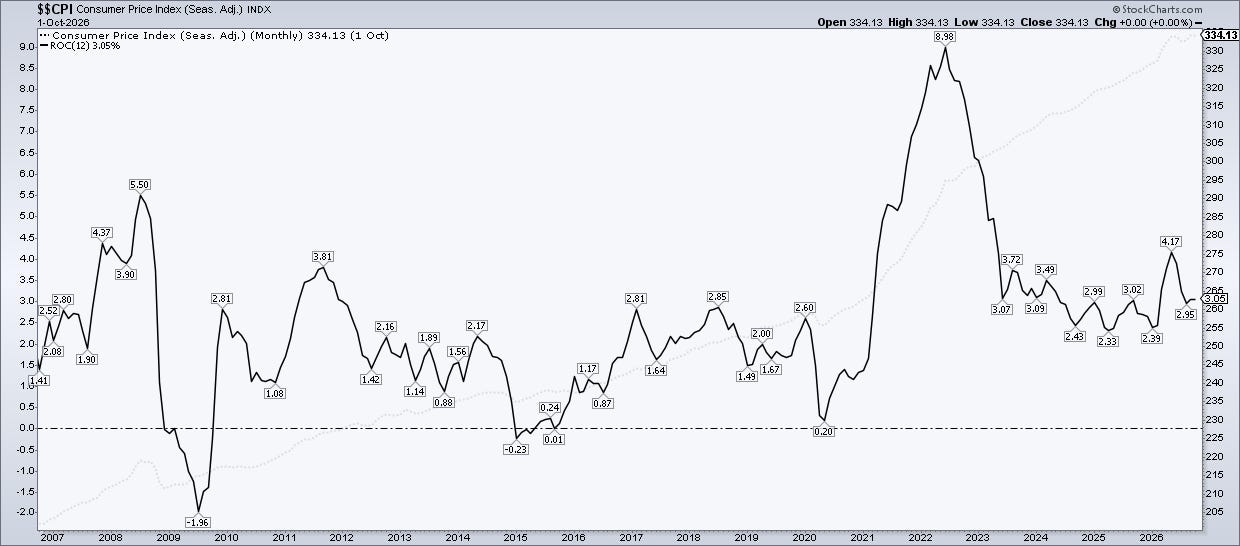
CPI: The August 2026 CPI data is presented below:
Headline CPI increased 3.4% YOY vs expectations of 3.4% YOY.
Headline CPI increased 0.4% MOM vs expectations of a 0.4% increase MOM
Core CPI increased 2.4% YOY vs expectations of 2.4% YOY.
Core CPI increased 0.3% MOM vs expectations of a 0.2% MOM
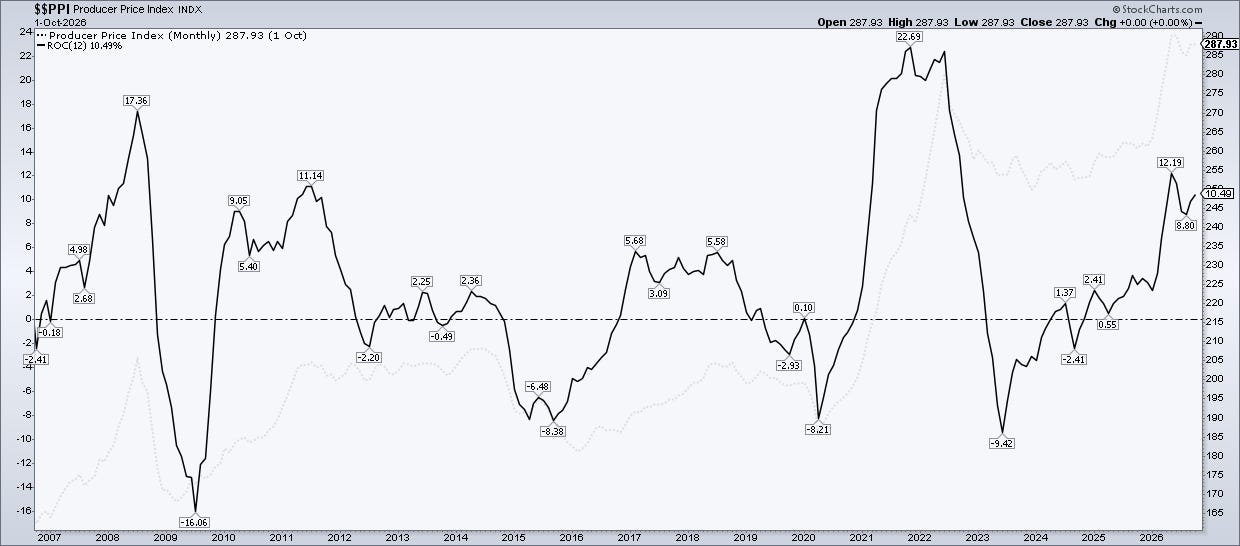
PPI: The August 2026 PPI (final demand) data is presented below:
Headline PPI increased 5.4% Y/Y vs expectations of 5.3% Y/Y
Headline PPI increased 0.4% M/M (in line with expectations)
Core PPI increased 4.6% Y/Y (in line with expectations)
Core PPI increased 0.2% MOM vs expectations of 0.3% M/M
Below I have included charts showing the trend for both CPI and PPI:
PCE: With regards to the PCE price (Fed’s preferred metric), August ‘26 data came in cooler than expected on both the headline and core.
Headline PCE increased 3.4% YOY vs expectations of 3.7% YOY.
Headline PCE increased 0.3% MOM vs expectations of 0.4% MOM.
Core PCE increased 3.0% YOY vs expectations of 3.3% YOY.
Core PCE increased 0.2% MOM vs expectations of 0.3% MOM.
For context, much of the surprise comes from the BEA’s September 30 methodology changes (investment advice, legal services and software prices, applied back to 2021), which also revised July’s core PCE down to 3.0% from 3.3%. Core PCE is still a full point above the Fed’s 2% target. The September CPI (October 14) is the last major inflation print before the October 28 FOMC, and the next PCE reading (October 29) lands the day after.
September 2026 FOMC Meeting
At the most recent FOMC meeting on September 15-16, 2026, the committee decided to raise interest rates by 25 basis points as persistent inflation outweighed continued economic expansion. The target range for the federal funds rate now sits at 3.75% to 4.00%, up from 3.50% to 3.75%. It is the committee’s first rate hike since July 2023.
Unlike the divided 9-3 vote in July, this decision was unanimous at 12-0, with Beth M. Hammack, Neel Kashkari, and Lorie K. Logan, who dissented in favour of a hike in July, voting alongside the majority in Kevin Warsh’s third meeting as Fed Chair. In his press conference, Chair Warsh said three things had changed since July: the economy had strengthened, inflation had not slowed, and geopolitical tensions had intensified. He said inflation has now run above target for more than five years and that this summer’s readings did not show underlying trends improving meaningfully. Asked how rate hikes address energy-driven price pressures, Warsh said the Fed cannot affect individual prices like oil or groceries, but will ensure that changes in relative prices do not broaden out into wider inflation.
The Committee reaffirmed its firm stance once more, stating: “The Committee will deliver price stability”. The statement described economic activity as “expanding at a solid pace,” with resilient domestic spending despite elevated geopolitical uncertainty, and said job gains “have kept pace with the workforce”. It also noted that “Inflation remains elevated,” adding that the rate hike “will support a timelier return to the Committee’s 2 percent goal”.
Unlike July, this was a quarterly meeting with an updated Summary of Economic Projections (SEP). The median dot now shows the federal funds rate at 4.1% at the end of 2026, up from 3.8% in June, which implies one more 25-basis-point hike this year to a range of 4.00% to 4.25%, with 16 of 18 participants expecting at least one more increase. The median rises to 4.1% for the end of 2027 (3.6% in June) and 3.9% for 2028 (3.4%), and the longer-run rate was lifted to 3.2% from 3.1%. The committee also raised its 2026 inflation forecasts, with PCE inflation at 3.7% (3.6% in June) and core PCE at 3.4% (3.3%), while real GDP growth was lifted to 2.3% (2.2%) and the unemployment rate lowered to 4.1% (4.3%). These inflation projections pre-date the BEA’s September 30 methodology changes, which lowered recent core PCE readings.
Since the meeting, markets have swung back toward a pause. Cooler August PCE data and a weak September jobs report (payrolls up 29,000 against 84,000 expected, with the unemployment rate rising to 4.2%) have cut the odds of a hike at the next scheduled decision on October 27-28, 2026 to around 22% per CME FedWatch (as of October 4), although a December hike is still priced at roughly 85%. The 10-year Treasury yield reached its highest level since 2002 this week before falling to around 5.2% after the jobs report.
Indices:
S&P 500
Currently trades at $7,722.72 (12.60% YTD)
It is 0.85% above the 50SMA.
Trading at 23.38 trailing earnings and 19.8x forward earnings
Nasdaq Composite:
Currently trades at $27,190.86 (16.99% YTD)
It is 3.36% above the 50SMA.
Trading at 34.68 trailing earnings and 23.87x forward earnings (per WSJ for the QQQ)
Key Indicators:
10 Year T-Note: 5.28. It has increased by 26.03% YTD
British Pound vs USD: 1.324 and is down 1.68% YTD.
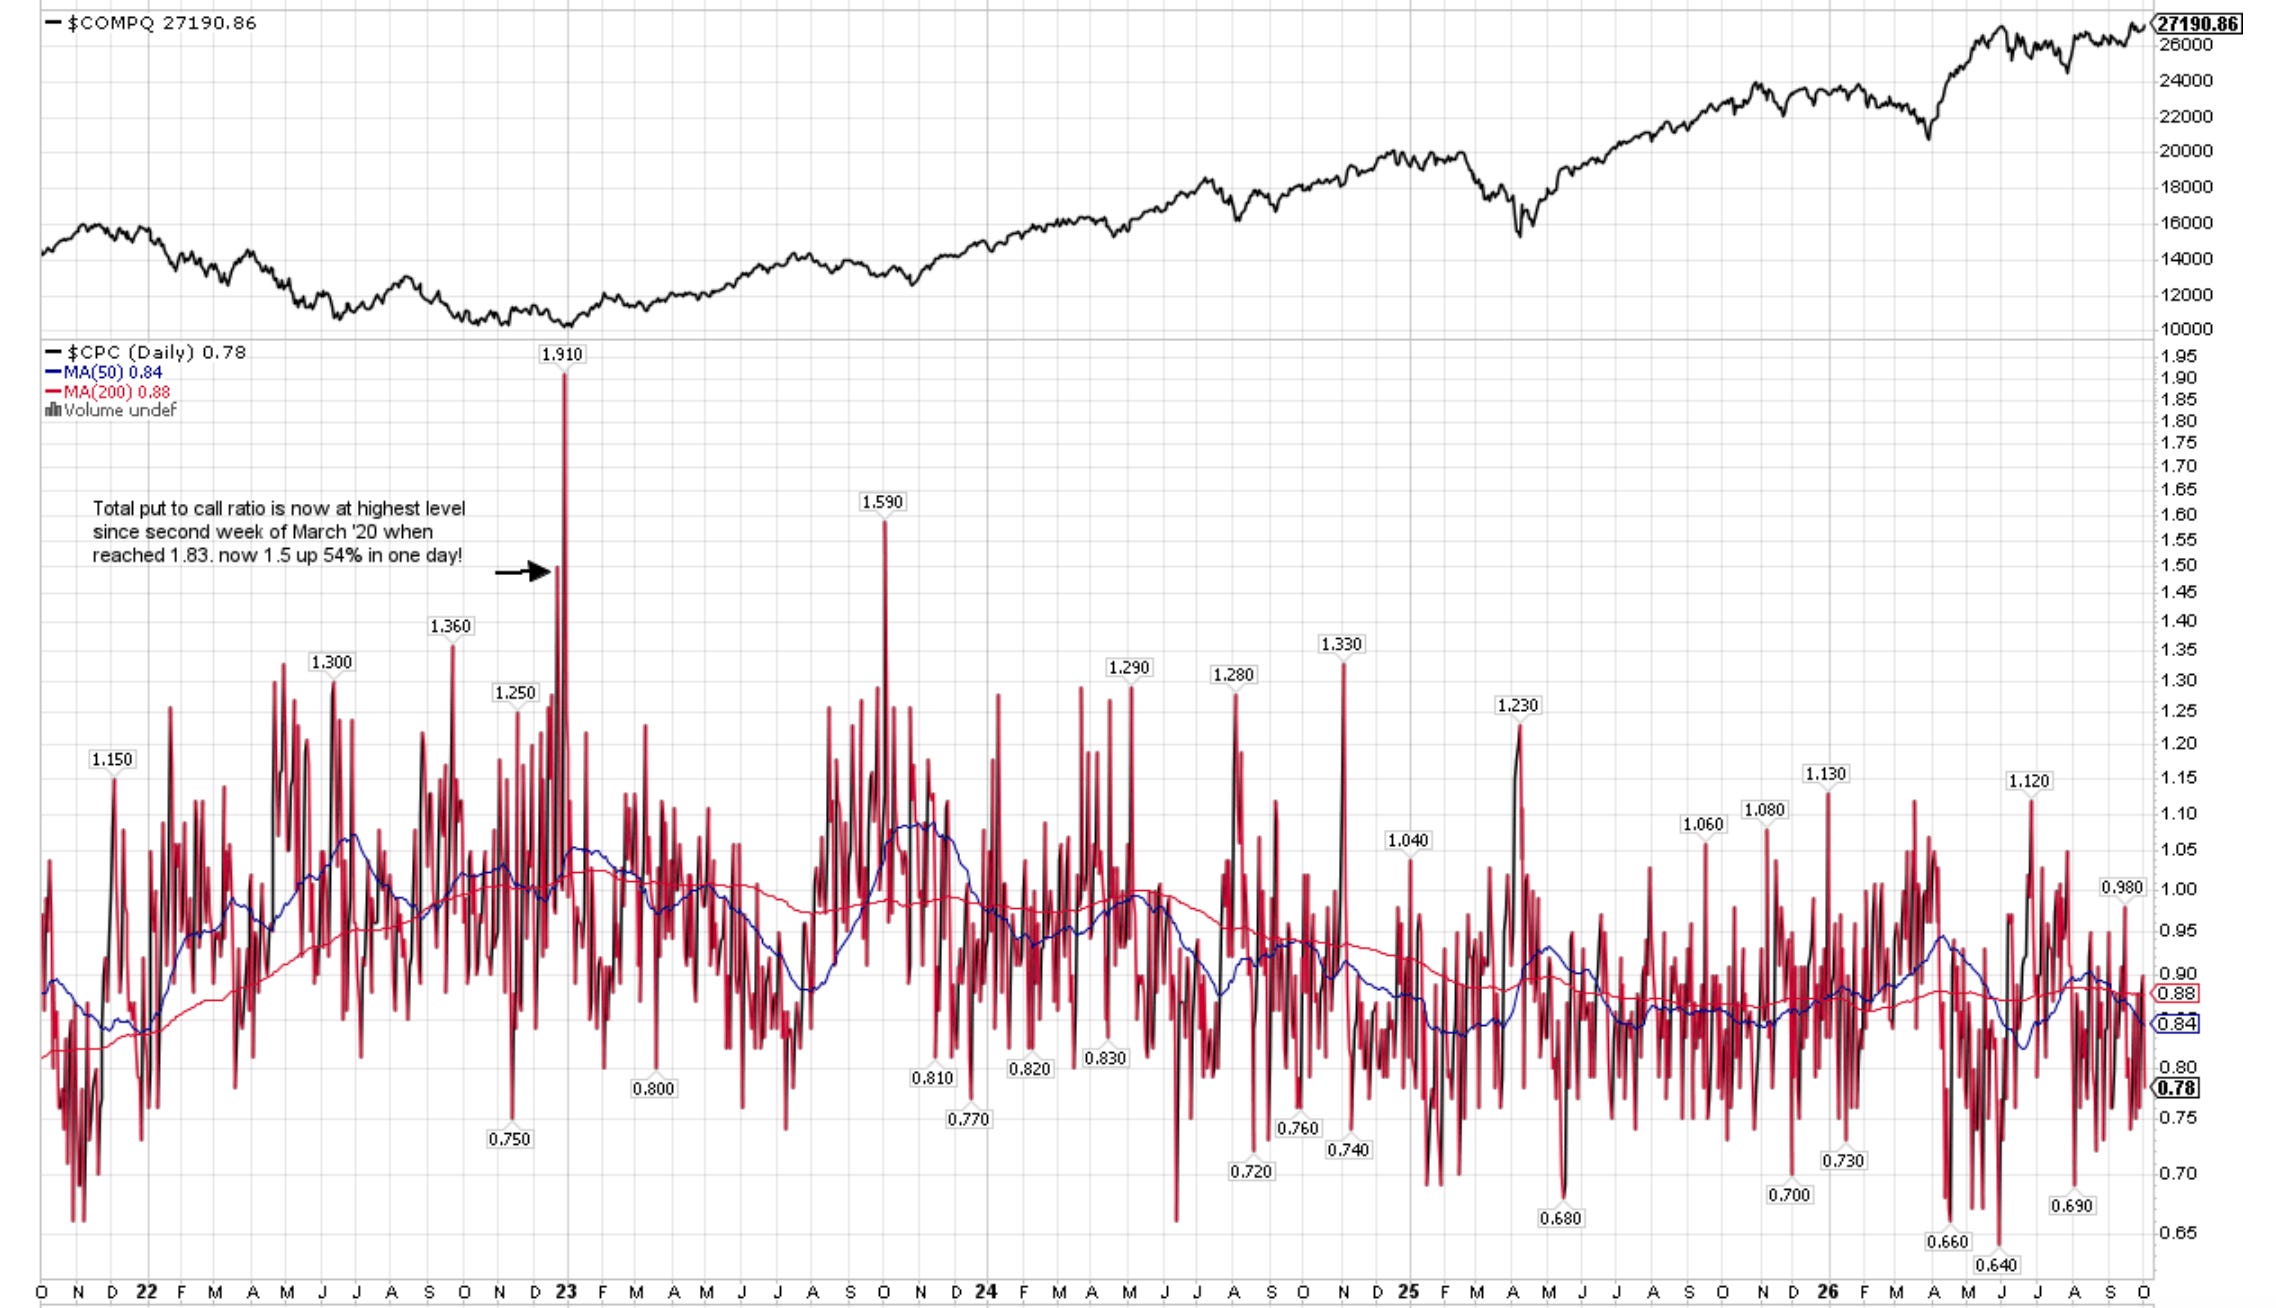
CPC (Put to Call Ratio): 0.78. Note >1 can indicate Fear and >1.5 can be Extreme.
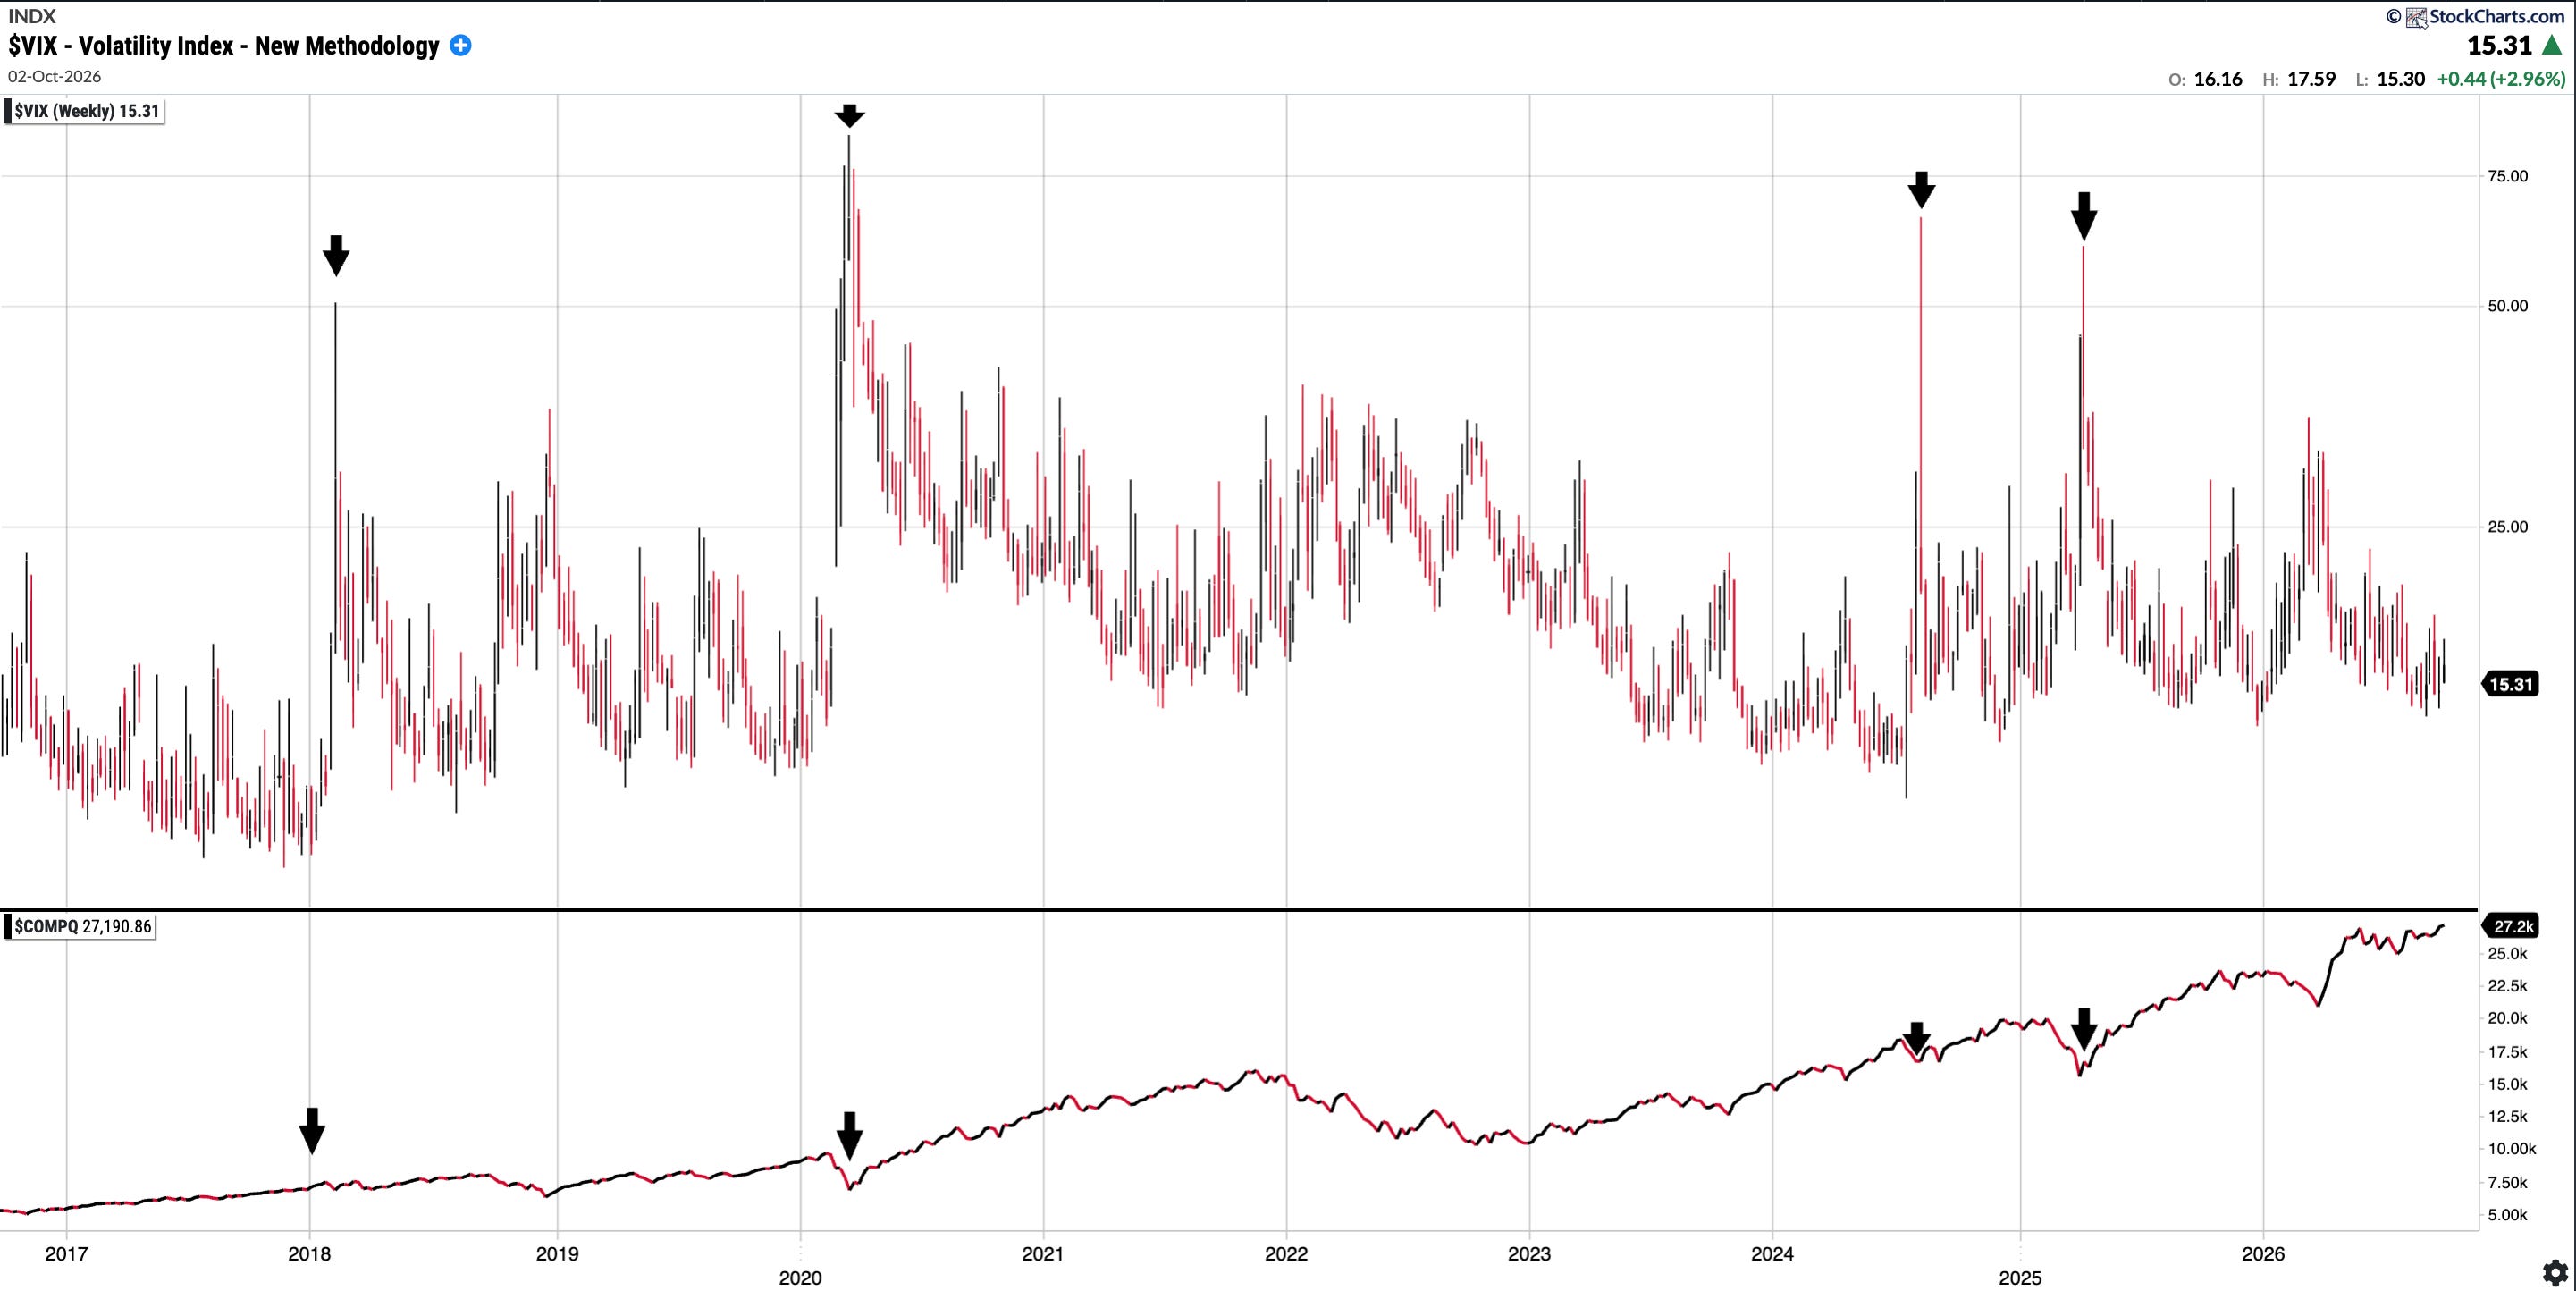
VIX: 15.31. I have included a chart below showing the VIX over time and Nasdaq Comp underneath it: you can see that extreme readings have always been a buying opportunity in the medium term.
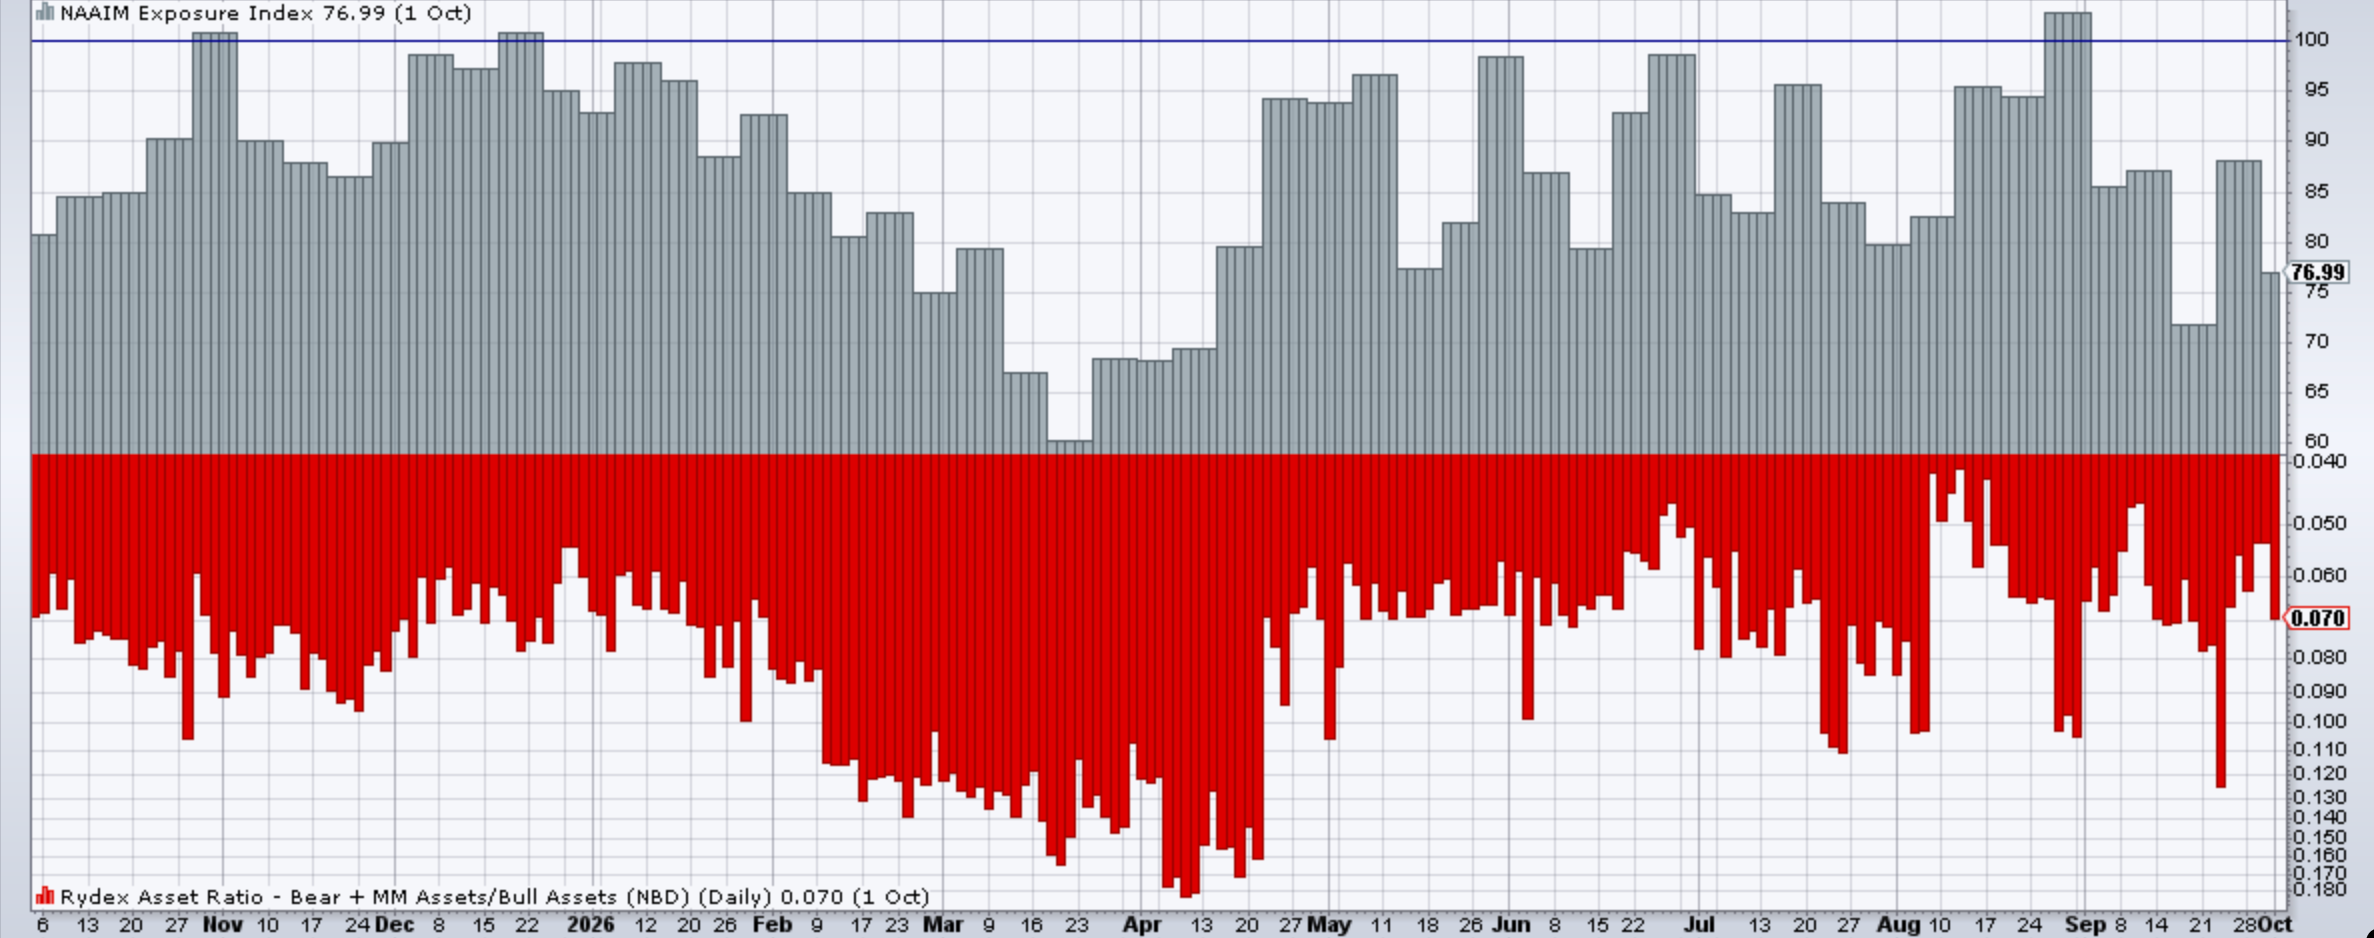
NAAIM Exposure Index: 76.99 from 85.61 last month. Note it did get into the low 30’s in April 2025 (!)
S&P 500 Percentage of Stocks Above the 50 Day Moving Average: 25% (<10 tend to be great buying opportunities)
Fear and Greed Index (CNN): currently reads 31 which is in the ‘Fear’ zone. At the end of March it was 19 supposedly in the ‘Extreme Fear’ zone.
Consolidated Performance across Investment Account: YTD and since Inception of SixSigmaCapital (Equities only as of Sunday 6th September)
2023: +94%
2024: +61%
2025: +57%
2026: +21.72% (with trading account gains included it would be +28.82%)
TWR since Inception of SixSigmaCapital is thus +496.88% or just under a 6x of the portfolio. The CAGR is 60.96%
TWR +496.68% vs S&P 111.82%.
SixSigmaCapital has achieved a +384.86% outperformance in that time period.
I remain pleased overall, as risk adjusted these results are very sound. Furthermore, all moves were disclosed in real time to paid subscribers.
SixSigmaCapital Trading Account:
At the start of the year, I opened a dedicated trading account for active strategies. It was initially ~10% the size of my primary investment account, though has grown somewhat since then (now around 15% the size of the main book).
The past month was again somewhat uneventful for the trading account. I focused on not forcing trades and sizing smaller, given that the volatile conditions were not ideal for swing trading. The account did gain a few percentage points on the month however, mostly through short-term trades and the double-digit appreciation in both DRAM and RKLB. I was certainly cognisant of preserving mental capital to capitalise on opportunities heading into year-end.
Trading Account YTD: +71% YTD (YTD high was +91%)
If combined to the investment account, it would add 7.1% to the total performance.
Featured Quote:
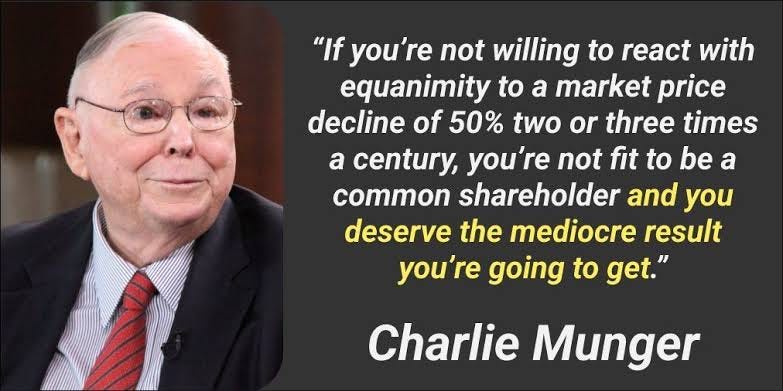
“If you’re not willing to react with equanimity to a market price decline of 50% two or three times a century, you’re not fit to be a common shareholder and you deserve the mediocre result you’re going to get.” Charlie Munger
Current Positions in Size Order with Cost Basis (Investment Account) as of October 5, 2026: