Technical Analysis
Worth paying attention to?
Technical Analysis is a method of evaluating statistical trends in trading activity, typically involving price action and volume. It’s used to identify trading and investment opportunities.
Unlike fundamental analysis, where one attempts to evaluate a security's value based on financial information such as sales and earnings, technical analysis focuses on price and volume to draw conclusions about future price movements. Charles Dow is often credited as the person to first introduce it but has been around for much longer throughout history e.g. we know that Japanese Rice Traders were using Candlesticks in the 18th Century!
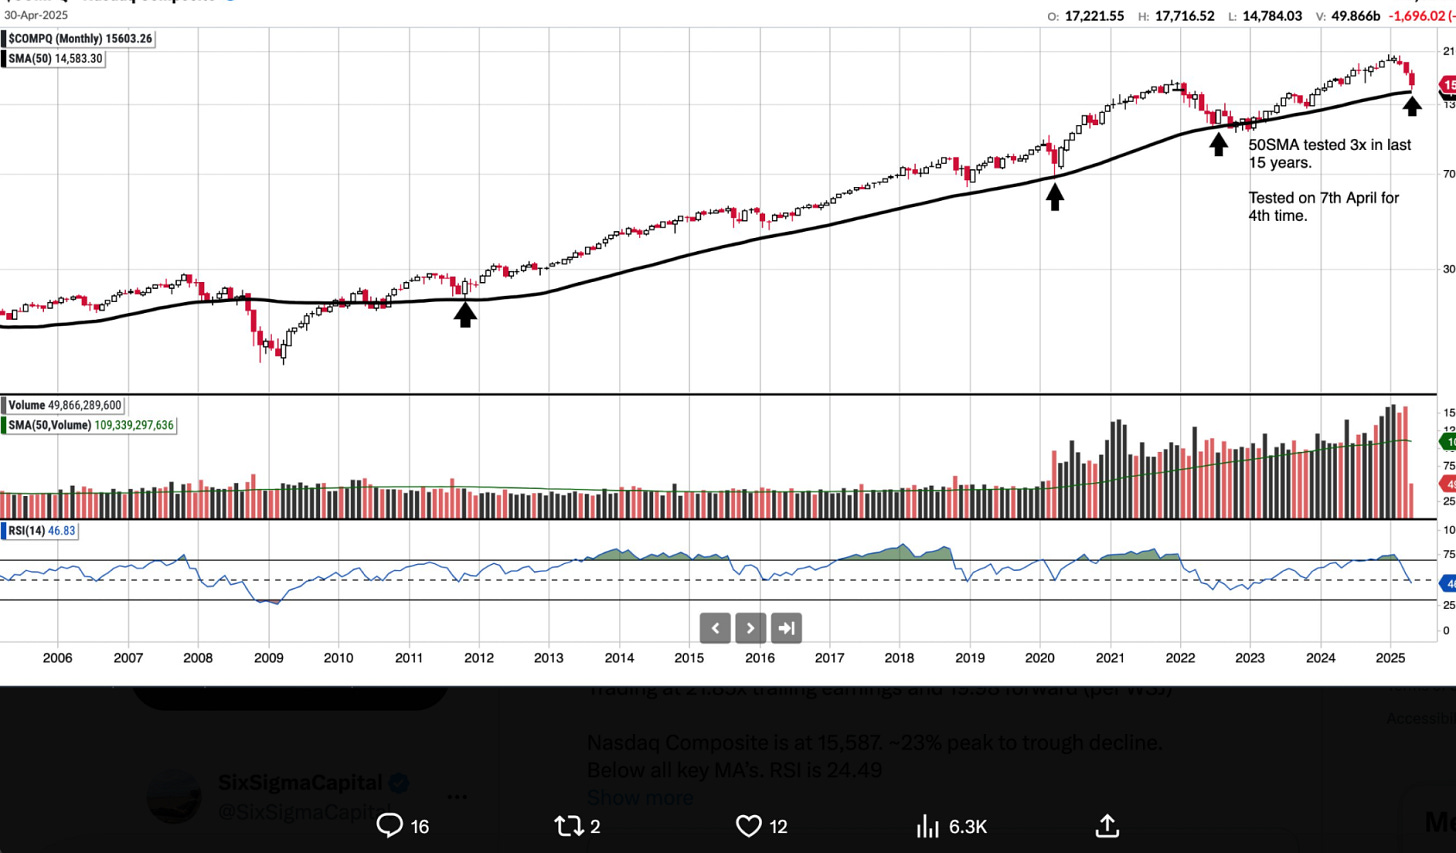
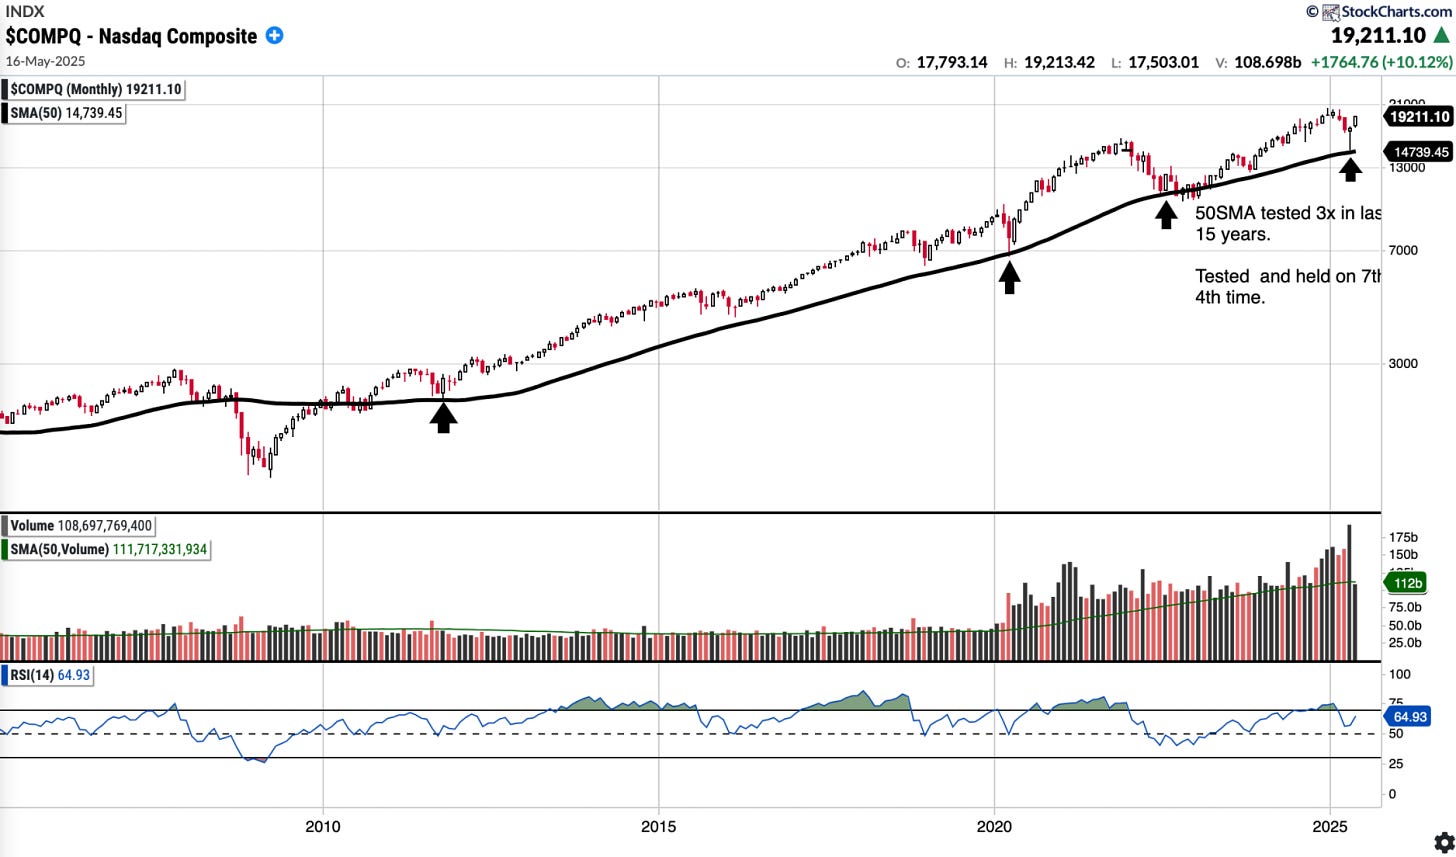
Below are 2 charts of the Nasdaq Monthly but separated by 1 month in time
The 50SMA was tested and held as support as it had done the previous 3 times in the last ~15 years. Nasdaq has rebounded ~5000 points off the bottom in no time.
It certainly seems Big money uses TA so everyone should learn it too.
Thank you for reading. If interested in higher-signal content such as subscriber only posts take a look at the new tiered offering or upgrade to “Founding Member” if interested in Roundtable Discussions, Live Updates and more.


Thank you Sunny. They are very handy
Great info. Looks like monthly charts are great especially during the big drawdowns.