
The Community Watchlist

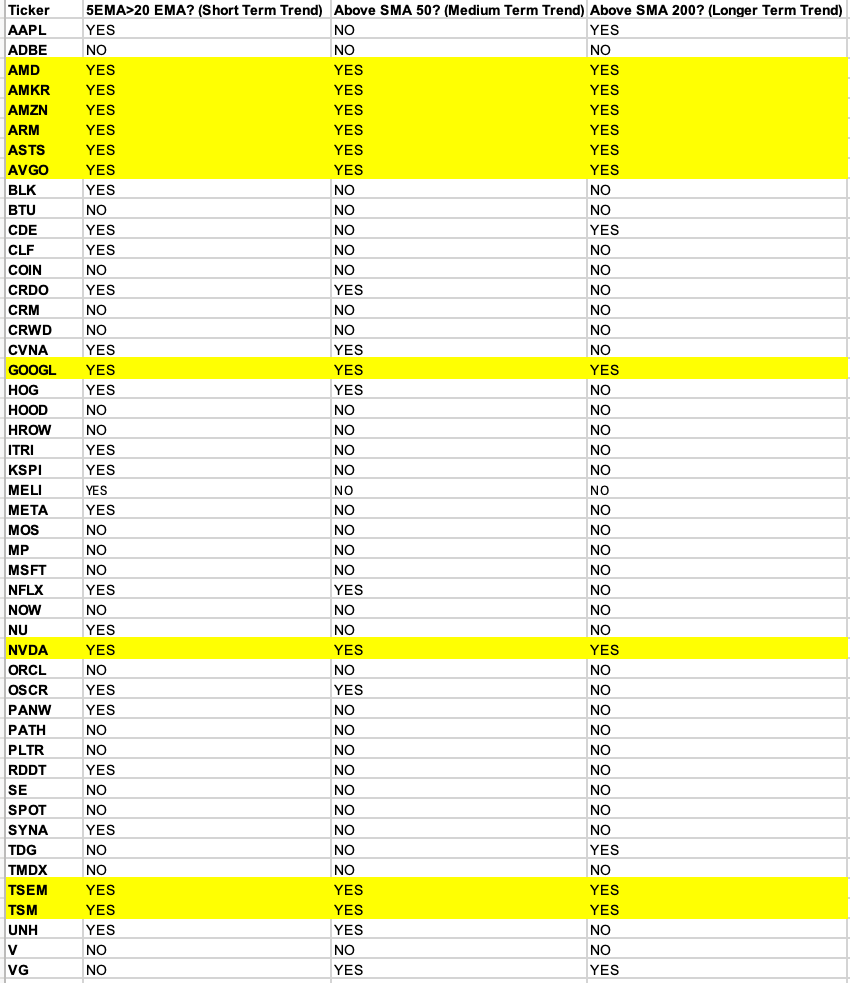
A few weeks ago, I asked you all to share tickers you are interested in for a new spreadsheet. This sheet identifies when the 5 EMA has crossed above the 20 EMA as a proxy for the short-term trend, and whether the stock is trading above the 50-day SMA (medium-term) and 200-day SMA (long-term).
You can find the list below, where yellow boxes represent stocks that meet all three criteria. Note that there are still some limitations, as the current version does not account for the slope of the moving averages.
If a stock meets all three criteria, it is showing significant strength and warrants a spot on the watchlist. However, stocks where the 5 EMA is above the 20 EMA and trading above the 50-day SMA may also be candidates in the early stages of an uptrend.
I will update this periodically. If there are any other names you would like me to include, please comment below and I will consider adding them.
Thank you for reading, and see you for the next one!
Check out
$bw - power generation company due for rerating (trades like slow industrial)
$intt - Thermal testing company for chips...... best in biz when comes to extreme temps
$btdr - bitcoin miner due for rerating as HPC player