
Why Robinhood could be a good short candidate
At the right time

Robinhood (HOOD) is the quintessential bull market stock which many of us have done well on. However, in this piece we will be looking at the strong arguments as to why HOOD could be a short.
Layout:
TL;DR: Main reasons why Robinhood can be a short at the right time
Overview of HOOD
Revenue trend 2021 until present
Closer look at Net Interest Revenues
Closer look at Transaction Based Revenues
Chart and Technicals
Timing the Short and how I plan to short.
My current position
The main reasons why I think Robinhood can be a short at the right time are:
Transaction revenues are increasingly reliant (>50%) on Options speculation and Crypto revenues. They are highly cyclical and of a low quality.
Net Interest is a high margin source of revenue which has become a bigger proportion of Total Revenues and a contributor to the Bottom Line. It is at threat for 2 main reasons:
With significant rate cuts almost guaranteed when Chairman Powell steps down, logically Net interest will come under threat.
Furthermore at present, interest earned on segregated cash, securities and deposits (i.e customers cash) is larger than the Interest on corporate cash and investments. In a Bear Market, customers hold less cash on the platform if past trends play out.
We could be entering peak cycle in coming quarters and HOOD has a >27x sales multiple. For a cyclical company this is a red flag.
Cascade of the above factors: cyclicality, lower rates, less cash on the platform plus a Market correction/Bear Market would be deadly for the stock.
Overview:
Robinhood Markets Inc. is an American Fintech Company well-known for pioneering commission-free trading of stocks, ETFs, options, and cryptocurrencies through its (very) user-friendly mobile app and web platform. The company's Mission Statement is to "democratise finance for all," aiming to make investing more accessible, particularly to younger and first-time investors. It has gained significant popularity since 2020.
A major source of its revenue is from Payment for order flow but also generates significant revenue from Interest Income , Options and increasingly Crypto trading. Despite challenges in the recent past with the Gamestop Episode and their general gamification of Investing, Robinhood continues to be a major player in the retail brokerage landscape, expanding its services to include retirement accounts and other financial products. The product velocity has been nothing short of impressive.
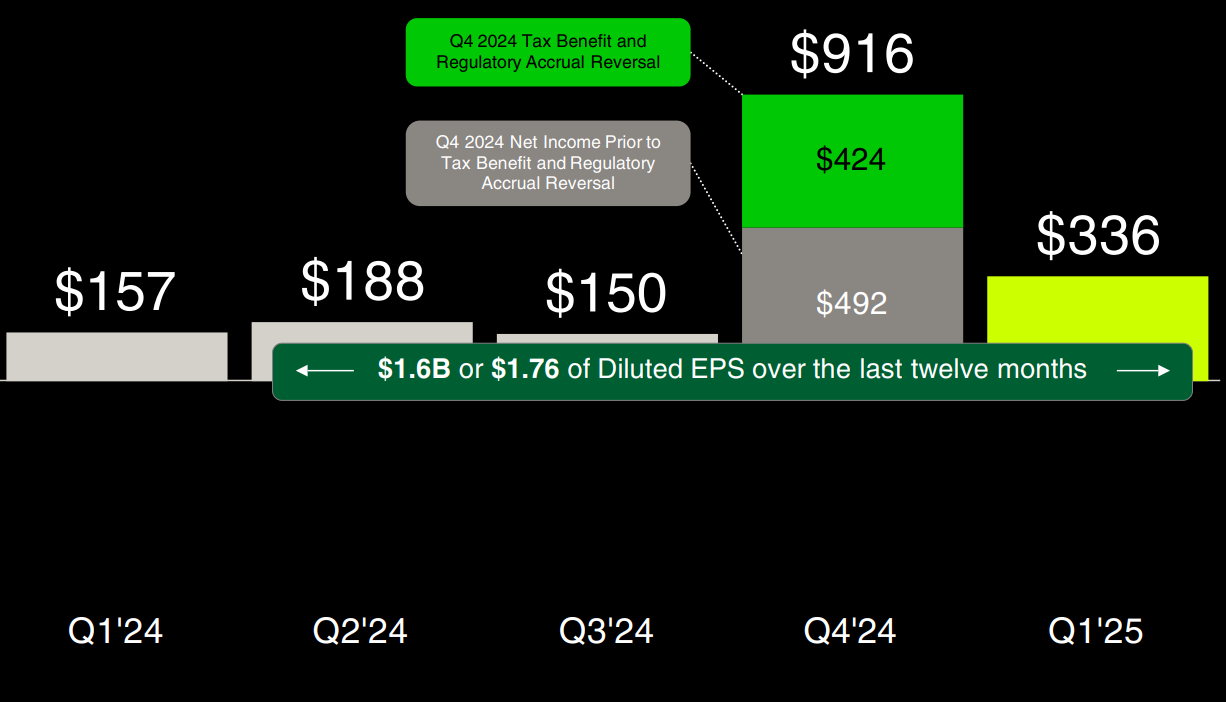
Their most recent quarter was very impressive with Total Net Revenue up 50% YOY, EPS increased >100% YOY from 0.18 to 0.37 and ARPU of $145 up from $104 in Q1 24. Diluted EPS in trailing 12 months is $1.76 but would have been $1.29 excluding the Q4 2024 Tax Benefit and Regulatory Accrual Reversal.
In fact, since Q1 24 they have delivered exceptionally well and have maintained a rule of 40 score of 69 or higher. In Q1 25 it was 111!
With regards to valuation HOOD has a sporting Market Cap of $88B. It currently trades at 27x sales and 57x earnings. Note if not for the 424M Tax Benefit in Q4 24 it would be trading at 77x earnings.
Robinhood Revenue Breakdown
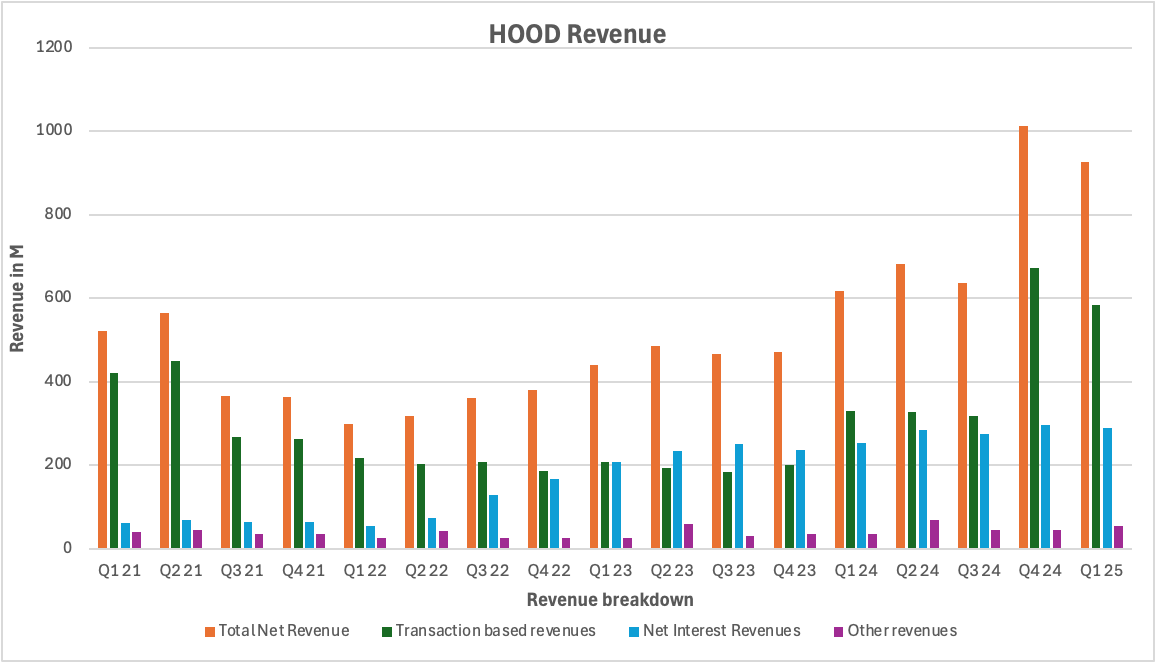
Below is a chart showing Robinhood revenue by category: Transaction-based, Net Interest Revenues and Other Revenues.
Q121 until Q4 22
In 2021 we note Q1 and Q2 have significantly higher revenue than the rest of the quarters in 2021. In fact the Transaction Revenue in Q2 21 alone was greater than Total Net Revenue for every subsequent Quarter until Q2 23. The reason for this is due to how substantial the Crypto and Options revenue were for those quarters which was the peak of the Covid Bubble. We will revisit the relevance of Crypto and Options dominance later in the post.
Q1 22 was the start of the Bear Market for Equities and Total Revenue for each of the quarters in 2022 was 299M, 318M, 361M and 380M respectively.
Transaction Revenue actually declined every Quarter in 2022 (except Q3) with the Revenue readings coming in at 218M, 202M, 208M and 186M. Of interest however, Net Interest Revenue grew every quarter and Hood reported 55M, 74M, 128M and 167M. This makes sense as Rates were increasing during this time period.
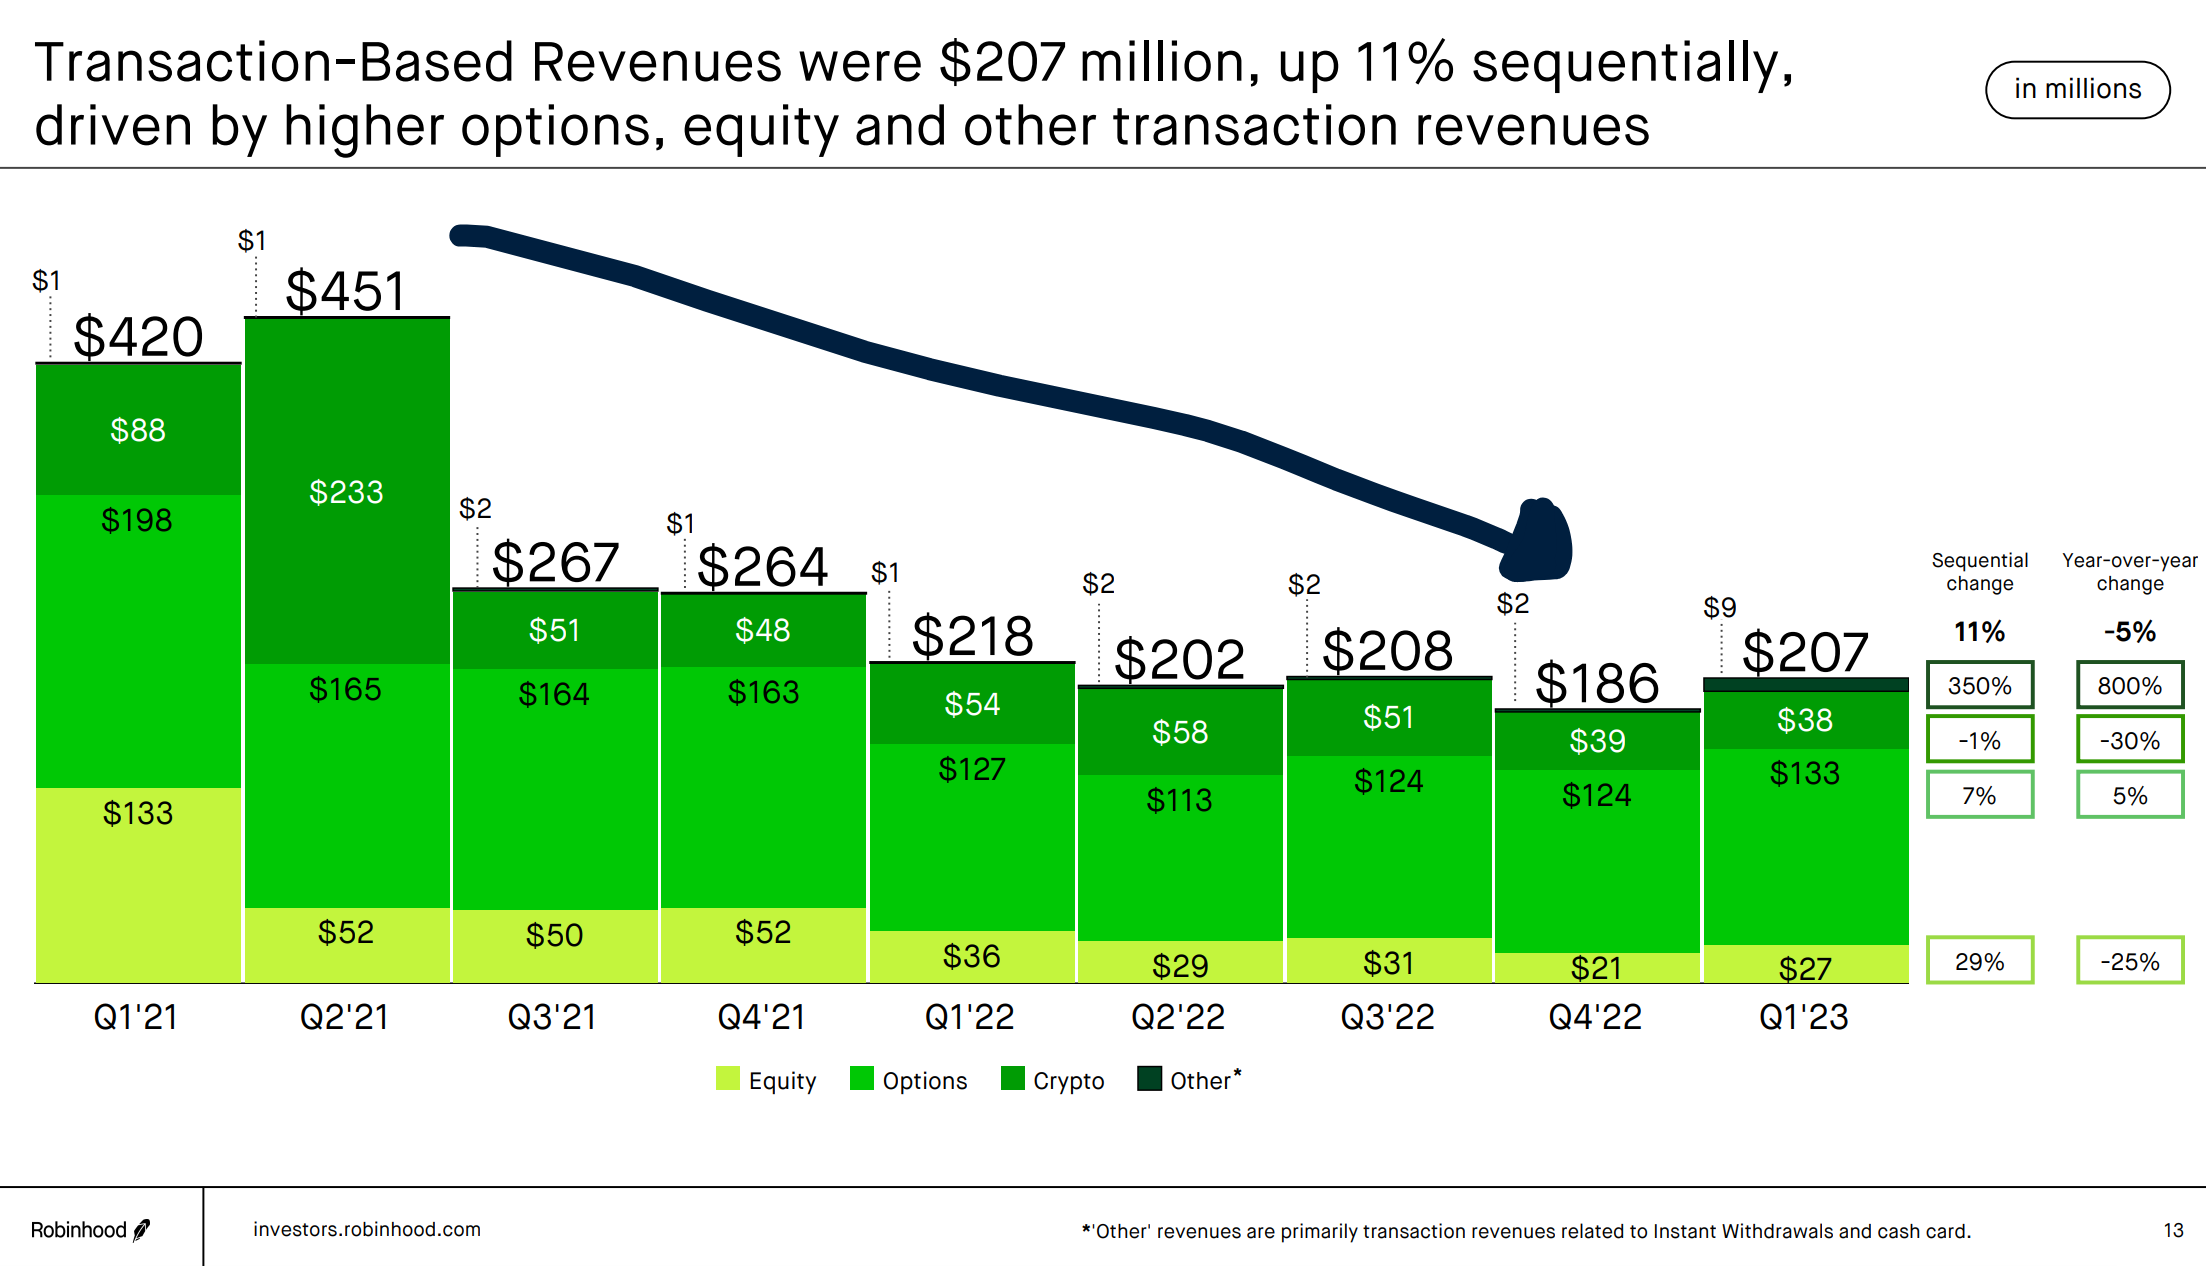
The below chart shows how Transaction-based revenues fell in 5 out of 6 quarters between Q2-21 and Q4 22. Revenue from Options also fell in 5 consecutive quarters. Crypto based revenues peaked at 233M in Q2 21 and fell all the way down to 39M in Q4 22 which was the depths of the Equity and Crypto Bear Market.
Q1 23 until Q1 25
Q1 23 is interesting to look because it was the first quarter in the nascent bull market.
Total Net revenues jumped from 380M in Q4 22 to 441M in Q1 23. The main contributors were higher net interest and transaction revenues. So, by now we should be starting to see a trend whereby in 2022 Net interest became a much bigger contributor to total revenues.
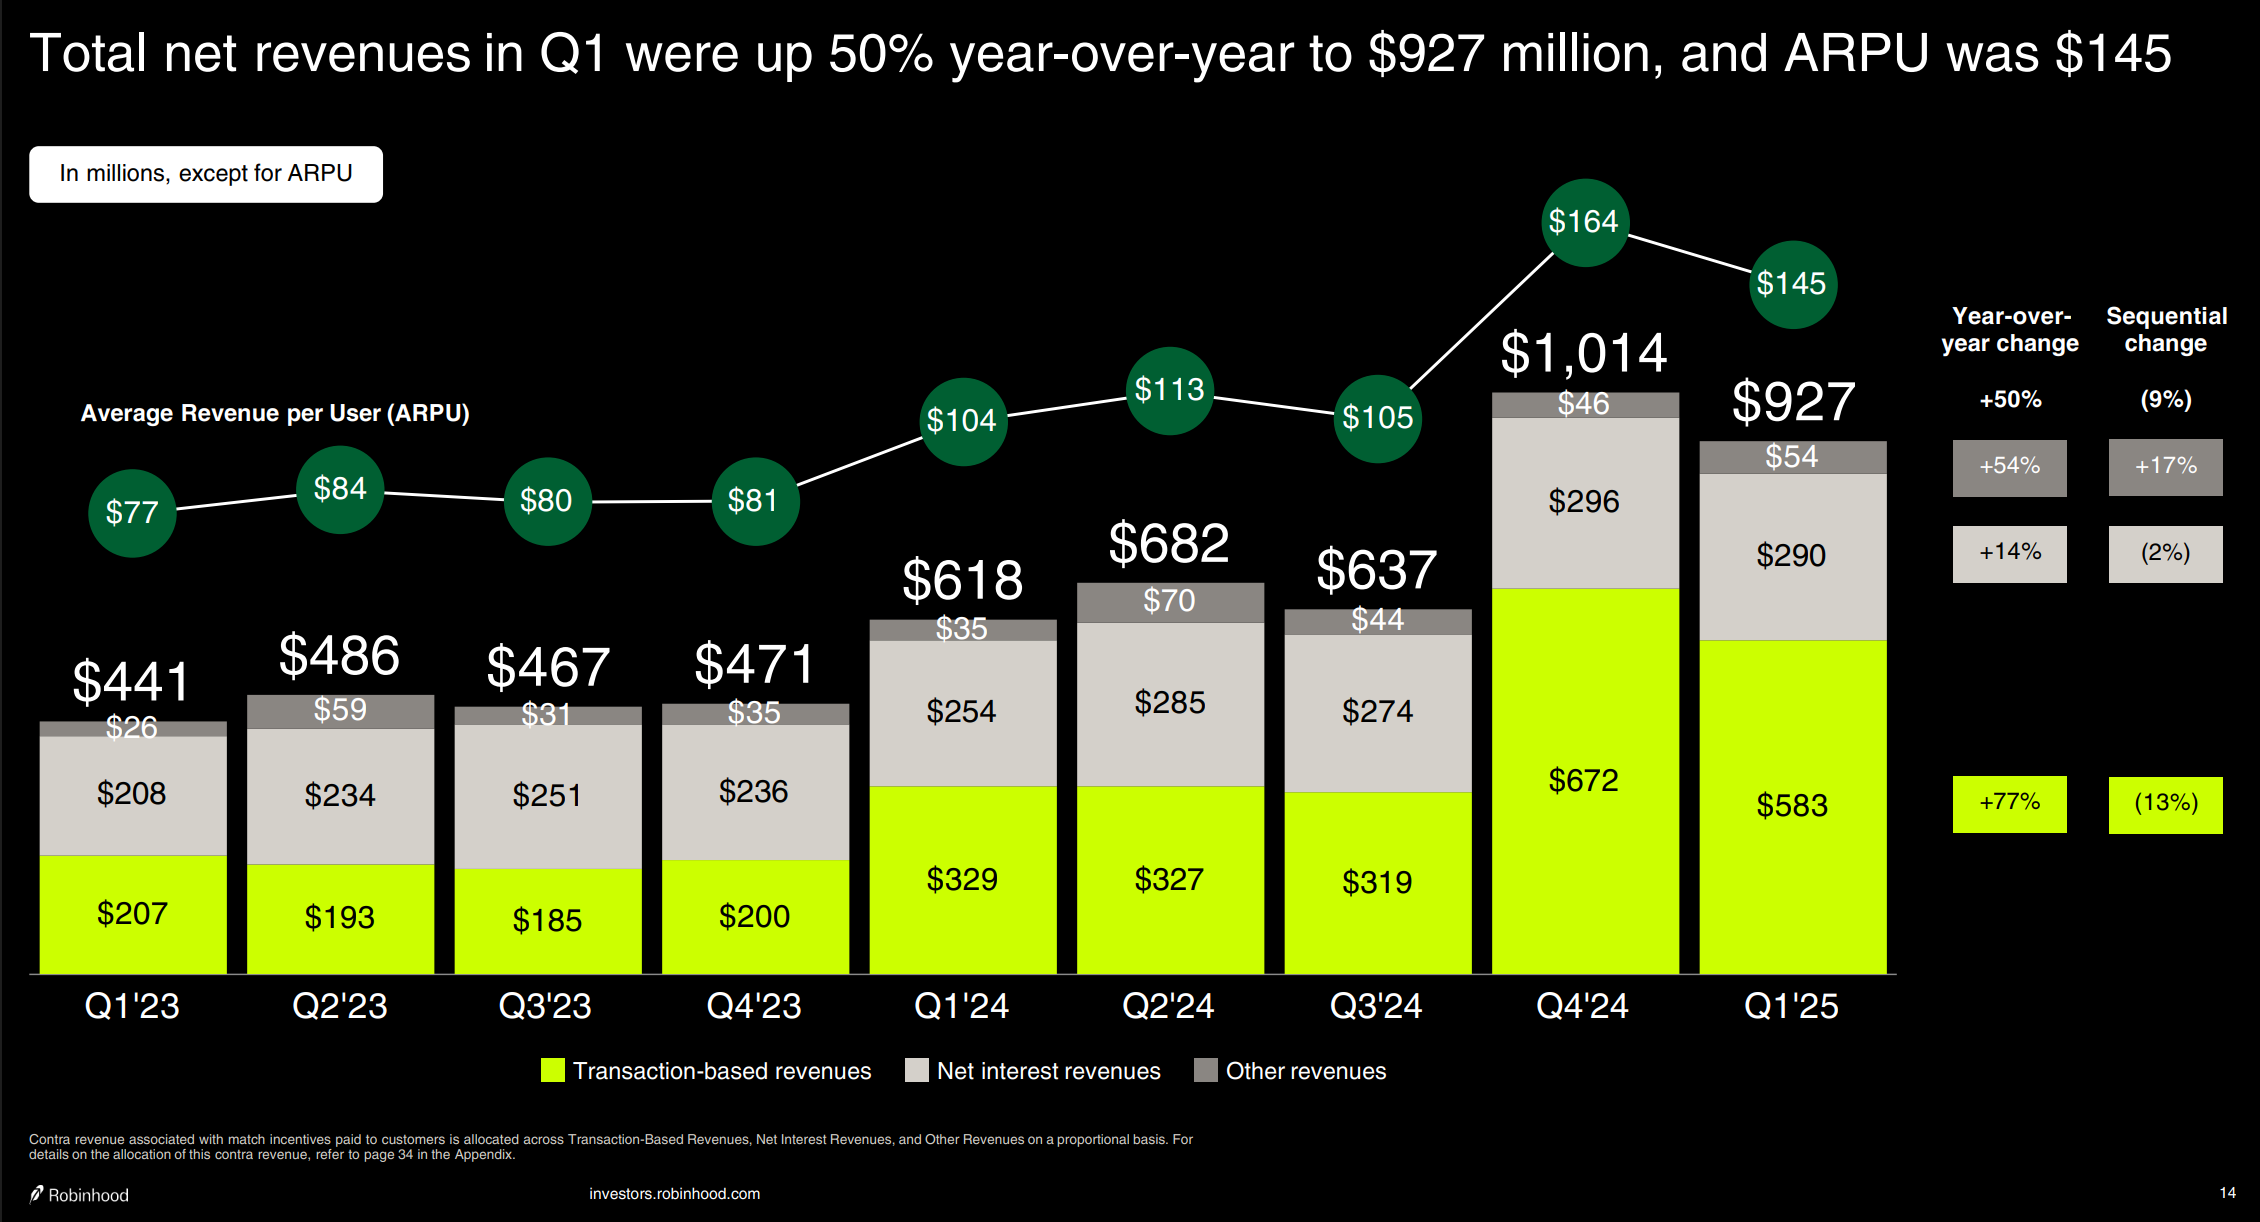
Since Q1 23, total revenues have increased from 441M to 927M in Q1 25. Net Interest Revenues have increased from 208M to 290M over those quarters. Meanwhile, Transaction based revenues have gone from 207M to 583M in Q1 25 and actually were as high as 672M in Q4 24!
The main driver of the dramatic increase in the last couple of quarters has been the rise in Crypto-based revenue and Options-based revenue. This is signal that speculative behaviour is increasing and we know that such behaviour does not last.
A closer look at Net Interest Revenue
Net Interest Revenue accounted for 62M out of total 522M Revenues in Q1 2021 and accounted for 290M out of a total 927M in Q1 2025.. As a % of Total Revenues it has therefore, increased from 11.88% in Q1 2021 to 31.28% in Q1 2025. It actually peaked as high as 53.75% in Q3 2023!
This chart below neatly Net Interest Revenues as a % of Total revenues over Time.
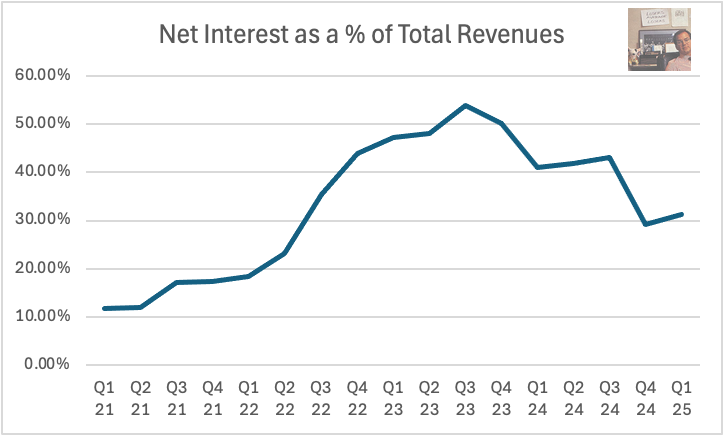
The interesting bit is that the 10Y has gone from ~1% at the start of that period to 4.5% now and the overwhelming likelihood is rates will fall significantly when Chairman Powell is replaced. The logical assumption is therefore Net Interest Revenue will drop accordingly all else being equal.
Furthermore, at present interest earned on segregated cash, securities and deposits (i.e customers cash) is larger than Interest on Interest on corporate cash and investments currently. In a Bear Market, a fair assumption based on previous behaviour is customers will hold less cash on the platform and thus Net interest will get hit by this factor also.
A closer look at Transaction Based Revenue
Below we will look further into the composition of the Transaction-Based revenues because here is where I believe we start to see the ‘frailty’ or low quality revenue which Bears point to. Specifically, Crypto and options dominating Transaction-Based revenue.
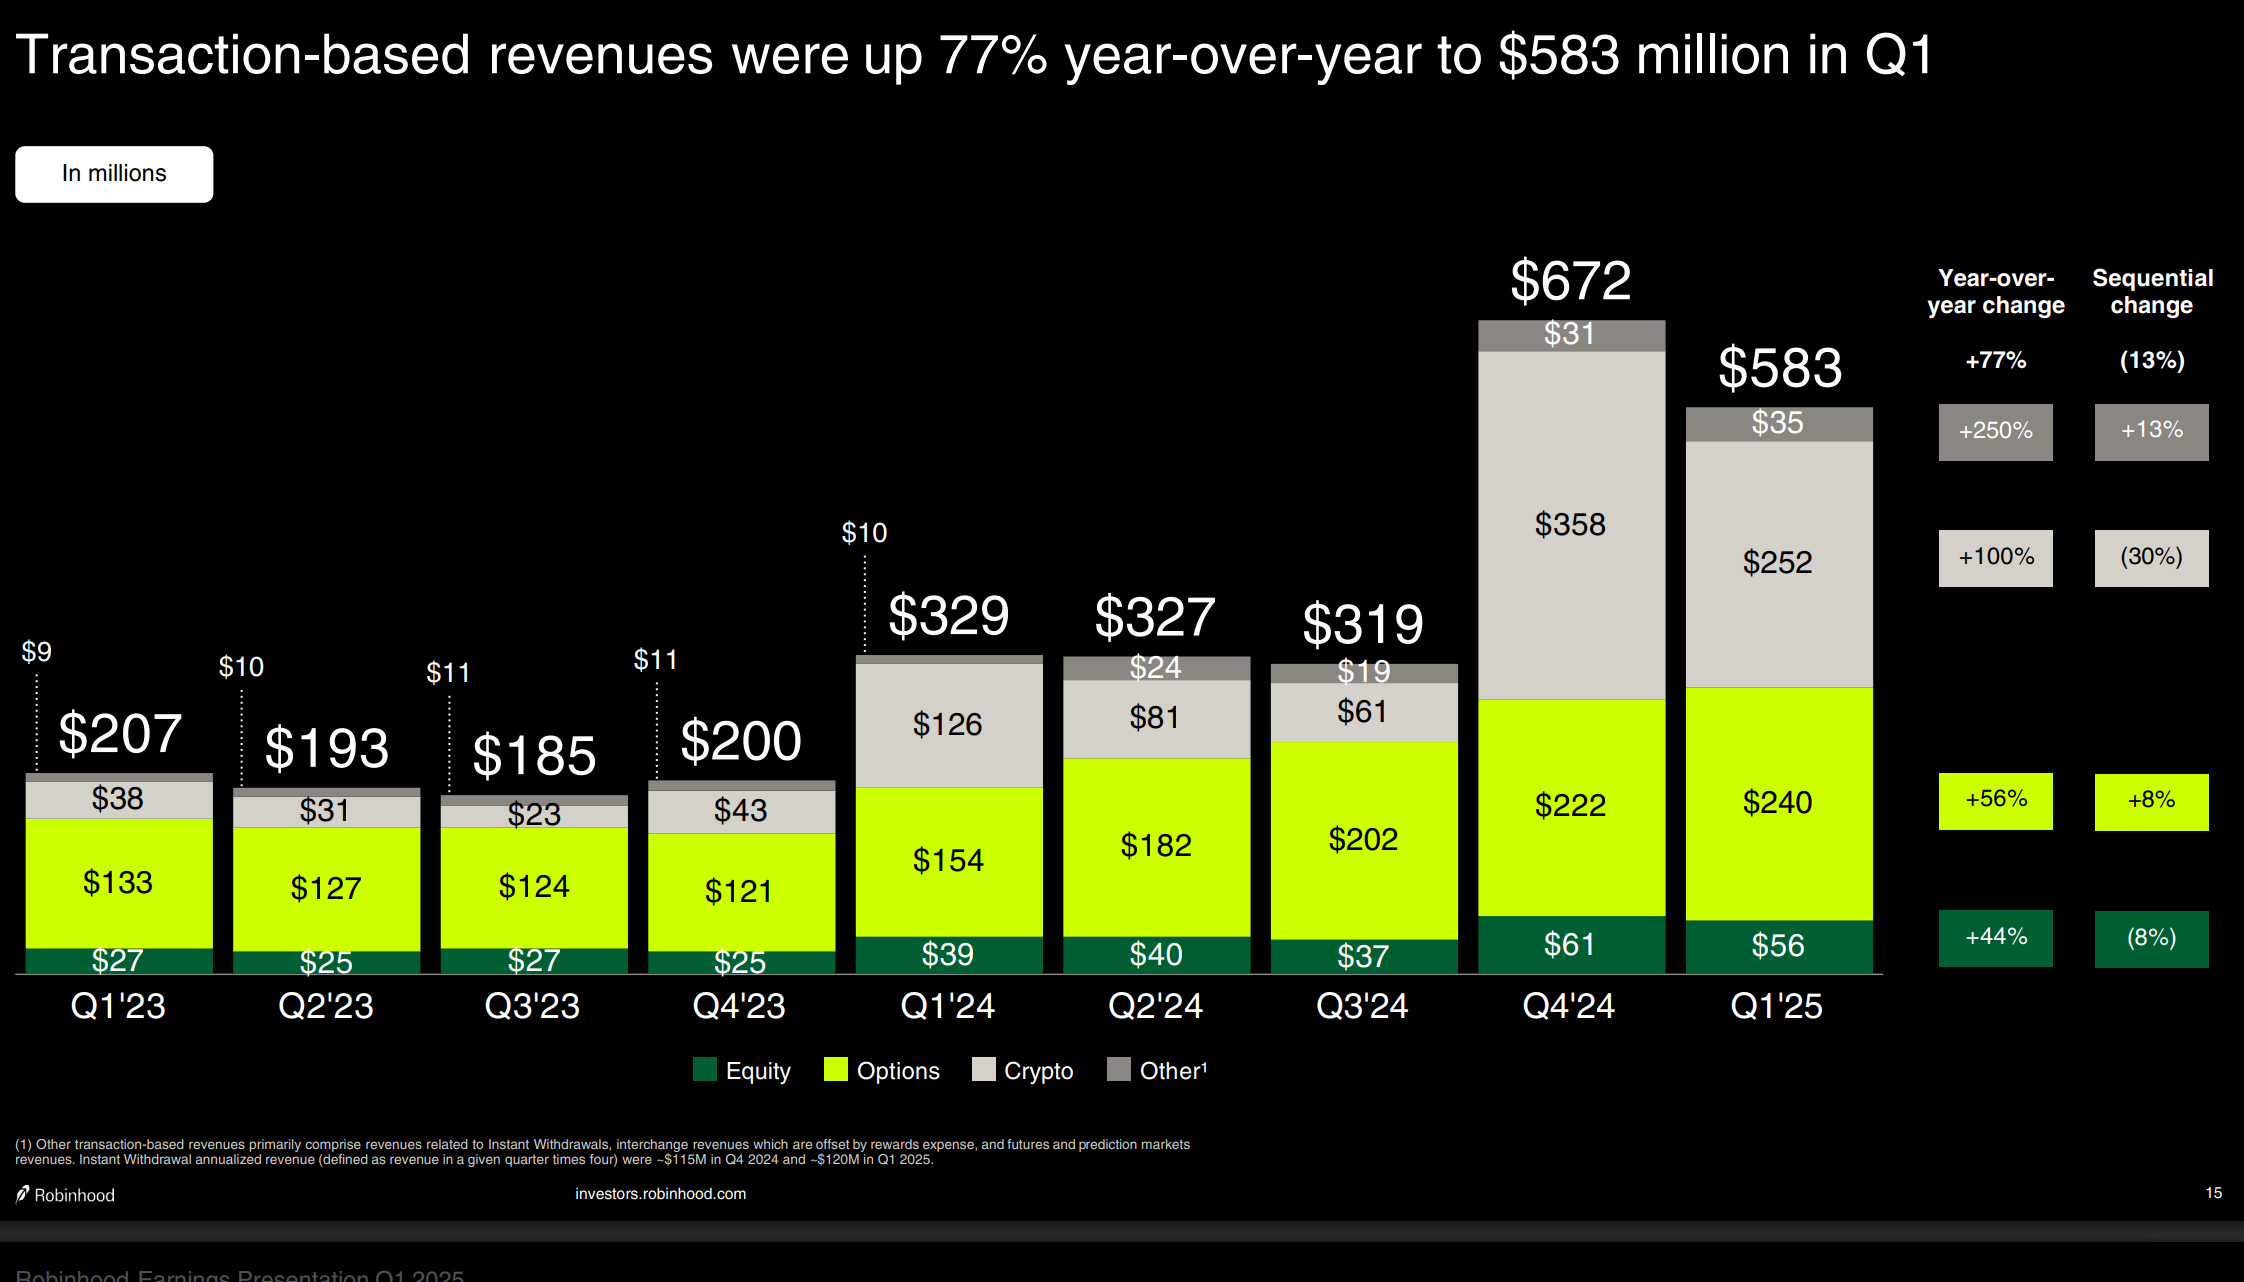
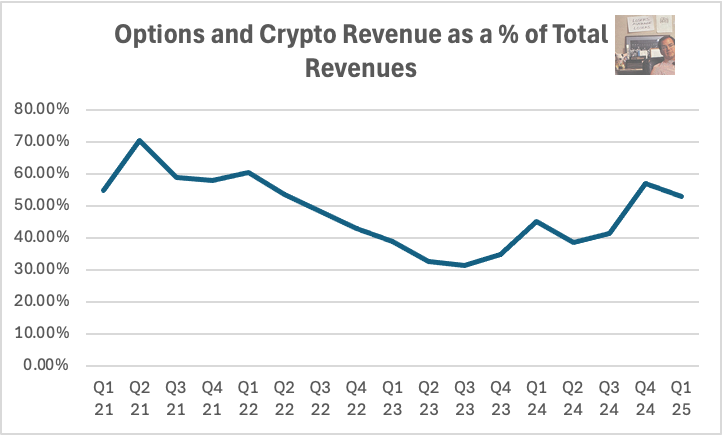
In Q1 ‘21 Options and Crypto revenues were 88M and 198M respectively of a total 522M in Revenues. In Q1 25 they were 240M and 252M respectively of a total 927M. Ergo, in Q1 ‘21 Options and Crypto accounted for 54.79% of Total Revenues and in Q1 ‘25 they accounted for 53.07%.
The peak for this metric was in Q2 ‘21 where they accounted for 70.44% of total revenues ! The trough was Q2 23 and Q3 23 were they accounted for 32.51% and 31.48% respectively.
This chart below neatly shows Crypto and Options Revenues as a % of Total revenues since Q1 ‘21:
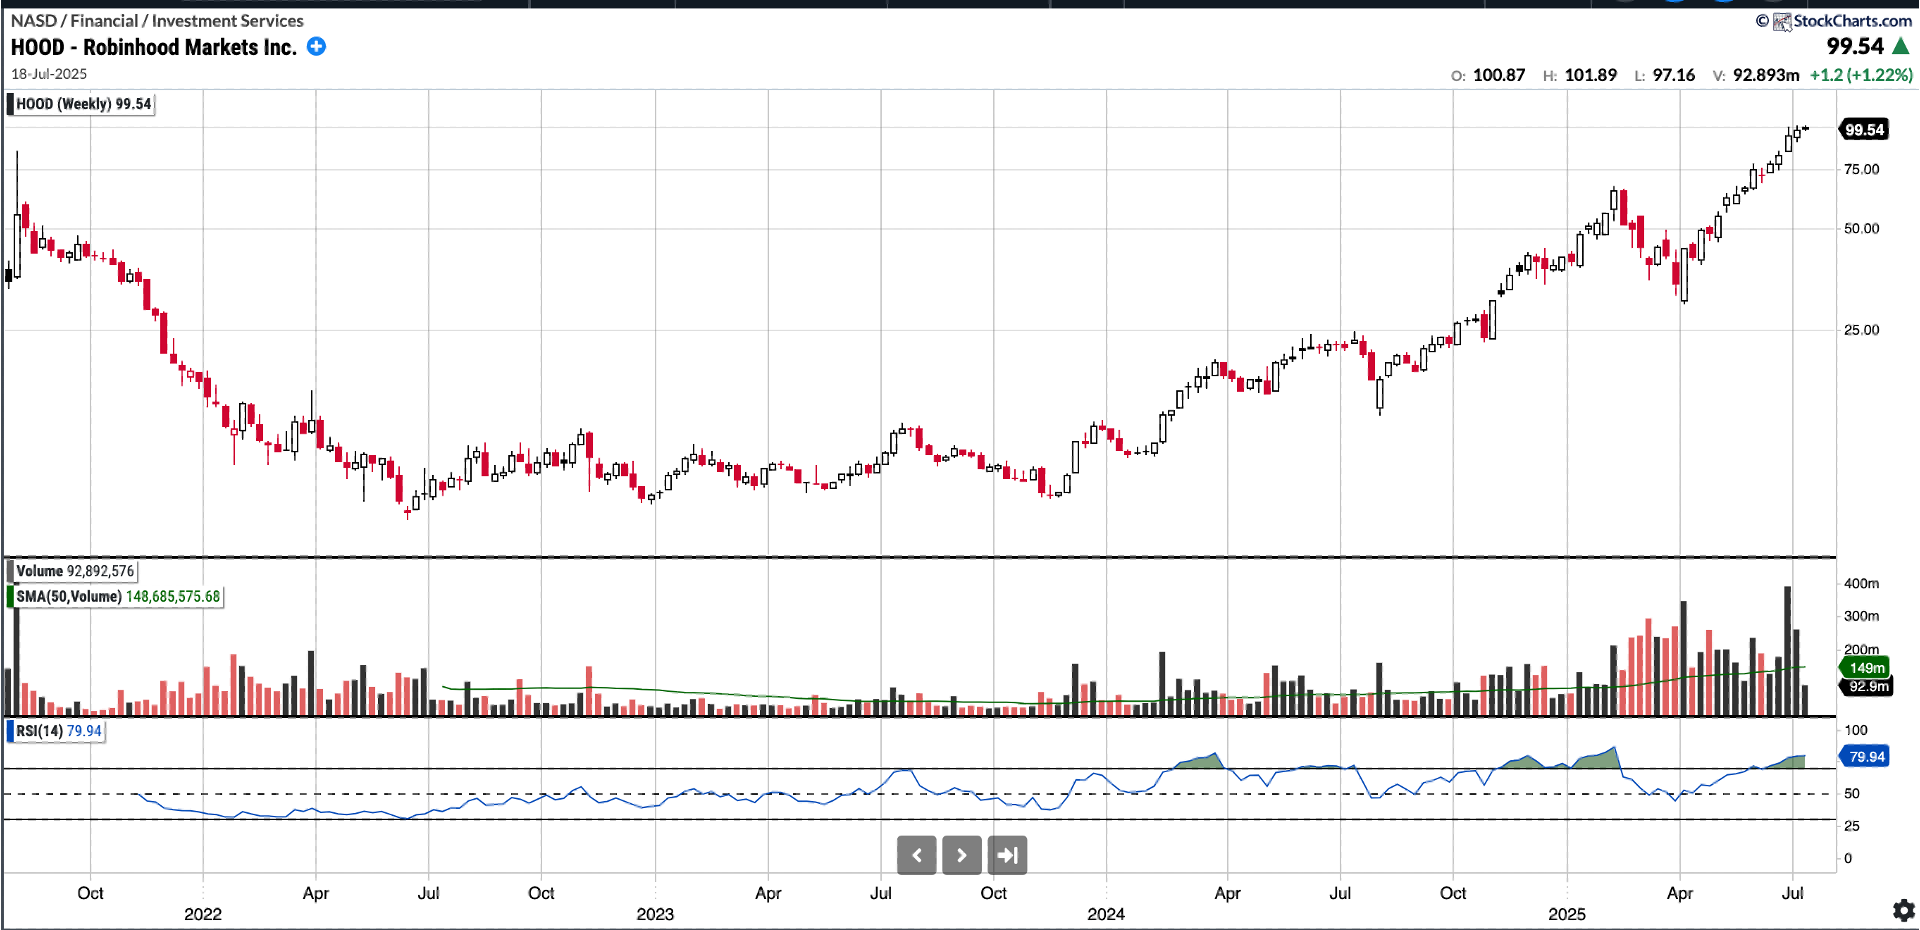
Another fun comparison is to see the correlation between Options and Crypto Revenue Chart from Q2 21 onwards to the Robinhood stock chart below. I am sure when Q2 numbers come up the above chart will be ticking back up like the stock-chart!
Increasingly, the majority of transaction revenues (and often Total Revenues) is carried by Options and Crypto Revenue. The evidence shows that Revenue from Options speculation and Crypto trading is highly cyclical and in a bear market will correct significantly from the peak; probably >75% if the most recent cycle is to be followed.
This is why I have termed revenue from Options and Crypto trading as being frail or of low quality- it is not consistent but rather cyclical.
A startling statistic is that in Q1 25 Net Interest Revenue, Options Revenue and Crypto Revenue accounted for 84% of Total Revenue. As highlighted above these would be under threat in an environment with lower rates and/or a Bear Market. The cascade of all 3 would be deadly for the stock.
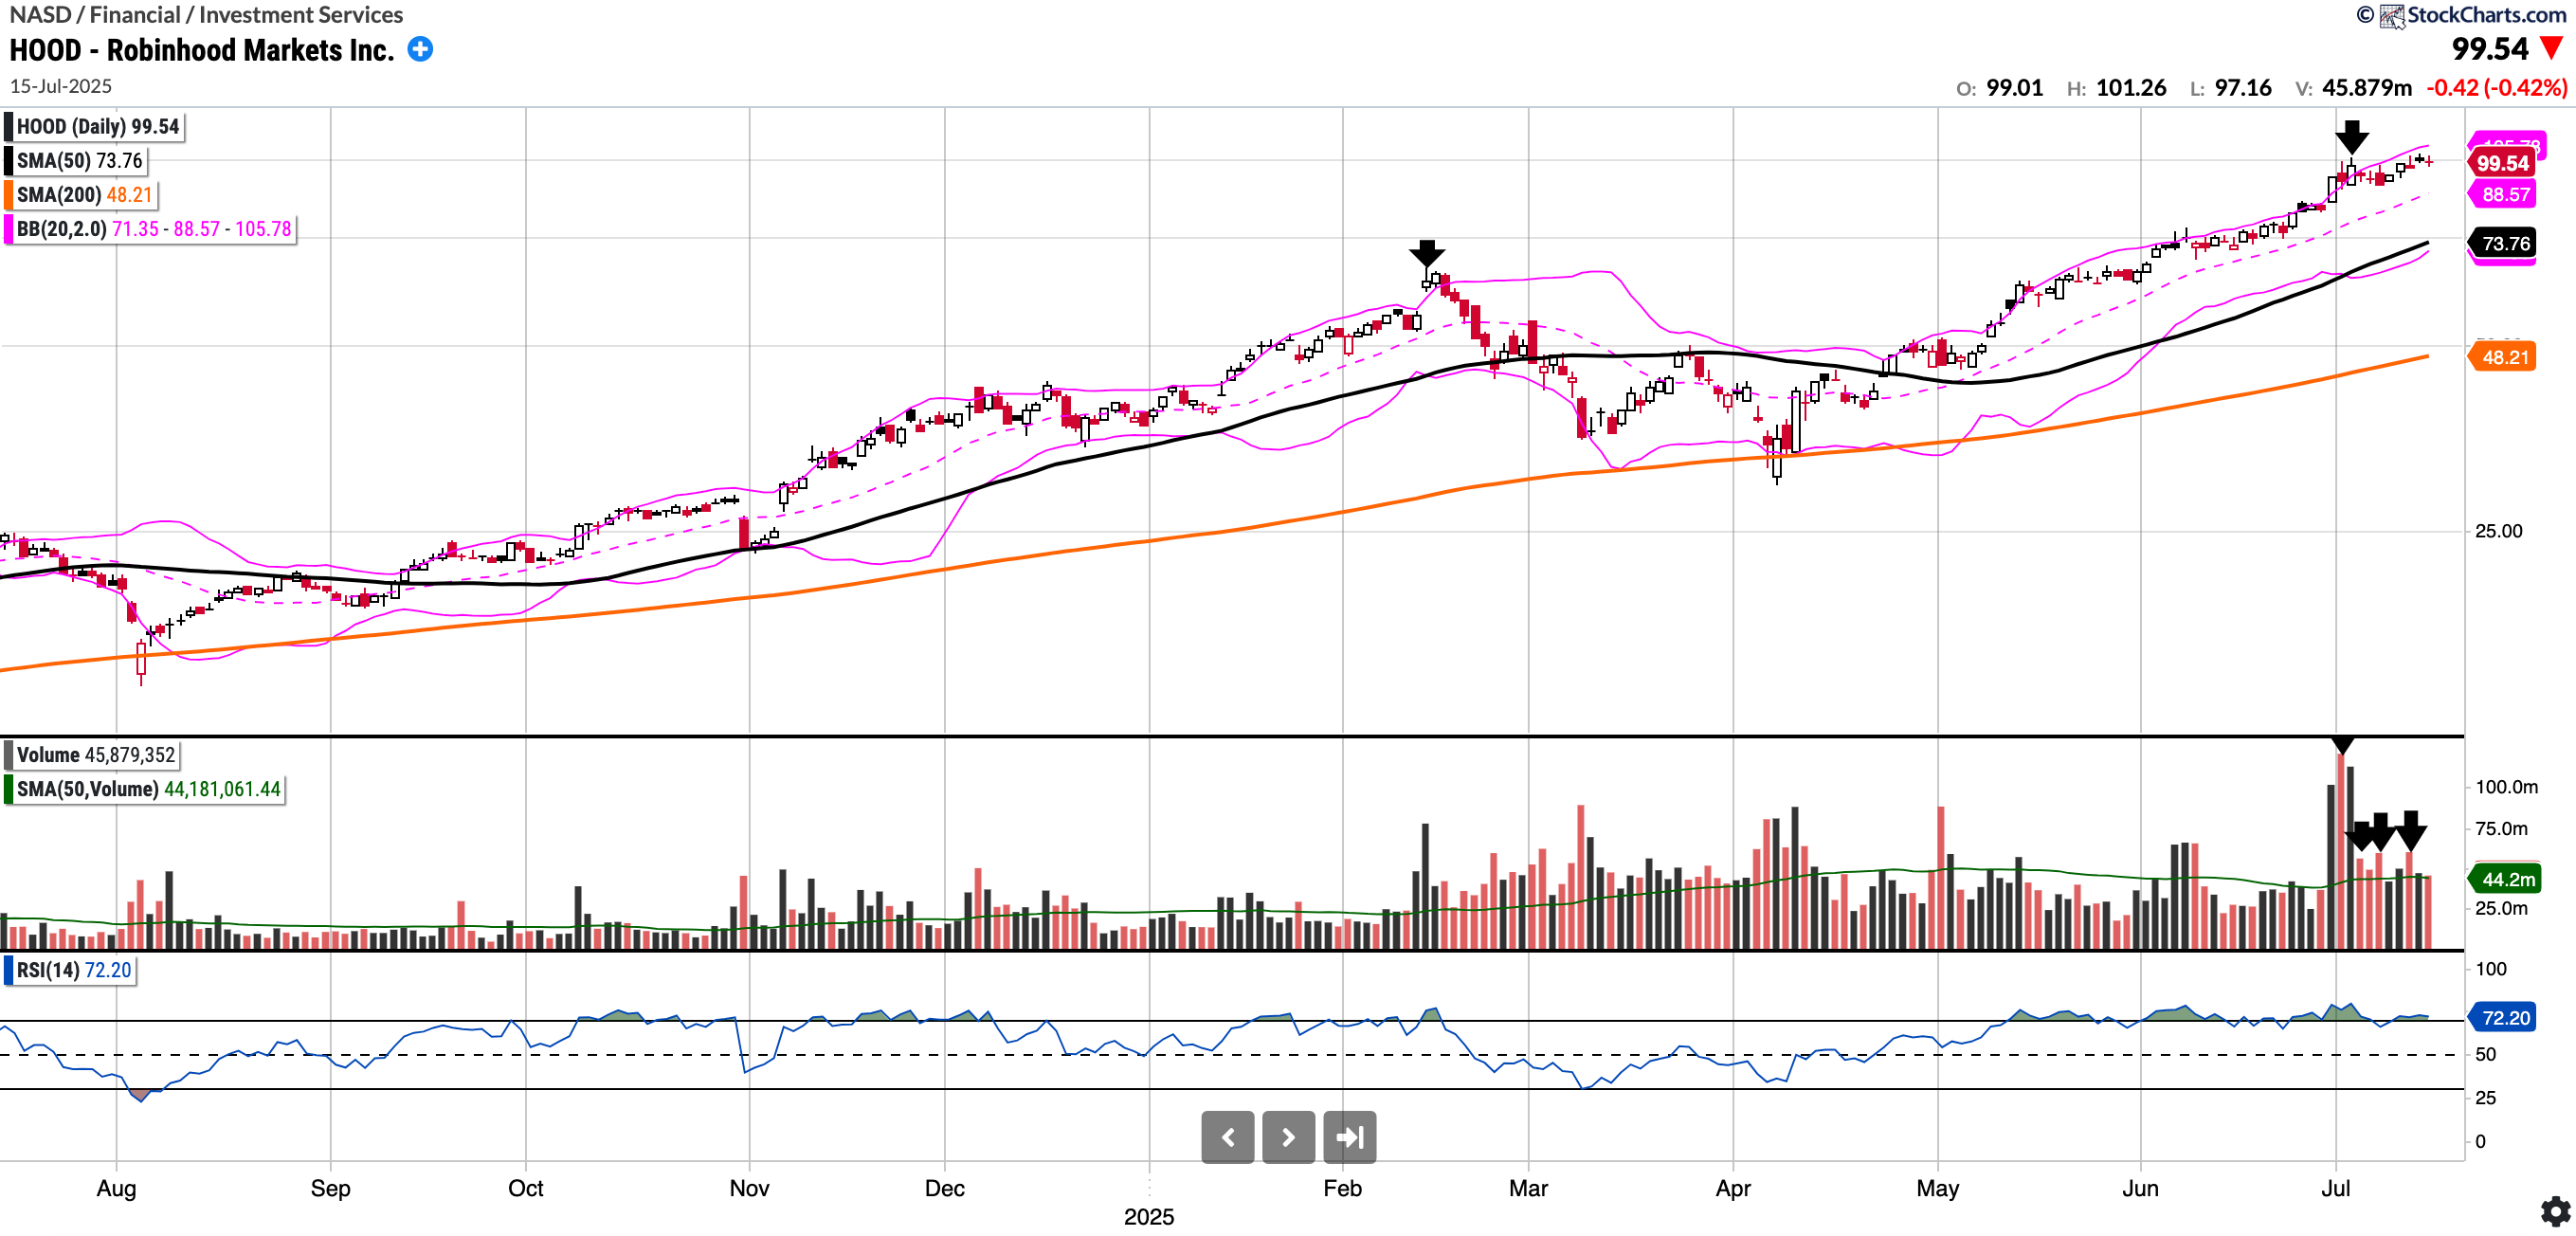
Robinhood Chart
Trading at $99.54, RSI of 72.2.
In a strong uptrend above all key MA’s and is straddling the upper Bollinger Band.
It is 106.49% above 200SMA which is somewhat extended but not concerning alone.
There has also been some distribution recently see arrows in the bottom right of the chart. I will be keeping an eye on this.
Timing the Short and how I plan to short:
When it comes to timing the short the good thing with HOOD is it trades logically and mostly on fundamentals. This is good because we can track underlying KPI’s closely because HOOD actually provides us with monthly metrics at https://investors.robinhood.com/financials/monthly-metrics
The idea will be to look for a negative divergence, i.e. a stock that is moving up but key metrics not improving at the same pace, flattening or actually declining. I will be tracking these and inputting into my spreadsheets.
From a technical point of view, I will be looking for signs in the chart. Specifically, signs of topping such as exhaustion candles or distribution taking place. In trading when looking for a short entry, we look for the “Right side of the A” to take an entry and can use prior ATH as stop-loss.
My plan to short HOOD will be to short via ITM or slightly OTM longer-dated puts and of course, I will do this on Robinhood’s own platform. Naturally.
My current position:
I remain currently long with a ~2% allocation at an average of $33. We averaged up at $65 pivot breakout level but trimmed those all at $99 recently. When I exit/trim further or conversely flip short I will update you all in the subscriber chat.
Thank you for reading, ensure to subscribe to the tier that suits and see you for the next one!!