

I hope you are all well.
As stated over the weekend, June got off to an interesting start, with the Nasdaq closing down 4.2% on Friday the 5th and the SMH dropping over 10% during the session.
I believe there were several catalysts for the sell-off: a hot jobs print (interpreted as an increased chance of rate hikes), Broadcom’s earnings, over-crowded positioning in semiconductors, and the fact that the SMH top-10 ranking implied volatility was in the 80%-plus zone for essentially every name except NVIDIA. That is not to mention the impact of leveraged Korean traders on specific semiconductor names plus cautious commentary by firms such as SemiAnalysis.
My quick thoughts on the market below:
Price action:
Today we have had a low-volume bounce following Friday’s high-volume sell-off.
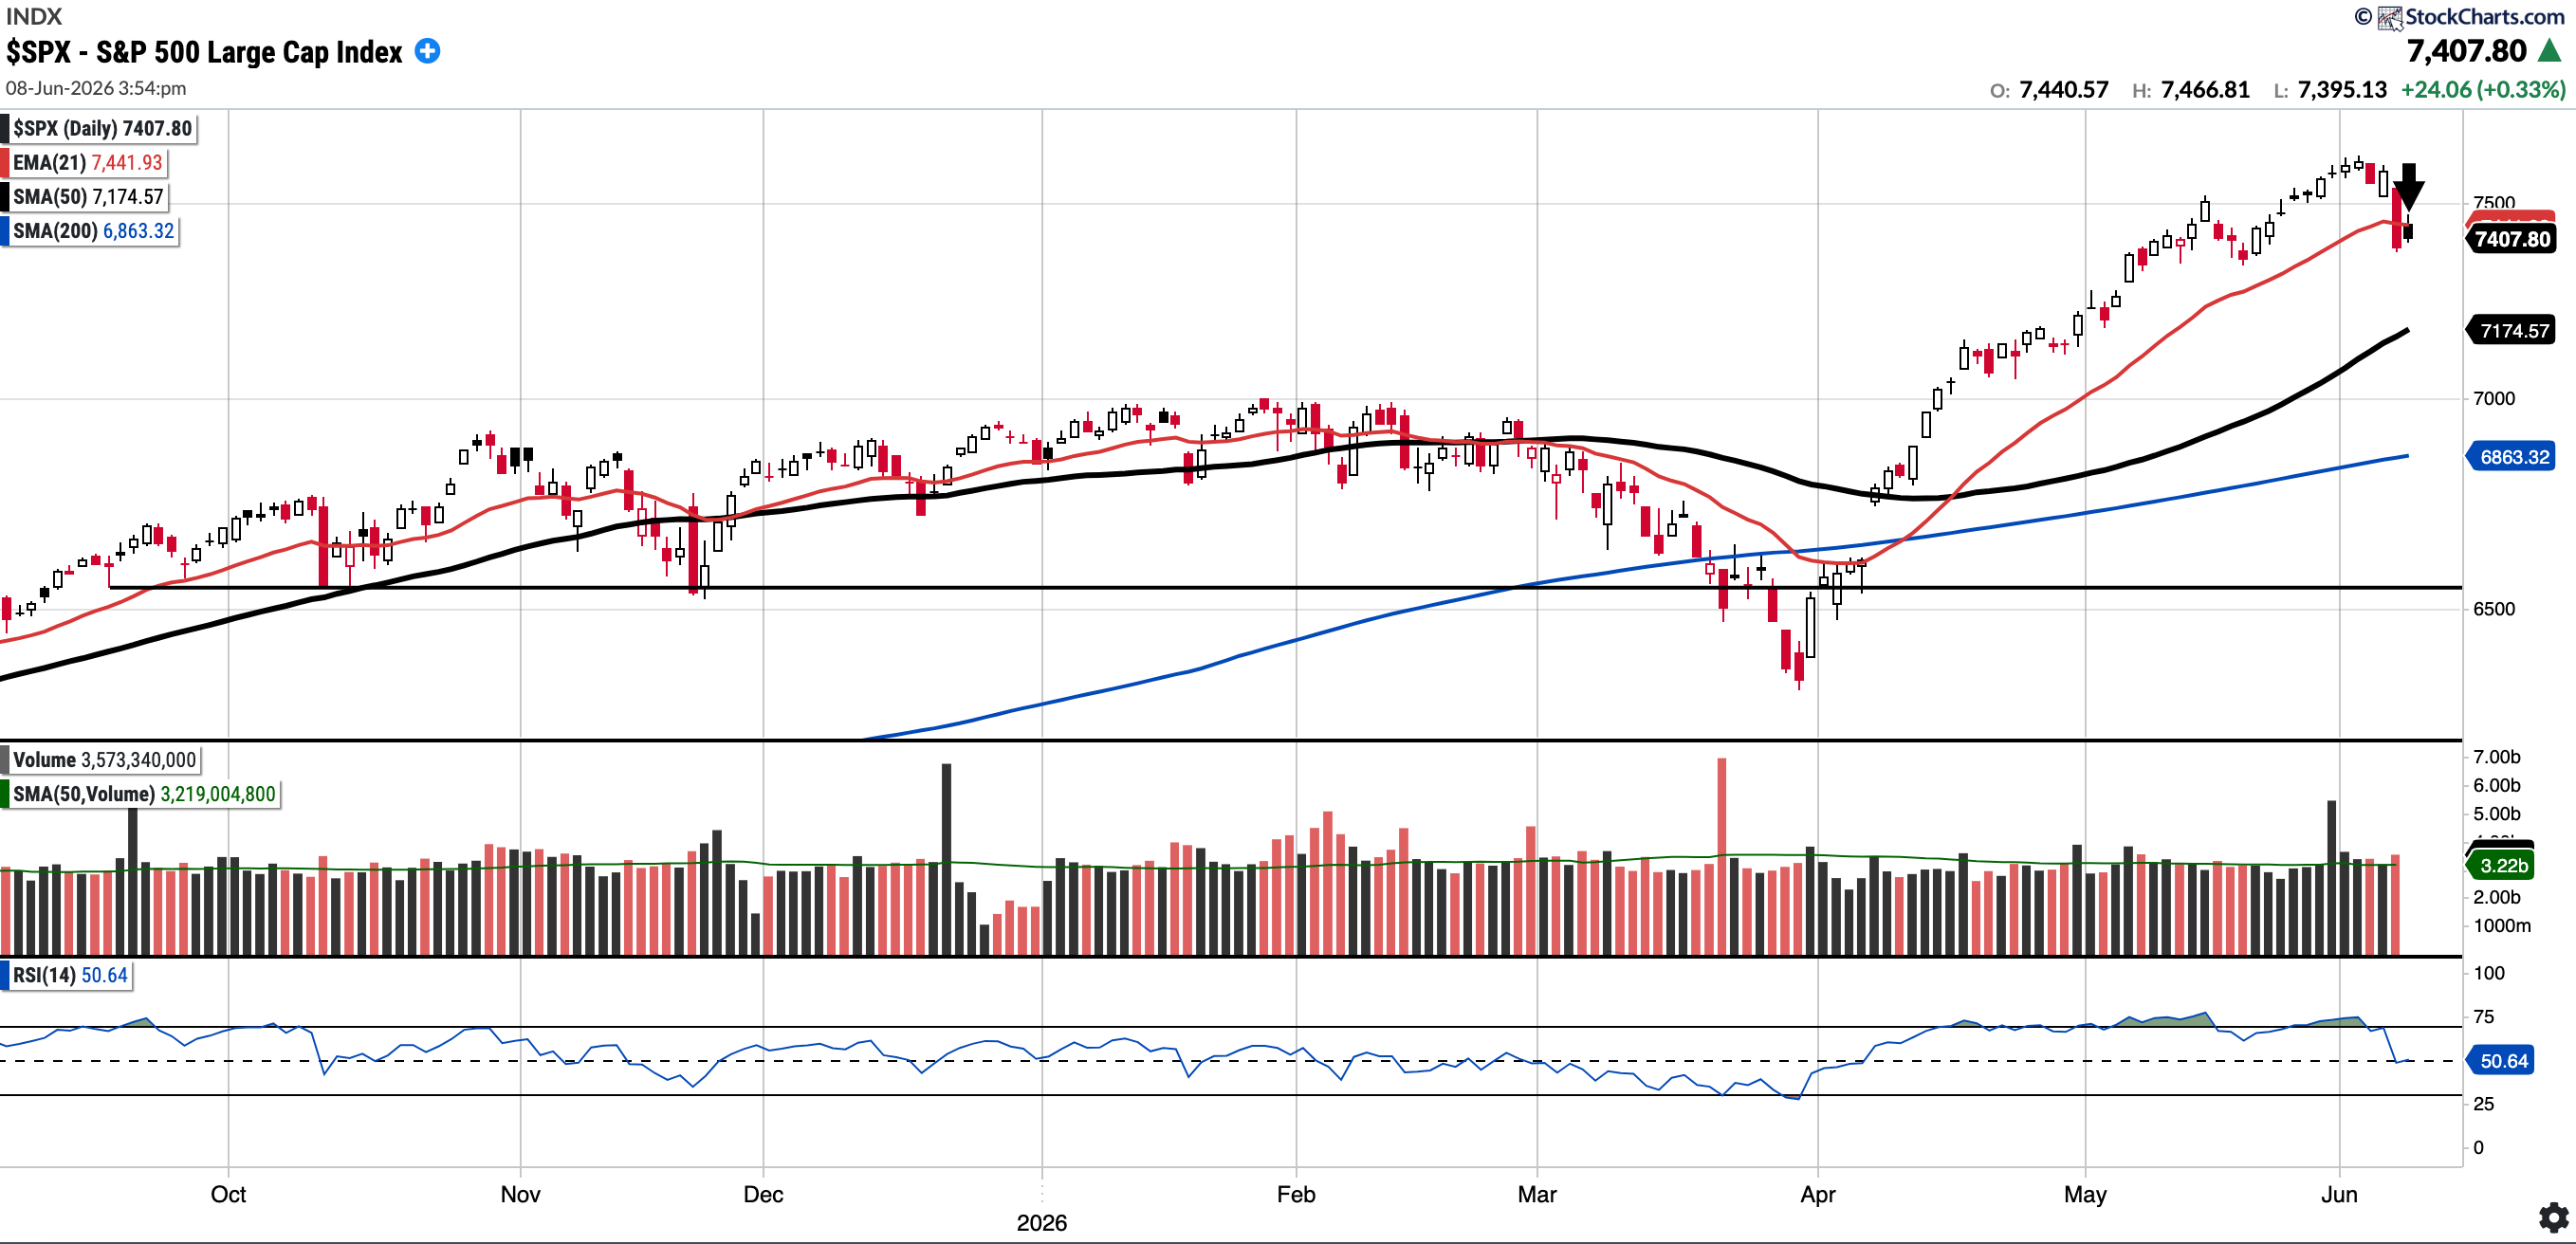
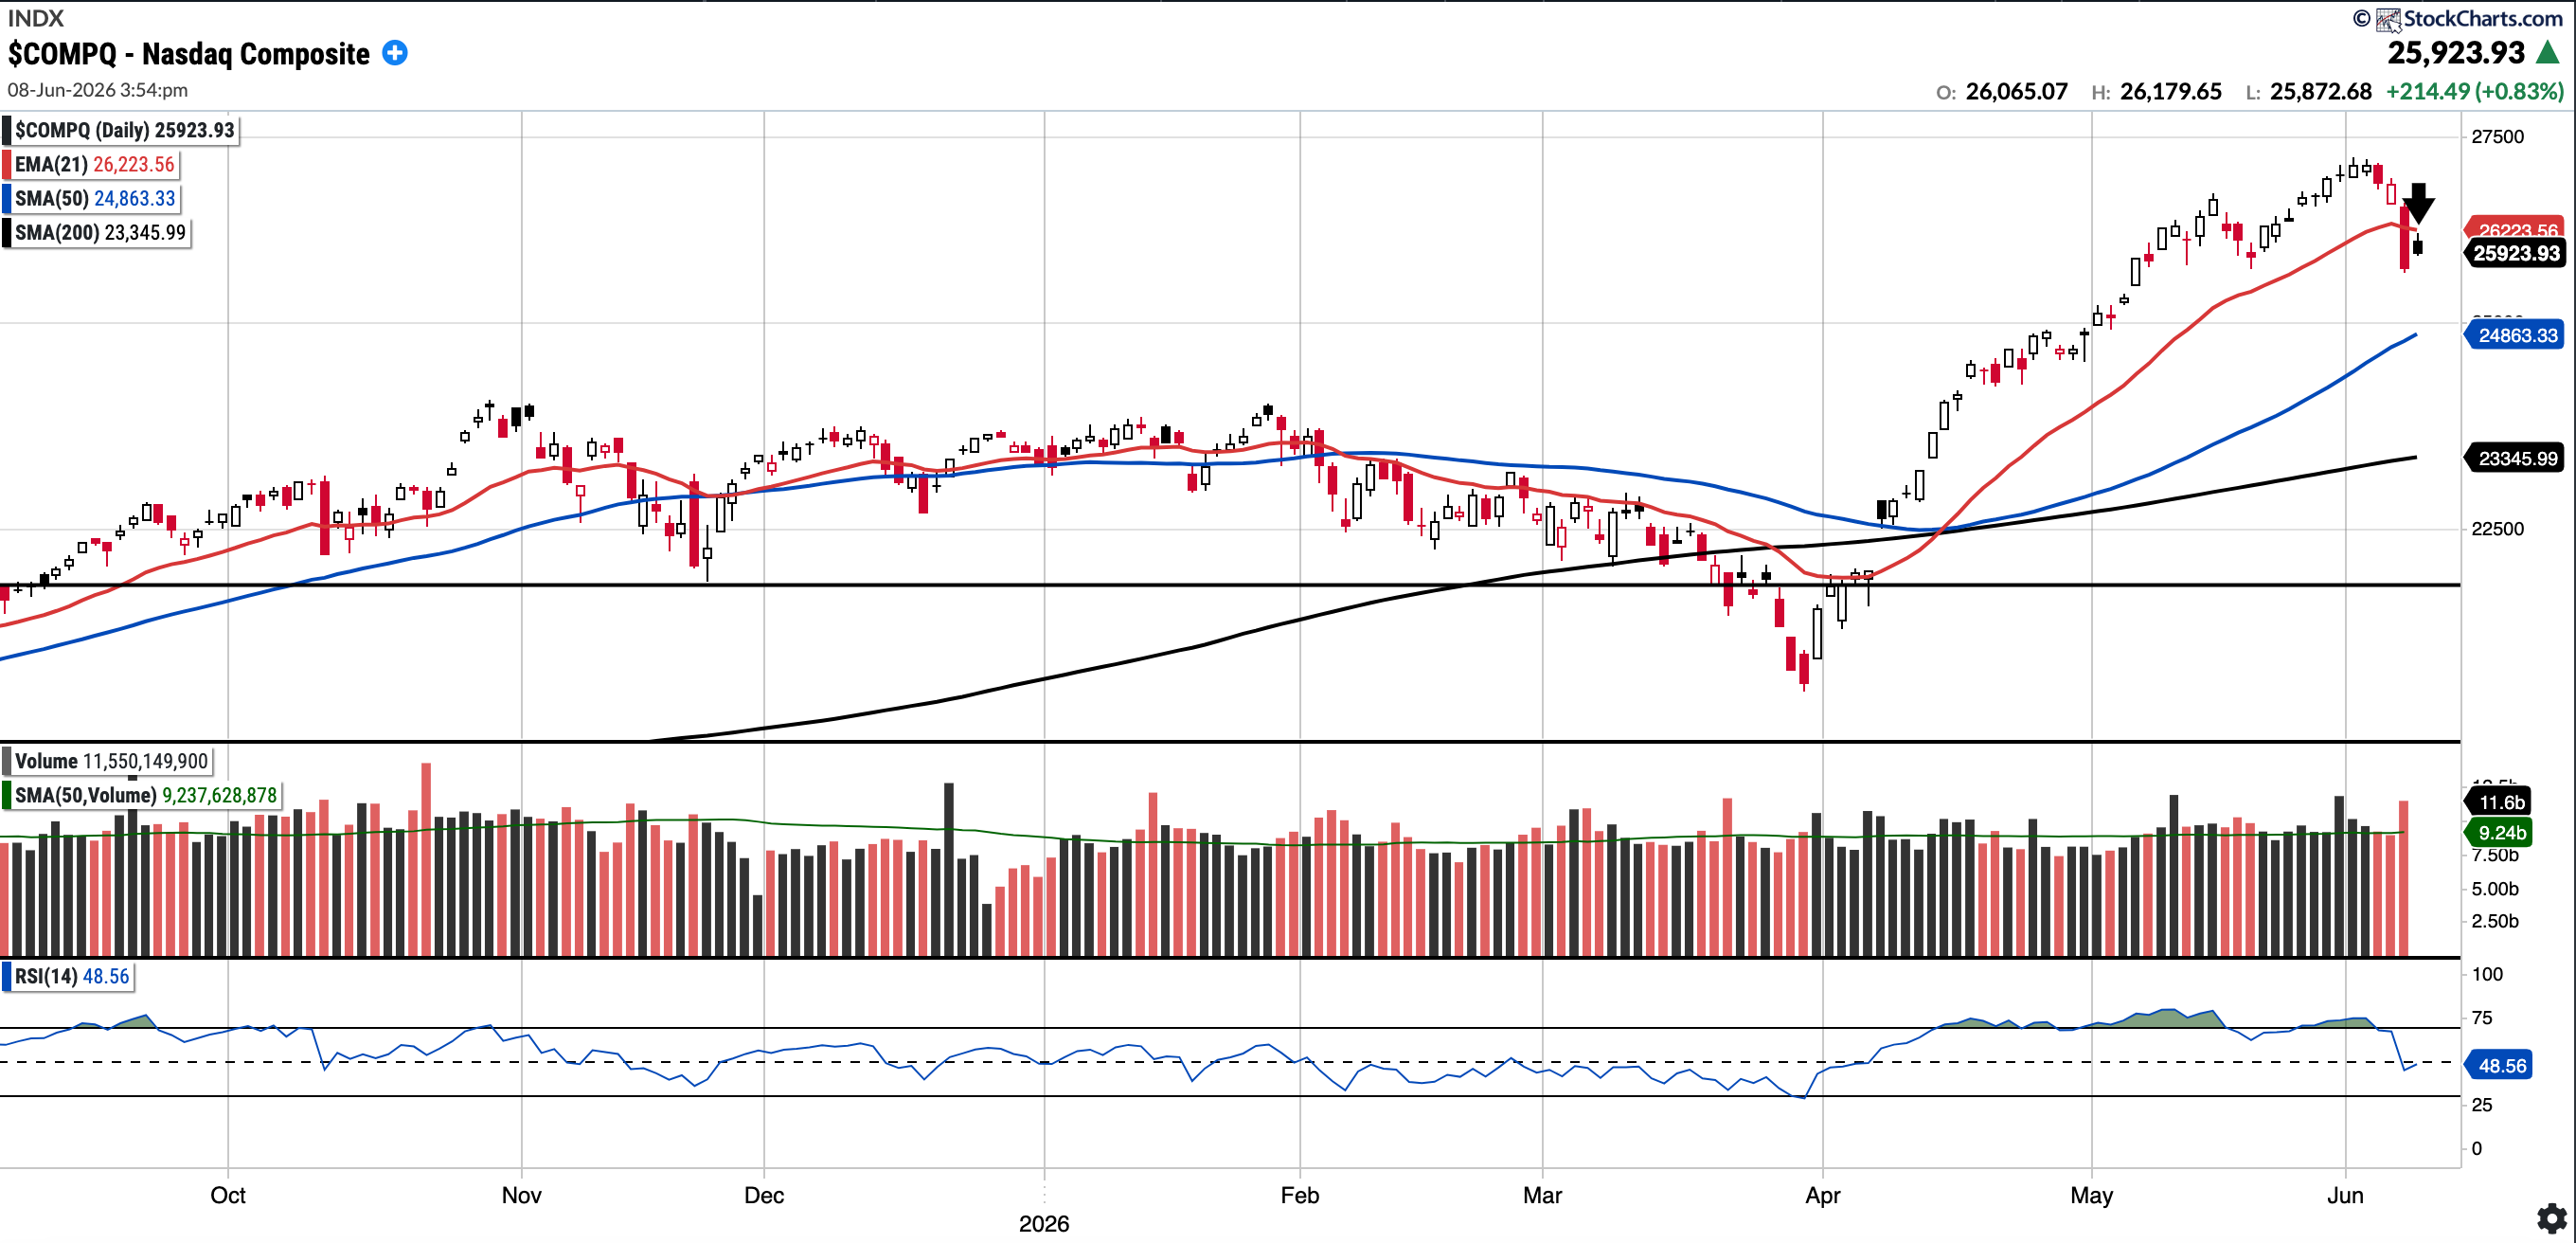
Both the S&P 500 and the Nasdaq Composite are currently trading below their respective 21-day EMAs which is a level that has not been breached since this rally began in April. See charts below:
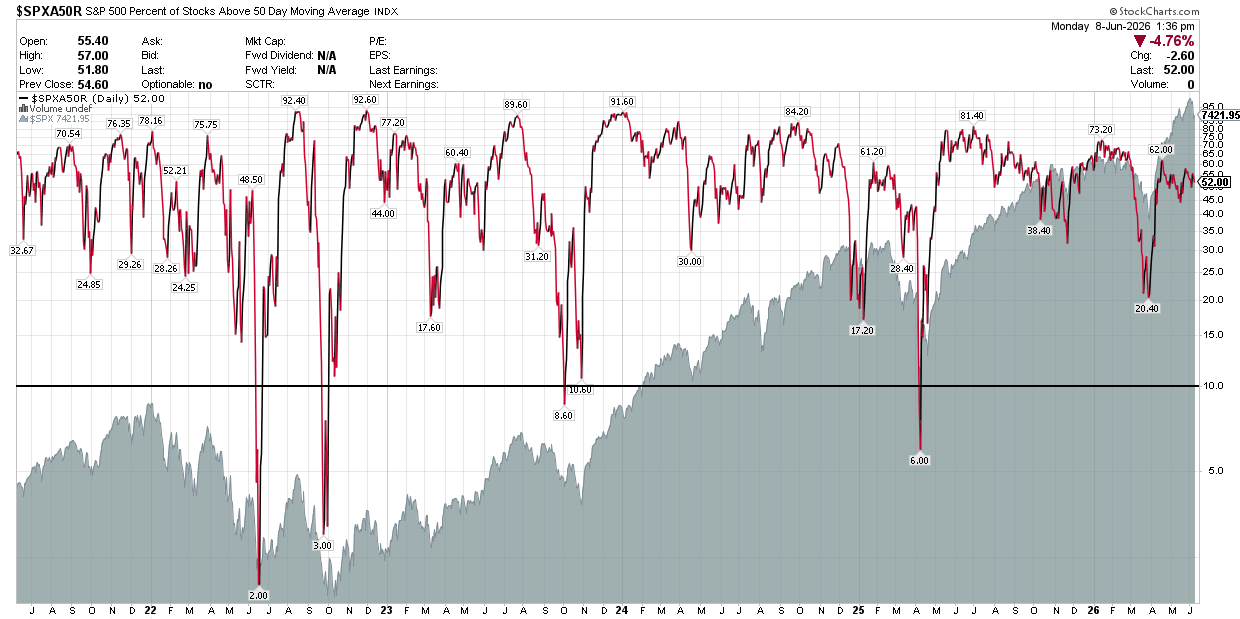
Market breadth continues to deteriorate, with only 52% of stocks trading above their 50-day moving averages as performance remains heavily concentrated in leading AI names. While the S&P 500 may have closed green , cyclicals and defensives are flashing warning signs, with the XLB, XLF, XLI, and XLP all trading in the red.
The broader market is starting to look heavy here.
My suggestion:
No need for drastic measures, but I do feel this is a time for risk management rather than aggression.
Review your active trading positions, tighten stops on partial or full allocations, and consider protecting new capital until a clearer directional setup emerges. If looking to hedge then one simple strategy (besides holding cash) is to purchase longer-term put options when the S&P 500 falls below a key moving average, such as its 21-day EMA. I personally am not hedging right now, except holding some cash.
Of course, if you are long-term investing, then there is nothing to change, except to ensure you are happy with your overall exposure.
Be sure to revisit my posts under the Investing Philosophy tab, such as Minimising Drawdowns, Risk Management, and Sell-Rules.

Thank you for reading and see you for the next one!
The percentage of stocks in the S&P 500 above their own 50 day moving average is a great indicator. The only problem I have with it is the variability in the calculation. StockCharts (what you show) has 52%. Sentiment Trader has 60.24%. Duality (on Substack) has 60.4%. The difference between 52% and 60% is large enough to draw a different conclusion.