
Monthly Portfolio Update
Market Thoughts | Swing Trade Recaps | Performance Since Inception | 2026 Position Plans & Outlook.

I hope you are well. Below, we provide market commentary and an in-depth portfolio update.
Format for what is covered in this Monthly Portfolio Update:
Market Thoughts
Indices Review
Key Indicators
SixSigmaCapital Swing trades Recap
SixSigmaCapital Performance: YTD and since Inception
Featured Quote
Current Positions in size order
Closing Thoughts
If it is your first time here consider joining the free or premium subscription and ensure to check out what SixSigmaCapital readers are saying below:

For all readers a reminder that a premium subscription includes:
Favourite set-up Ideas, Market Memos plus Full archive
Live Portfolio updates (All Buys and Sells) in Subscriber only Channels
Monthly in depth portfolio & performance updates
Discord access for AMAs and live trading account updates.
If interested then consider upgrading to a premium subscription via the link below. There is currently a discount on the annual membership, which saves 25% vs. monthly (forever) and is 42% cheaper than the Substack App price.
Market thoughts:
Equity markets had a somewhat volatile month though the Dow, S&P 500, and Nasdaq Composite posted +1.42%, 0.49% and 0.1% respectively.
As previously, my perspective remains that there is enough to be concerned about with regards to the US economy and Equity Markets over the medium term. However, despite the geopolitical and macroeconomic uncertainty, markets had continued to exhibit remarkable resilience and we continued to climb the wall of worry.
Things changed a little in November however, as we saw sharp sell offs under the surface with more than 60% of equities falling into bear market territory at one point. This was not reflected in the indices, as mega-caps held up well and sectors such as Healthcare also caught a bid.
In November I wrote “Cracks began to appear, particularly in the AI trade, where questions regarding circular financing resurfaced. CDS spreads for many AI companies, such as ORCL and CRWV, continued to widen significantly. Cryptocurrencies, often a harbinger of risk appetite, lost around 30% of their total market cap, with BTC correcting ~35% from its all-time high in a short period. In summary, much has changed over the last month regarding risk assets, even if the indices ended the period almost unchanged”. This pretty much still applies at the end of December as the AI trade and cryptocurrencies remain under pressure.
On tariffs, my belief is if they proceed as intended by the Administration this will hurt the average American and SMB. However, there has been progress with the announced Trade deal with Japan and the EU. A deal with China remains outstanding though Trump and Xi’s recent meeting resulted in a one-year framework agreement and progress on several fronts: tariffs, fentanyl, rare earth minerals and the overall stabilisation of economic ties.
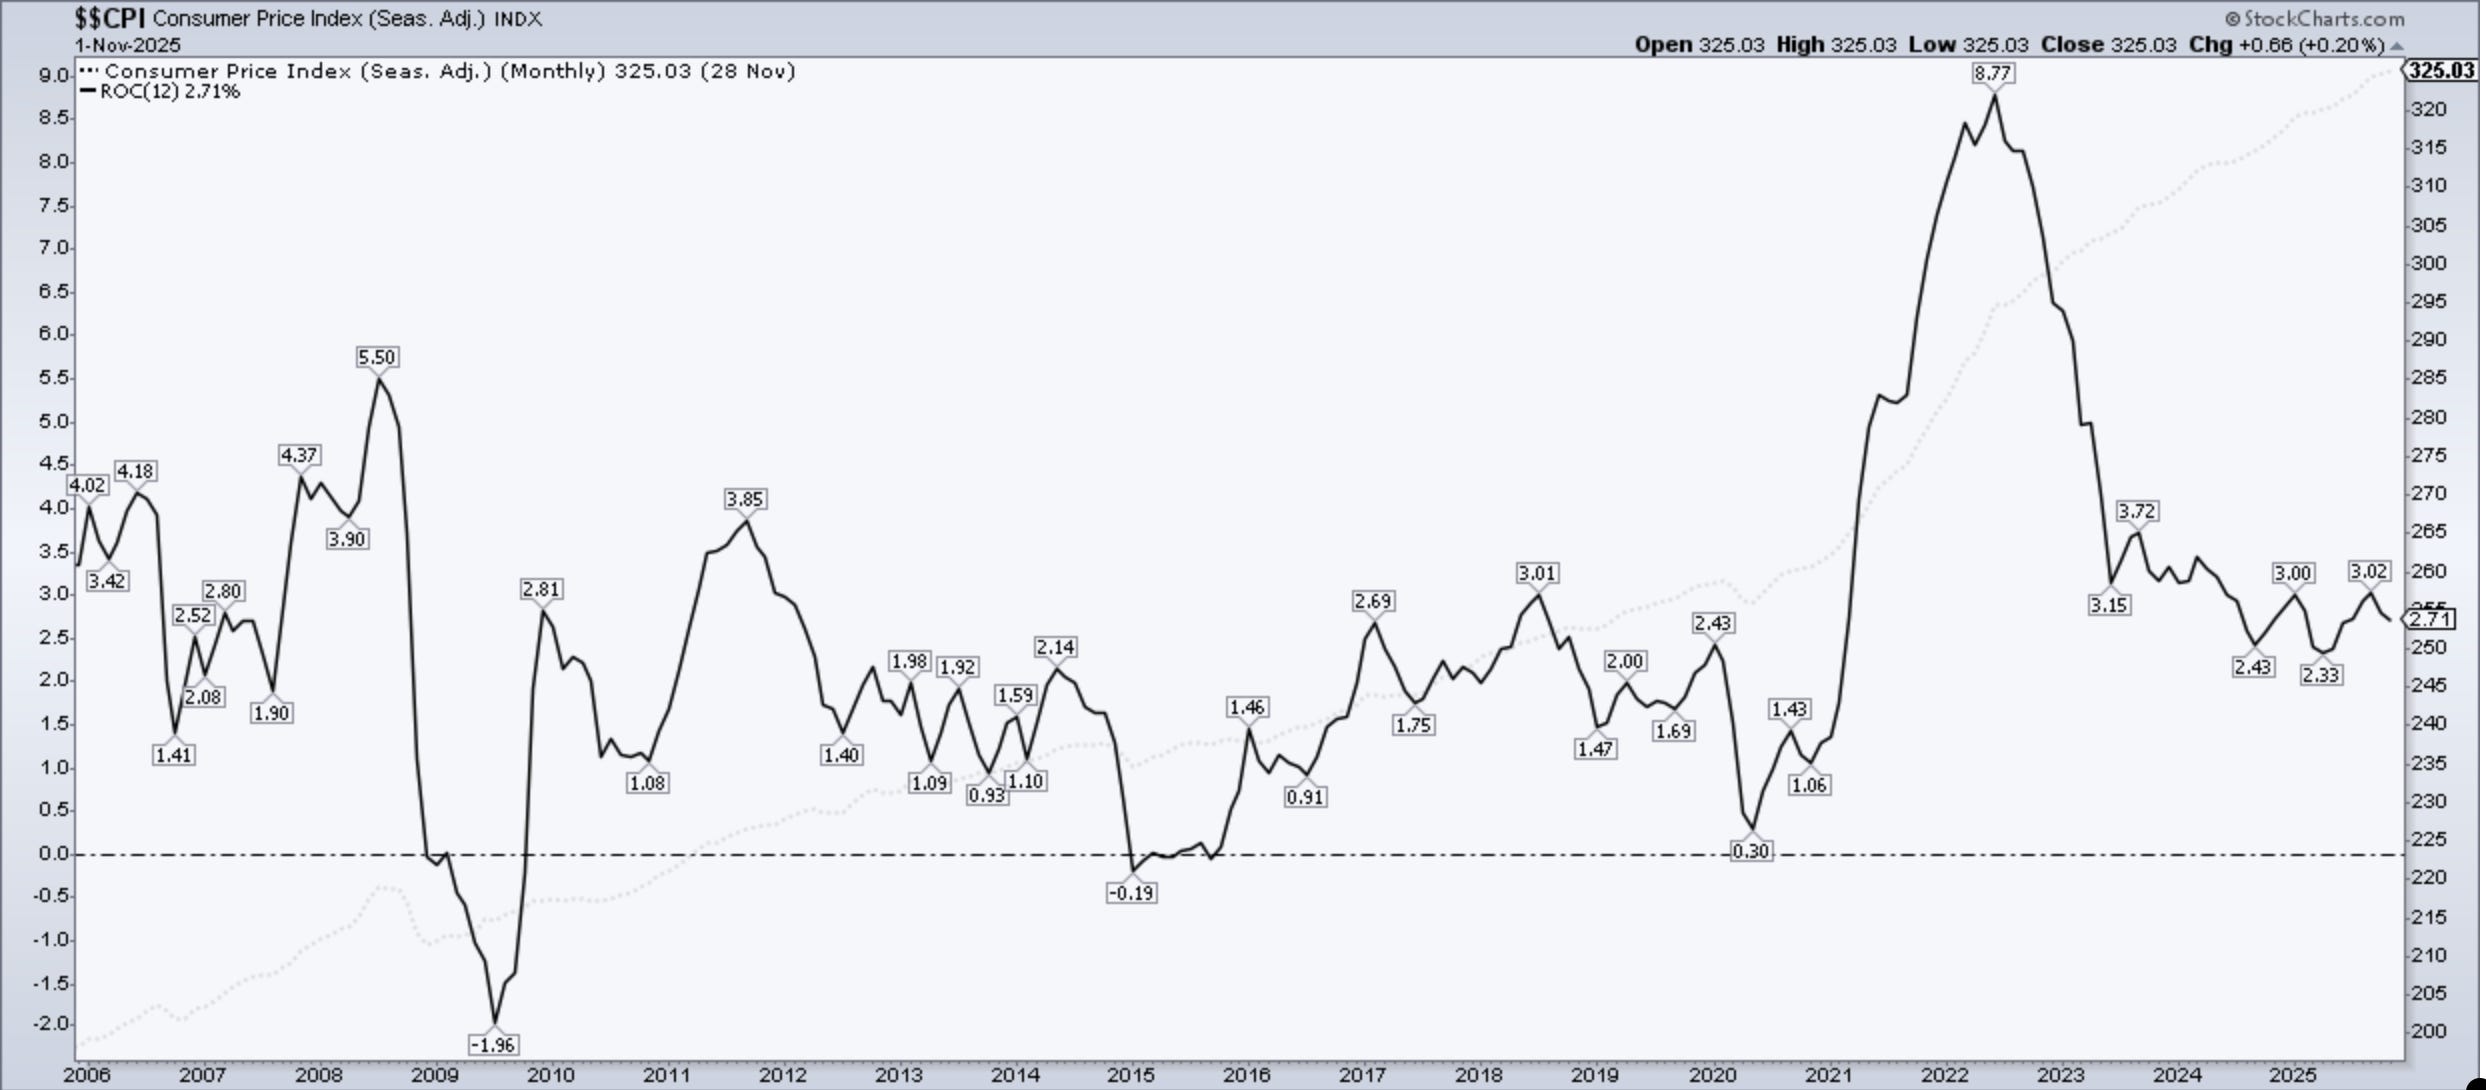
The November 2025 CPI data (released December 18, 2025) came in significantly cooler than economist expectations, largely due to disruptions from the federal government shutdown that affected data collection.
Headline CPI rose 2.7% YOY, expectations were 3.1% YOY.
Core CPI increased 2.6% YOY, again below expectations which were at 3.0% YOY.
Notably Core CPI inflation in the US at its lowest level since March 2021.
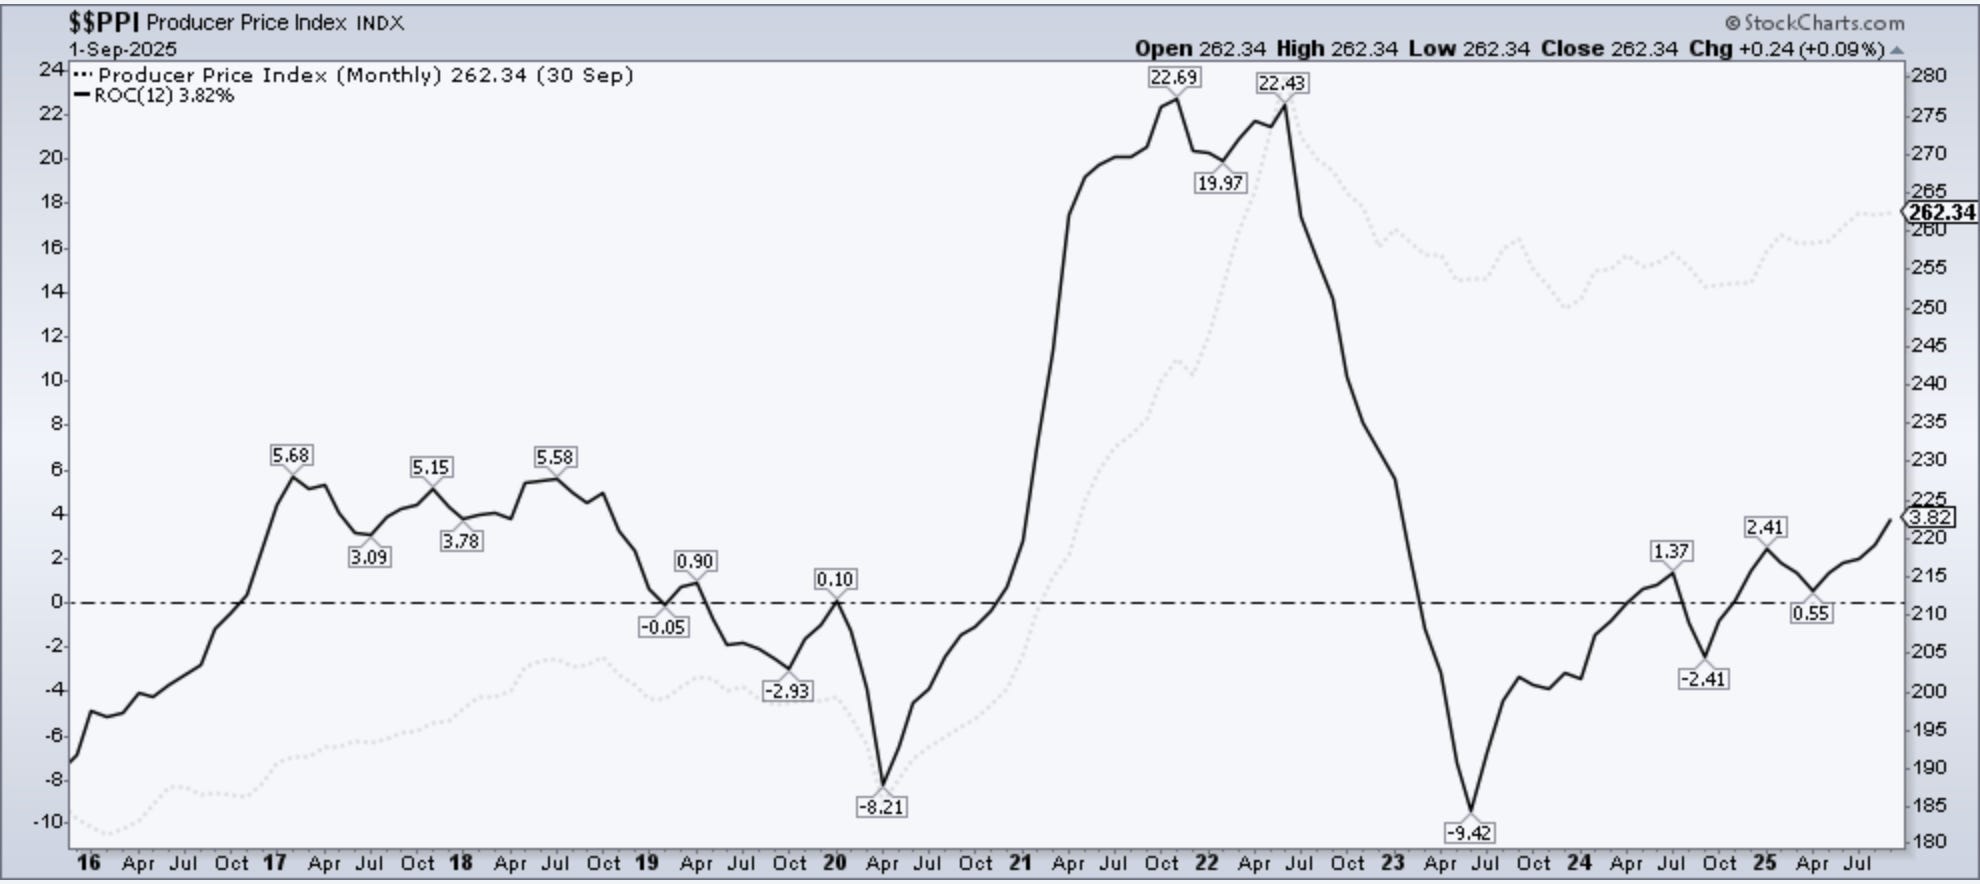
Below I have included charts showing the trend for both CPI and PPI.
At the FOMC meeting on December 9–10, 2025, the Fed lowered the federal funds rate by 25 basis points, bringing the target range to 3.50%–3.75%. This was the third consecutive 25 basis points rate cut. Interestingly, the updated “dot plot” projected only one additional cut in 2026 and another in 2027, this signals a more cautious approach going forward amid elevated uncertainty and lingering inflation pressures.
With regards to PCE (Fed’s preferred metric), we were due to get a reading for September, on the 31st of October but instead it was released on the 5th of December. PCE came inline at 2.8% Y/Y vs 2.8% est. and Core 2.8% Y/Y vs 2.8% est. Core PCE has been sticky this year in the 2.7 to 2.9% range.
Over the last few months, I have begun to slowly shift my portfolio away from what’s been working toward what I expect to work in 2026 and beyond. I discussed some of my favourite ideas in my post, 'Stocks and Setups I Like Heading into 2026,' below which I highly recommend revisiting.

Indices:
S&P 500:
Currently trades at 6,845.50 (16.65% YTD)
It is 0.63% above the 50SMA. RSI is 51.03
Trading at 25.68x trailing earnings and 22.27x forward earnings (per WSJ)
Nasdaq Composite:
Currently trades at 23,241.99 (20.54% YTD)
It is 0.02% above the 50SMA. RSI is 48.79
Trading at 32.65x trailing earnings and 25.17x forward (per WSJ)
Key Indicators:
10 Year T-Note: 4.163%. It has decreased by 9.01% over the last year.
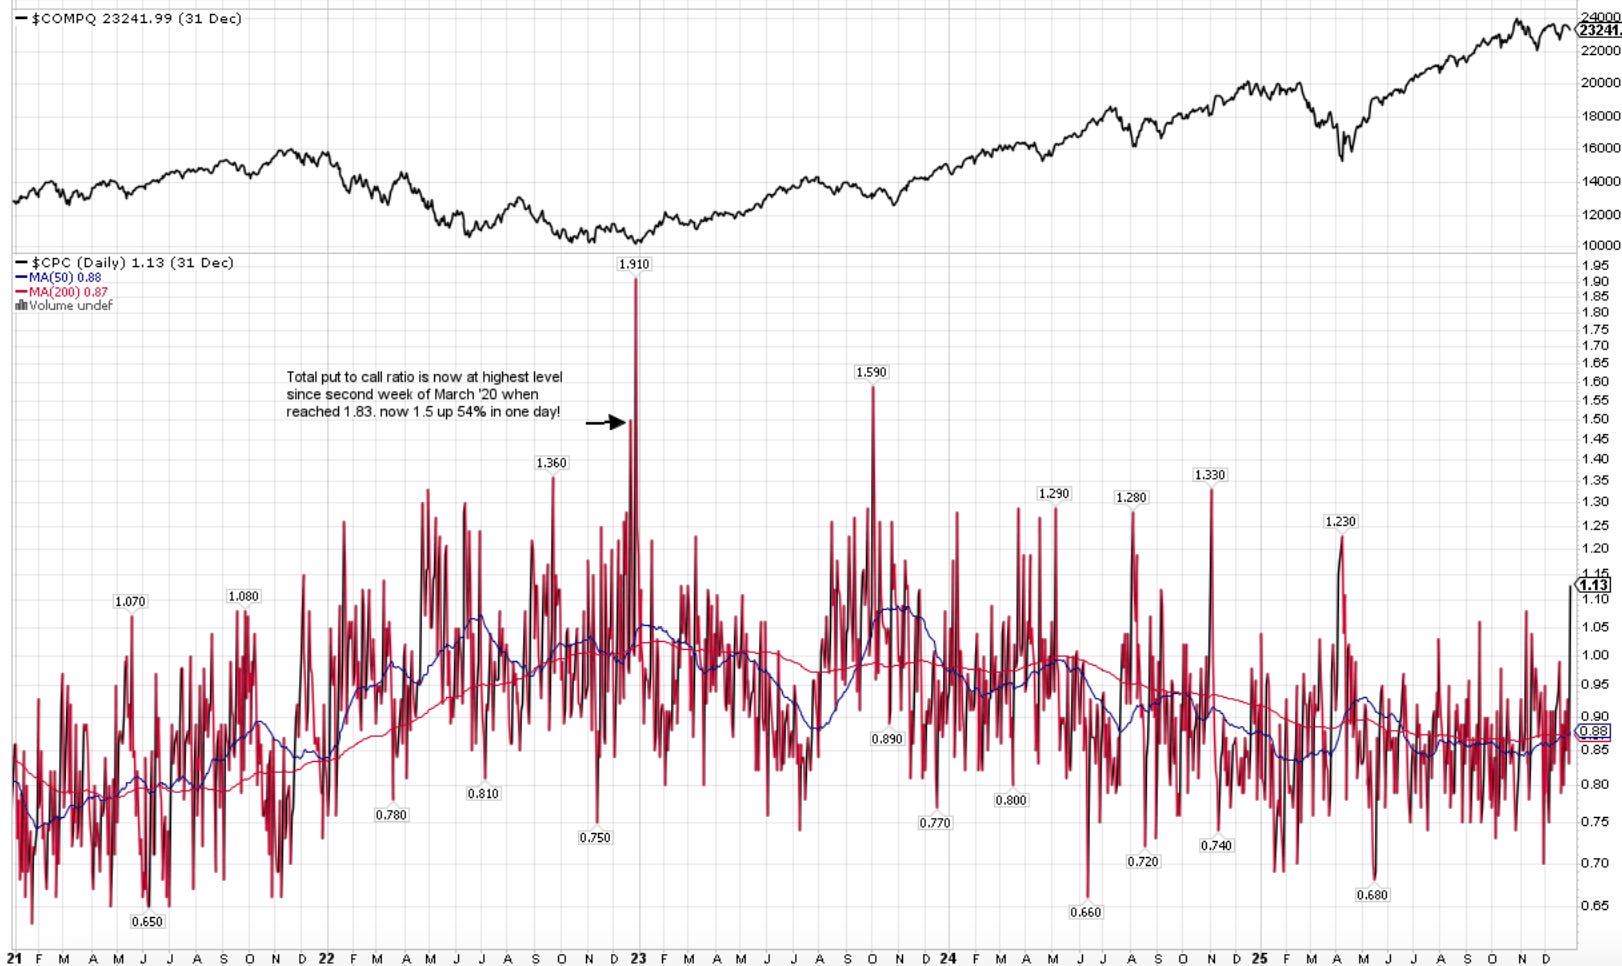
CPC (Put to Call Ratio) is 1.13 and increased by >36% on the prior trading day. >1 can indicate Fear and >1.5 can be Extreme.
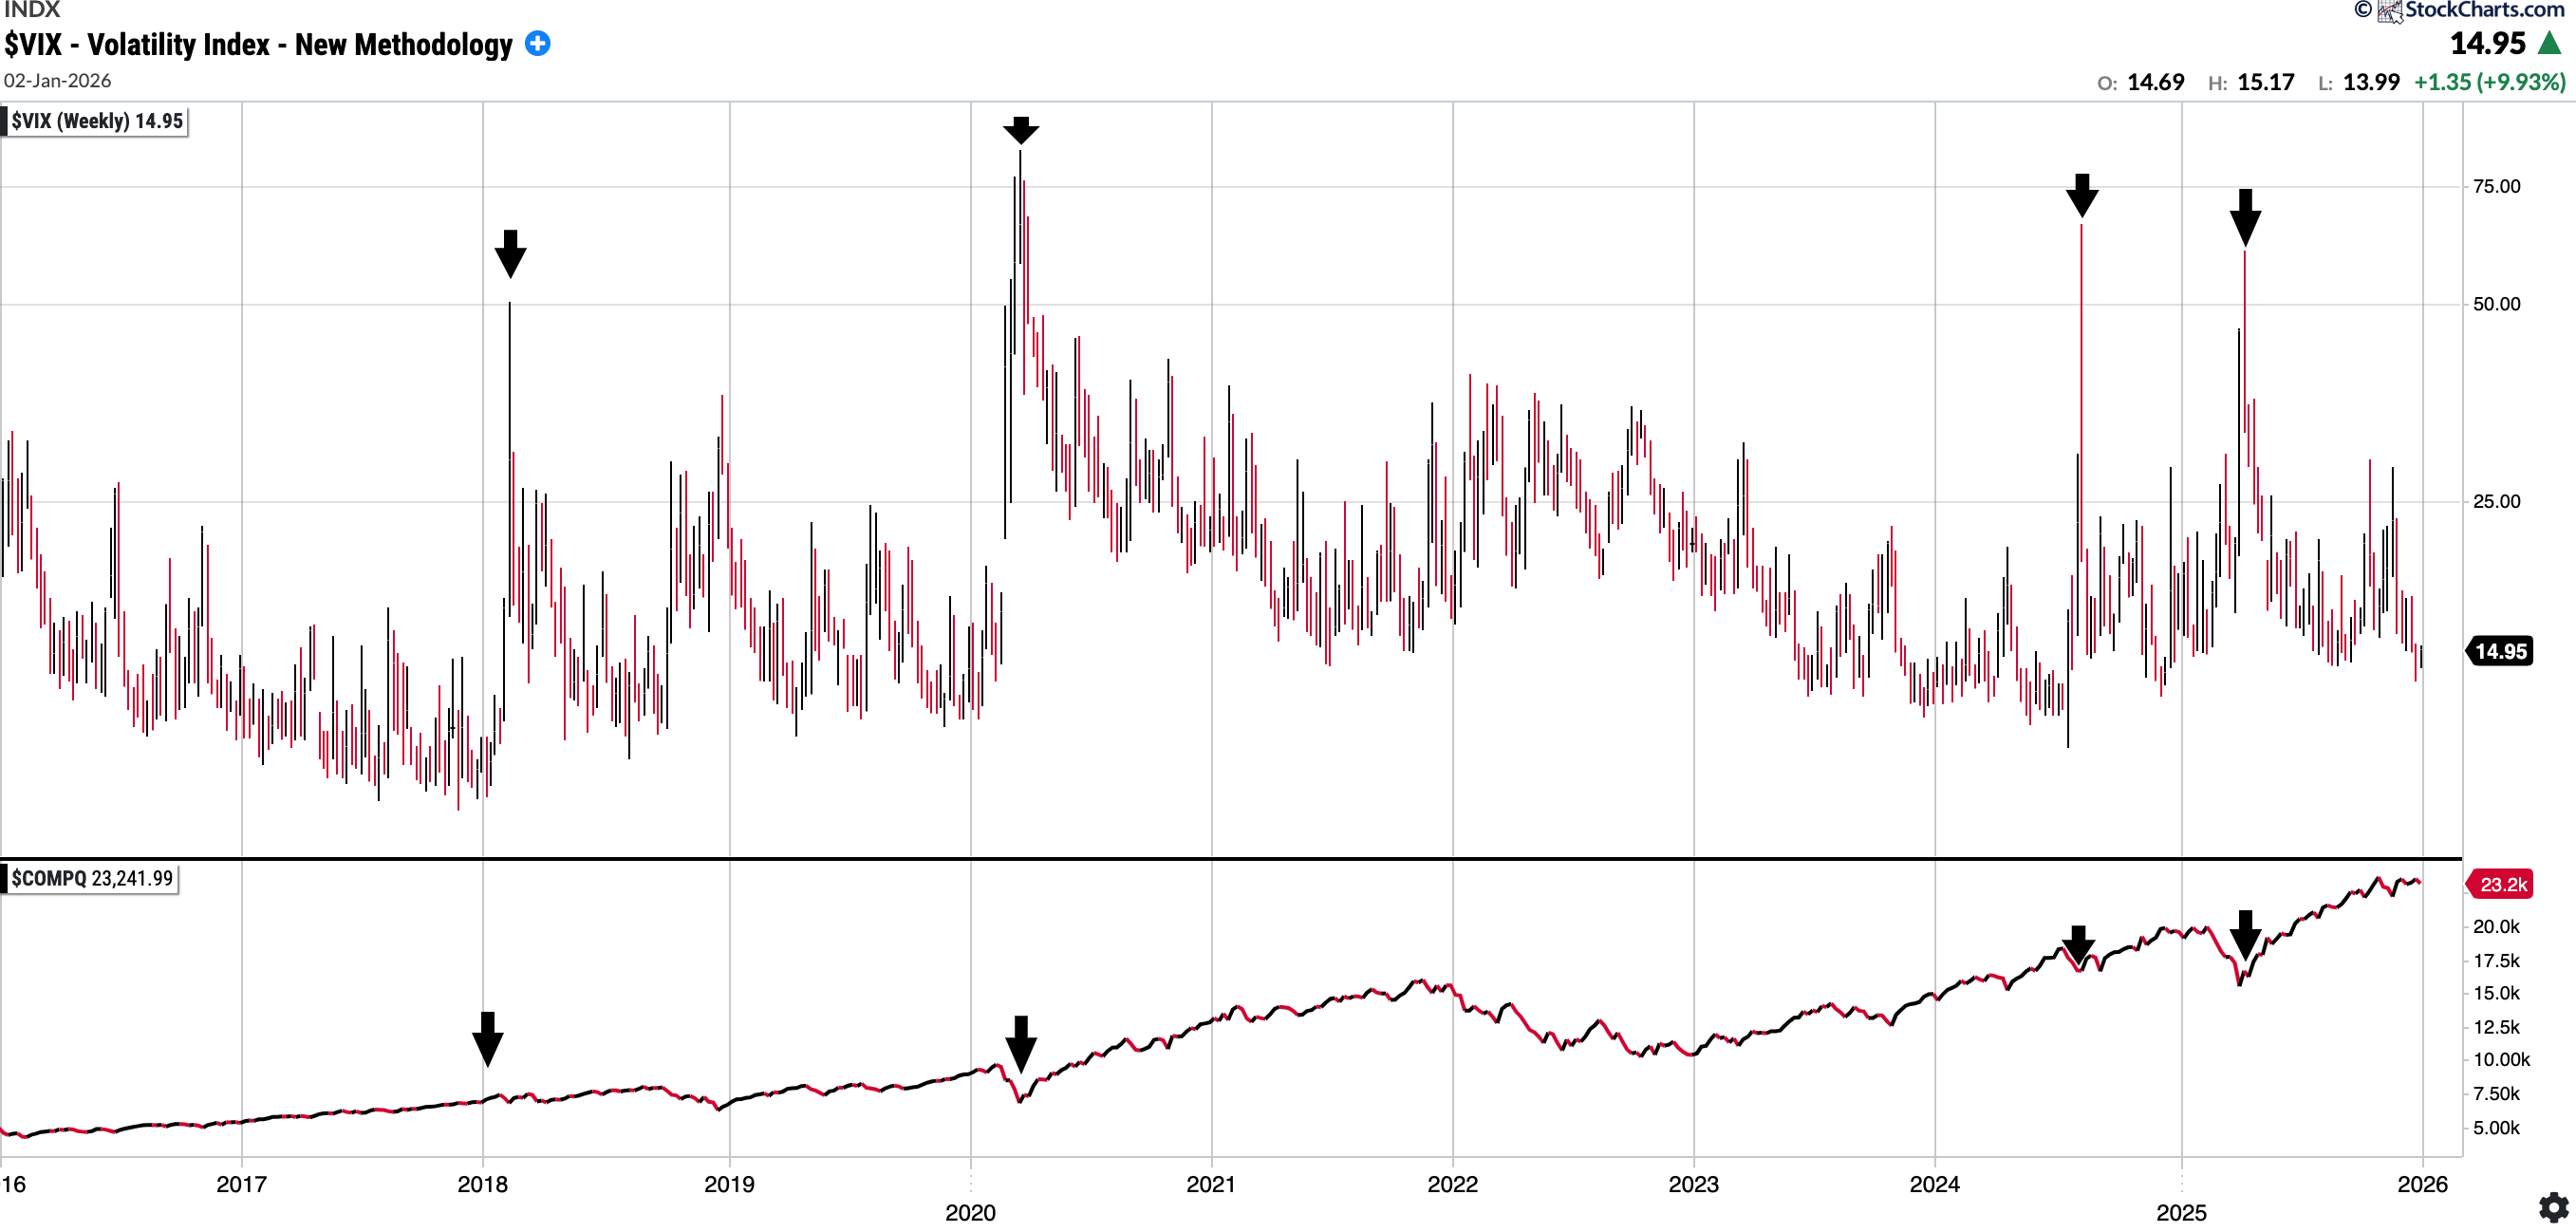
VIX: 14.95. That is in the lower range of where we have been in the last 12M. I have included a chart below showing the VIX over time and Nasdaq Comp underneath it: you can see extreme readings always have been a buying opportunity in medium term.
British Pound vs USD: 1.347 and up 8.94% over the last year! $ has weakened significantly in the last year
Fear and Greed Index currently reads 44 which is in the ‘Fear’ zone, supposedly.
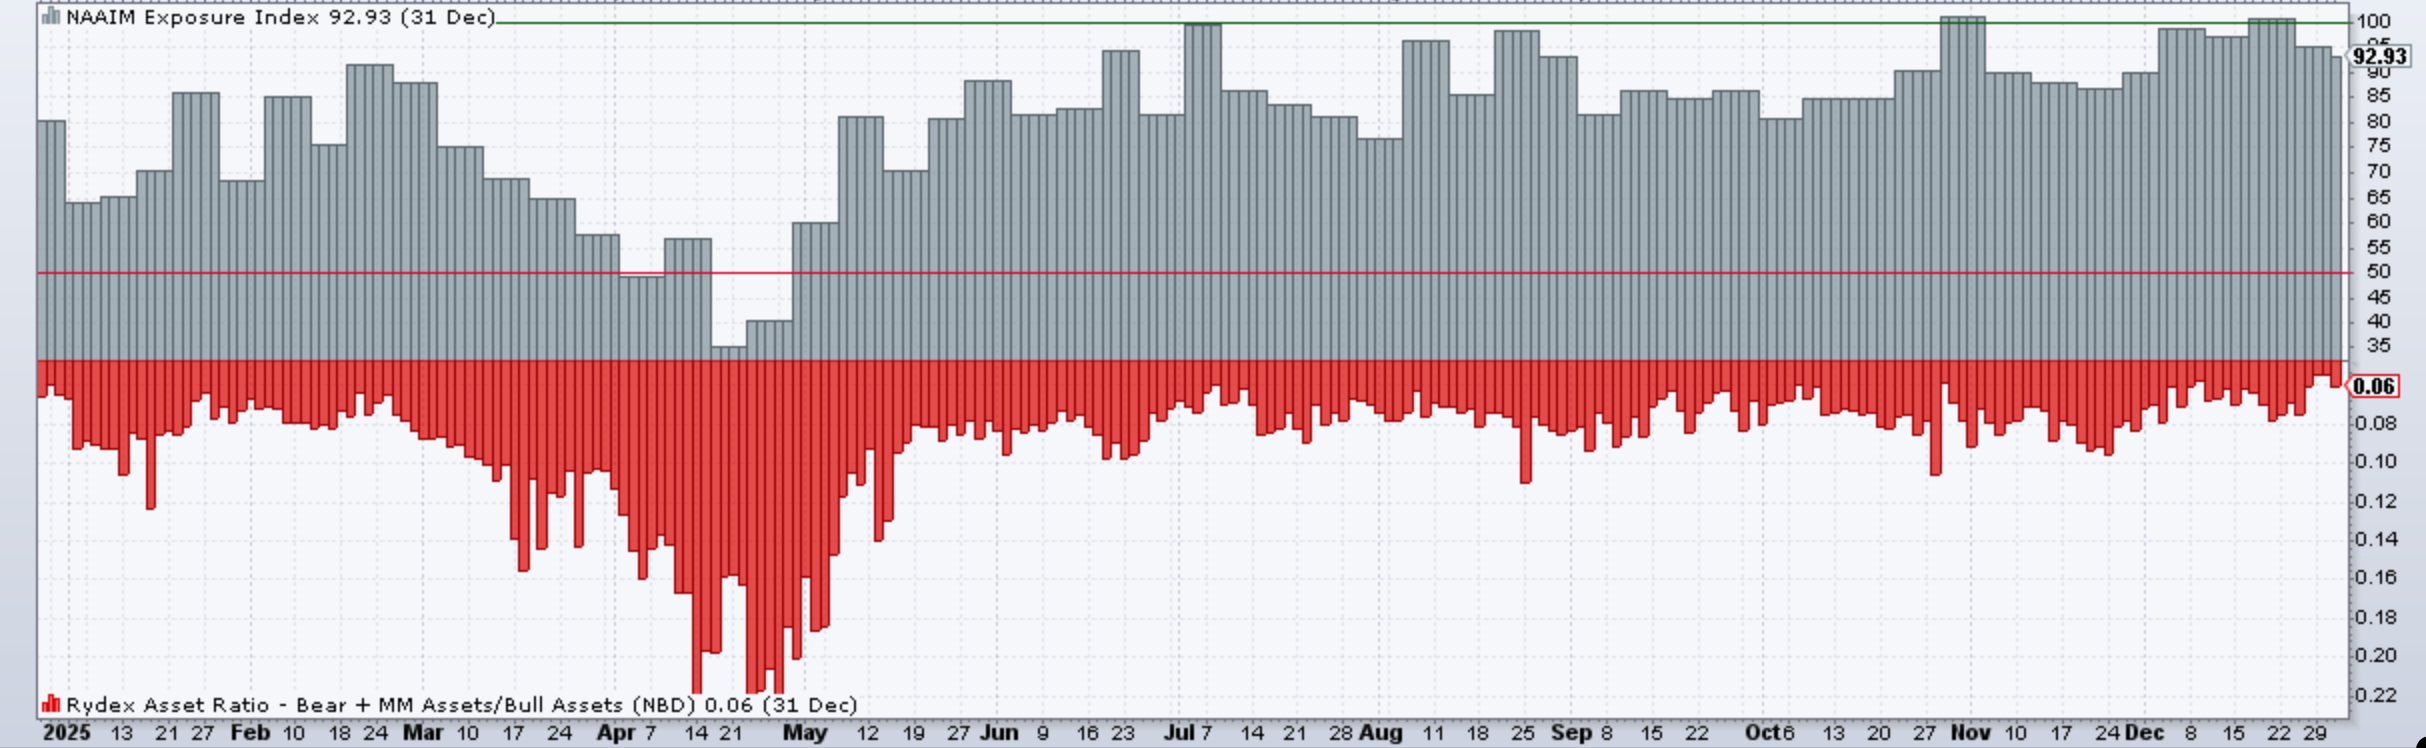
NAAIM Exposure Index is 92.93. This is higher than I expected. Note it did get into the low 30’s in April
SixSigmaCapital Swing trades in the last Month:
December was a reasonably quiet month for trades by design. I did partake in a few opportunistic swing trades and ‘traded around a core,’ but the primary focus was cleaning up the portfolio and looking ahead to next year. Please note that all trades are in common shares, not options.
Purchased CIFR early November, exited for +7% on 1st December
Repurchased CIFR on 3rd of December, sold for +12% 2 days later
Trade around a core: sold some META at 679.5 for +10% on the 4th of December on the pop subsequently to restructuring news.
Purchased IREN 8th of December, sold for +6% gains 1 day later. Re-tried IREN 10th of December, stopped out for 2% loss (so net, only +4% over the 2 trades!)
Added to core HROW position 7th November at 33.5, sold at 48.5 on 9th of December for +45%.
Added to core CLPT at 12.5 and 12.87 on 15th December, sold for +15% on the 16th of December.
Purchased CIFR at 13.97 on the 16th of December, exited for +9% on the 17th of December
Bought MSTR 22nd of December, stopped out for -6% 23rd December.
Bought UAMY 26th December, sold for +9% in one session.
Consolidated Performance across Accounts: YTD and since Inception of SixSigmaCapital (Equities Only)
2023: +94%
2024: +61%
2025: +57% YTD (As of 31st DecemberMarket close)
TWR since Inception of SixSigmaCapital is thus +390.37%. or a just under a 5x of the portfolio. The CAGR is ~69.89%.
TWR of S&P 500 in the same period is +86% or a 1.86x return.
SixSigmaCapital has achieved a +304% outperformance in that time period.
I remain pleased overall, as these returns were achieved without margin, options, or leverage which means risk adjusted these results are very sound. Furthermore, all moves were disclosed in real time to premium members.
Please also review my 2025 performance recap below for more of my reflections:
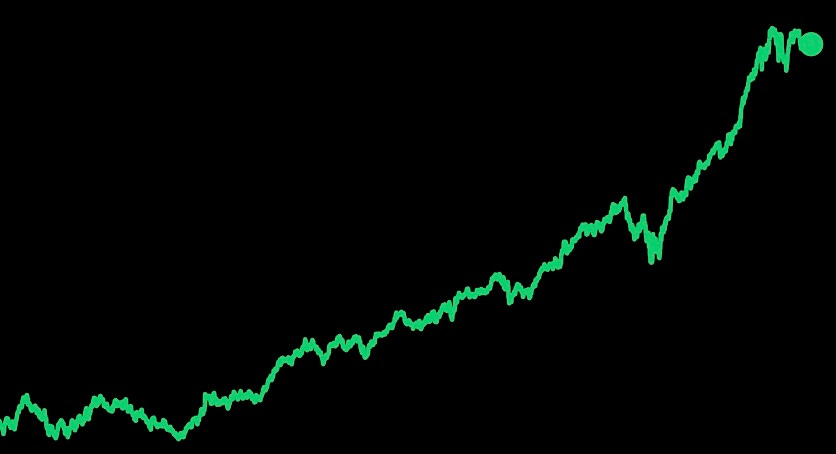
Equity curve since switching to my current brokerage in the last few years is below:
Featured Quote:
Given Warren Buffet is finishing up at Berkshire CEO, it feels right to feature him this week. One of my favourite quotes from him is as below:

Current Positions in Size Order with Cost Basis:
Cash: 11.8%
