
Monthly Portfolio Update: +400% since inception of SSC
Market Thoughts | +400% Performance Since Inception | 2026 Position Plans & Outlook.

I hope you are well. Below, we provide market commentary and an in-depth portfolio update.
Format for what is covered in this Monthly Portfolio Update:
Market Thoughts
Indices Review
Key Indicators
SixSigmaCapital Performance: YTD and since Inception
Featured Quote
Current Positions in size order
Closing Thoughts
If it is your first time here, ensure to check out what SixSigmaCapital readers are saying below:

For all readers a reminder that a premium subscription includes:
Favourite set-up Ideas, Market Memos plus Full archive
Live Portfolio updates (All Buys and Sells) in Subscriber only Channels
Monthly in depth portfolio & performance updates
Discord access for AMAs and live trading account updates.
We have currently extended a one time discount on the annual membership which expires on the 6th of Feb. This saves approximately 30% compared to the monthly rate and is more than 45% cheaper than the Substack app price. If interested then consider upgrading to a premium subscription via the link below:
Market thoughts:
Equity markets had another volatile month though the Dow, S&P 500, and Nasdaq Composite posted +1.05%, 1.17% and 0.97% respectively.
Not to sound like a broken record, but my perspective remains that there is enough to be concerned about with regard to the US economy and equity markets over the medium term. Despite the geopolitical and macroeconomic uncertainty over the last year especially, markets have continued to exhibit remarkable resilience, and we have continued to climb the "wall of worry."
Things have changed a little since the 10/10 liquidation event; in November, we saw sharp sell-offs, with more than 60% of equities falling into bear market territory at one point. The AI and cryptocurrency spaces took the brunt of the selling, while select mega-caps, Healthcare, and Utilities caught a bid. This remained the story for much of December. To start the new year, we did get a rally, mostly in EM, Memory, Defense, Precious Metals, and miscellaneous sectors like space.
The price action in precious metals has been especially alarming; first they went parabolic, and today alone silver crashed 37% peak to trough in less than 24 hours. There have been multiple six-sigma events (pardon the pun) in the last couple of weeks in the precious metals space. An estimated $7.4 trillion of wealth in gold and silver was wiped out just today. Meanwhile, the US dollar is rapidly depreciating and sits at its weakest point since spring 2021. Further, the markets reacted sharply to the announcement of Warsh as the new Fed Chair, who is perceived as hawkish. In short, markets are not healthy.
On the tariff front, there was progress with the deals reached with Japan and the EU last year. A deal with China remains outstanding, though the meeting between Trump and Xi resulted in a one-year trade truce with progress on several fronts: tariffs, fentanyl, rare earth minerals, and the overall stabilisation of economic ties. Of course, Trump has been threatening further tariffs almost every week, whether on India, Canada, or countries that do business with nations like Iran.
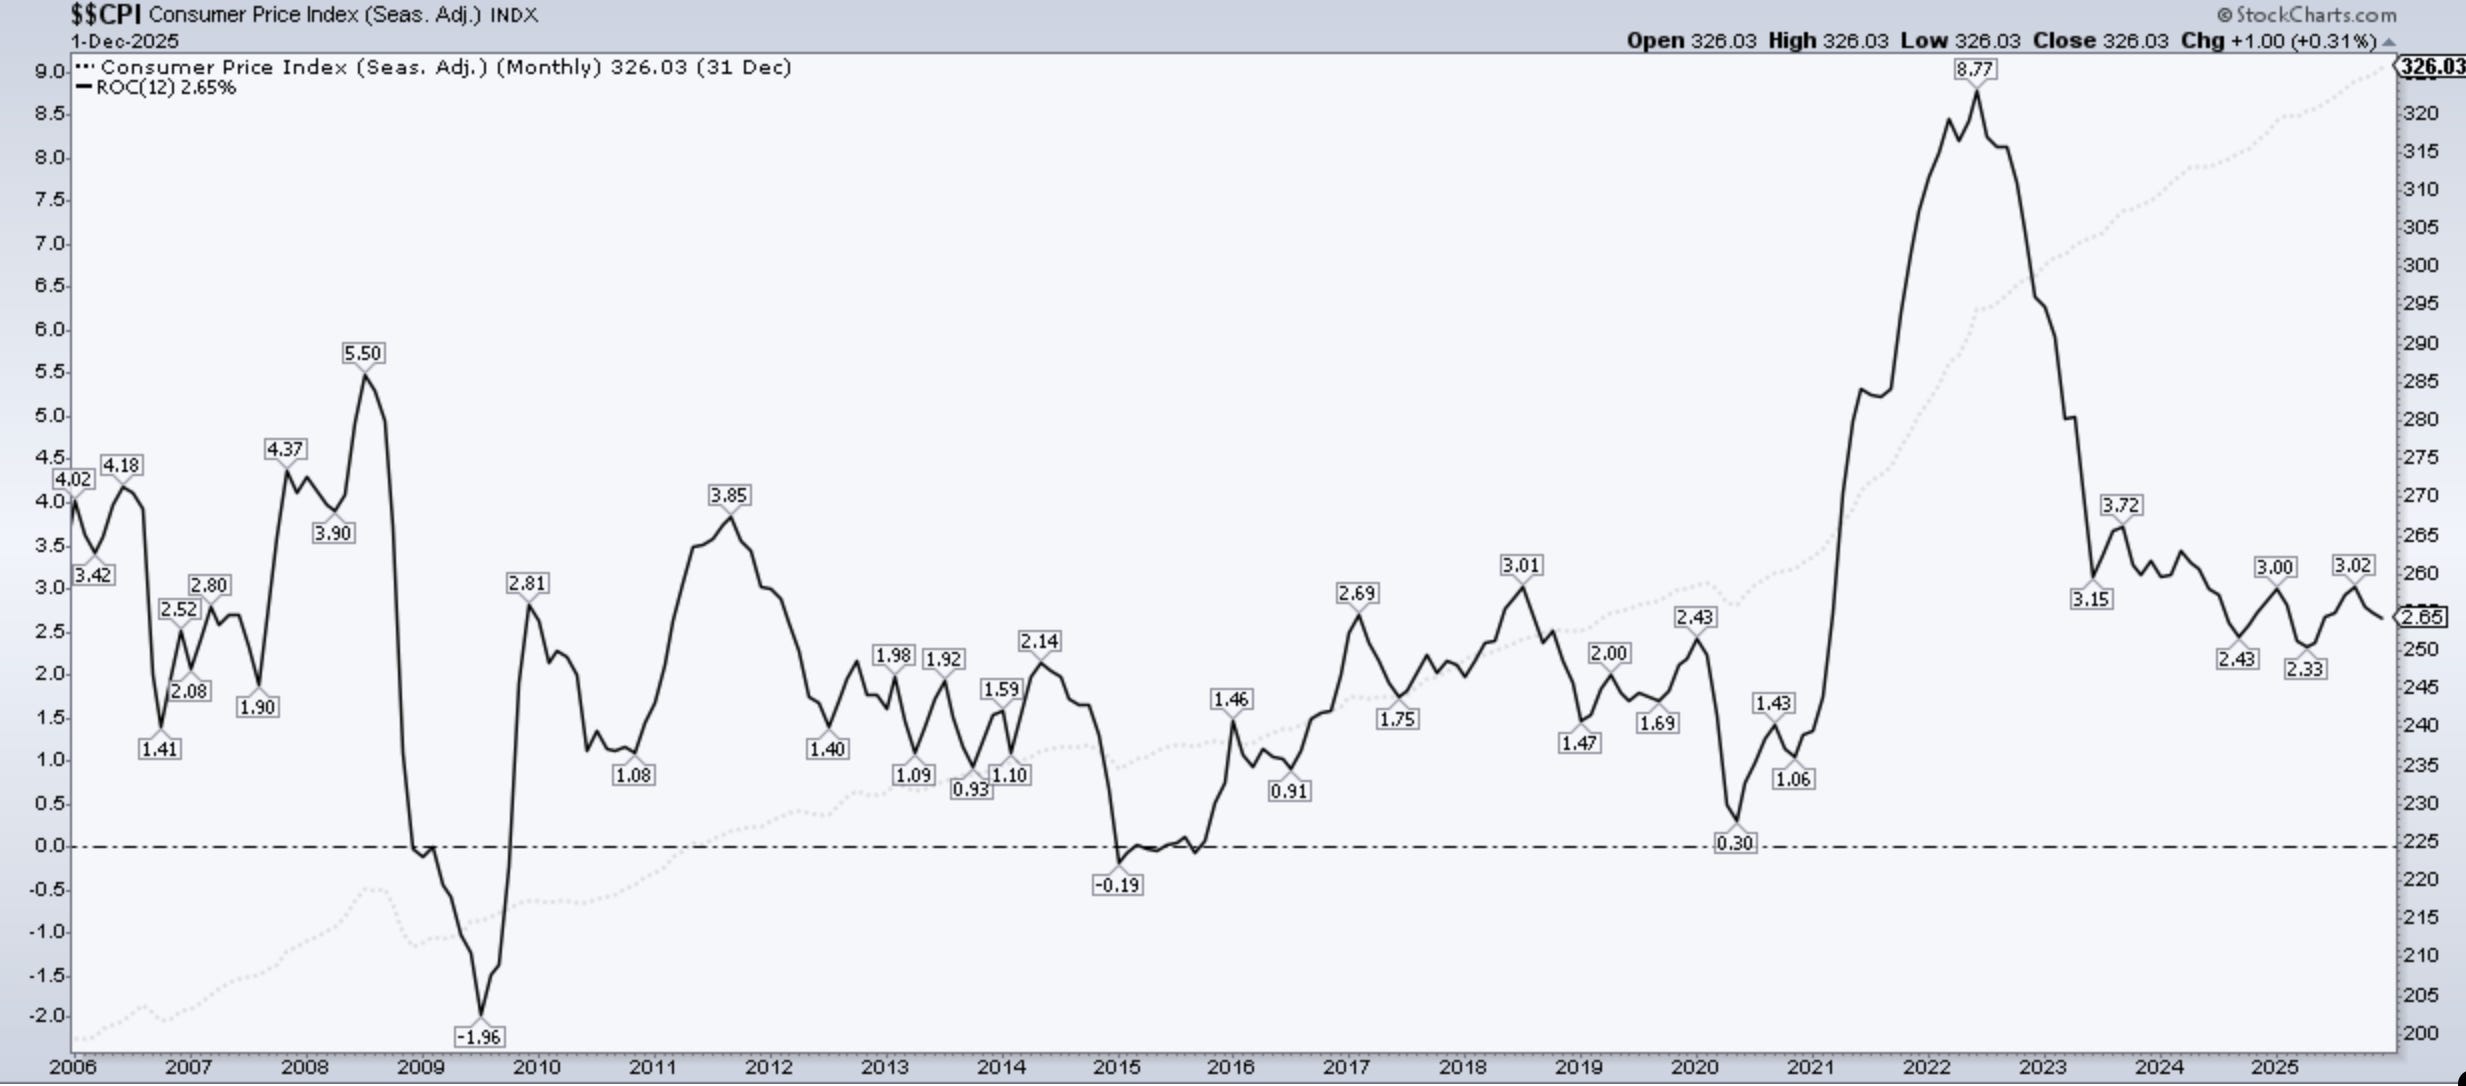
On inflation, the December 2025 CPI data (released Jan 18, 2025) came in as expected.
Headline CPI rose 2.7% YOY, expectations were 2.7% YOY. Rose 0.2% MOM.
Core CPI increased 2.6% YOY, and 0.2% MOM.
Core CPI inflation came in slightly below forecasts.
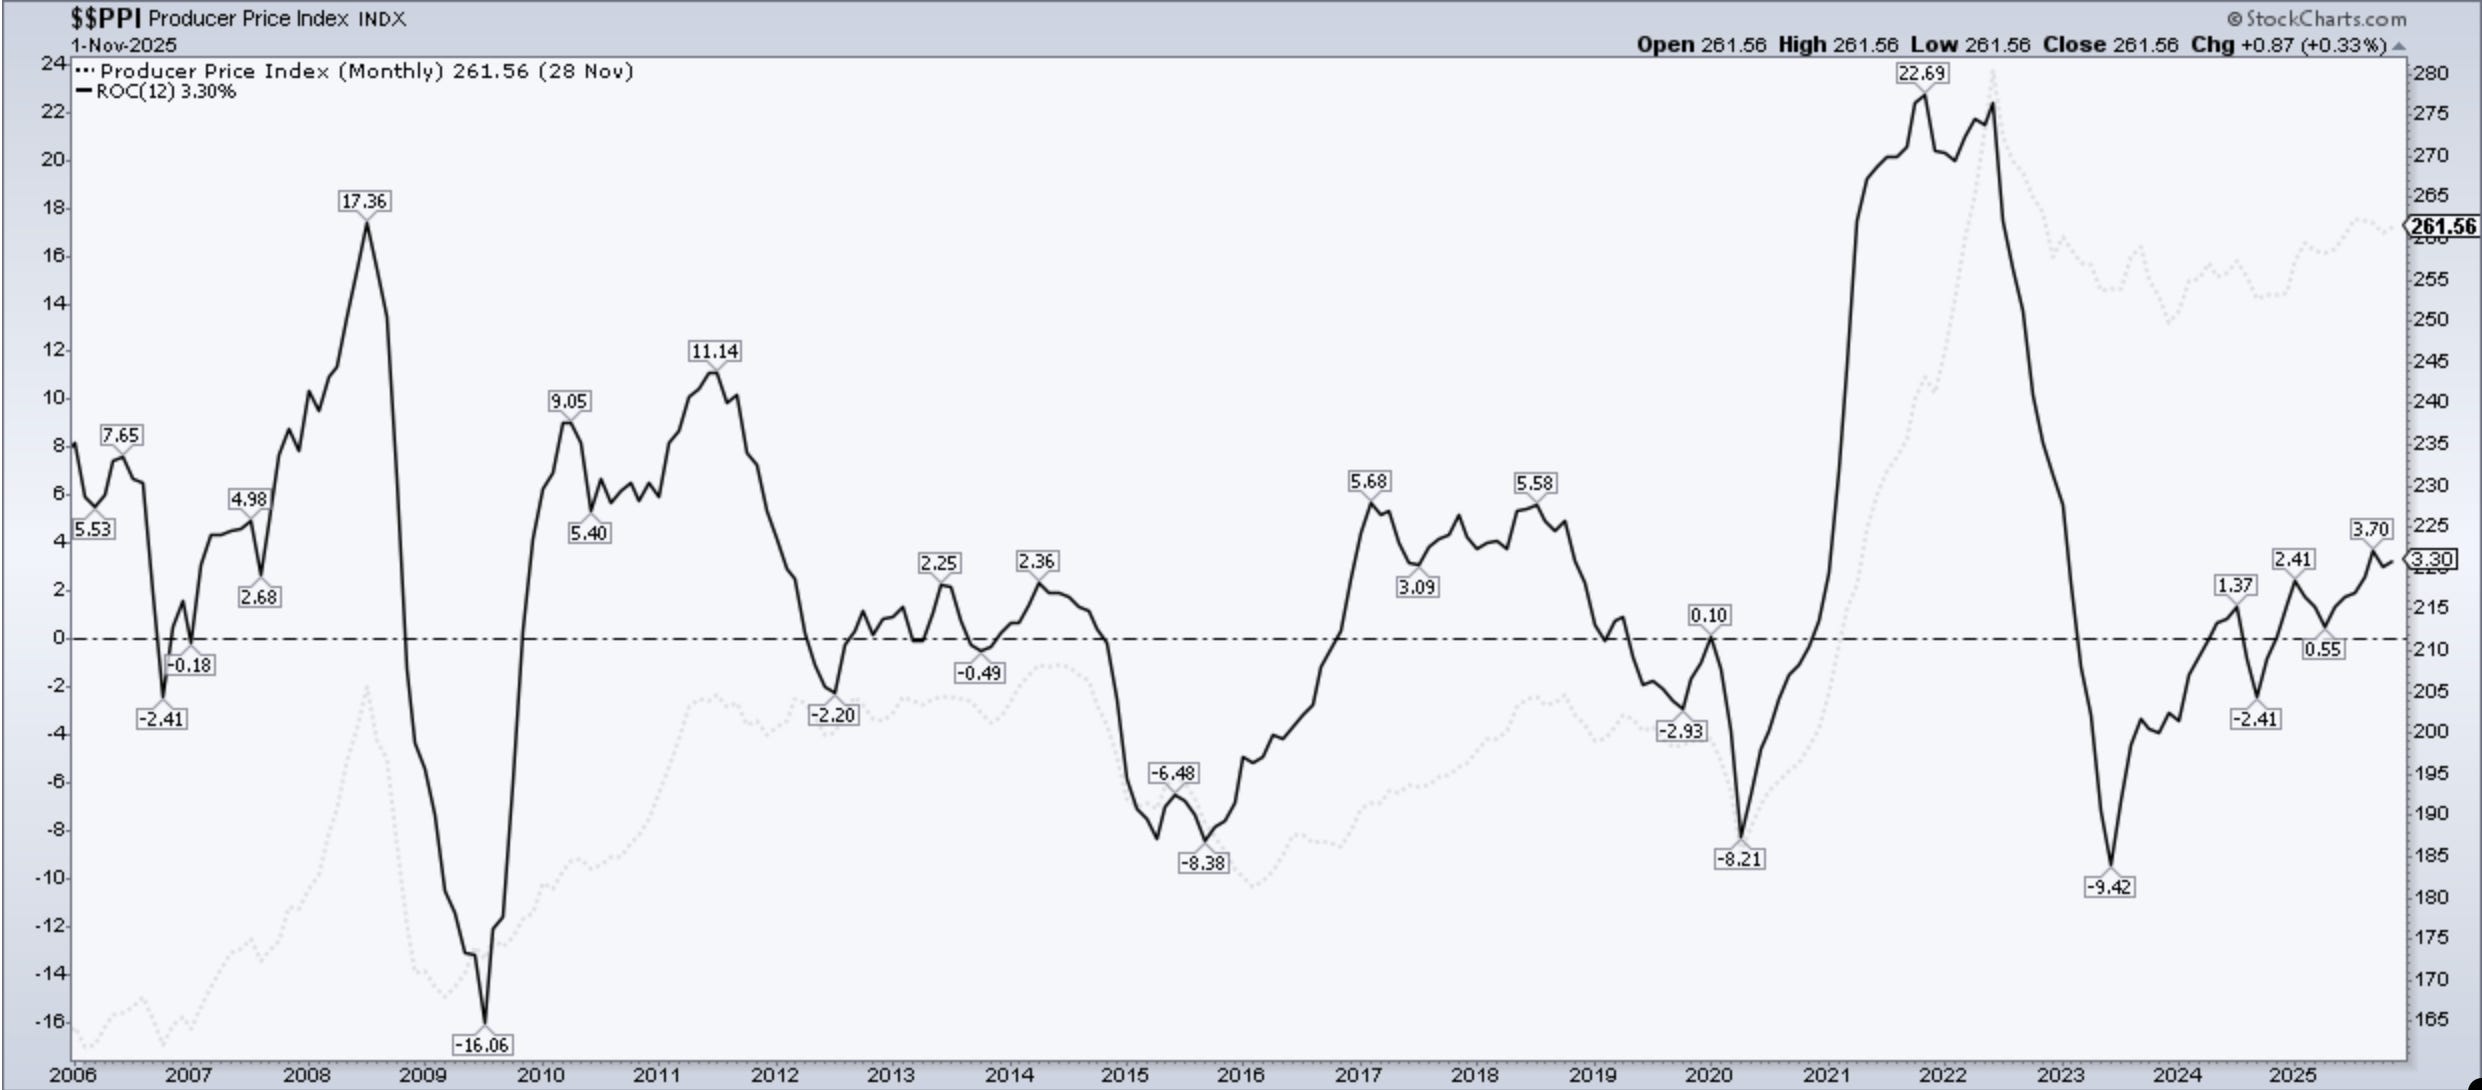
Below I have included charts showing the trend for both CPI and PPI:
At the FOMC meeting on January 27–28, 2026, the FOMC decided to hold interest rates steady, marking a pause after three consecutive 25-basis-point cuts in late 2025. The target range for the federal funds rate remains at 3.5% to 3.75%.
The FOMC’s latest economic assessment describes an economy expanding at a solid pace, though it faces a nuanced labor market and persistent inflationary pressures. While job gains have remained low, there are signs that the unemployment rate is beginning to stabilise. Despite this progress, inflation continues to hover above the 2% longer-run target, contributing to an economic outlook defined by elevated uncertainty. Consequently, the Committee remains highly attentive to risks on both sides of its dual mandate - balancing the pursuit of maximum employment with price stability.
In the post-meeting press conference, Jerome Powell described the economy on a “firm footing”, noted that current policy is not significantly restrictive and emphasised data-dependent, meeting-by-meeting decisions. He highlighted solid growth, stabilising labor markets, and no urgency for immediate further cuts (I agree).
With regards to the PCE price (Fed’s preferred metric), November ‘25 data showed Headline and Core PCE both printing in line with estimates at 2.8% Y/Y. Both metrics rose 0.2% MOM, matching consensus expectations. Core PCE has proven notably sticky throughout the year, remaining range-bound between 2.7% and 2.9%.
Over the last few months, I have begun to slowly shift my portfolio away from what’s been working toward what I expect to work in 2026 and beyond. I discussed some of my favourite ideas in my post, ‘Stocks and Setups I Like Heading into 2026,’ below which I highly recommend revisiting and is free to read:

Indices:
S&P 500:
Currently trades at 6,939.03 (1.17% YTD)
It is 1.19% above the 50SMA. RSI is 53.36
Trading at 25.69x trailing earnings and 22.18x forward earnings (per WSJ)
Nasdaq Composite:
Currently trades at 23,461.82 (0.97% YTD)
It is 0.56% above the 50SMA. RSI is 49.43
Trading at 32.87x trailing earnings and 25.89x forward (per WSJ)
Key Indicators:
10 Year T-Note: 4.241. It has decreased by 6.01% over the last year.
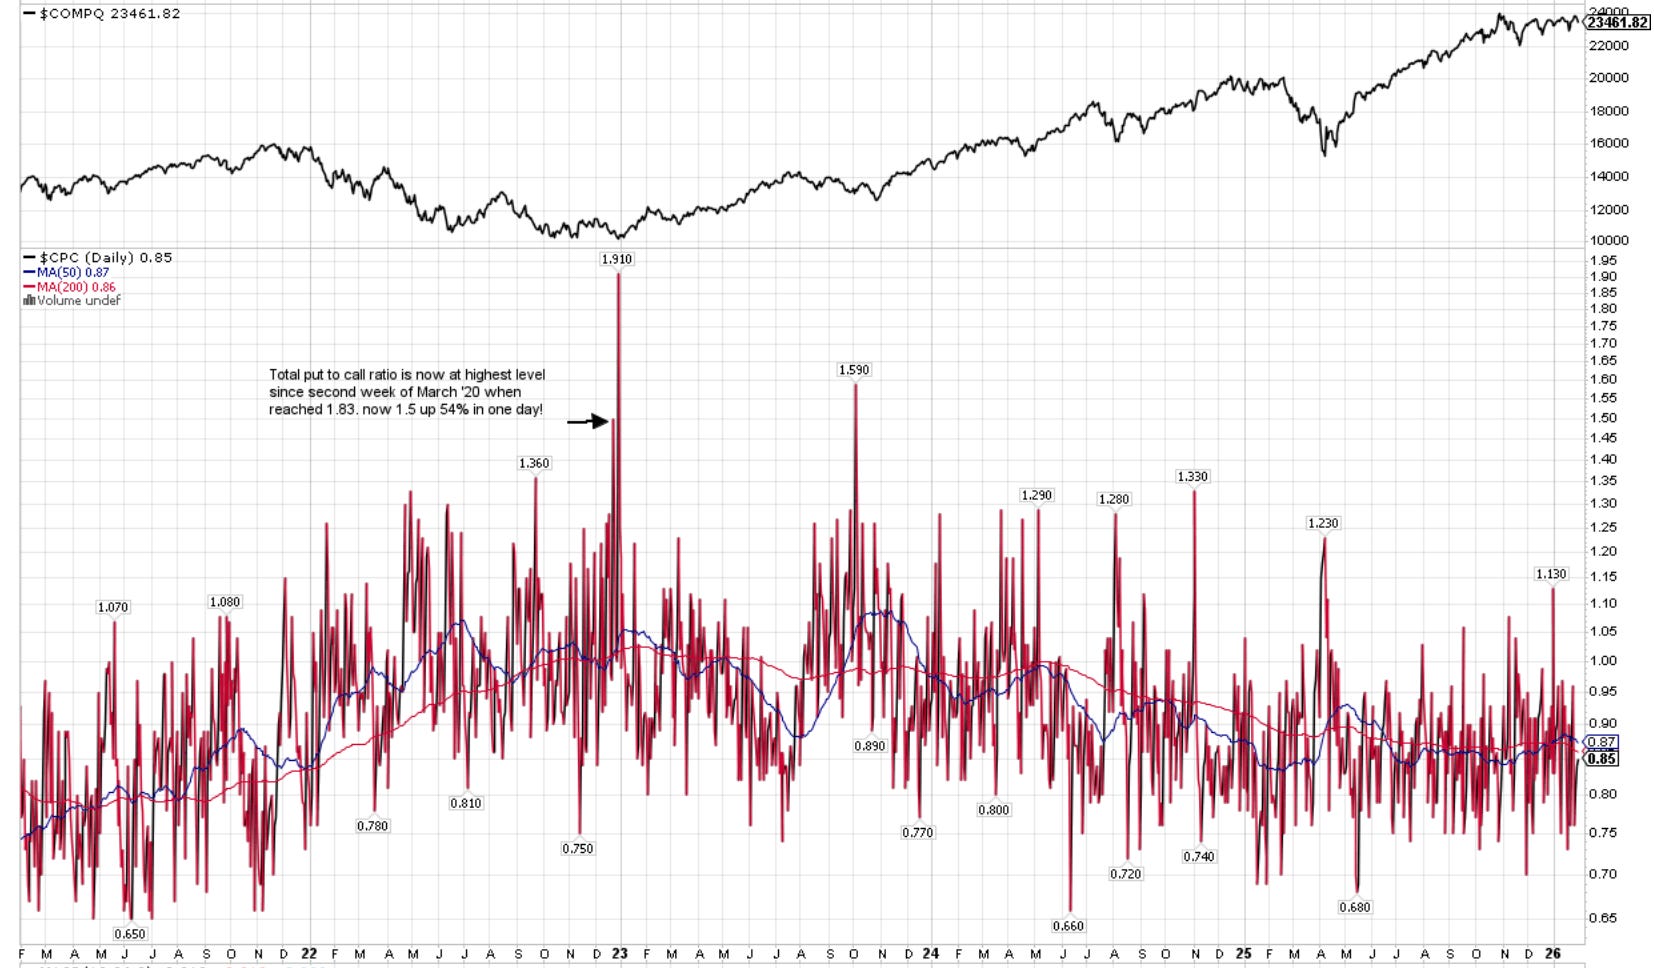
CPC (Put to Call Ratio) is 0.85. Note >1 can indicate Fear and >1.5 can be Extreme.
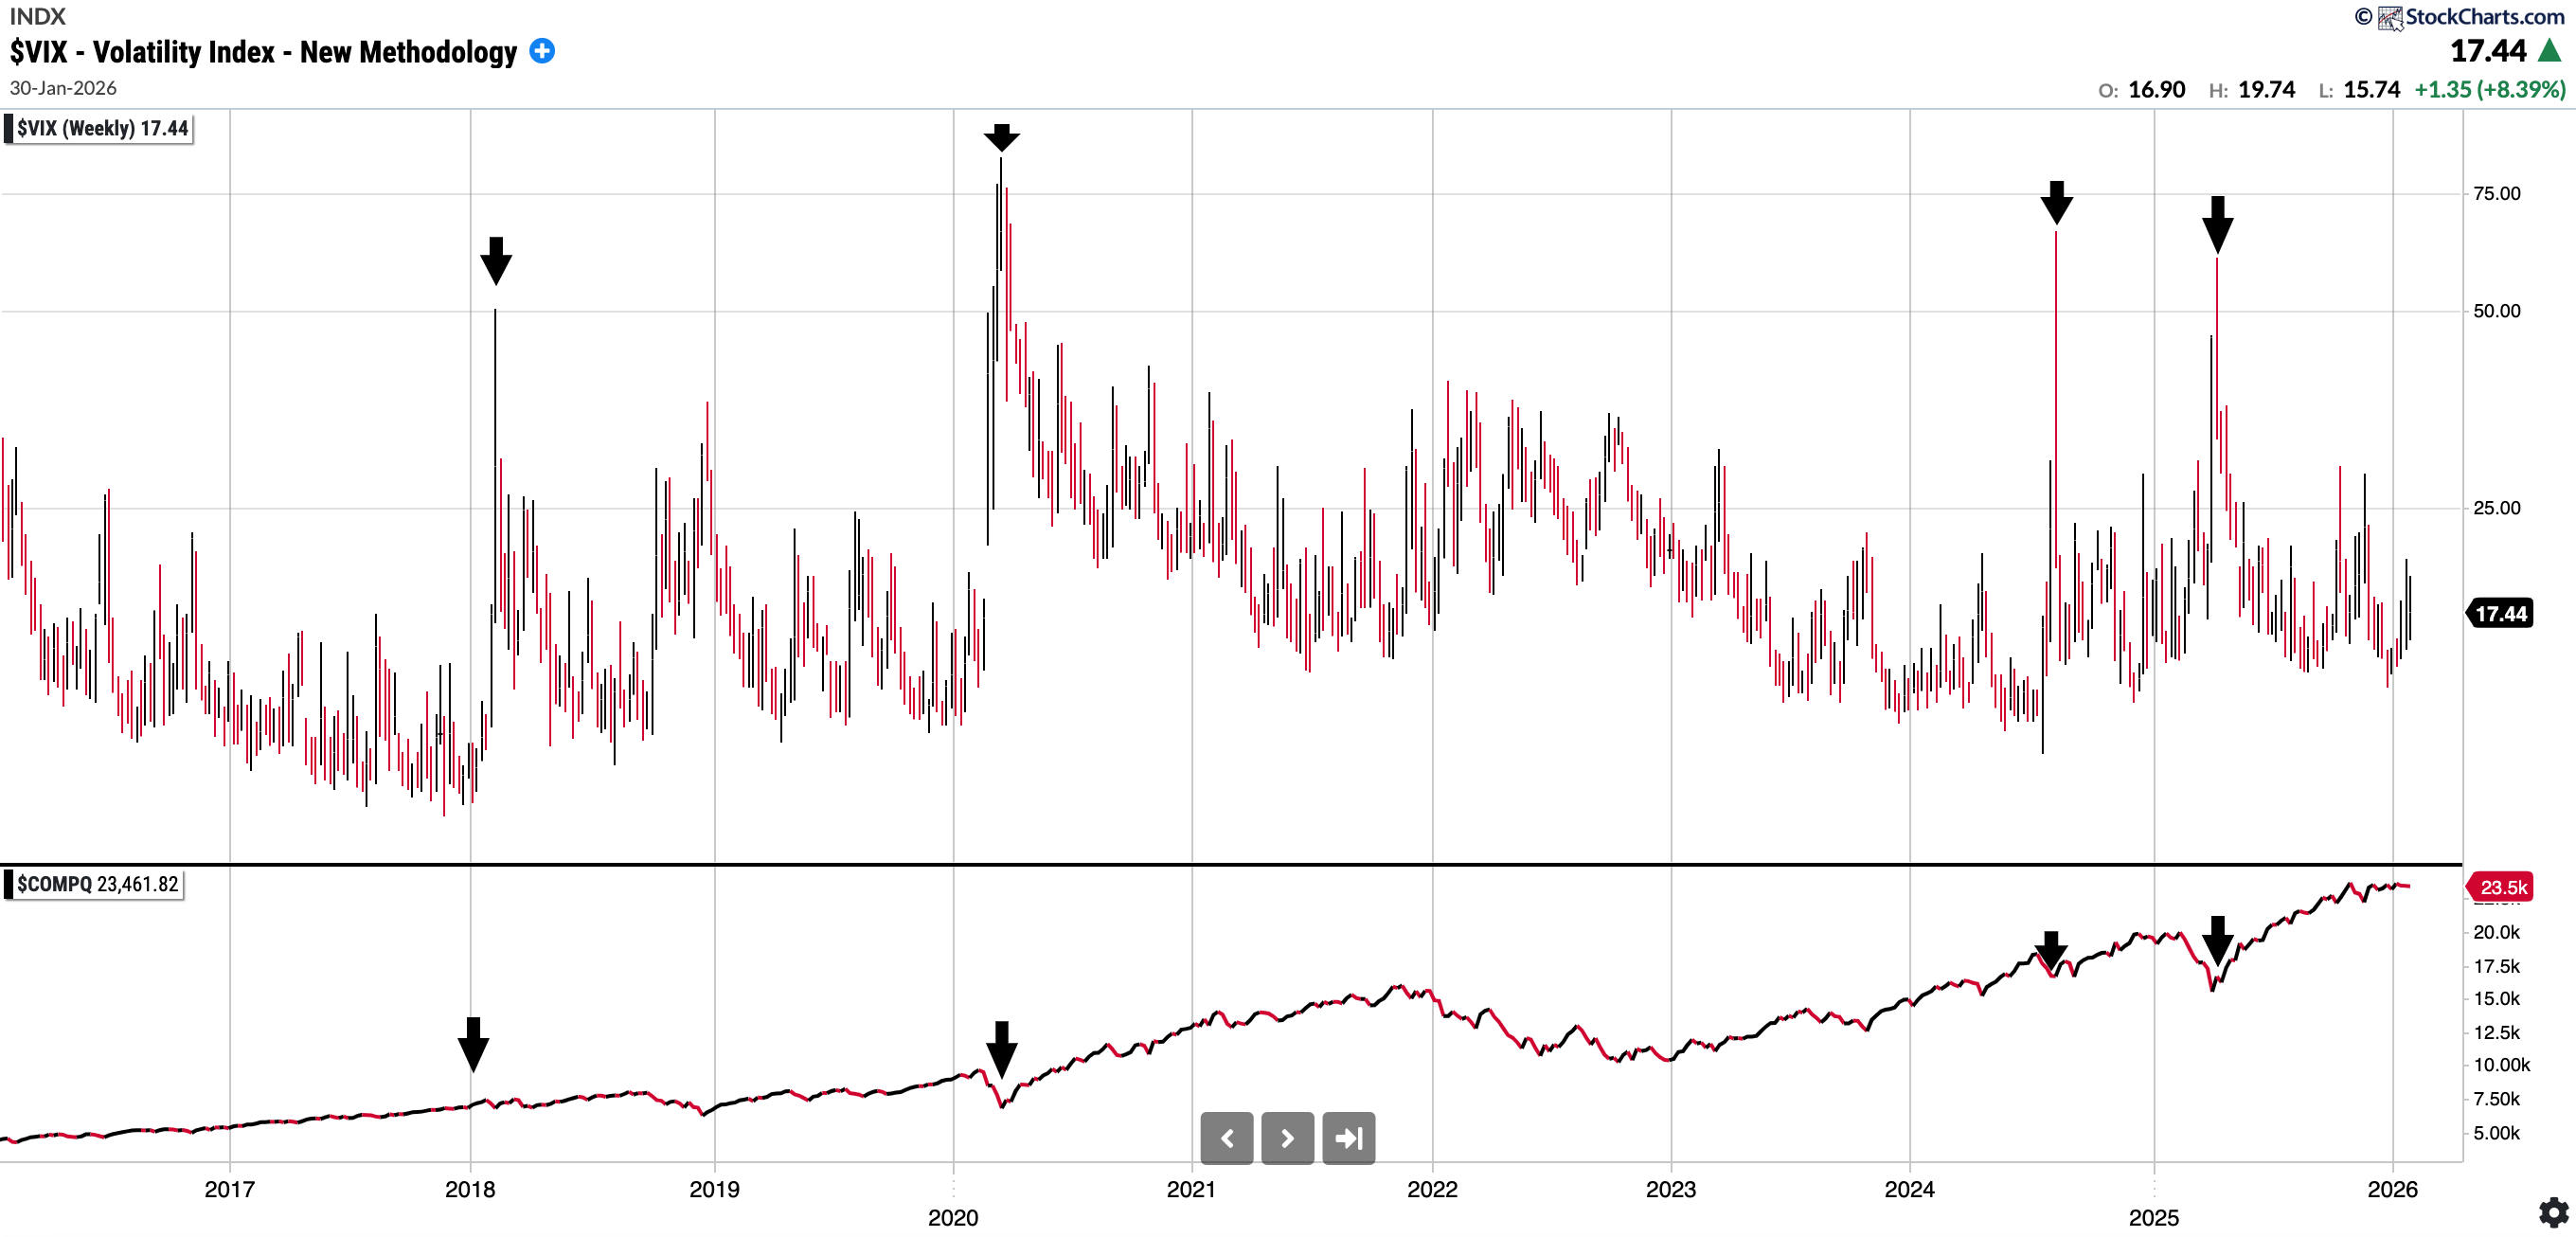
VIX: 17.44. That is in the lower range of where we have been in the last 12M. I have included a chart below showing the VIX over time and Nasdaq Comp underneath it: you can see extreme readings always have been a buying opportunity in medium term.
British Pound vs USD: 1.368 and up 9.82% over the last year! $ has weakened significantly in the last year
Fear and Greed Index (CNN) currently reads 58 which is in the ‘Greed’ zone.
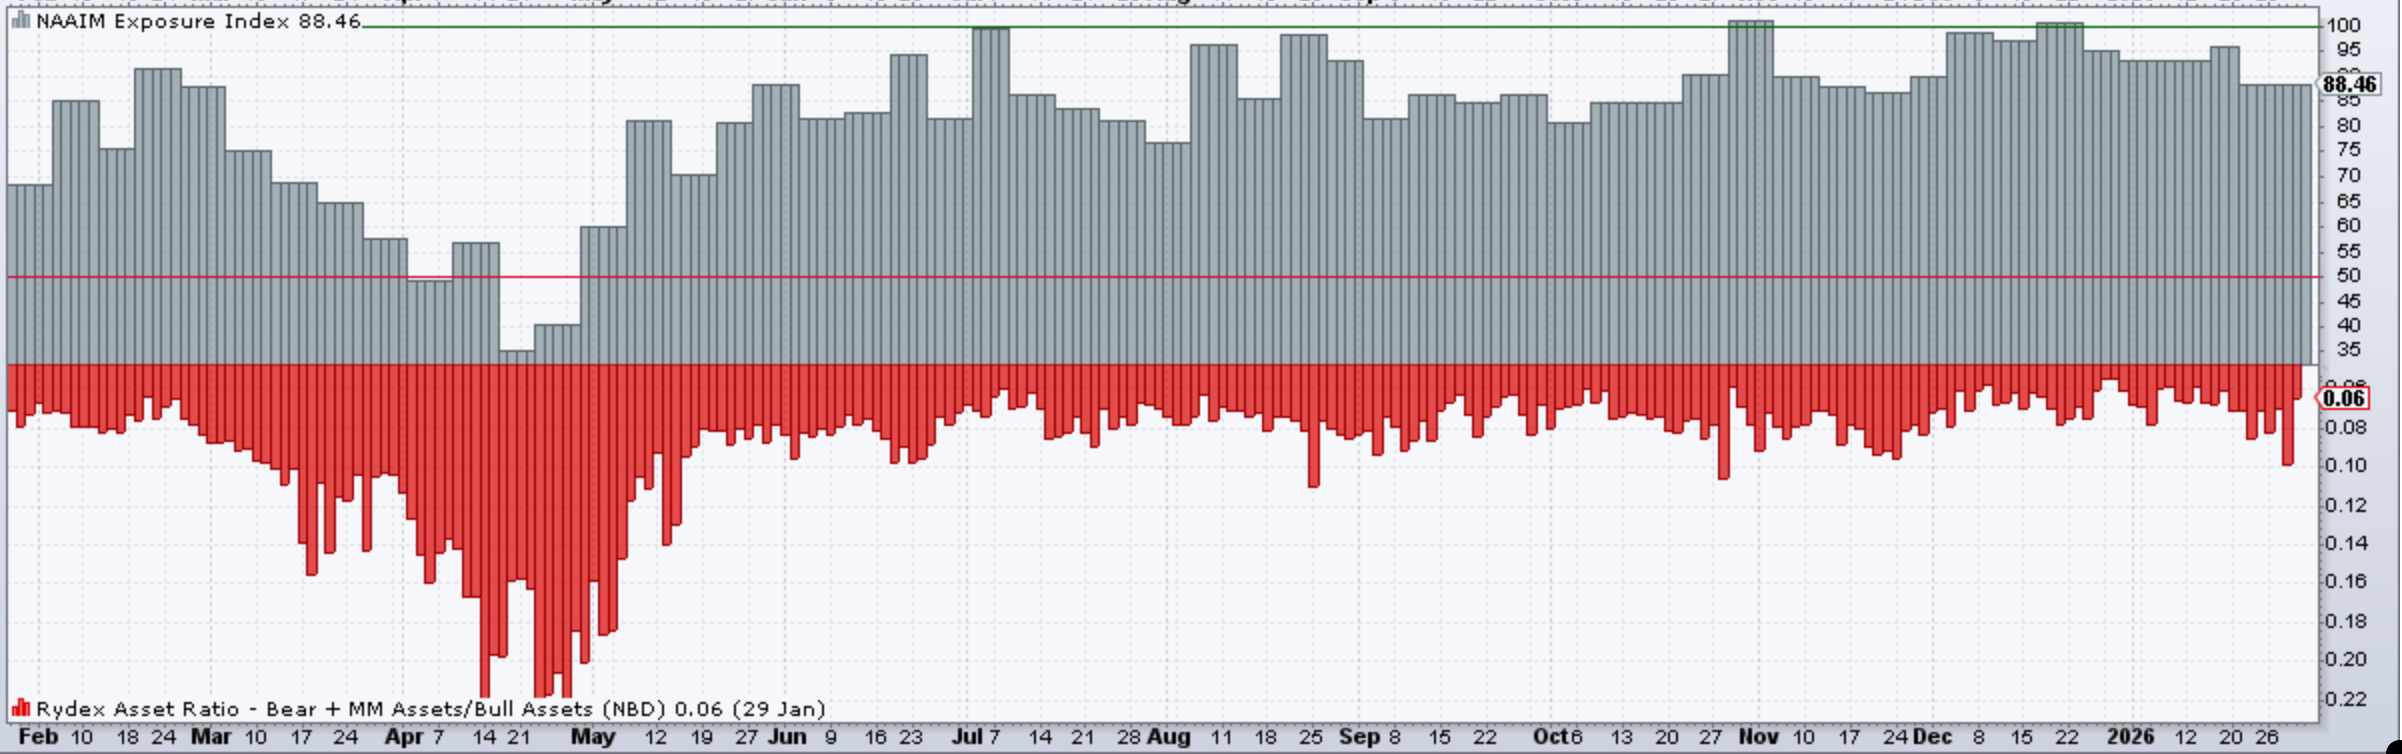
NAAIM Exposure Index is 88.46. Note it did get into the low 30’s in April (!)
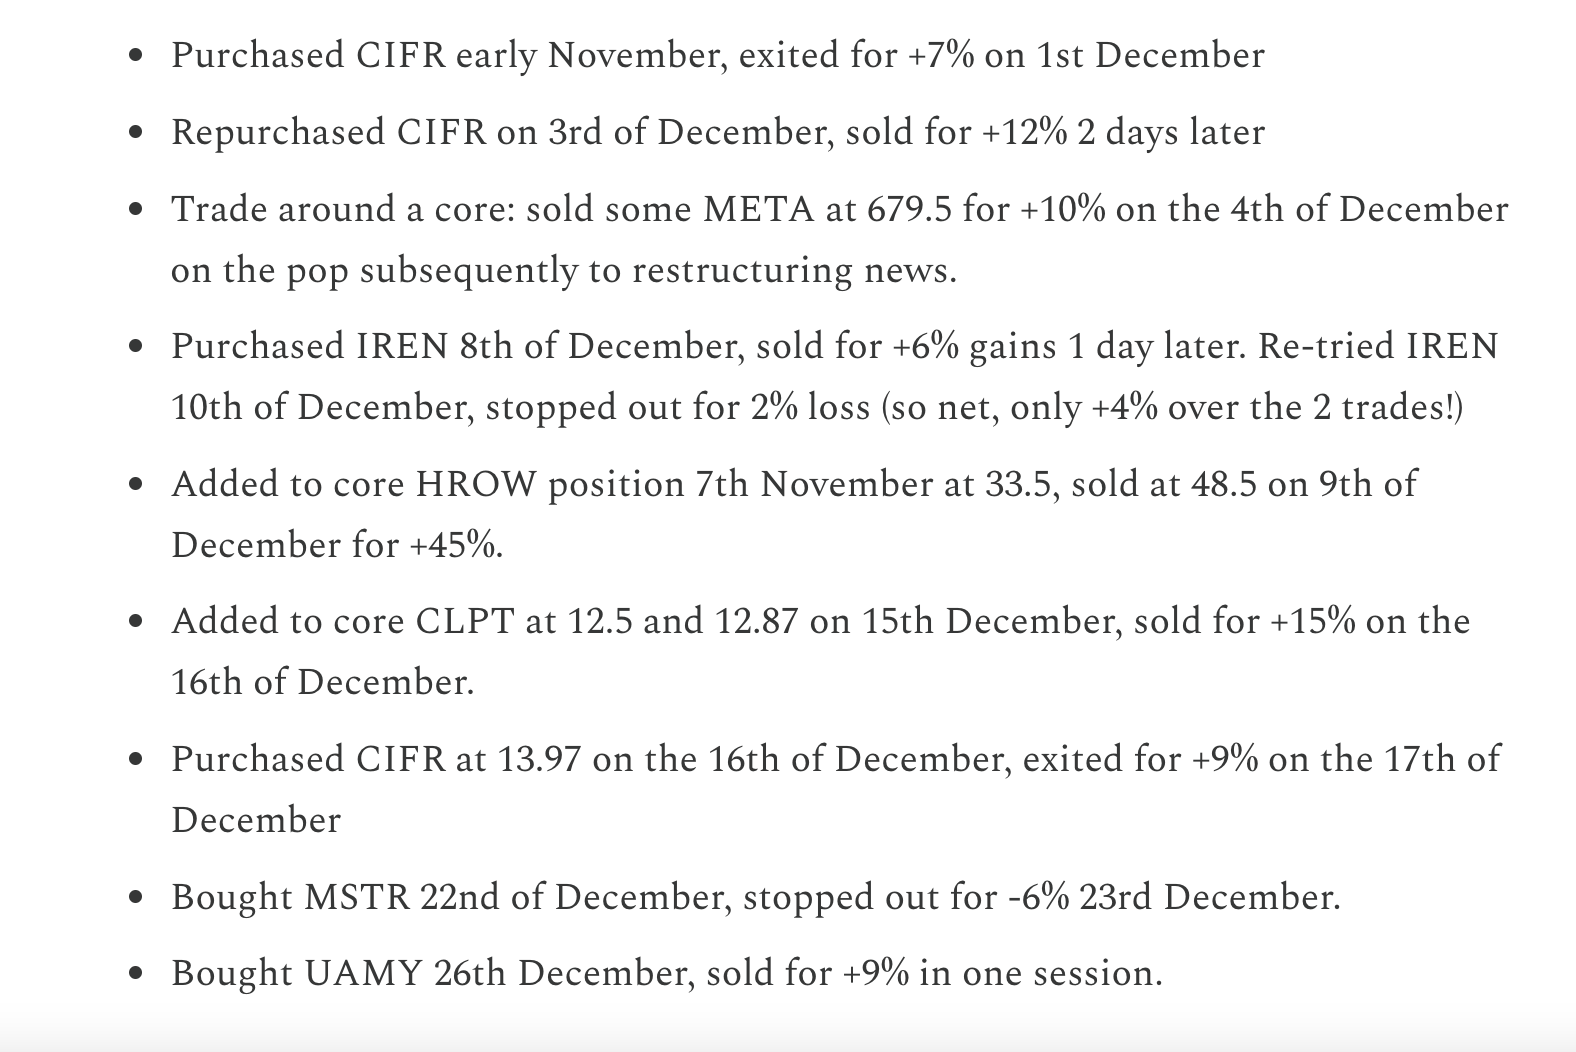
SixSigmaCapital Swing trades in the last Month:
I will no longer be doing recaps of swing trades in the same fashion as before (see below).
I have, however, opened a dedicated trading account, which started as approximately 10% the size of my investment account, for trading activities.
The account is managed with a purely trading mindset; it consists mostly of common shares, although I have used select options strategies such as selling puts and buying deep ITM LEAPS as stock replacement strategies.
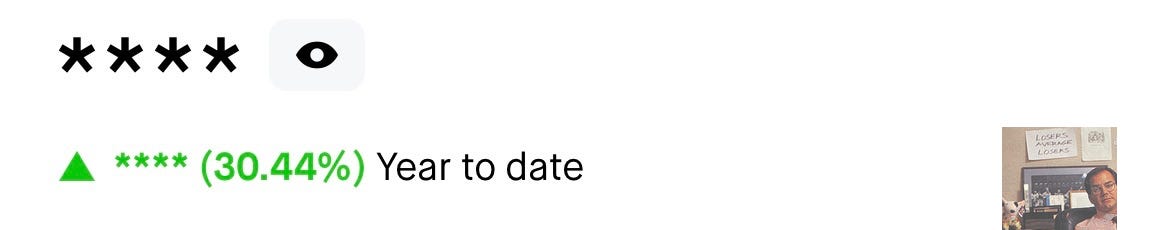
My YTD performance is +30.44%.
Consolidated Performance across Investment Accounts: YTD and since Inception of SixSigmaCapital (Equities Only)
2023: +94%
2024: +61%
2025: +57%
2026: 2.29%
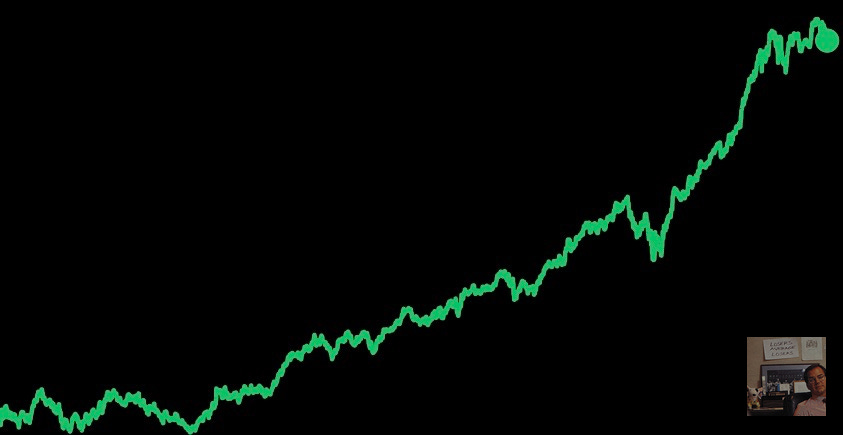
TWR since Inception of SixSigmaCapital is thus +401.6% or a just over a 5x of the portfolio. The CAGR is ~68.75%.
TWR of S&P 500 in the same period is ++88.89% or a 1.89x return.
SixSigmaCapital has achieved a +312% outperformance in that time period.
I remain pleased overall, as these returns were achieved without margin, options, or leverage which means risk adjusted these results are very sound. Furthermore, all moves were disclosed in real time to premium members.
Please also review my 2025 performance recap below for more of my reflections:
Equity curve since switching to my current brokerage in the last few years is below:
Trading Account performance as above is +30.44%. Therefore, blended performance would be close to 6% YTD however I plan to keep reporting them separately)
Featured Quote:
“Successful investing is about managing risk, not avoiding it” Ben Graham
Current Positions in Size Order with Cost Basis:
Cash: 12.77% (Pounds Sterling)
