
Preview of the Week Ahead
W/C Feb 23, 2026

Hope you all are having a good weekend. Below we will be previewing the upcoming week and providing a portfolio update as usual.
Format for what is covered in this weekly preview:
A look at the indices
Key upcoming economic events
Upcoming earnings reports
Charts
Notable portfolio changes from the previous week
Current Portfolio Holdings (Position size, cost basis, and commentary on each holding regarding the intended holding period and any planned activity)
Closing Thoughts
I highly recommend checking out the latest Monthly Portfolio and Performance Update below (TWR +400% since Jan ‘23)

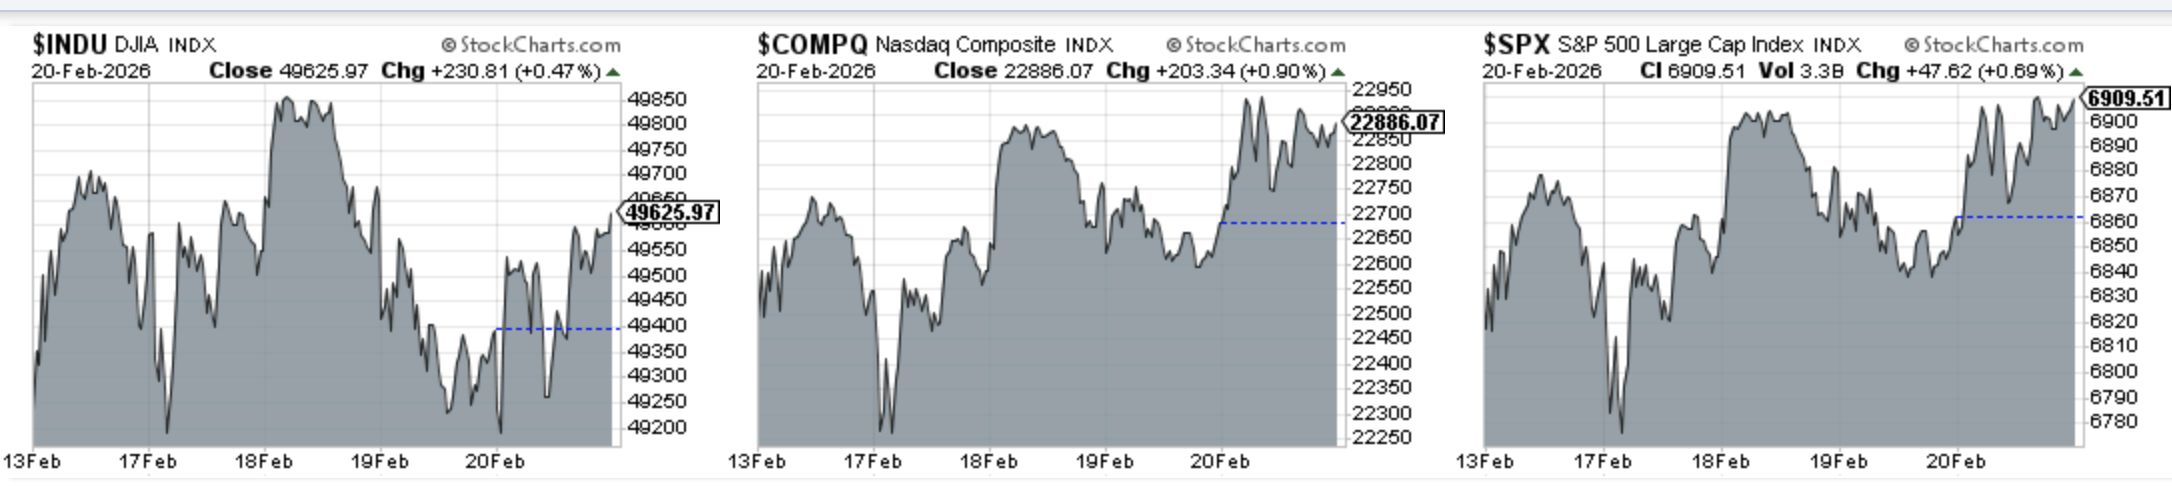
Indices
Dow Jones advanced 0.56% in the last week
S&P 500 advanced 1.15% in the last week
Nasdaq Composite advanced 1.56% in the last week
IWM advanced 1.45% in the last week
Key upcoming economic events:
Monday, February 23
Chicago Fed National Activity Index
Factory Orders (Dec)
Dallas Fed Manufacturing Index (Feb)
Tuesday, February 24
State of the Union Address: Trump is scheduled to deliver the SOTU.
Conference Board Consumer Confidence (Feb)
S&P/Case-Shiller Home Price Index (Dec)
Richmond Fed Manufacturing Index
Wednesday, February 25
Nvidia (NVDA) Q4 Earnings (post-market)
ADP Employment Change
Thursday, February 26
Durable Goods Orders (Jan)
Weekly Initial Jobless Claims
Business Employment Dynamics (Q2 2025)
Friday, February 27
Producer Price Index (PPI) for January
Chicago PMI (Feb)
Upcoming Earnings
The schedule this week is again busy. I have 2 portfolio companies reporting plus of course there is NVDA on Wednesday. Below is the infographic by Earnings Whispers:

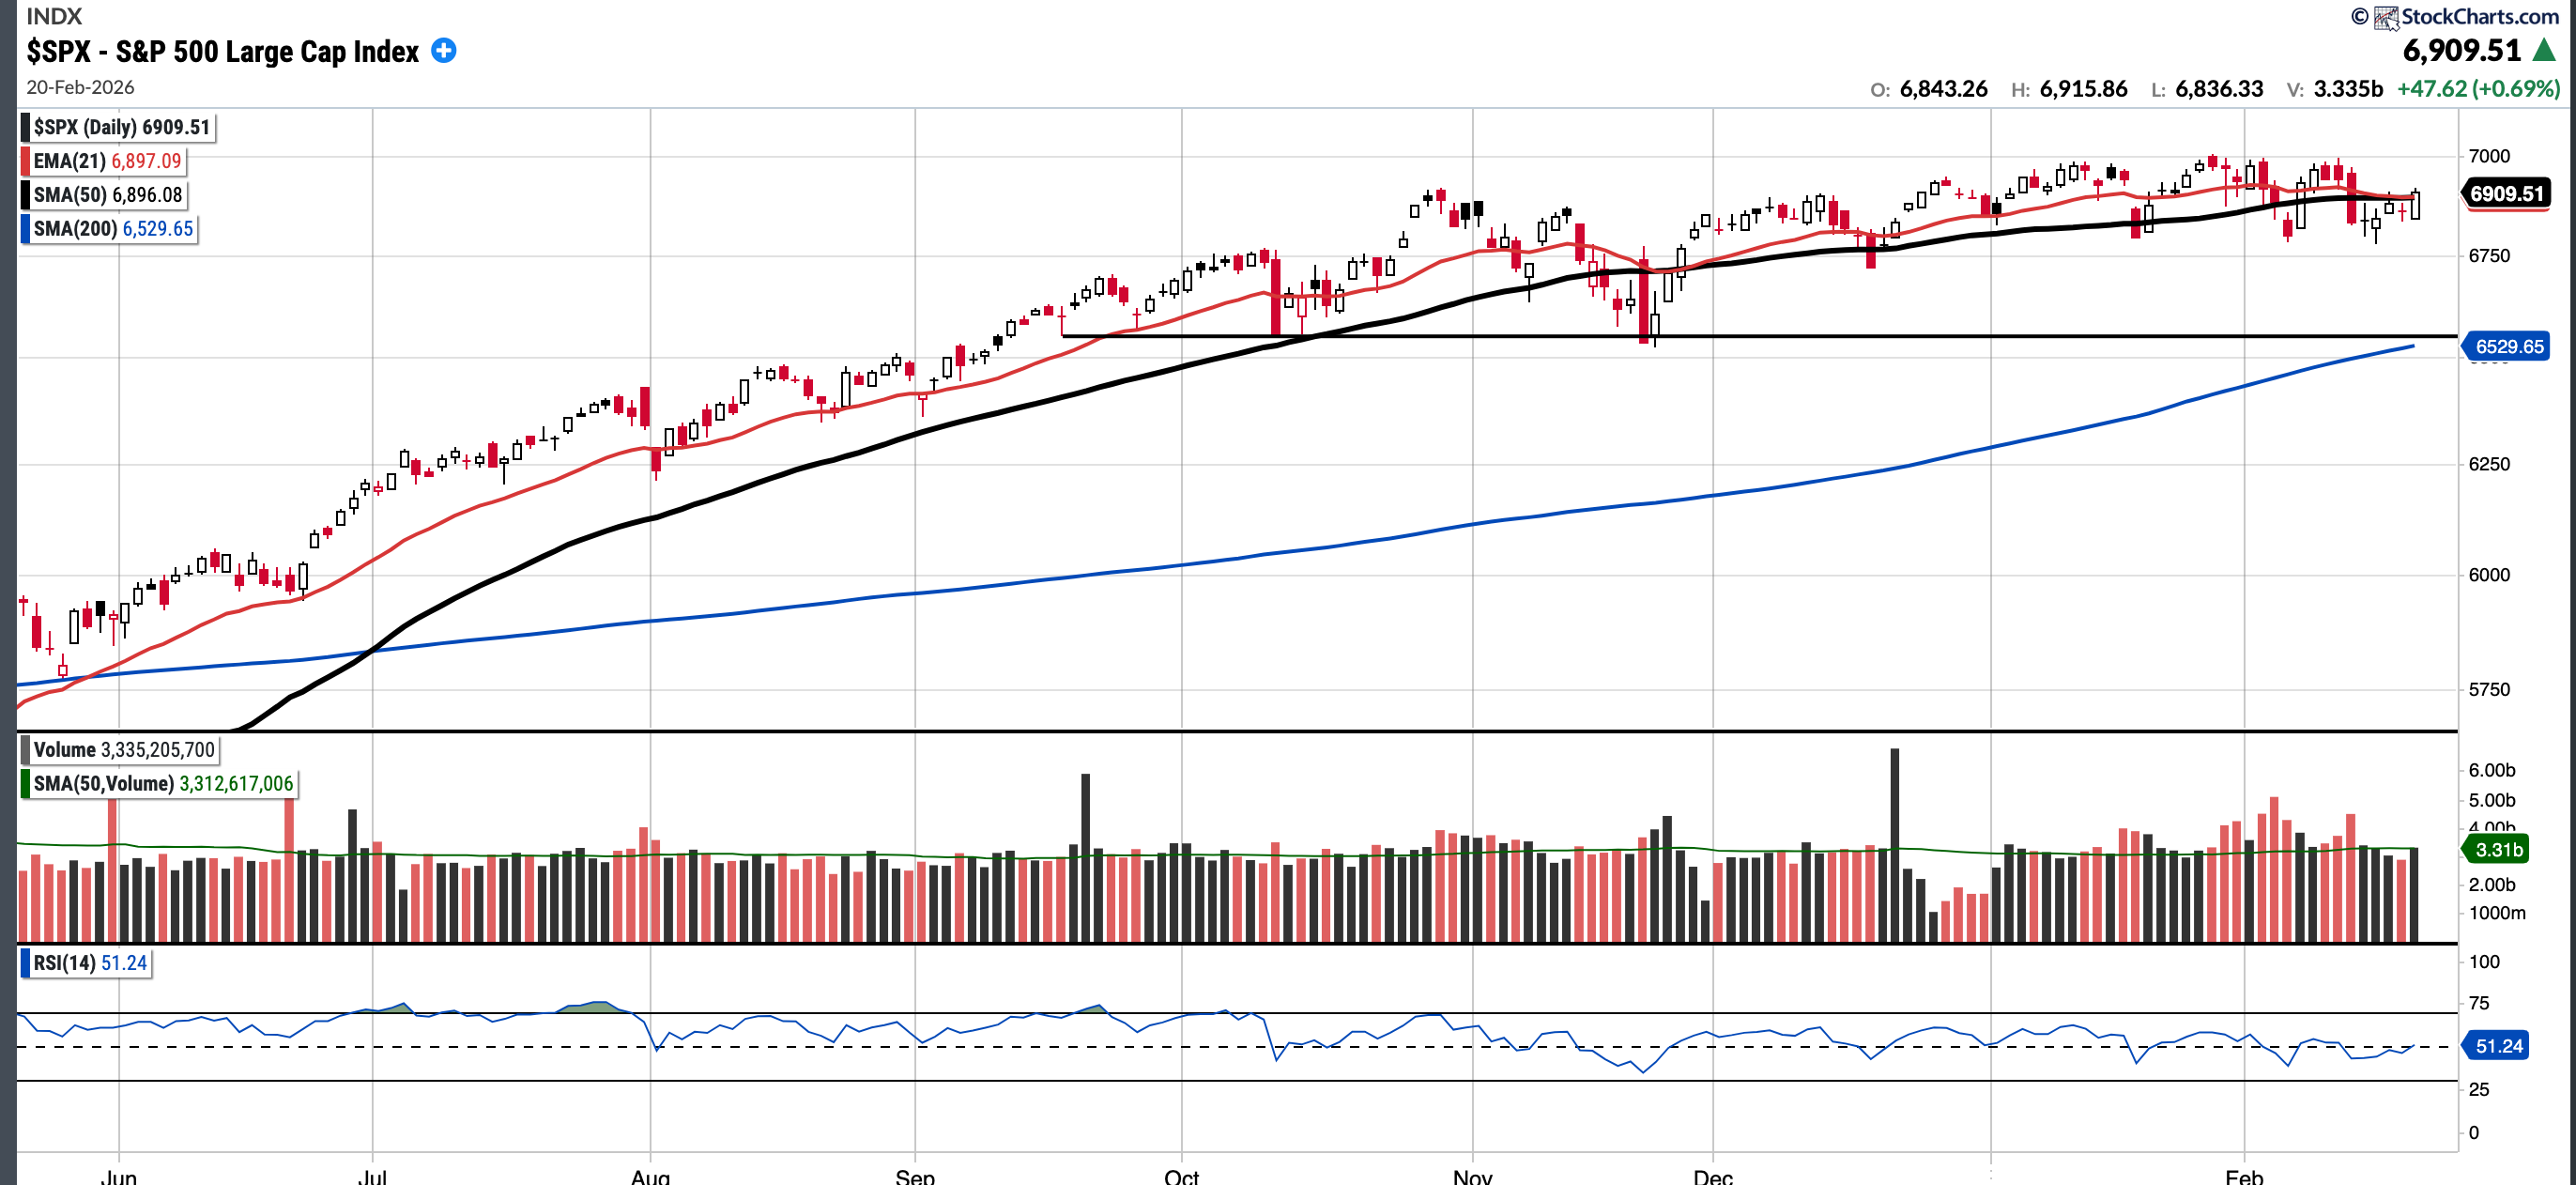
SPX
Currently trades at 6909.51, 0.19% below the 50SMA and 5.82% above the 200SMA.
RSI 51.24
0.74% YTD
Distribution days in the last week: 0
There were no distribution days this week and the SPX did manage to close above both the EMA 21 and SMA 50 which is constructive.
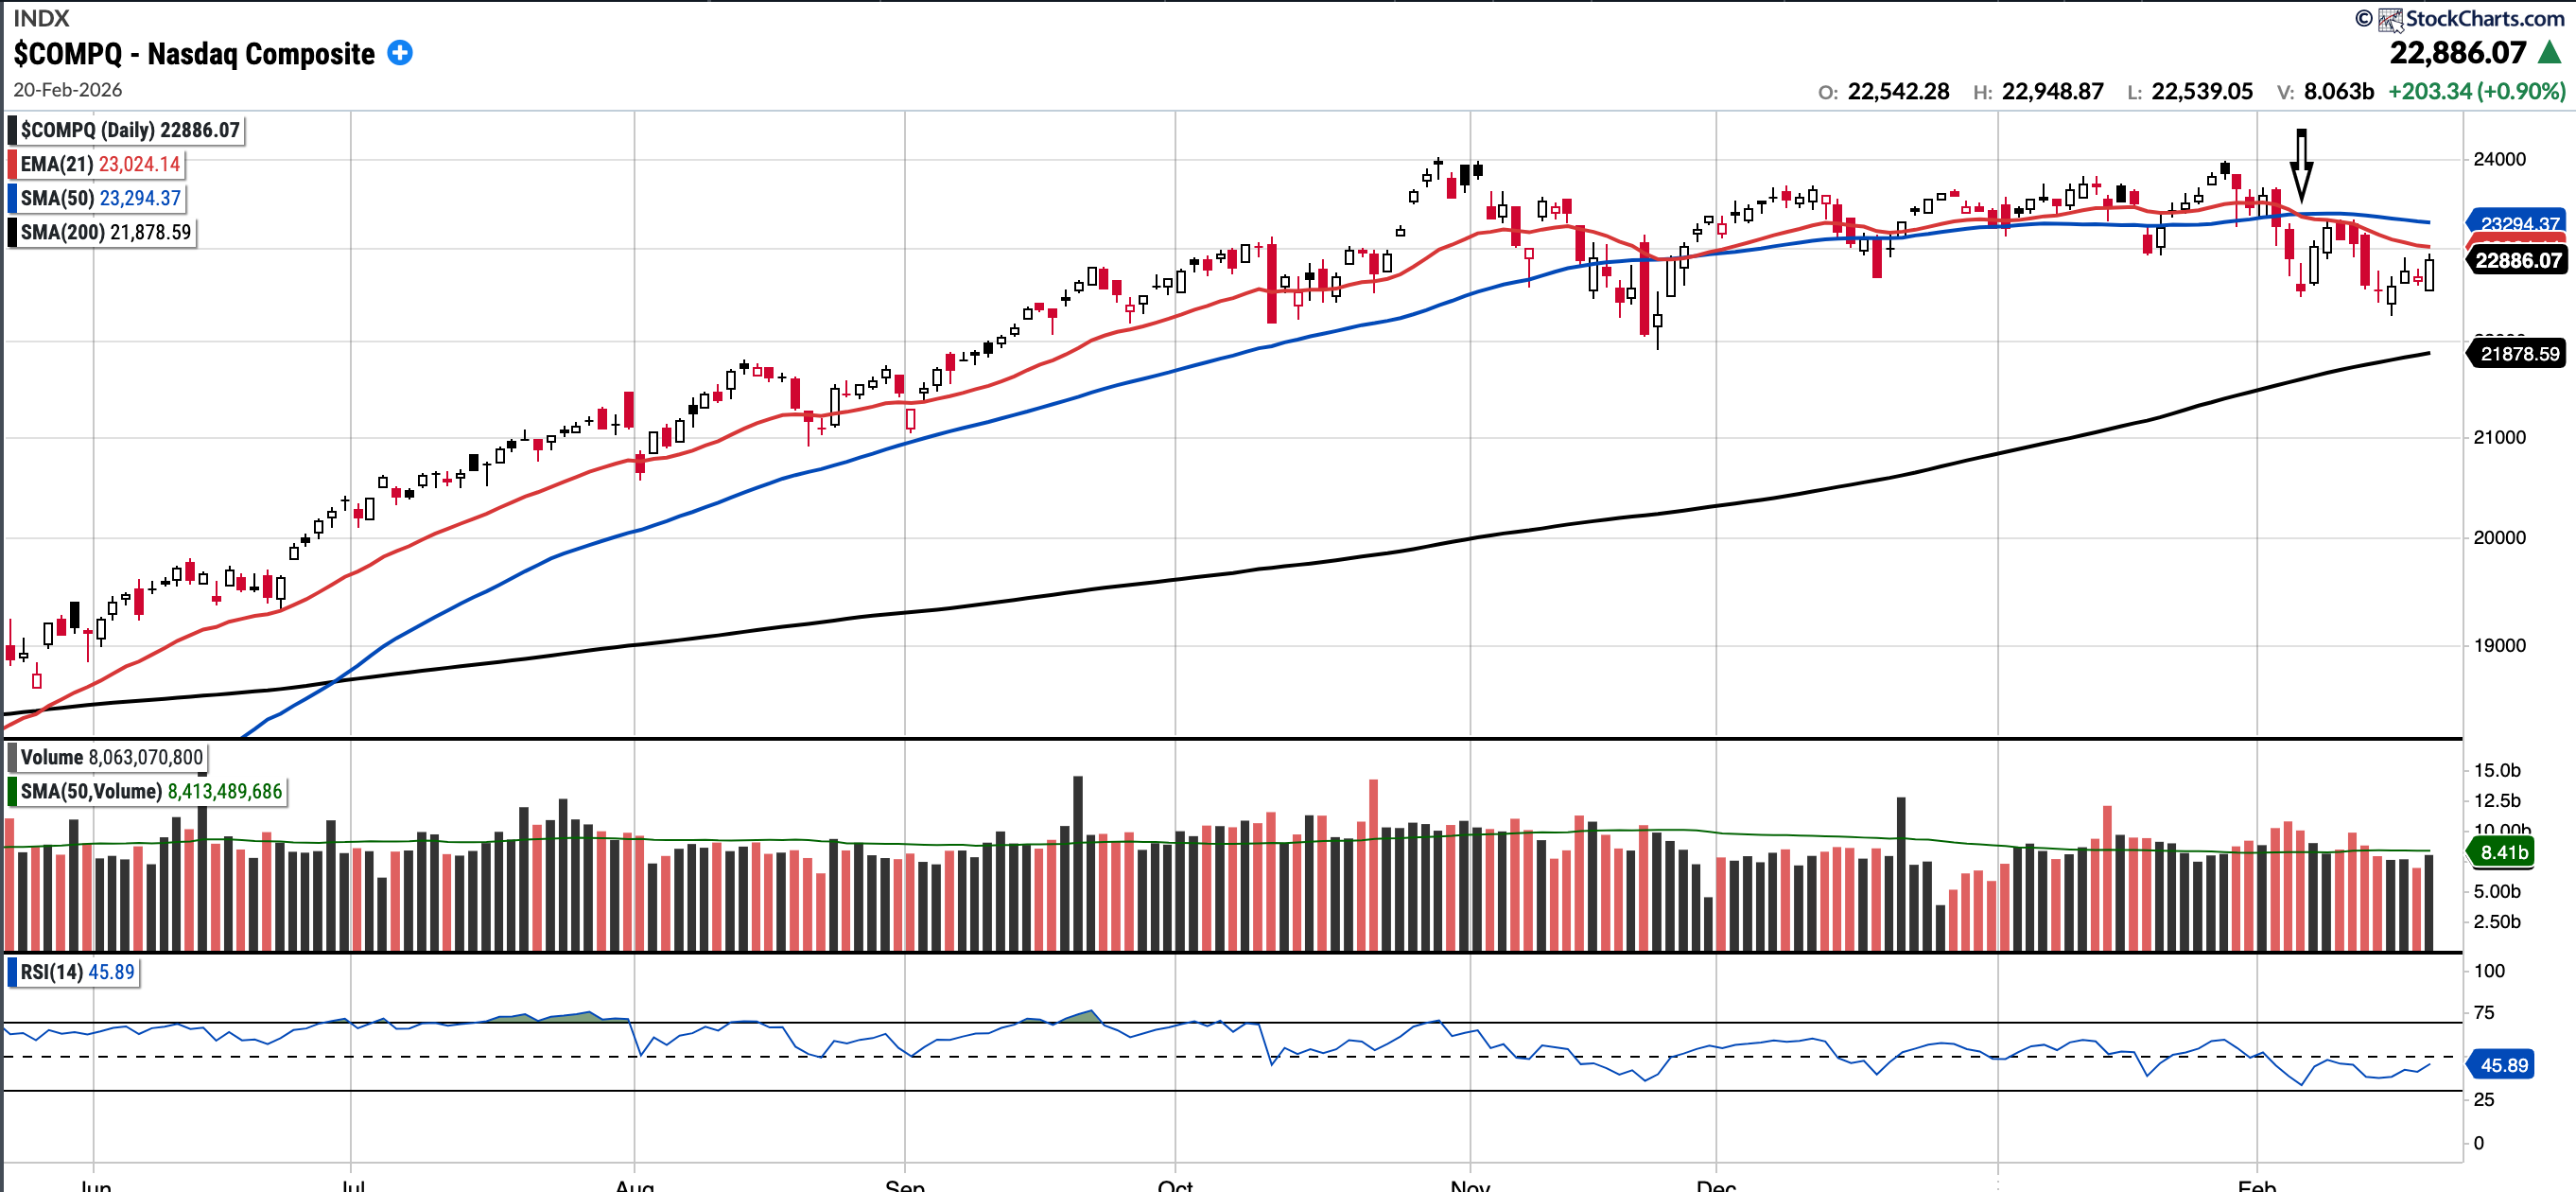
COMPQ
Currently trades at 22,886.07, 1.75% below a declining 50SMA and 4.6% above the 200SMA.
RSI 37.64
-1.5% YTD
Distribution days in the last week: 0
The Nasdaq Composite had a relatively sedate week compared to recent ones, though it still closed below both the 21EMA and 50SMA. The 21EMA undercut the 50SMA last week; notably, the last time this occurred was in late February 2025.
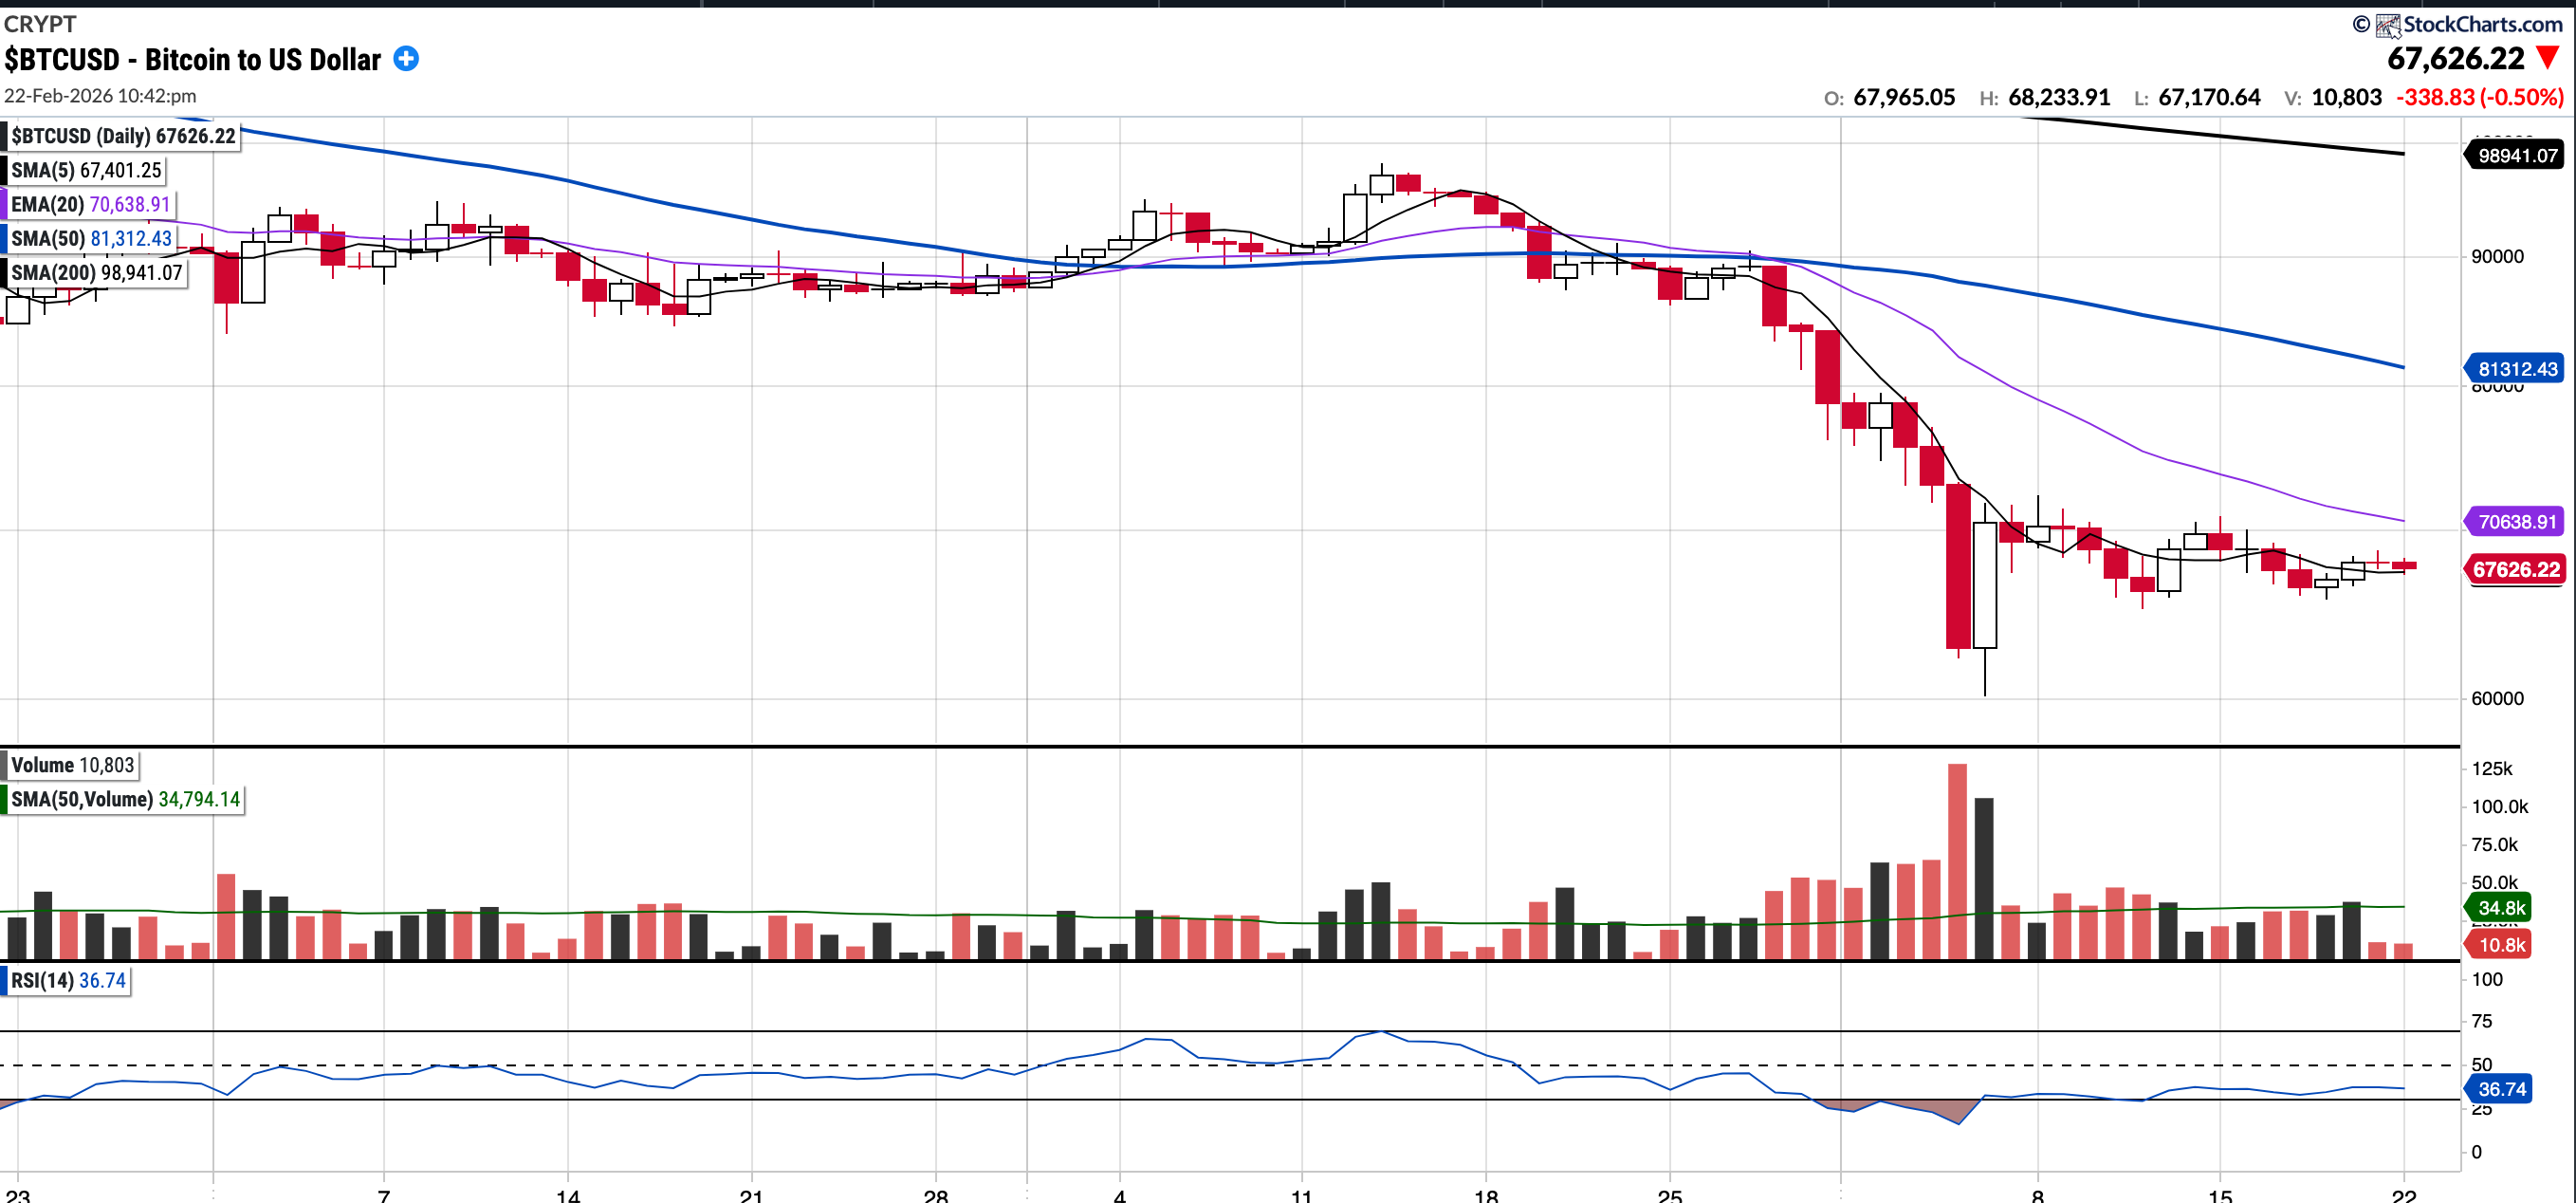
BTC (currently Long)
Currently trades at $67,6226.22, 16.83% below the 50SMA and 31.65% below the 200SMA.
RSI 36.74
-23.79% YTD.
On Thursday the 5th Bitcoin fell as low as 59k and in the process tested the 200wk moving average. It bounced more than $10,000 the following day and has since traded mostly in the 67-71k range. It remains just above the 5 day moving average and whilst it could see further mean reversion, significant technical work remains before the chart looks constructive again. In the first instance, I would like to see the EMA 20 surpassed and hold and in the process flipping 71k from resistance to support.
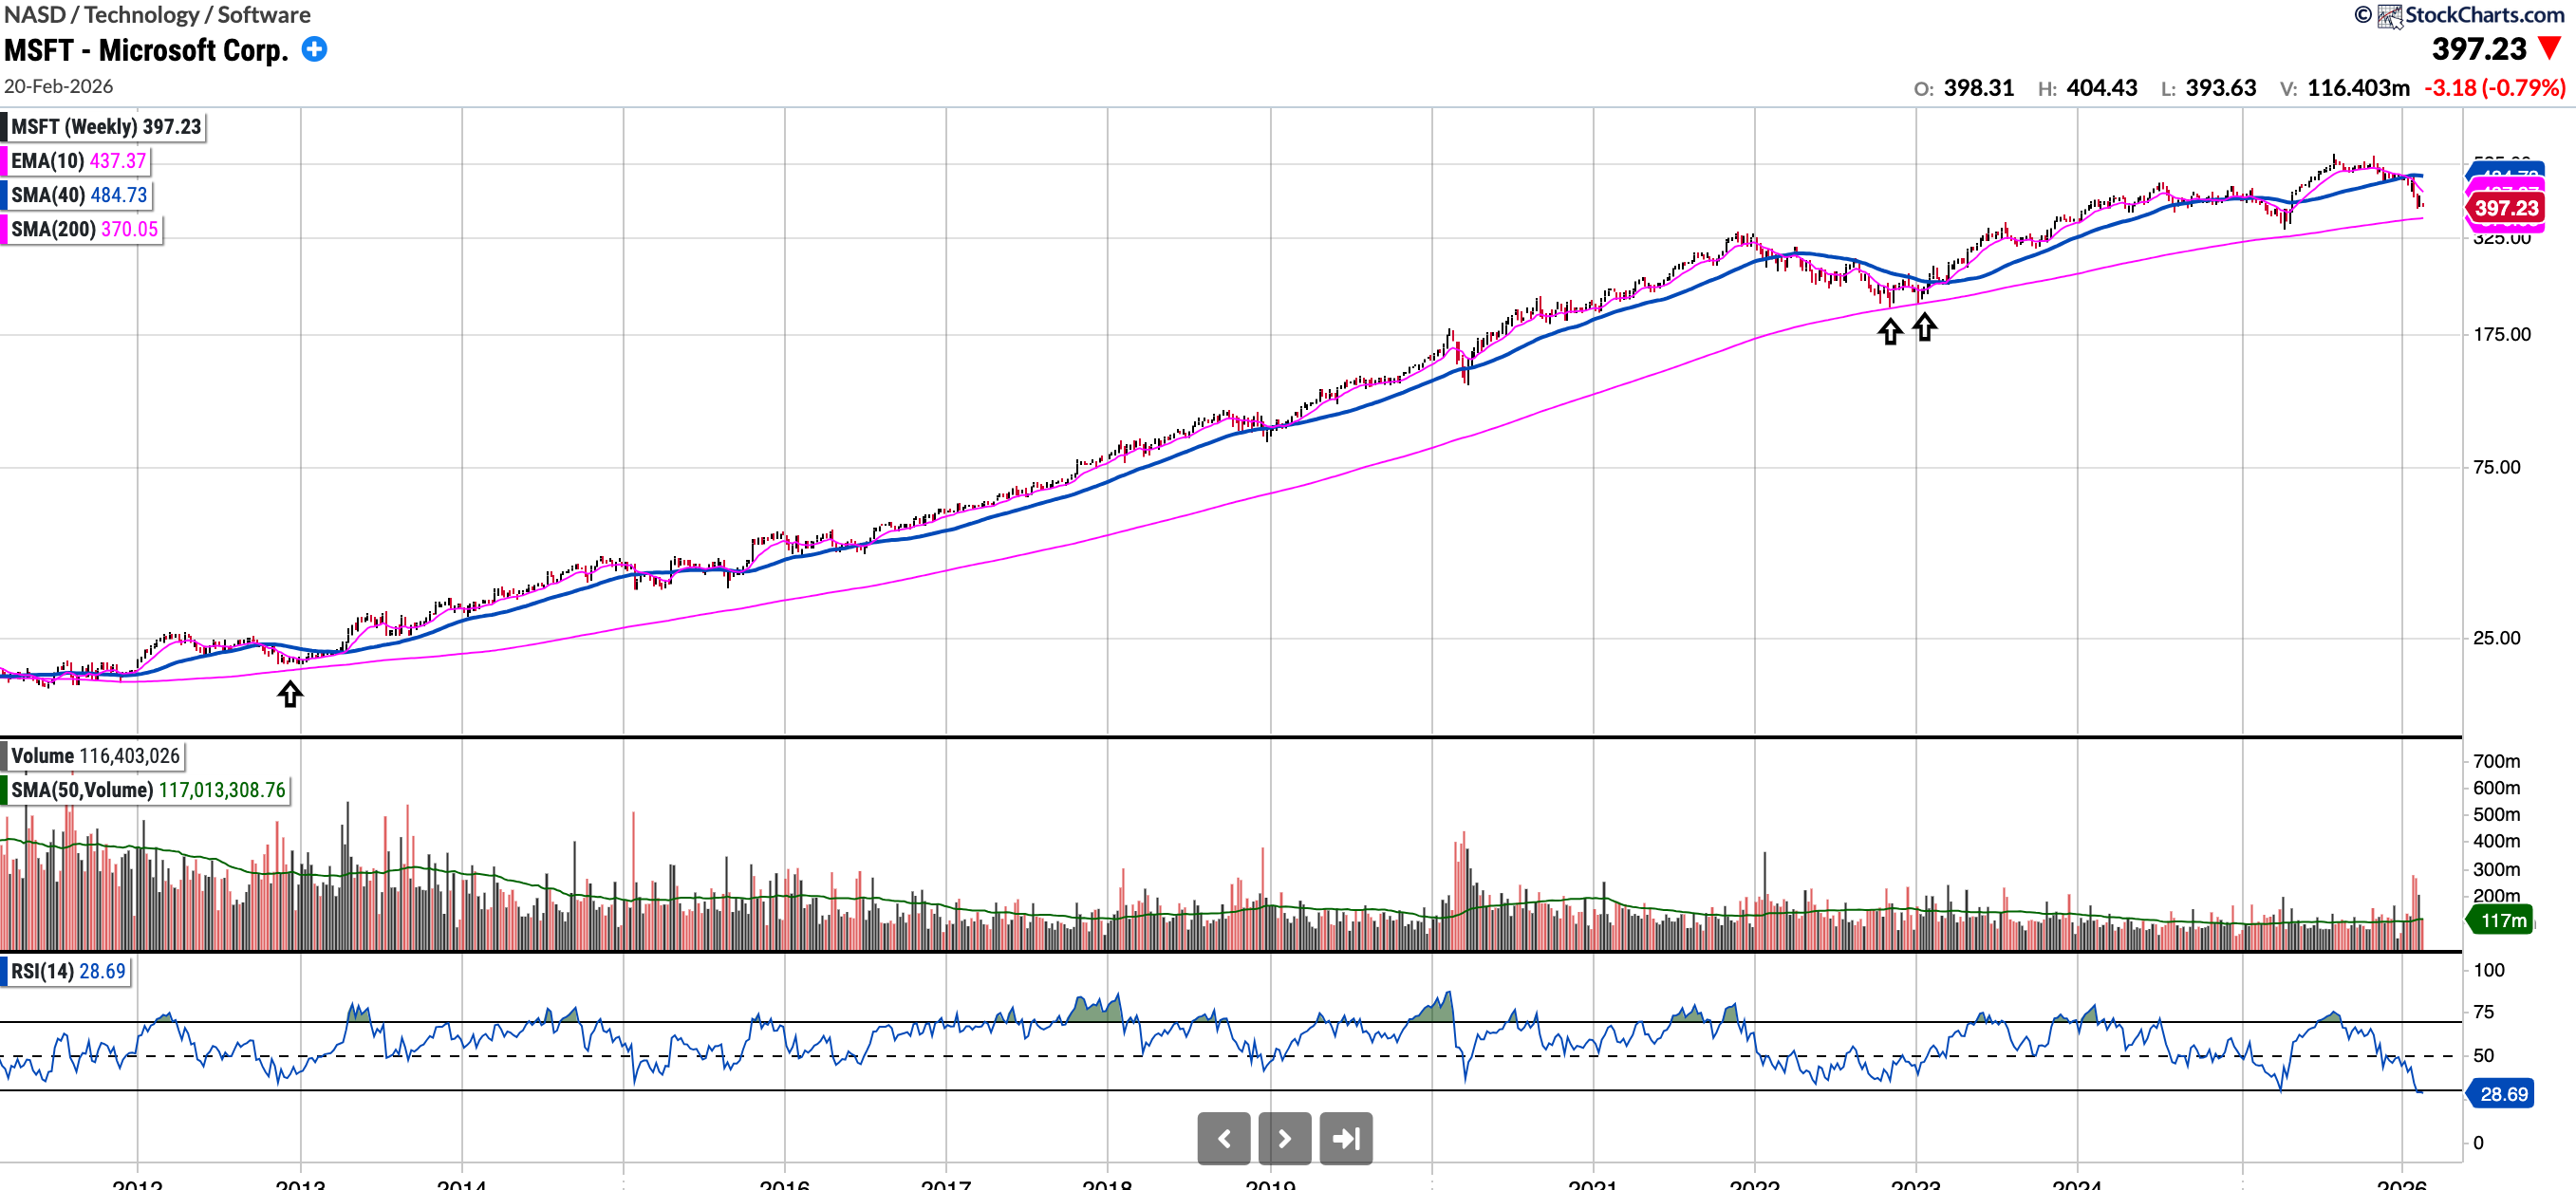
MSFT (currently Long)
Currently trades at $397.23, 12.34% below the 50SMA and 18.07% below the 200SMA.
RSI 32.29
-15.82% YTD.
Despite a mostly flat week, the $MSFT chart still doesn't yet look constructive for longs. The stock is more oversold now than at any point since the GFC. Over that period, it has only tested the 200-week moving average a handful of times, and it may do so again soon if it hits the $370 level. Given current price action, that seems likely. Of course, if it was to be violated then that would be very concerning.
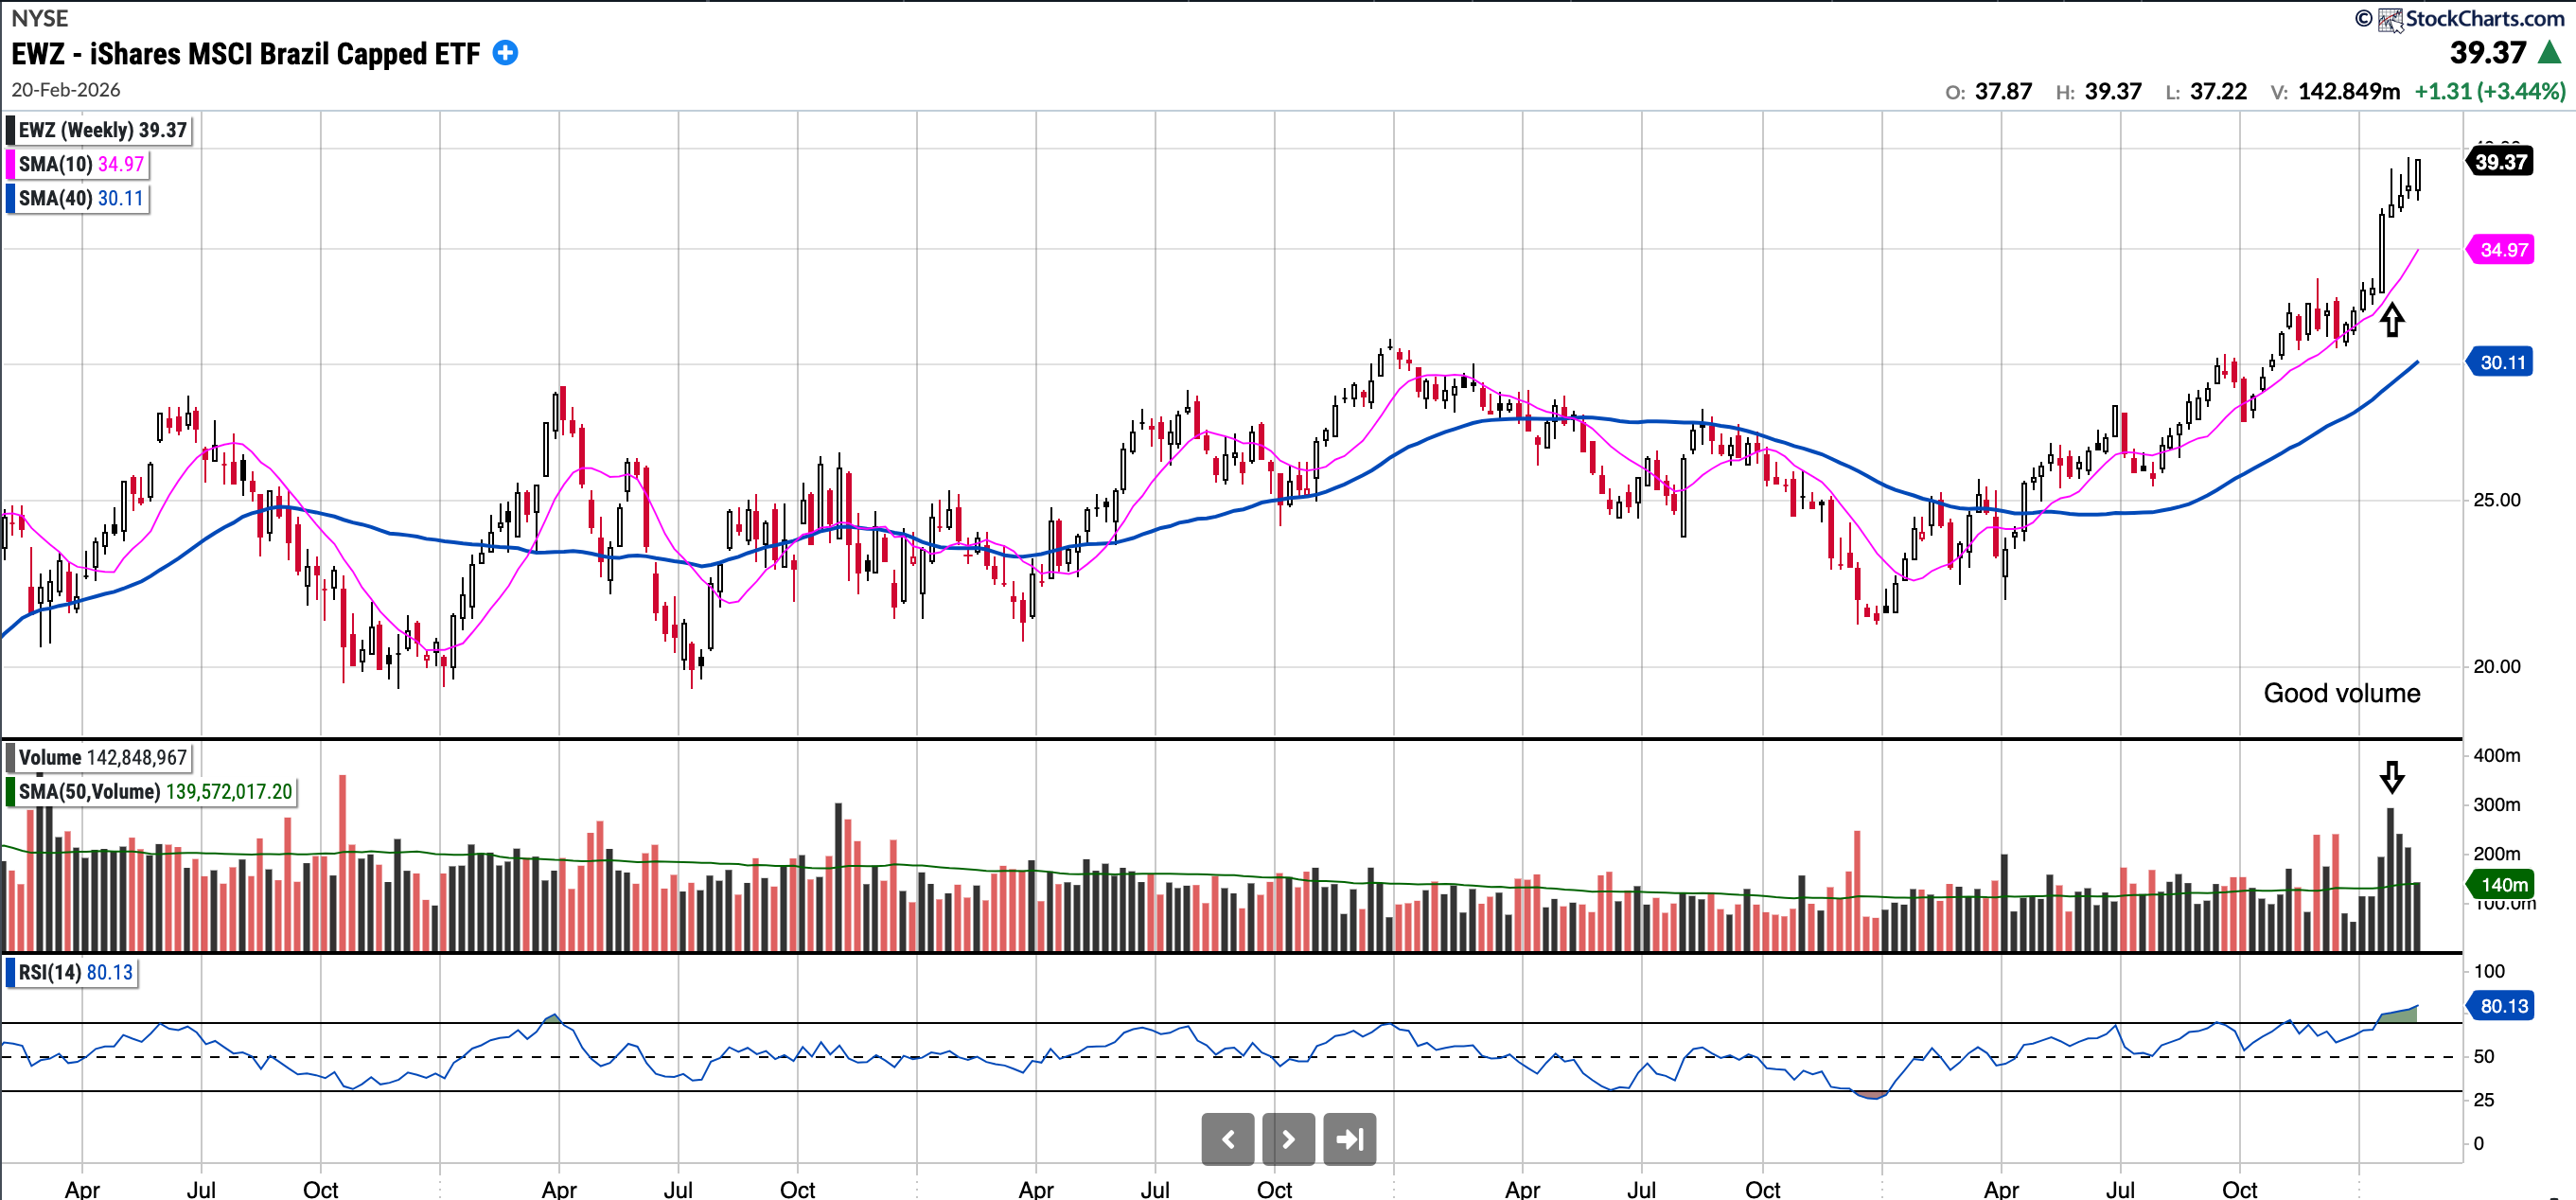
EWZ (iShares MSCI Brazil ETF)
Currently trades at $39.37, 13.83% above the 50SMA and 31.96% above the 200SMA.
RSI 67.92
22.27% YTD.
This feels like somewhat of a miss for me, though I have been exposed to PAGS (no longer in) and STNE from much lower levels since December 2024. $EWZ is actually outperforming both of them YTD. While the weekly chart shows it’s a little extended in the near term, we could still be in the early stages of a move, thinking bigger picture. Note the arrow is where I felt like a good entry would have been. Watching also to see if it can pull in to the 20 day which is ~37.93 currently.
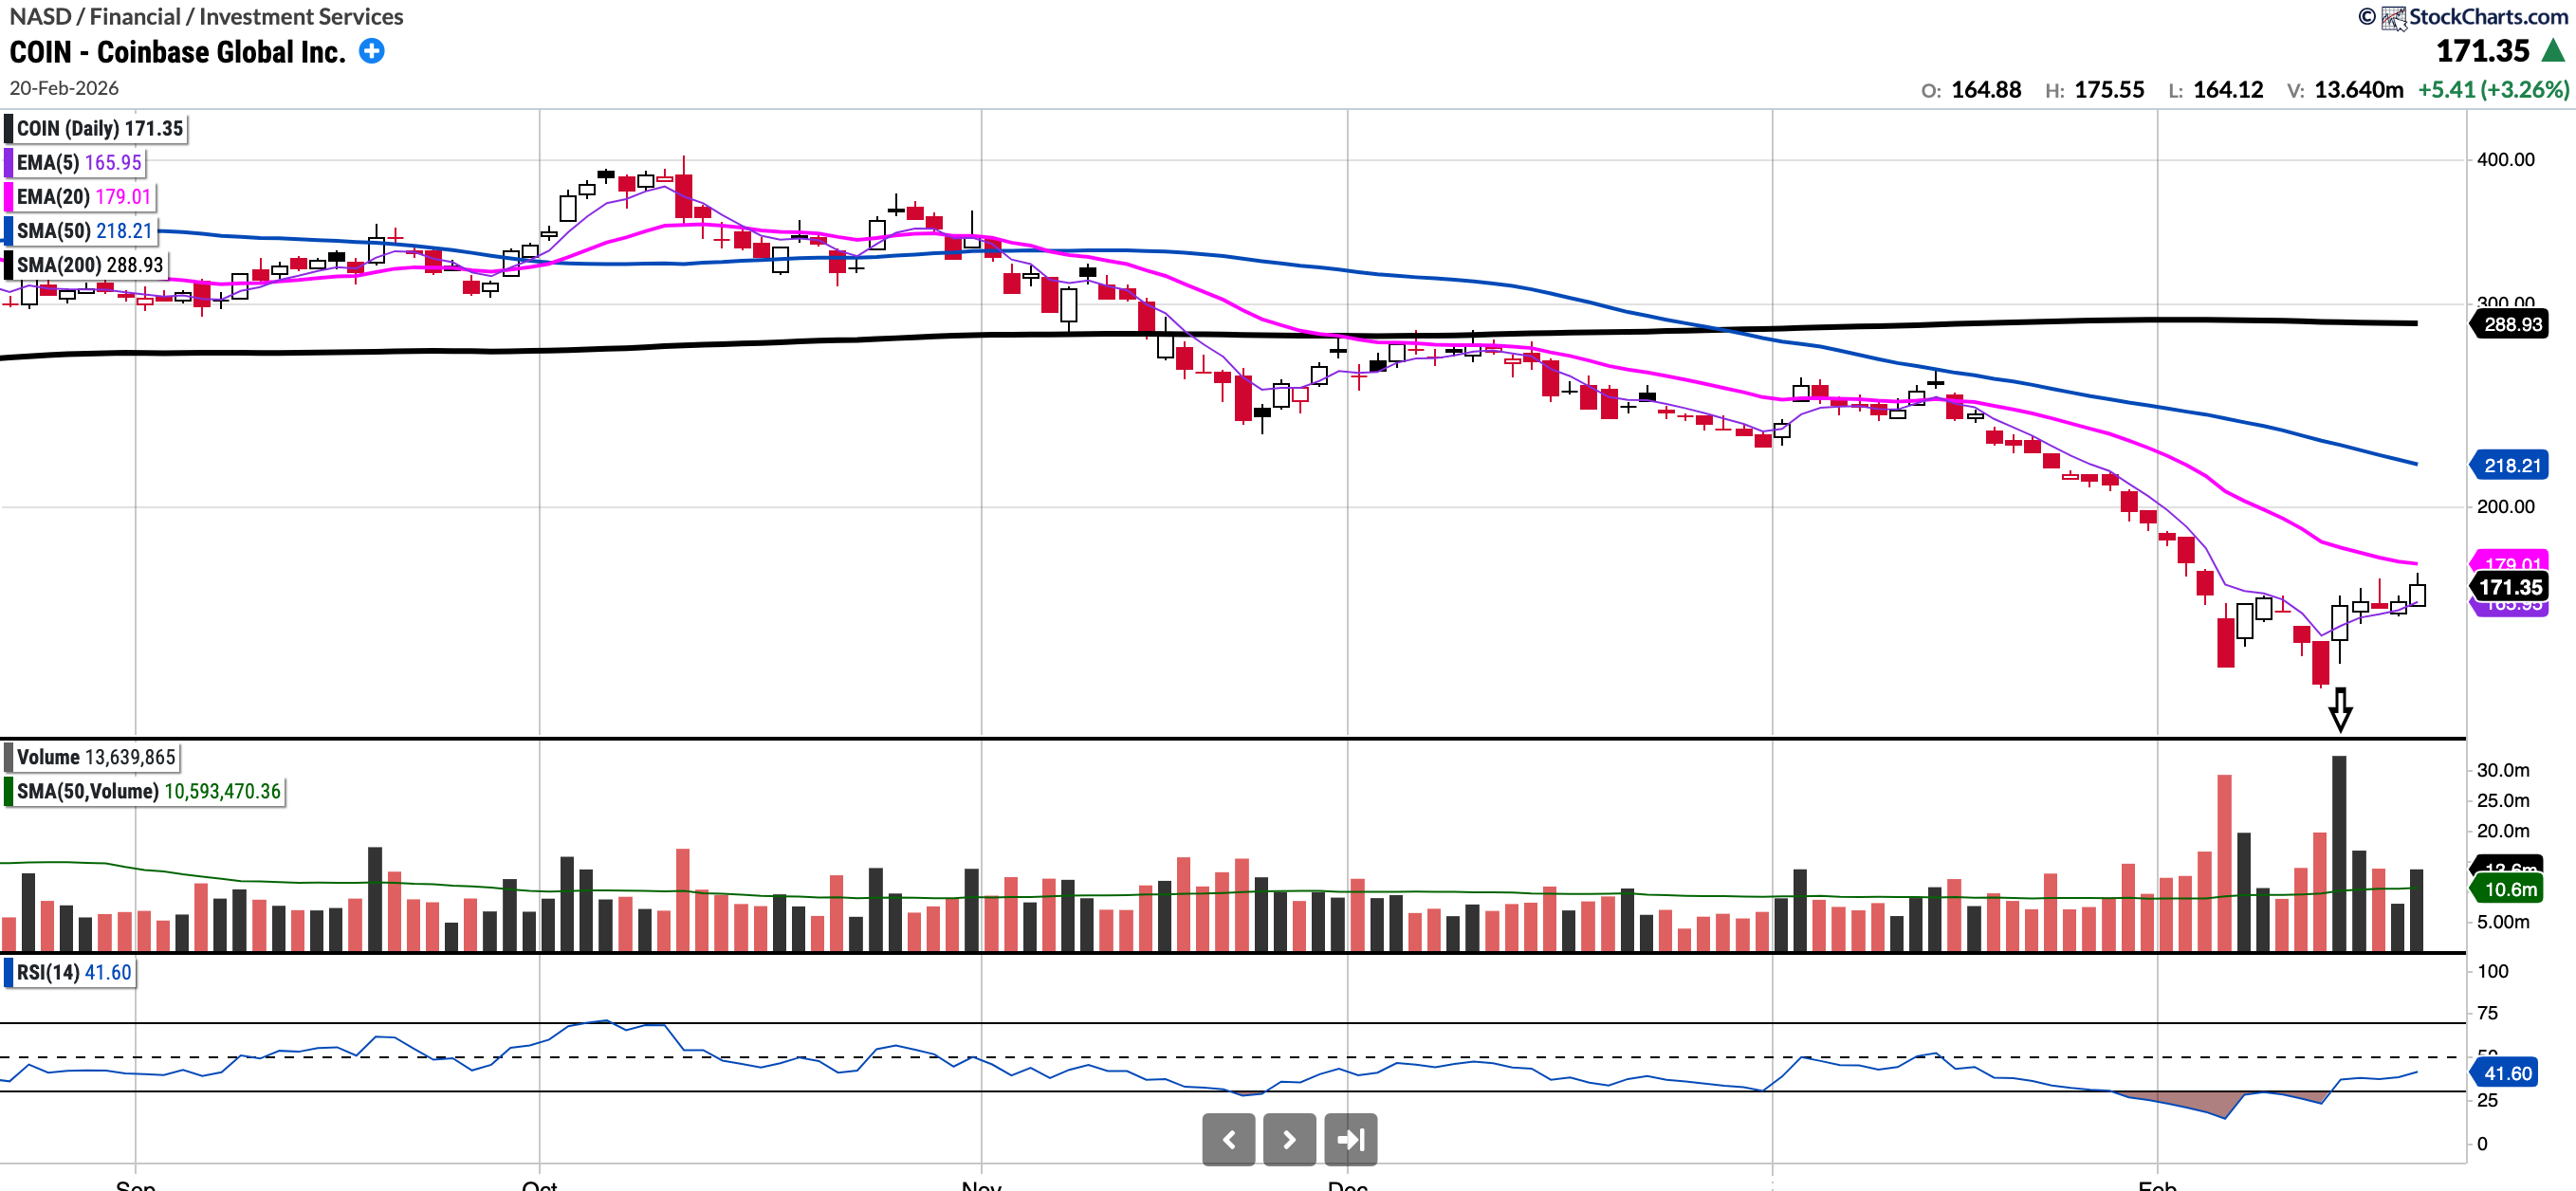
COIN (currently Long)
Currently trades at $171.35, 21.48% below the 50SMA and 40.69% below the 200SMA.
RSI 41.6
-27.56% YTD.
COIN stock has fallen significantly recently due to the crypto bear market which directly impacts their business.
Interestingly, whilst they missed on earnings the stock was up, on huge volume, the next day (see arrow). It has since been making higher highs and higher lows.
I am watching to see if the EMA 5 can break above the EMA 20 and then the chart would be more constructive in my eyes. I am watching to consider adding more shares (previously exited majority at 400-440) and also re-initiating a trading position.
Notable portfolio changes in previous week (all updated live in subscriber channels):
Nil notable portfolio changes this week.
I’ve separated my accounts to keep things organised: you can follow my main Investment Account below (with live updates on Substack and Discord), while my Trading Portfolio updates happen strictly on Discord.
Please familiarise yourself with the notification system, especially important if you are a premium subscriber. Otherwise you are not gaining full value from your membership. You can find more details in this post below.
Current Positions in Size Order with Cost Basis:
Cash: 16.1% (Pounds Sterling)
