
Preview of the Week Ahead
W/C November 10, 2025

Hope you all are having a good weekend. Below we will be previewing the upcoming week and providing a portfolio update as usual.
Format for what is covered in this weekly preview:
A look at the indices
Key upcoming economic events
Upcoming earnings reports
Charts
Notable portfolio changes from the previous week
Current Portfolio Holdings (Position size, cost basis, and commentary on each holding regarding the intended holding period and any planned activity)
Ensure you check out the most recent Monthly Portfolio and Performance Update (including Market Overview) below if you have not done so.

If it is your first time here, read the below post on how to navigate the SixSigmaCapital Website and subscribe to the option that suits.

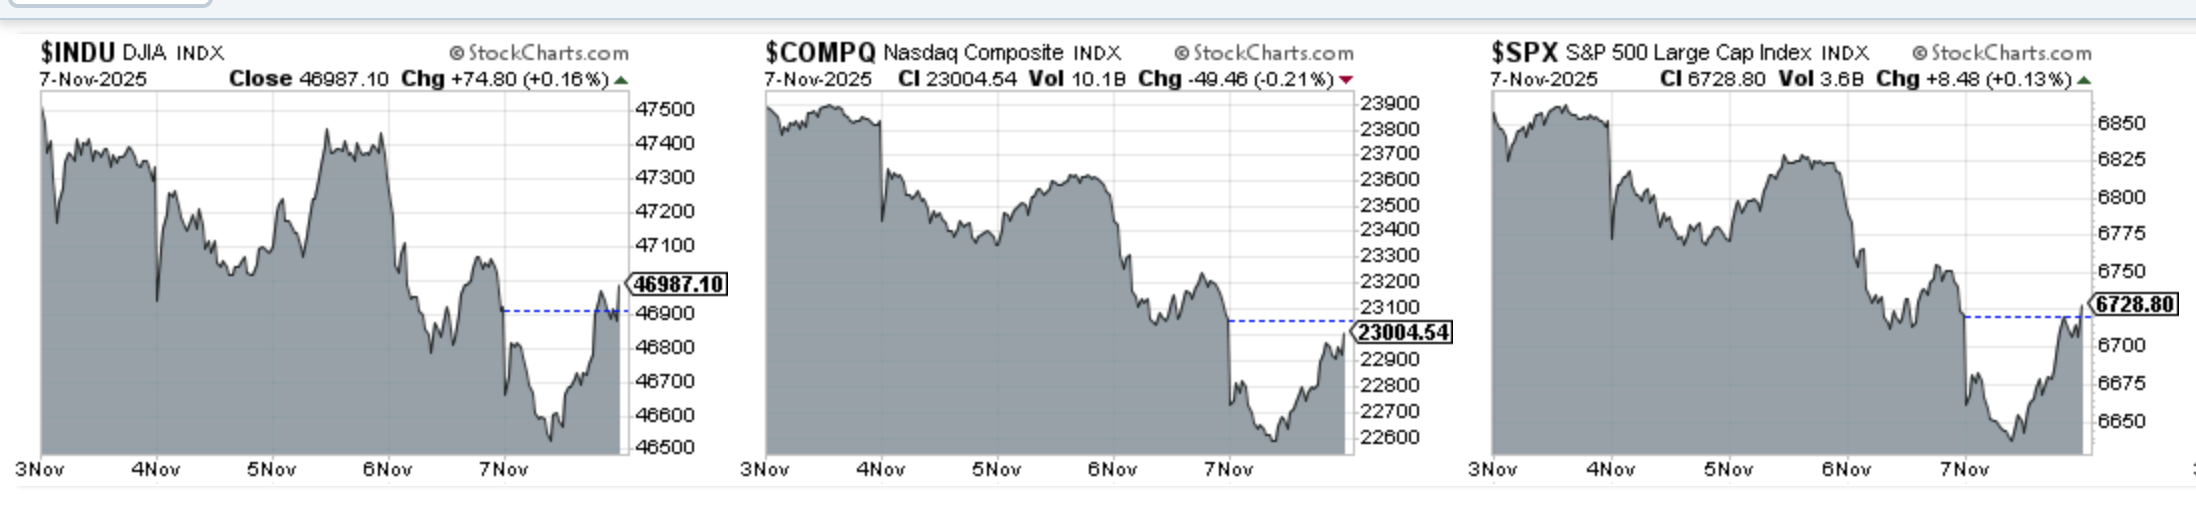
Indices
Dow Jones declined 1.19% in the last week
S&P 500 declined 2.04% in the last week
Nasdaq Composite declined 3.93% in the last week
IWM declined 1.18% in the last week
Key upcoming economic events:
Monday, November 10:
Federal Reserve Speeches
Tuesday, November 11
US Holiday: Veterans Day (U.S. financial markets remain open)
NFIB Small Business Optimism Index (11:00 AM ET)
Provides private-sector insight into the health and sentiment of small businesses, a key driver of employment.
ADP Weekly Employment Change (1:15 PM ET)
A private-sector look at the labor market, which will receive increased focus due to the likely delay of the official government employment data.
Wednesday, November 12
Federal Reserve Speeches
Thursday, November 13
Consumer Price Index (CPI) - October: Likely Delayed if Government Shutdown
Initial Jobless Claims (8:30 AM ET)
Friday, November 14
Producer Price Index (PPI) - October: Likely delayed if Government Shutdown
Retail Sales - October (8:30 AM ET): Likely delayed if Government Shutdown
Business Inventories - September (10:00 AM ET)
Monthly Budget Statement - October (2:00 PM ET)
Upcoming Earnings
Last week was an extremely busy schedule for me with several portfolio names reporting. This week I also have several portfolio names reporting including HROW, SE, DLO and others.
Below is the infographic by Earnings Whispers:

Charts
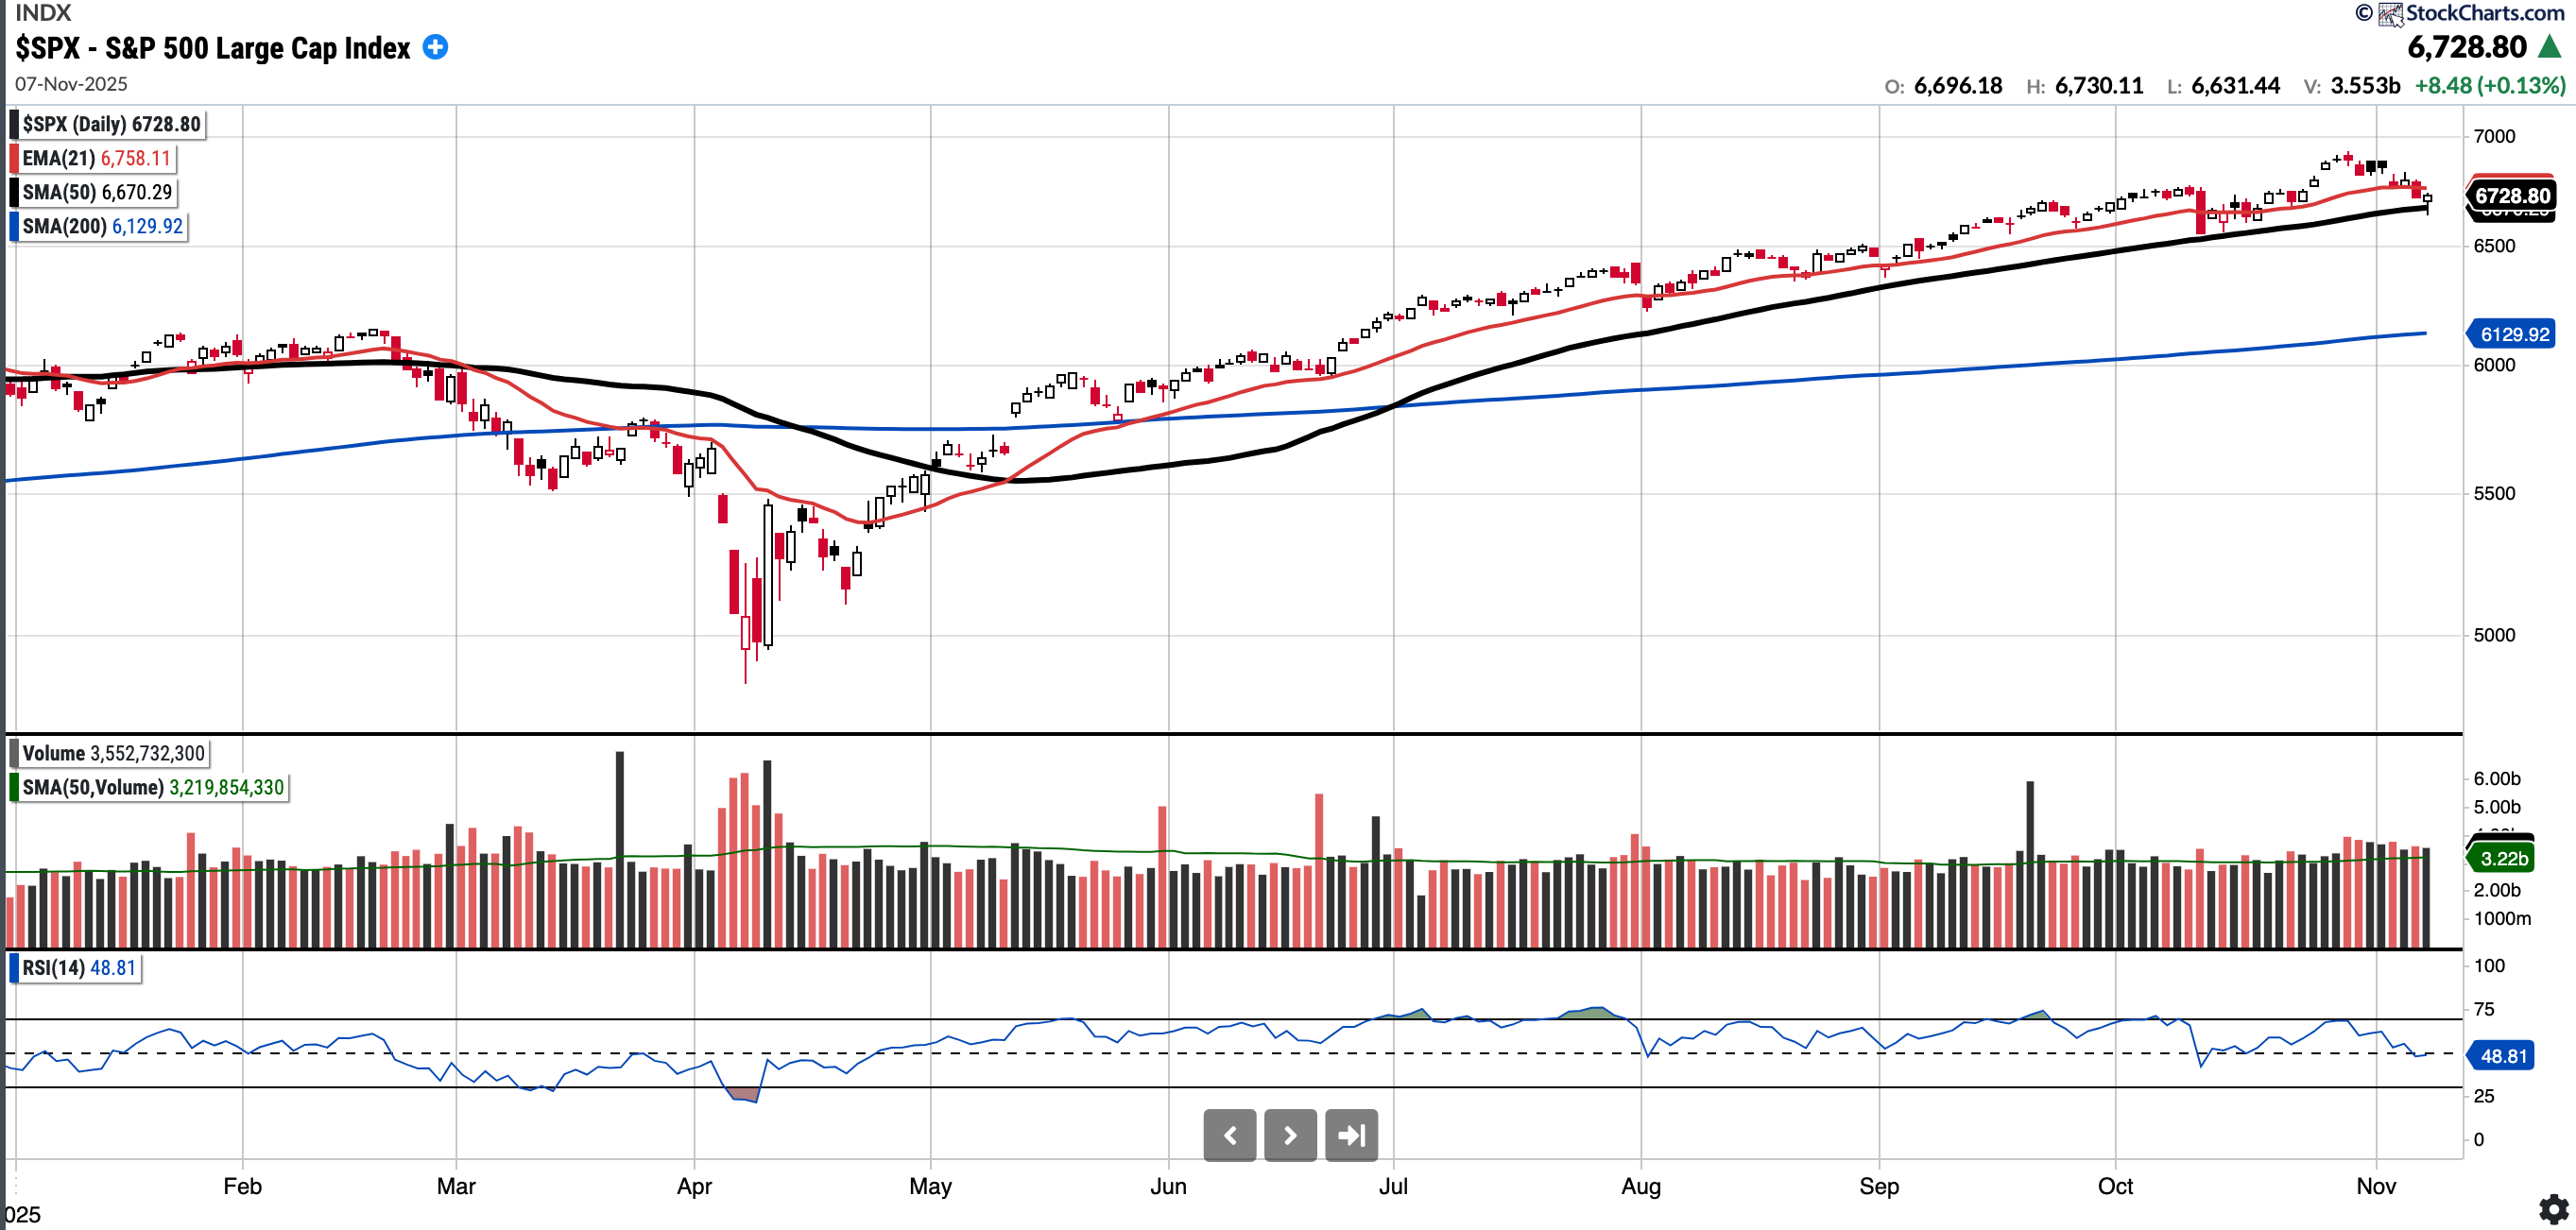
SPX
Currently trades at 6728.8.2, 0.88% above a rising 50SMA and 9.77% above 200SMA.
RSI 48.84
14.66% YTD
Distribution days in the last week: 2
We tested the SMA 50 on Friday which held, for now. Bulls would want to see it hold convincingly next week.
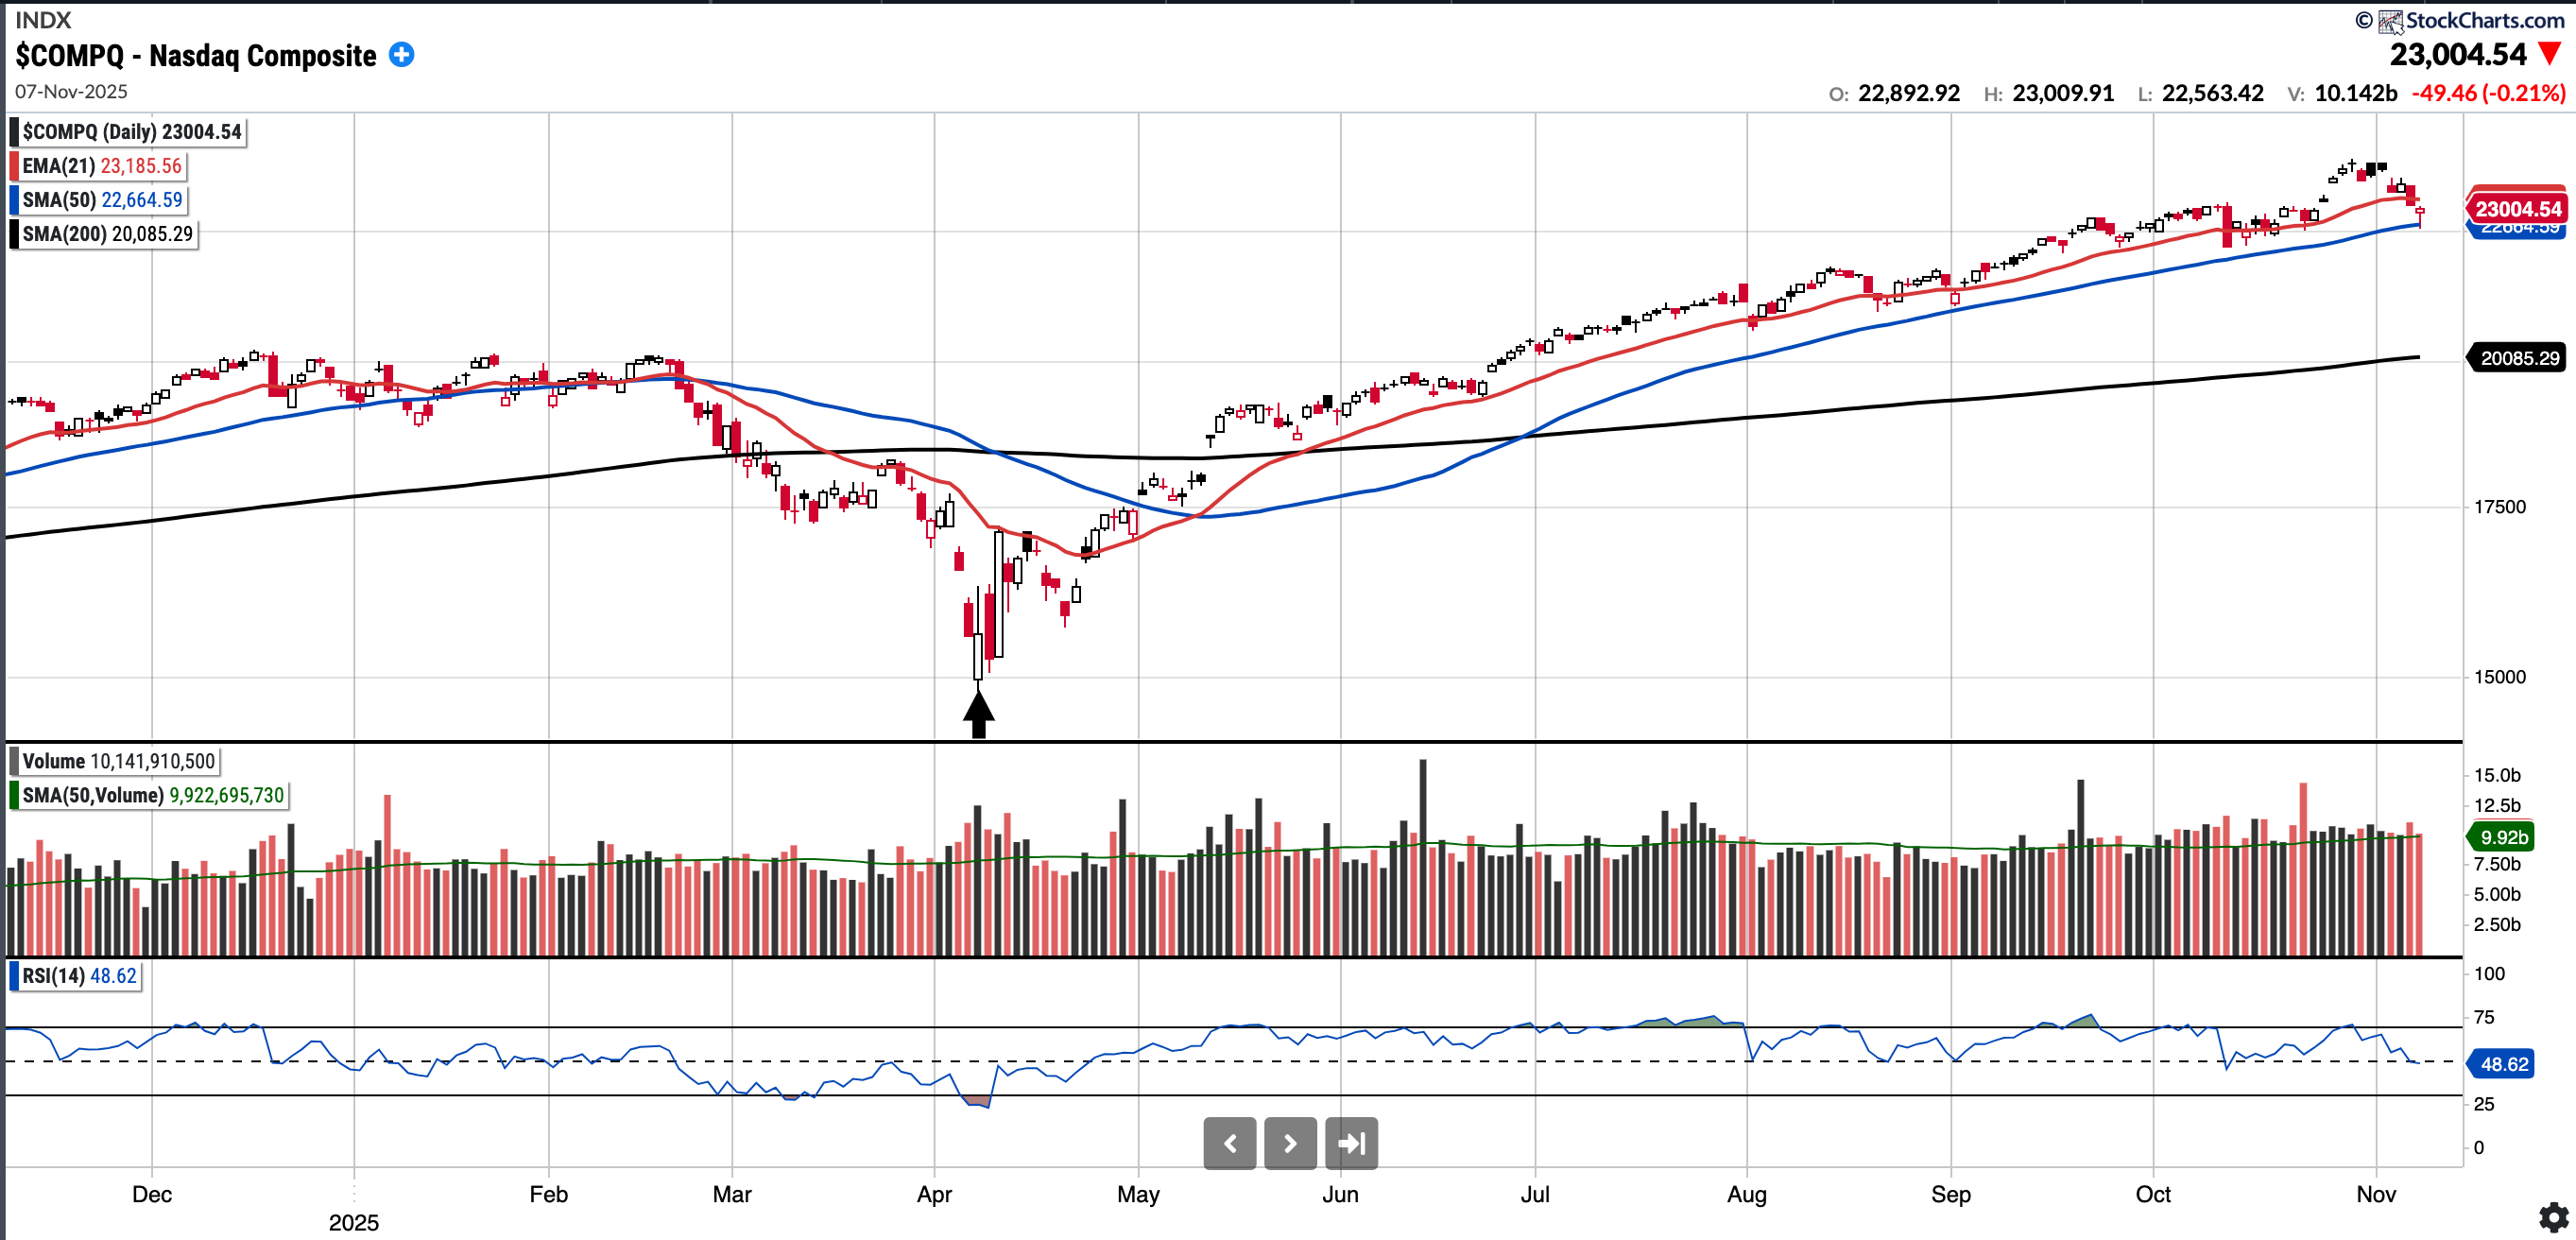
COMPQ
Currently trades at 23,000.54, 1.50% above a rising 50SMA and 14.53% above 200SMA.
RSI 48.62
19.31% YTD
Distribution days in the last week: 1 in the last week.
Similarly to the S&P 500, the Nasdaq Composite tested and held the SMA 50 on Friday. Finished up 2% from the intraday low.
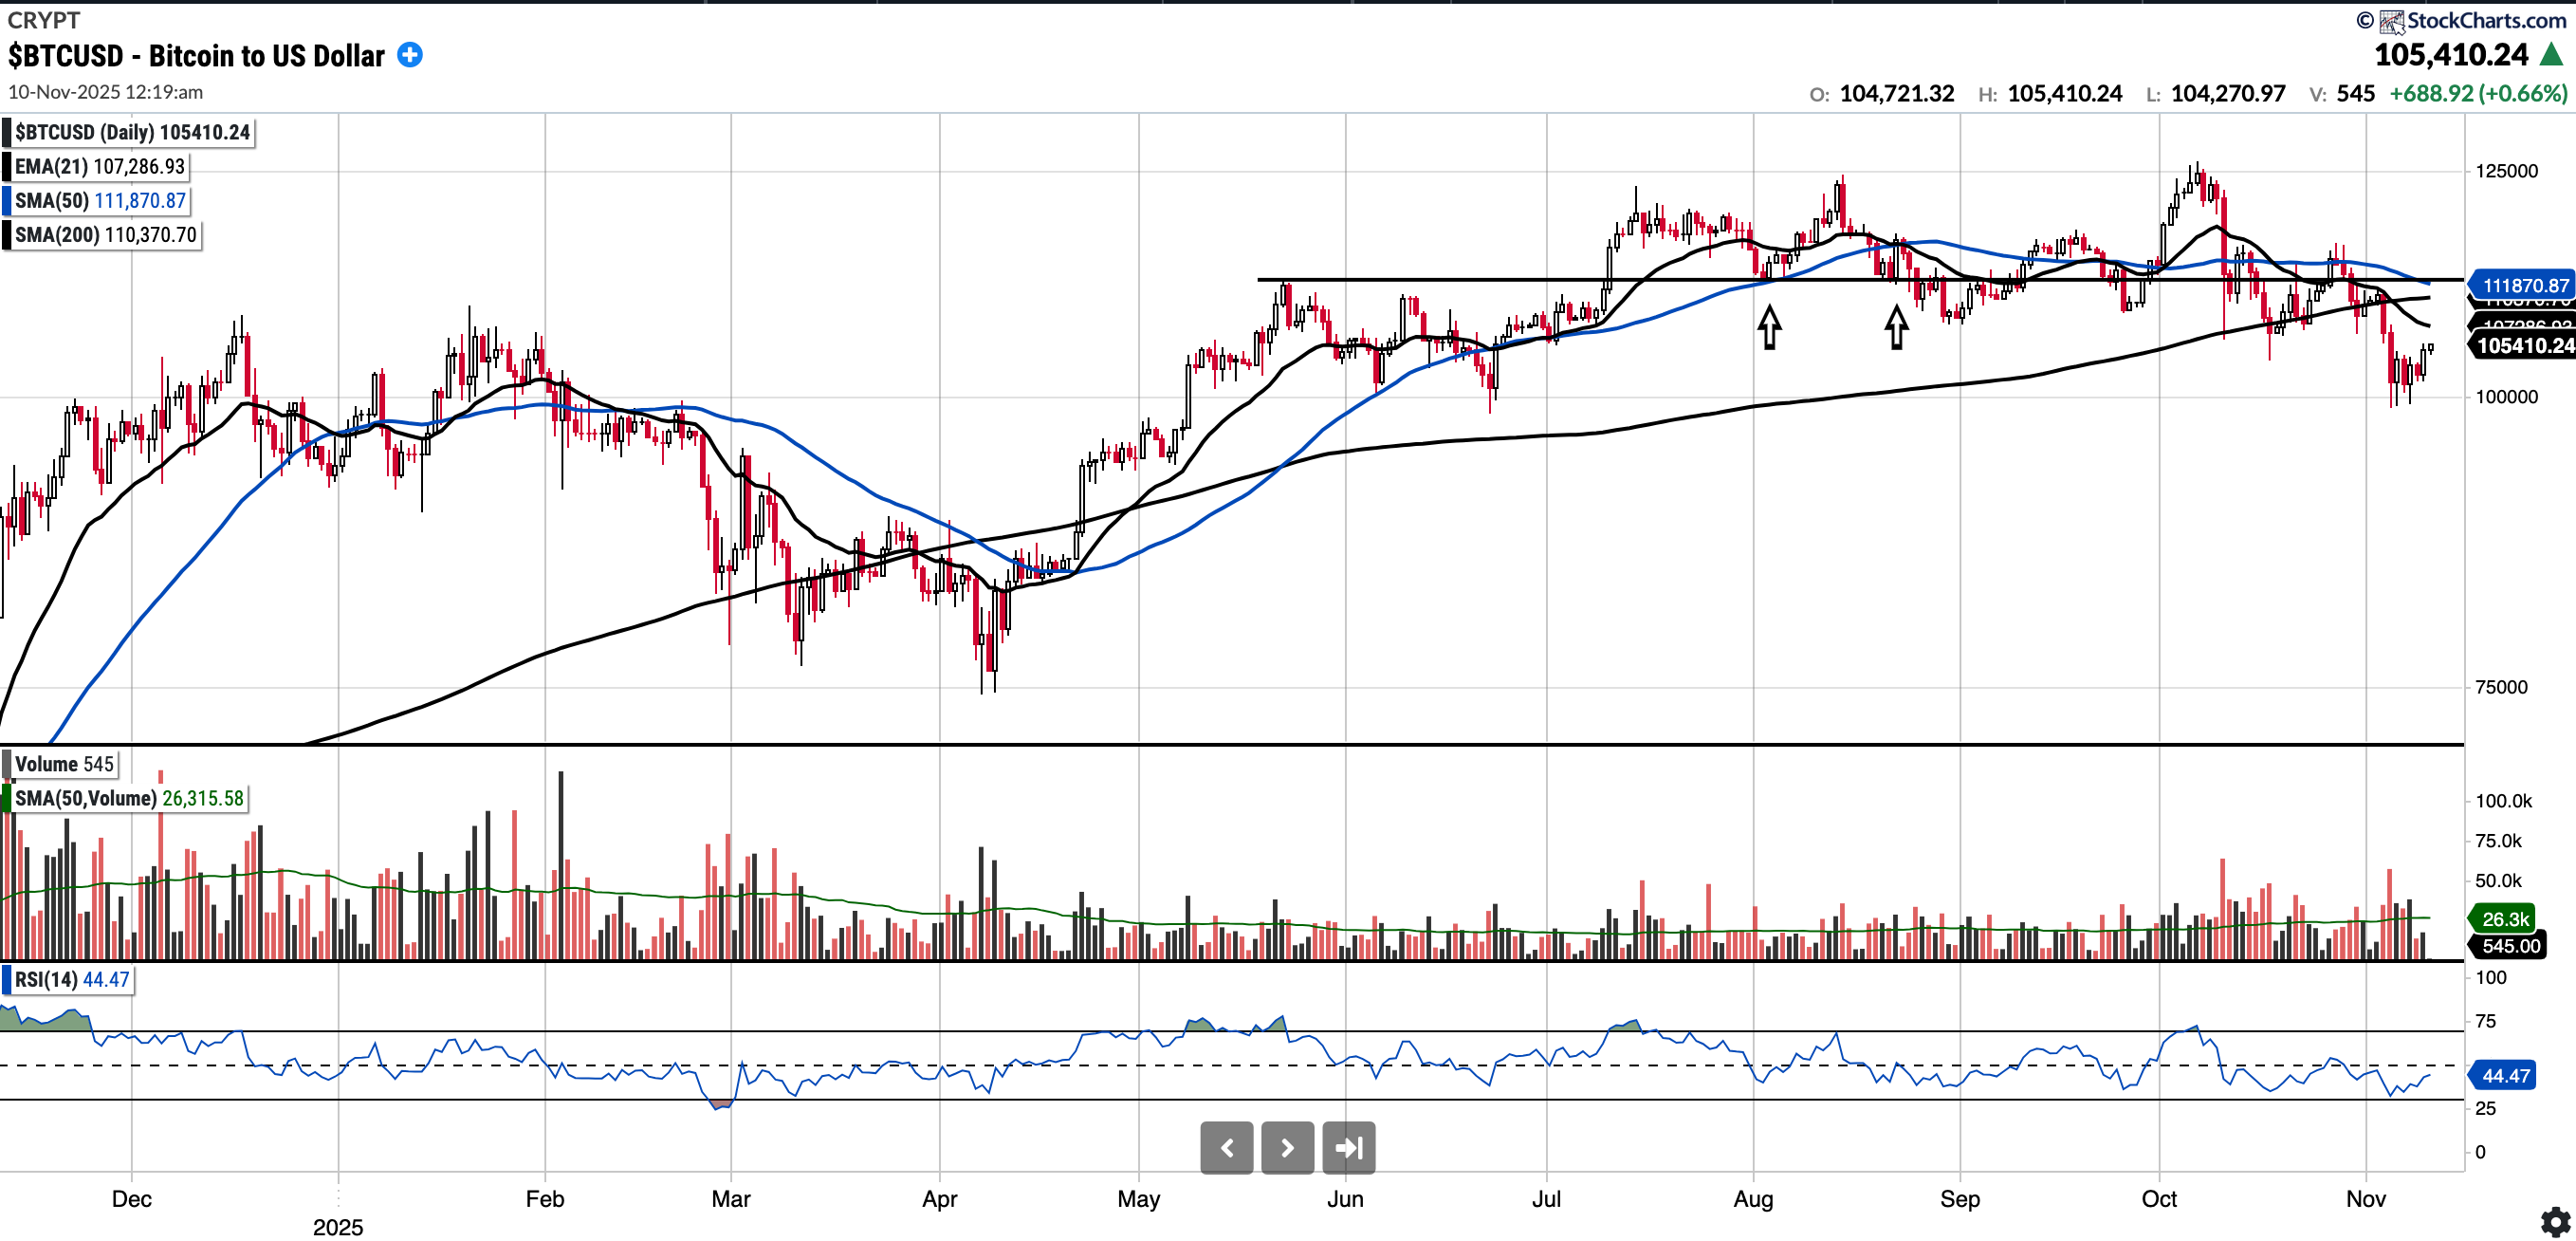
BTC (currently Long)
Currently trades at $105,211.73, 6.13% below the 50SMA and 4.62% below the 200SMA.
RSI 44
11.43% YTD.
BTC broke below the 100k psychological level this week for the first time since June. It remains below the SMA 50, SMA 200 and the 112k level the prior support now turned resistance level. With the gov shutdown potentially adding would like to see how BTC responds especially as it can be a barometer of risk.
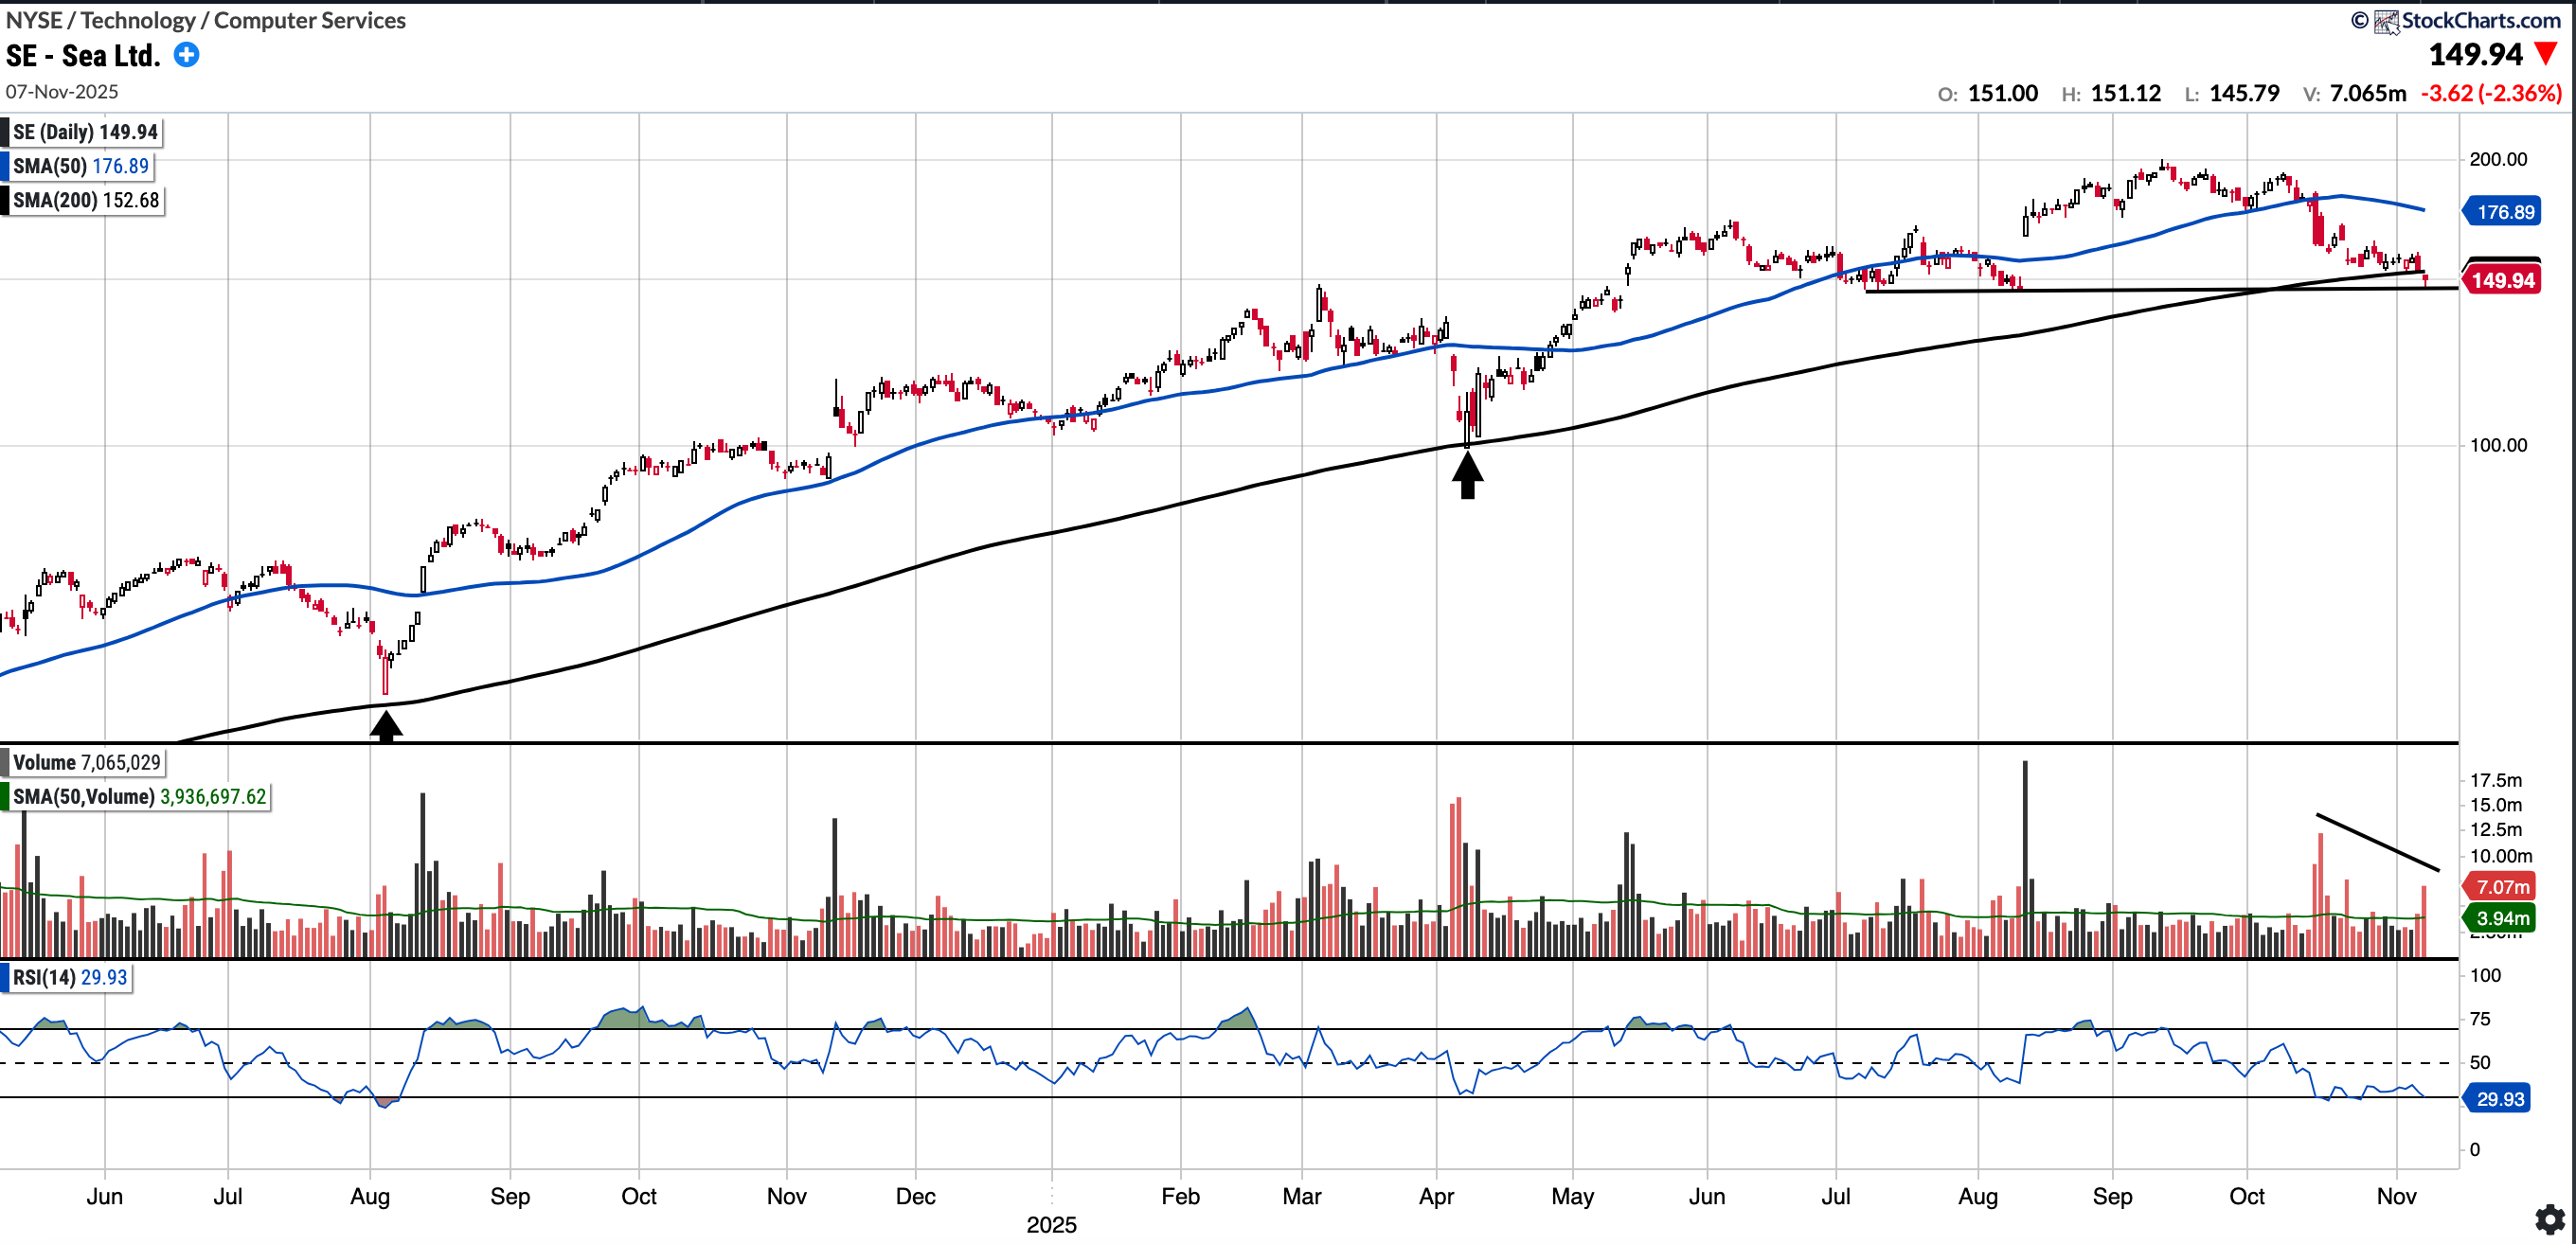
SE (currently Long)
Currently trades at $149.94, 15.24% below the 50SMA and 1.59% below the 200SMA.
RSI 29.93
+42.98% YTD
SE has had a strong couple of years and remains in an uptrend. However, it has pulled back from its recent high of $199 on almost no known news and the sell volume has been notable (see chart). Whilst we held the horizontal support at 145, it is trading below the SMA 200.
Remarkably it trades at PEG of ~0.5 and at current prices ~28x FY26 earnings and ~20x FY27 earnings. SE reports on Tuesday pre-market.
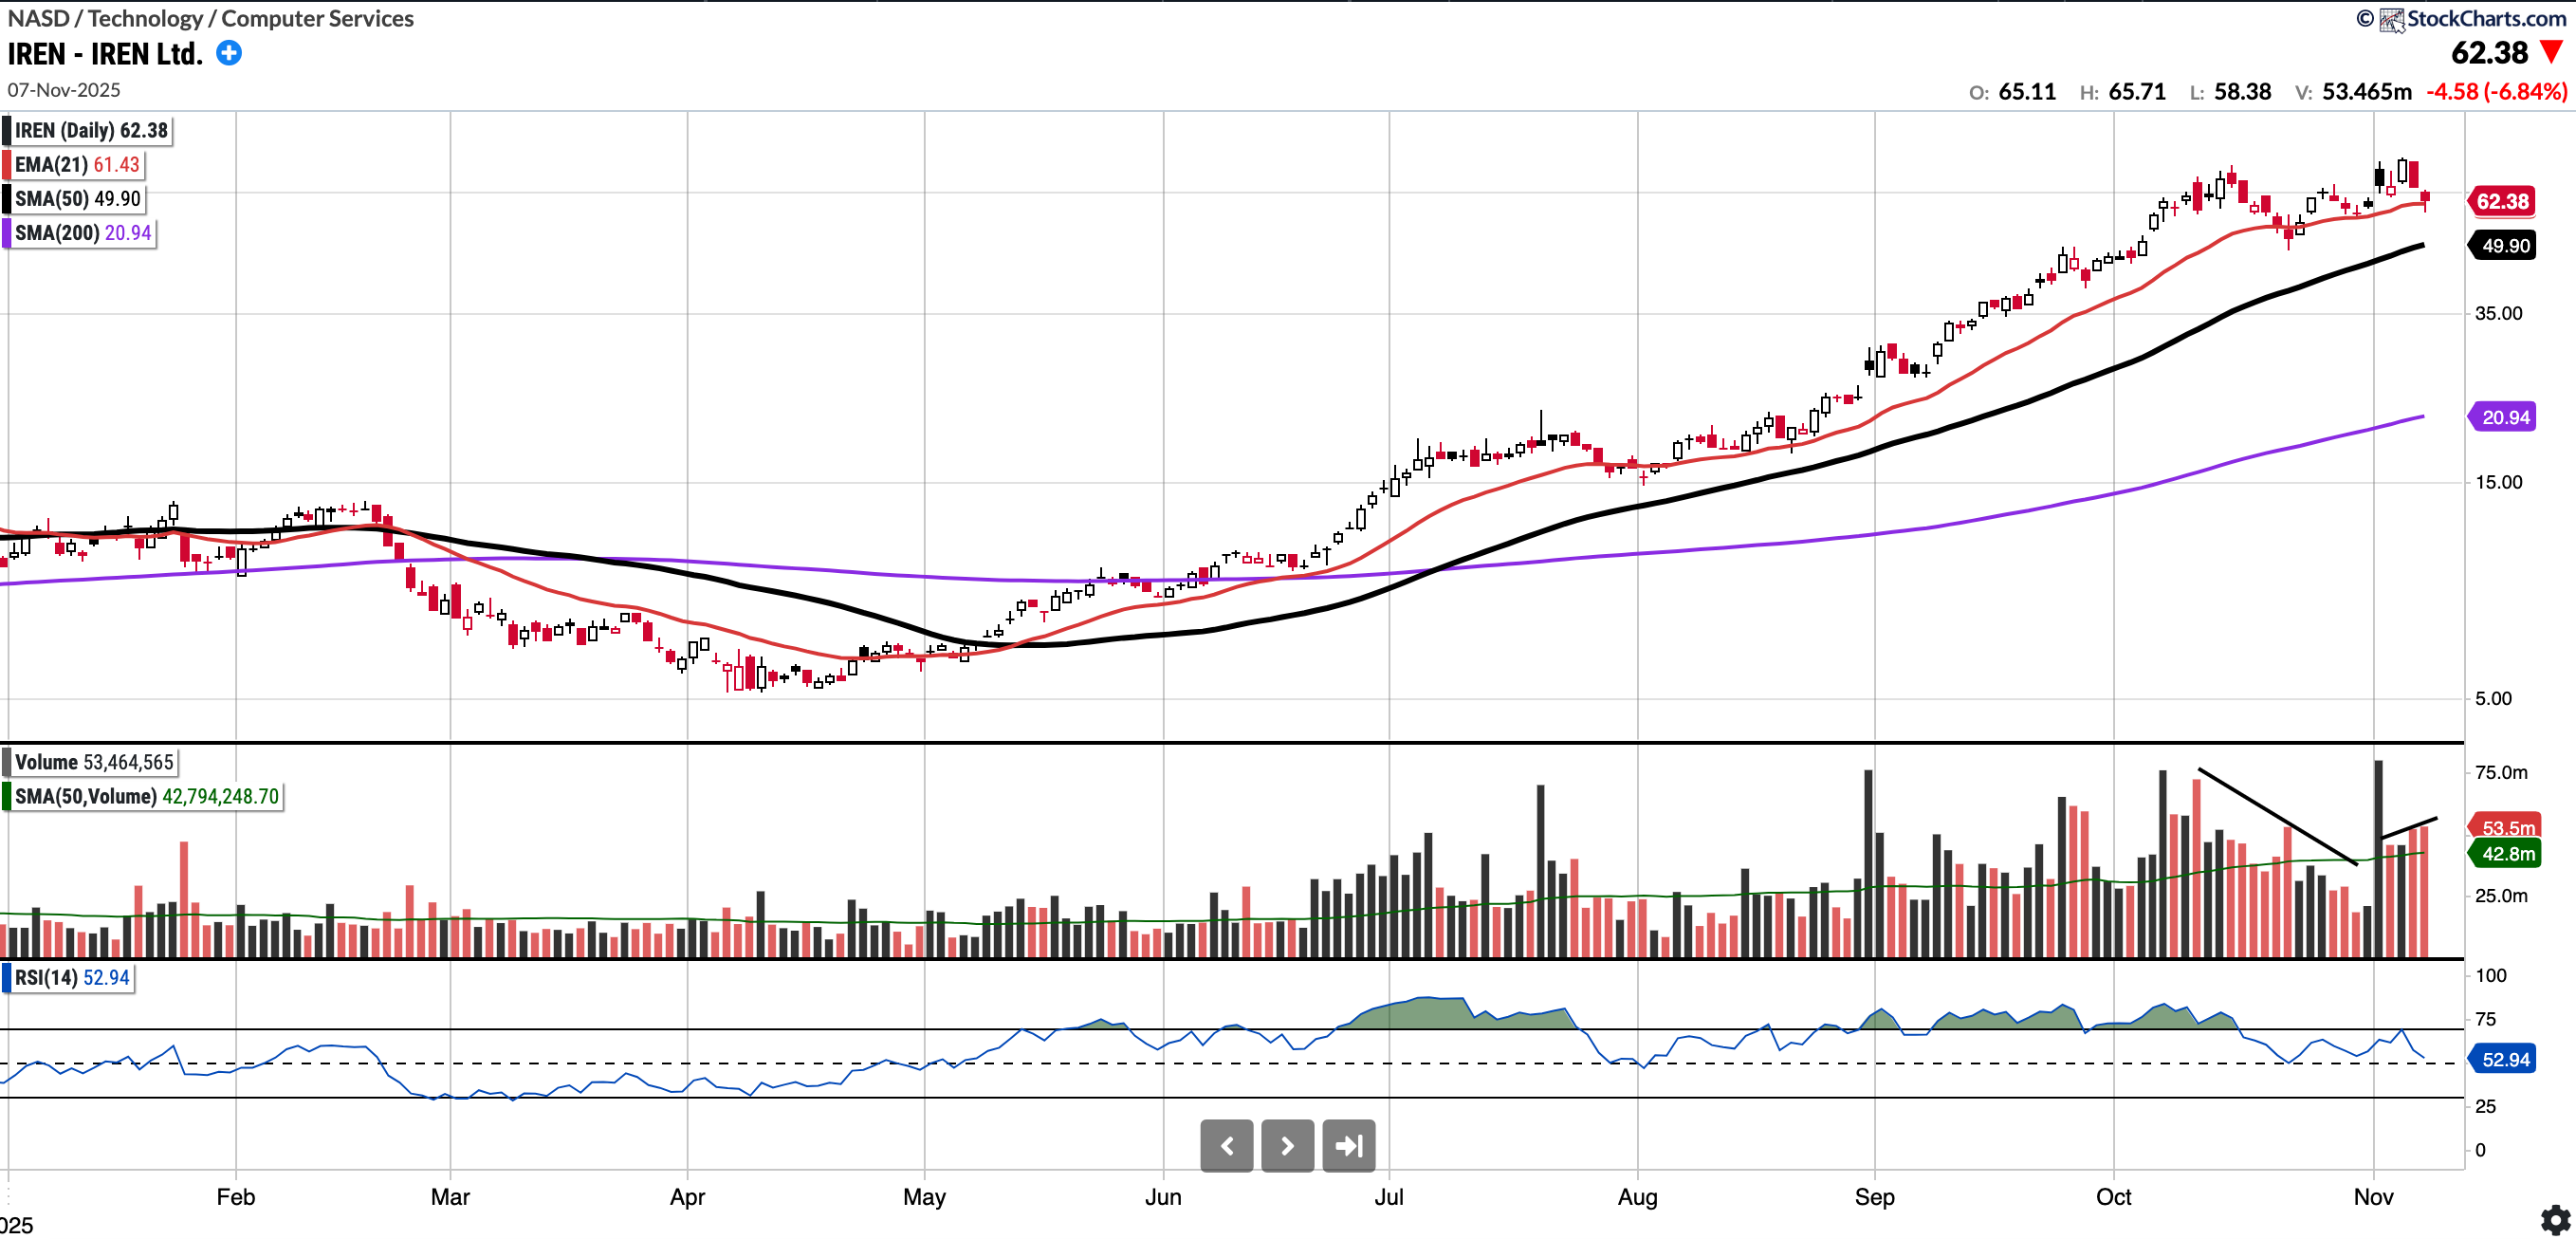
IREN (Currently Long)
Currently trades at 62.38, 25.01% above a rising 50SMA and 197.87% above the 200SMA.
RSI 52.94
496.37% YTD
Recently I wrote “The Hyper-scalers reported and alluded to the fact they need more compute; IREN is a company with the physical infrastructure and GPU’s to fulfil that” On Monday last week we got the news of the deal between IREN, MSFT and Dell which was validation of this.
Below is an infographic simplifying the deal:

The chart remains somewhat extended still and I expect IREN will consolidate, either over time or by price. A pullback to the SMA 50 will happen at some point and may offer a better entry, this also coincides with the $49-$50 support. However, since its run in August it has mostly been respecting the EMA 21.
Notable portfolio changes in previous week (all updated live in subscriber channels):
Entered META
