
Preview of the Week Ahead
W/C Jan 19, 2026

Hope you all are having a good weekend. Below we will be previewing the upcoming week and providing a portfolio update as usual.
Format for what is covered in this weekly preview:
A look at the indices
Key upcoming economic events
Upcoming earnings reports
Charts
Notable portfolio changes from the previous week
Current Portfolio Holdings (Position size, cost basis, and commentary on each holding regarding the intended holding period and any planned activity)
Closing Thoughts
I highly recommend checking out the latest Monthly Portfolio and Performance Update (TWR +400% since Jan ‘23), as well as my post below covering the stocks and setups I like heading into 2026.
Monthly Portfolio Update

I hope you are well. Below, we provide market commentary and an in-depth portfolio update.
A list of stocks I'm looking to add to, and at what levels, if we see a meaningful correction.

We are currently in a mid-term election year. Historically, there tends to be a large drawdown in the S&P 500 within the 12 months leading up to election day. While the average drawdown is 18.2%, post-mid-term performance tends to be strong. Given the current macro backdrop and geopolitical events, further volatility is to be expected.
For all readers a reminder that taking on board the feedback from the Six Sigma Research poll, I have extended a one time discount on the annual membership which expires at the end of the month (long term games with long term people).
This saves approximately 30% compared to the monthly rate and is more than 45% cheaper than the Substack app price.
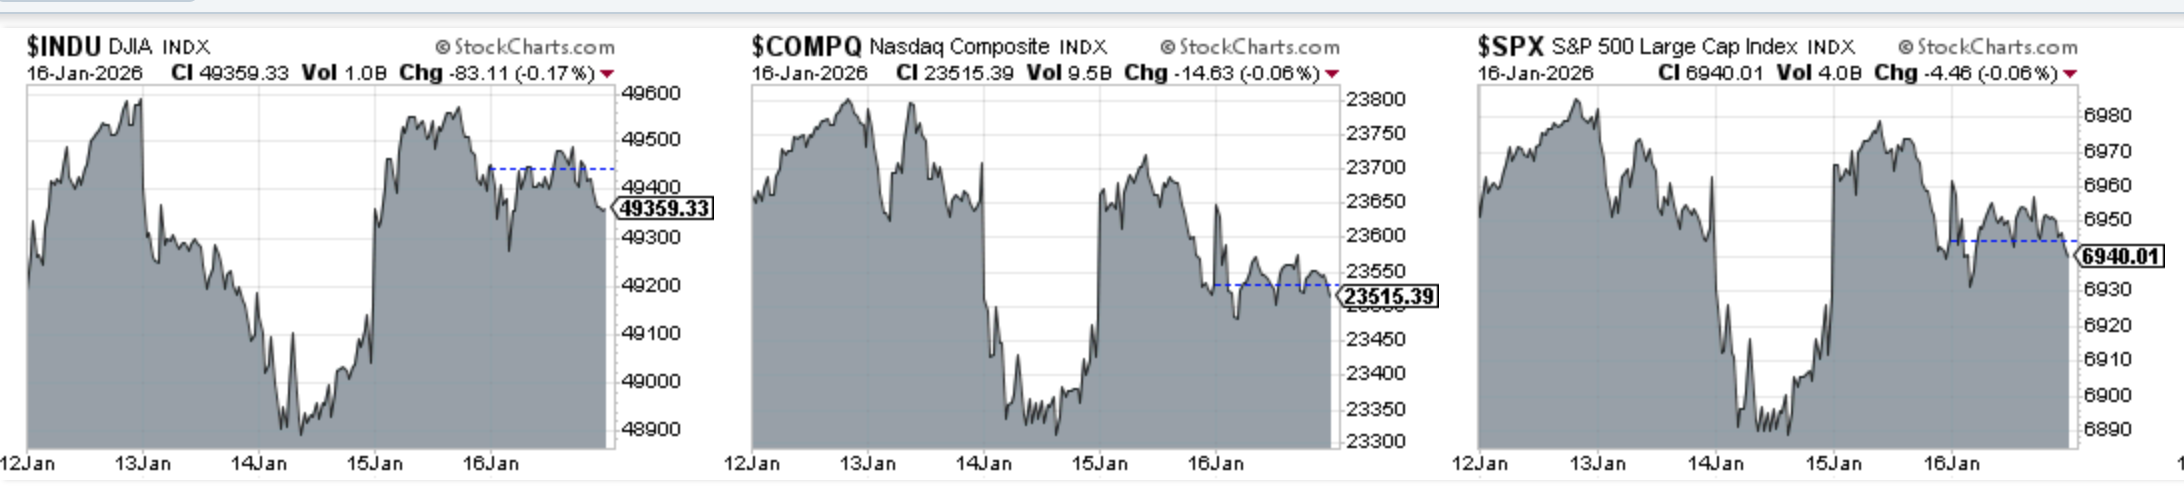
Indices
Dow Jones advanced 0.66% in the last week
S&P 500 decline 0.05% in the last week
Nasdaq Composite declined 0.53% in the last week
IWM advanced 2.84% in the last week
Key upcoming economic events:
Monday, January 19
Market Holiday
Tuesday, January 20
ADP Employment Change (Weekly/Monthly update)
Treasury Bill Auctions
Wednesday, January 21
MBA Mortgage Applications
Construction Spending (October/September)
Pending Home Sales (December)
Thursday, January 22
GDP Annualised (Q3 Final Revision)
PCE Price Index (November/Q3 Data)
Initial Jobless Claims
Personal Income and Spending (November)
Friday, January 23
S&P Global Flash PMIs (January)
University of Michigan Consumer Sentiment (January Final)
Upcoming Earnings
I have no portfolio positions reporting in the upcoming week. Below is the infographic by Earnings Whispers:

Charts
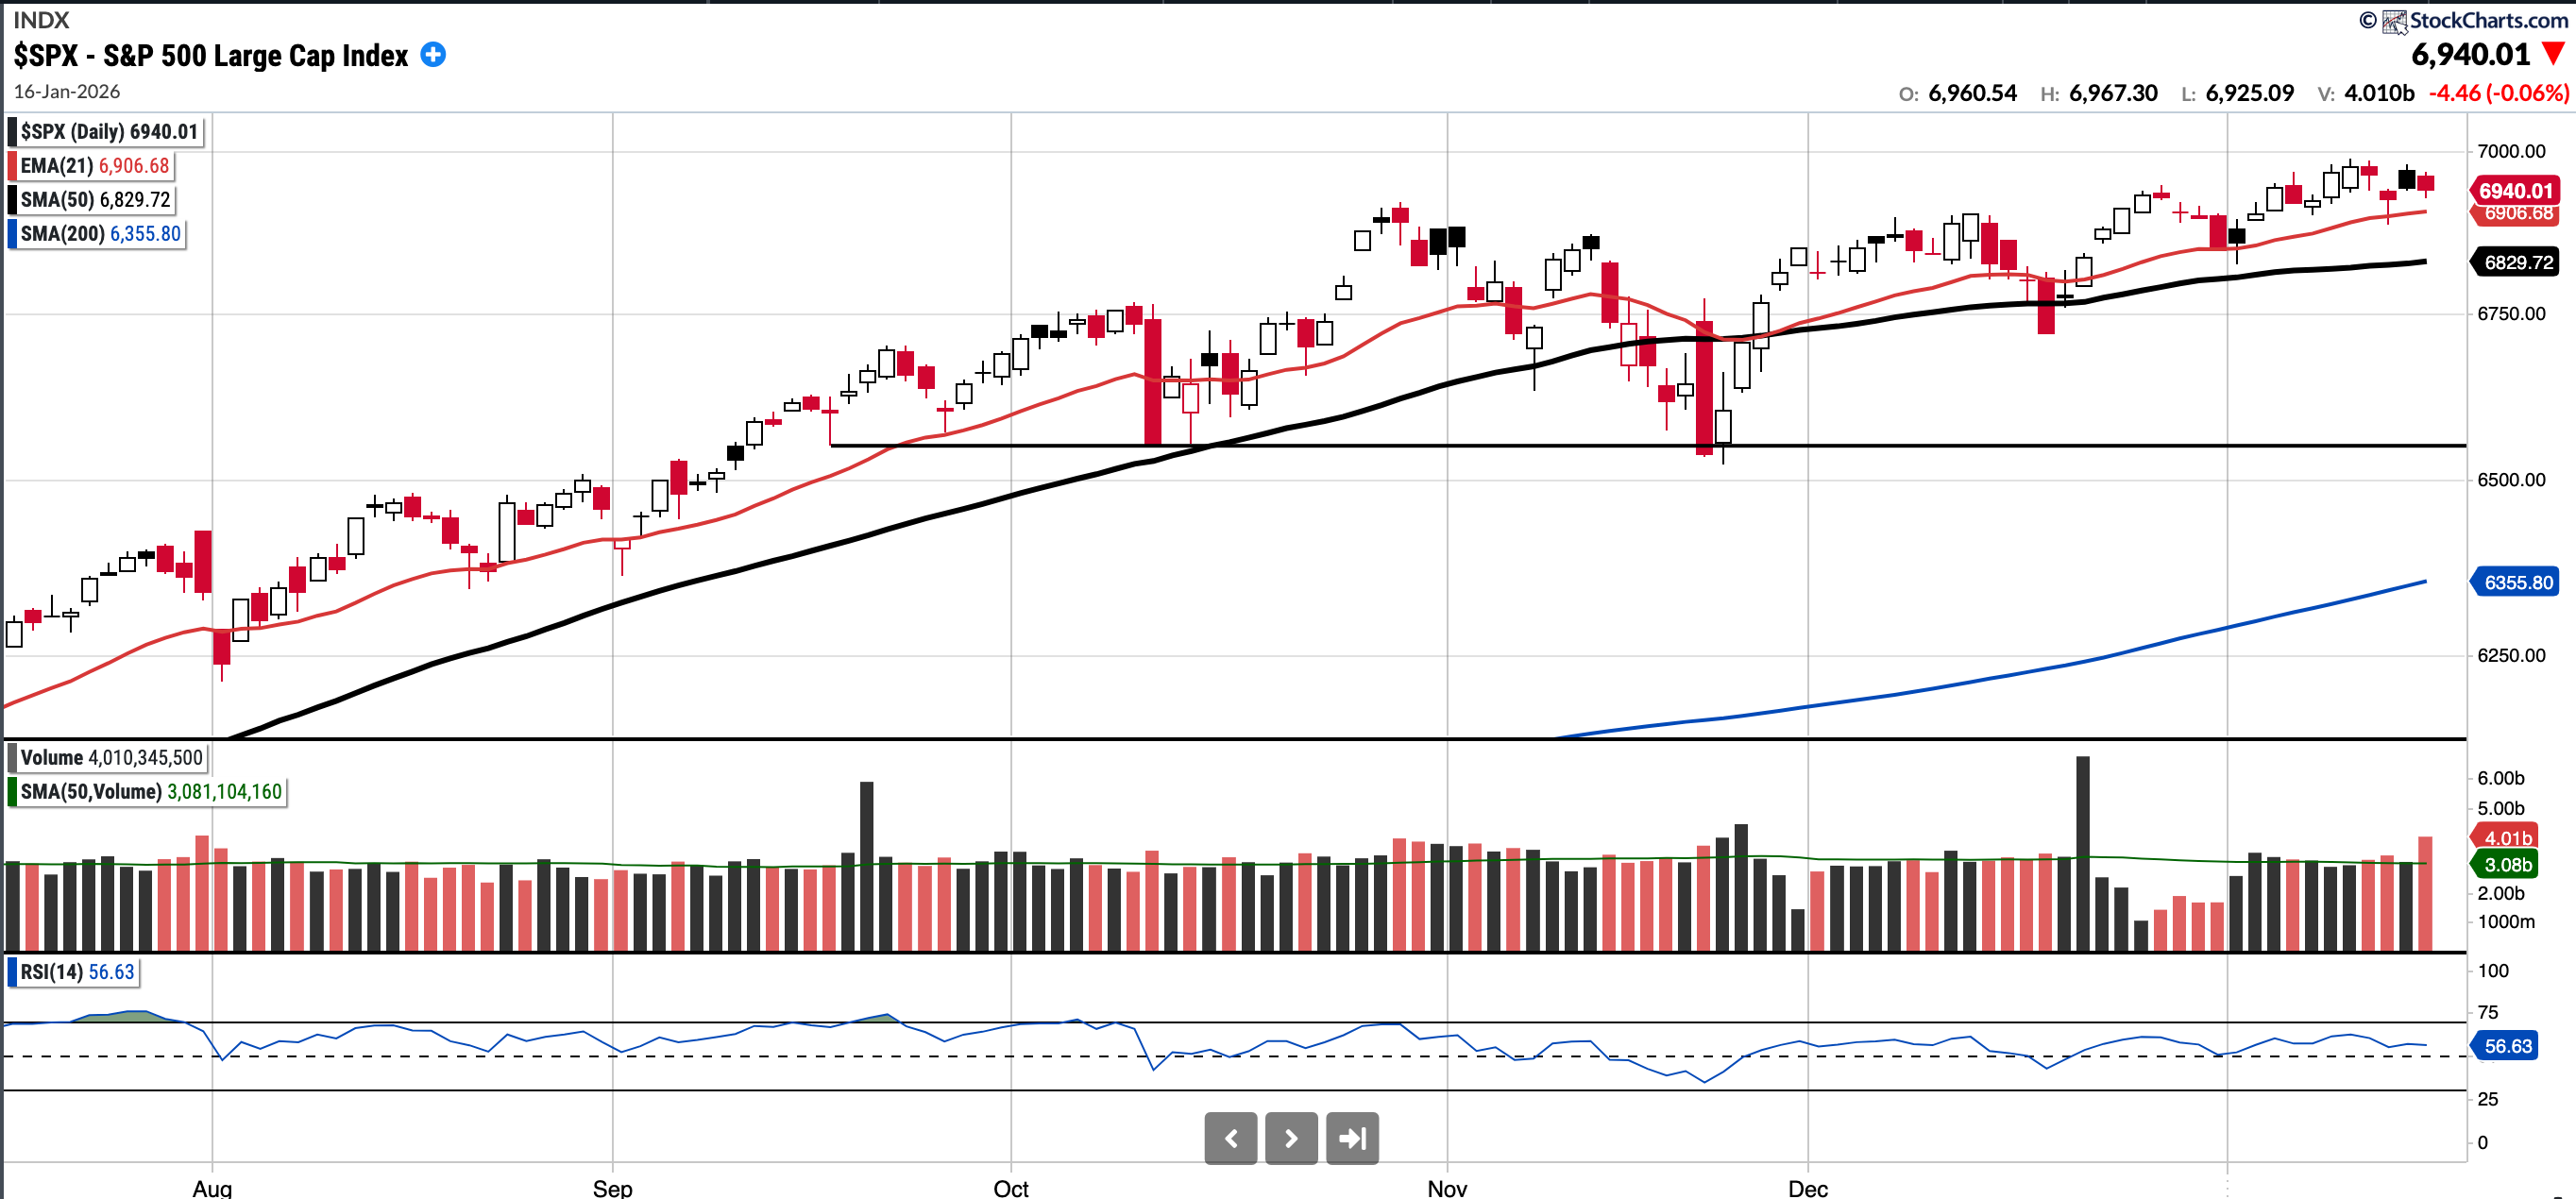
SPX
Currently trades at 6940.01, 1.61% above a rising 50SMA and 9.19% above the 200SMA.
RSI 56.63
+1.19% YTD
Distribution days in the last week: 1
The SPX remains above all key MA’s and despite a few red days, SPX printed a new ATH this week.
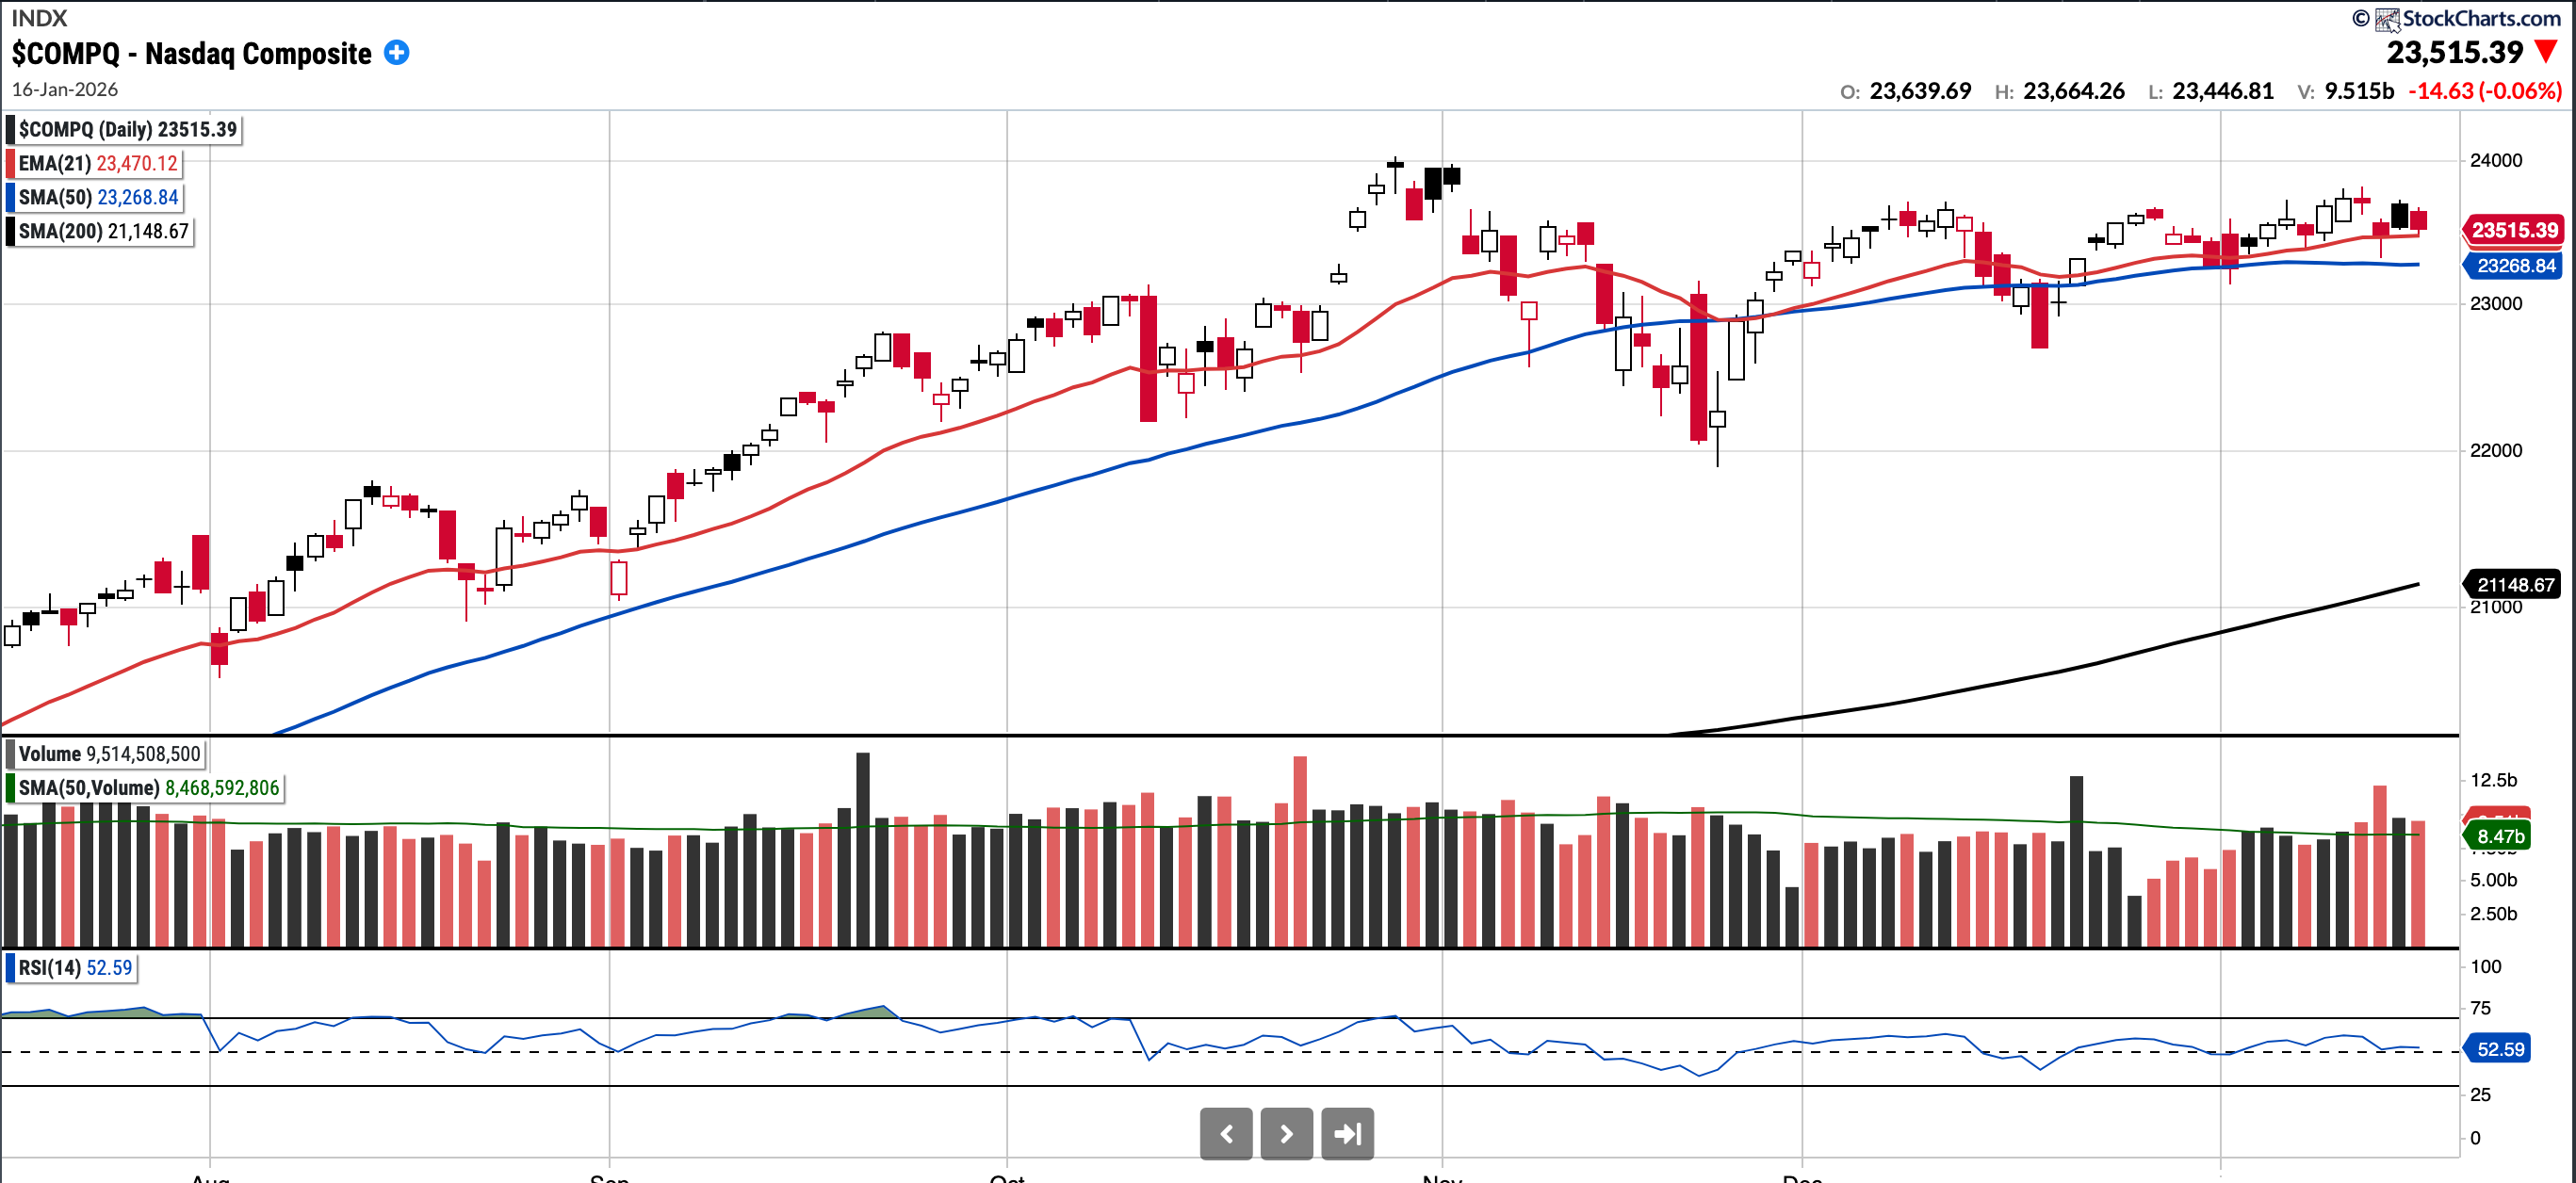
COMPQ
Currently trades at 23,515.39, 1.06% above a rising 50SMA and 11.19% above the 200SMA.
RSI 58.31
1.88% YTD
Distribution days in the last week: 1
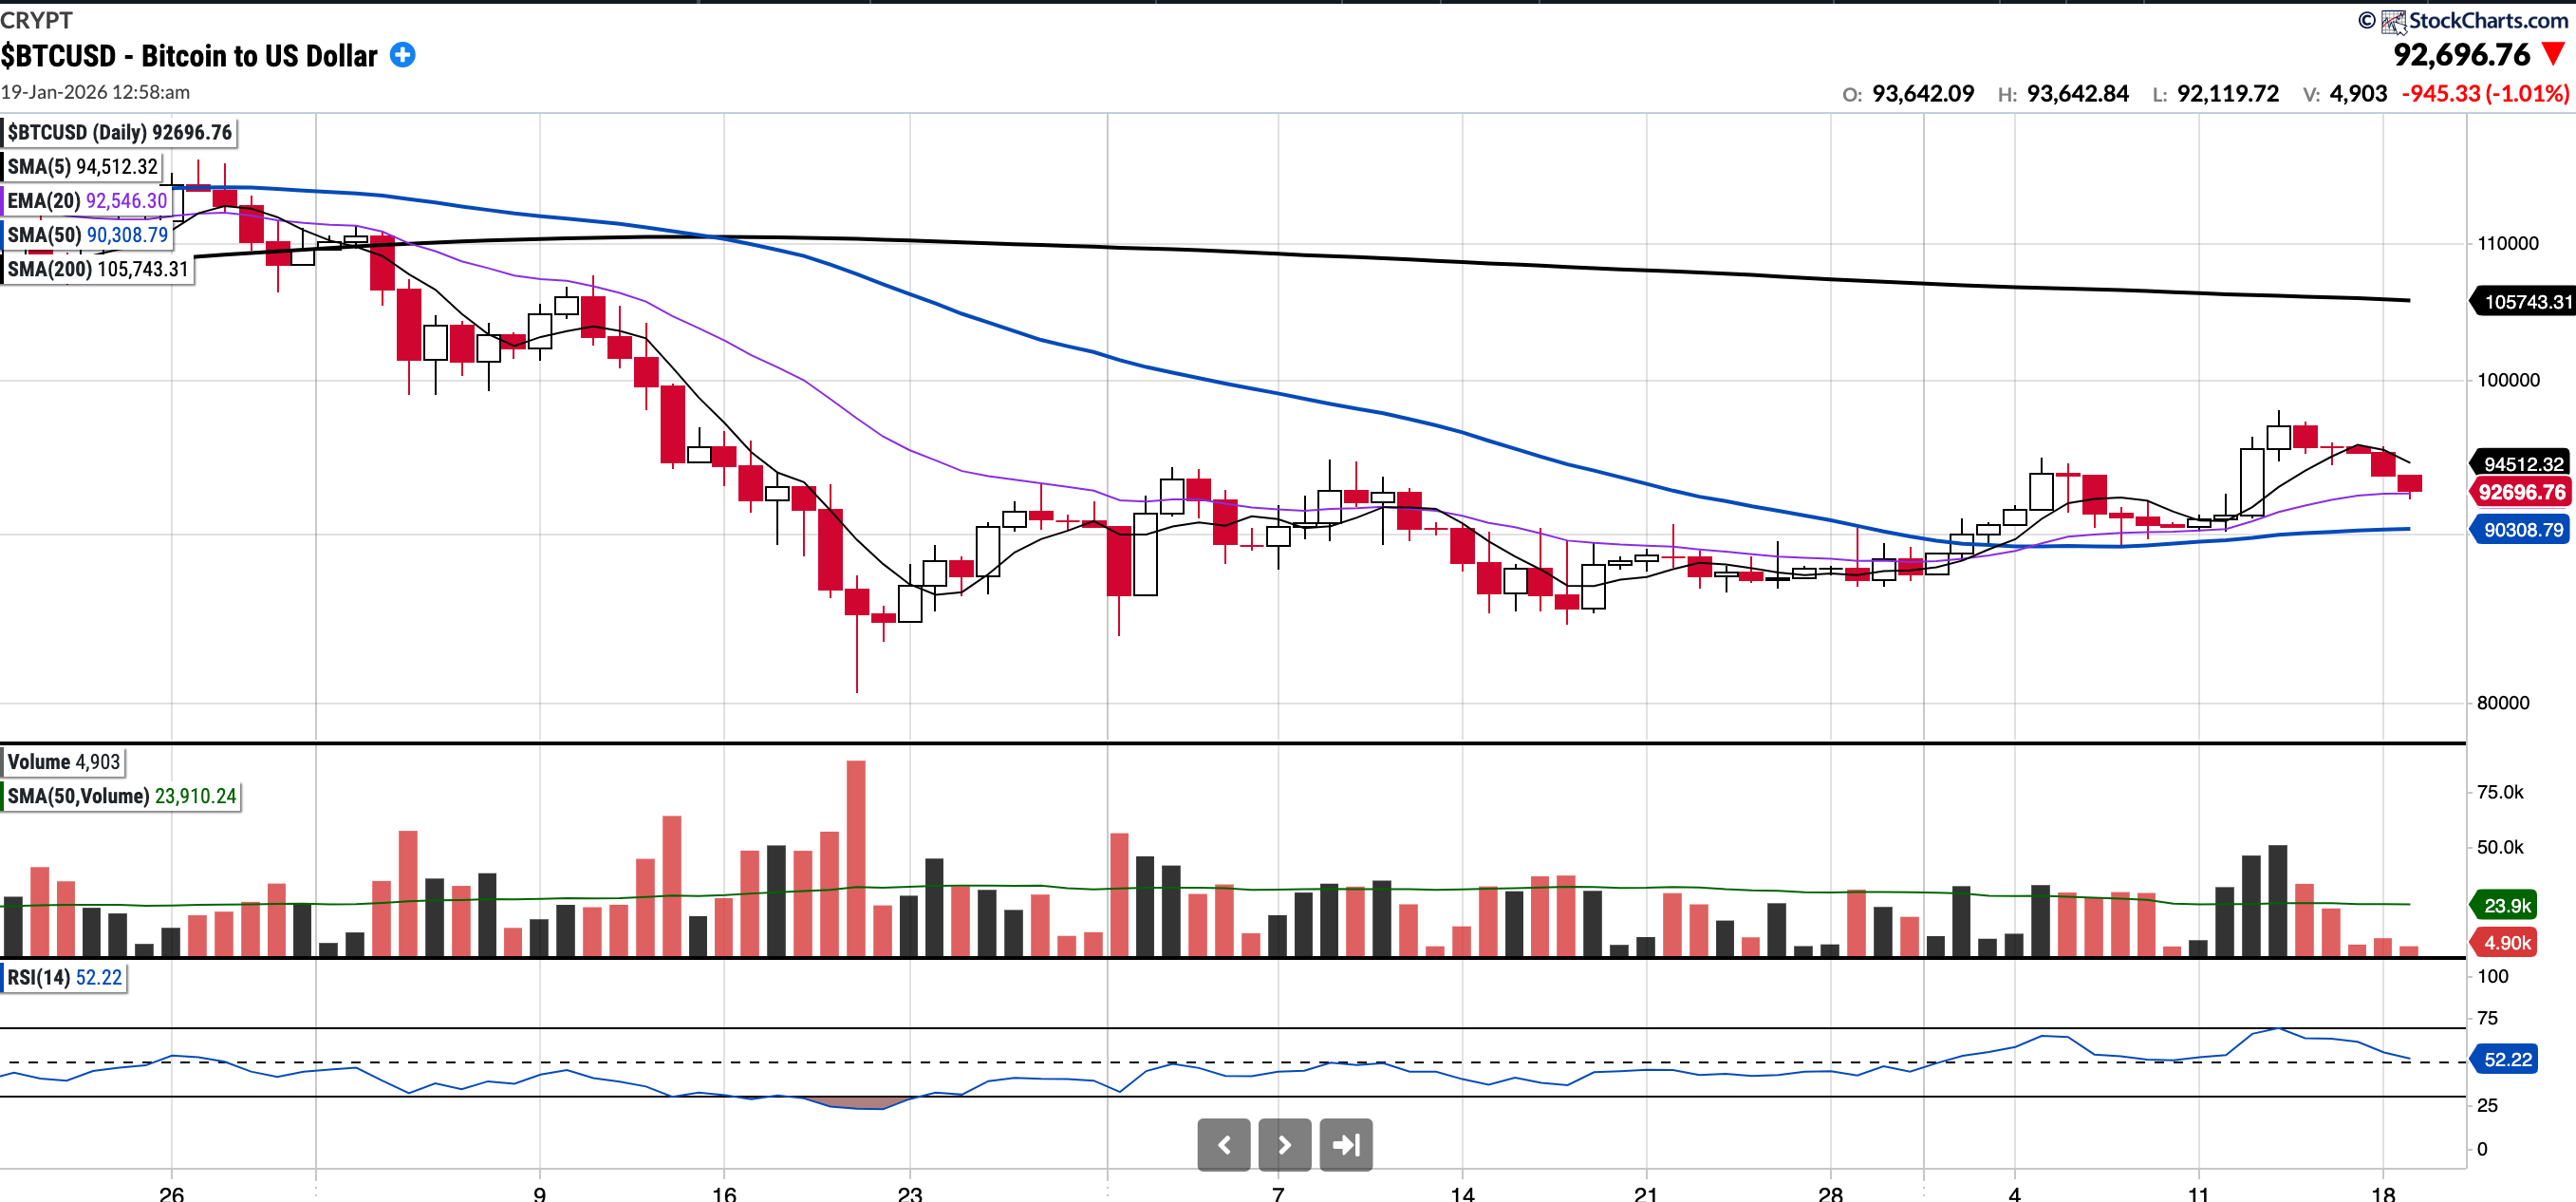
BTC (currently Long)
Currently trades at $92,696.76, 2.7% above the 50SMA and 12.29% below the 200SMA.
RSI 52.22
+6% YTD.
BTC is up >$2000 on the week although is showing weakness as of Sunday night. For now, it is holding the the EMA 20 and SMA 50 but for me above 94.5k is where it starts to look more constructive. More work to be done.
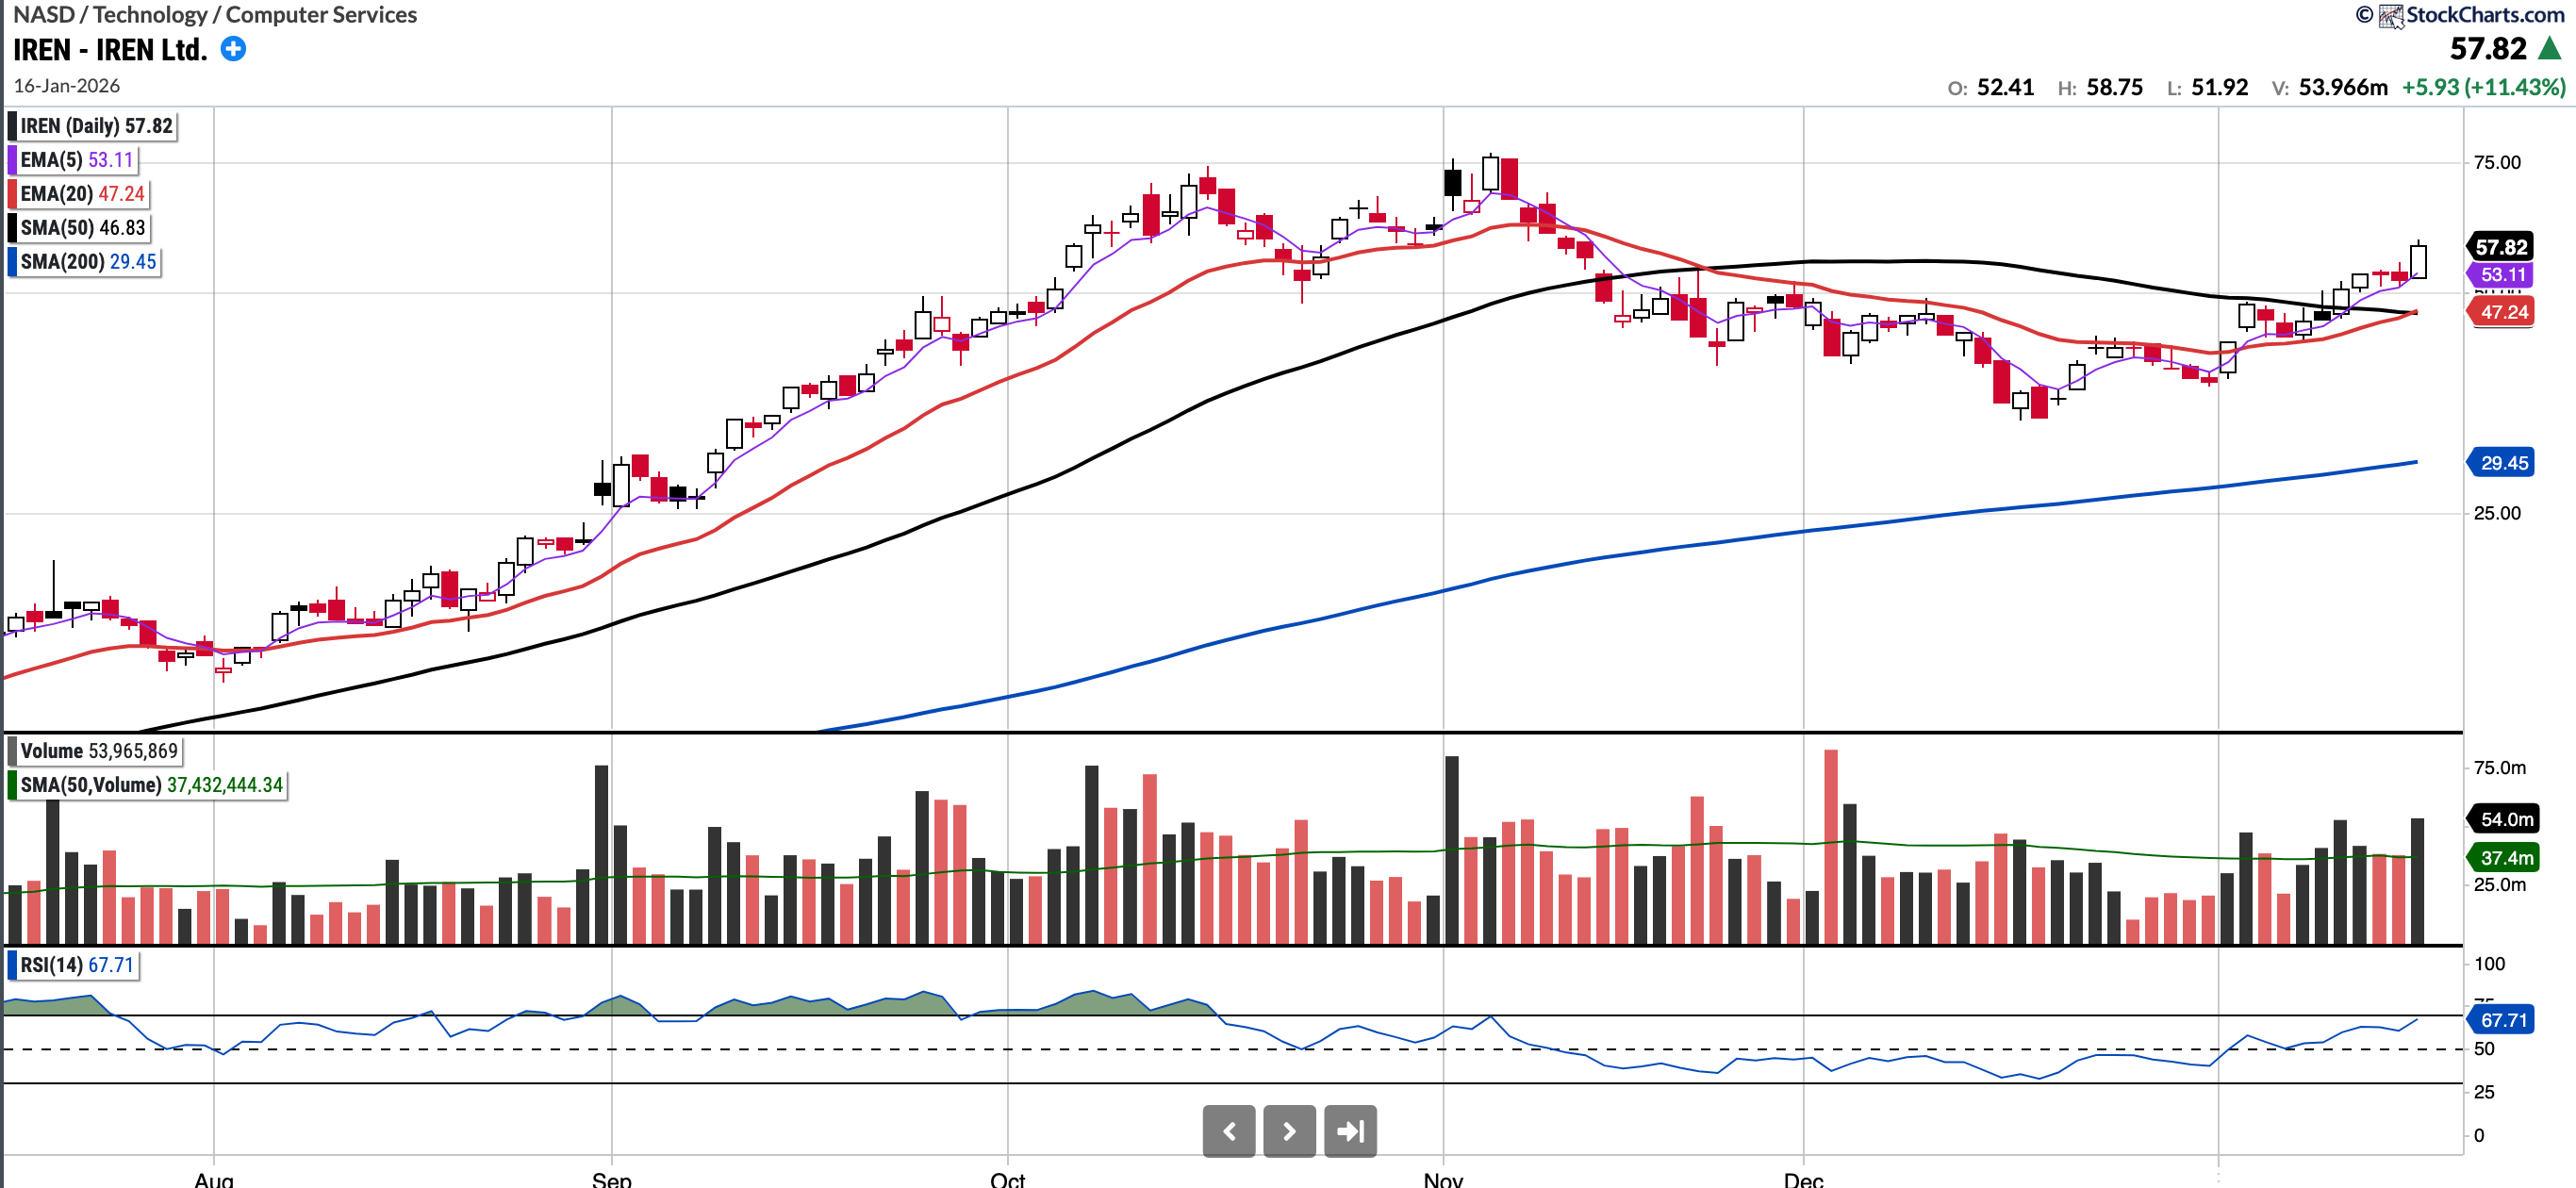
IREN (No position at present)
Currently trades at $57.82, 23.47% above the 50SMA and 96.30% above the SMA 200.
RSI 67.71
+35.41% YTD
Last week I had stated:
“IREN remains in an uptrend on a longer time frame although remains below the descending overhead SMA 50.
The chart is starting to look a lot more constructive with the 5EMA crossing above the 20EMA, the 20EMA serving as support plus some volume entering the stock. I will be looking for an entry either on a low volume pullback to support or if and when it flips the SMA 50 and holds that as support. I expect this moves higher this week.”
IREN had a strong trading week, up over 25% and is currently holding above all key moving averages. Bulls are looking for continuation this week, though any low-volume pullbacks to the high 40s could be buyable.
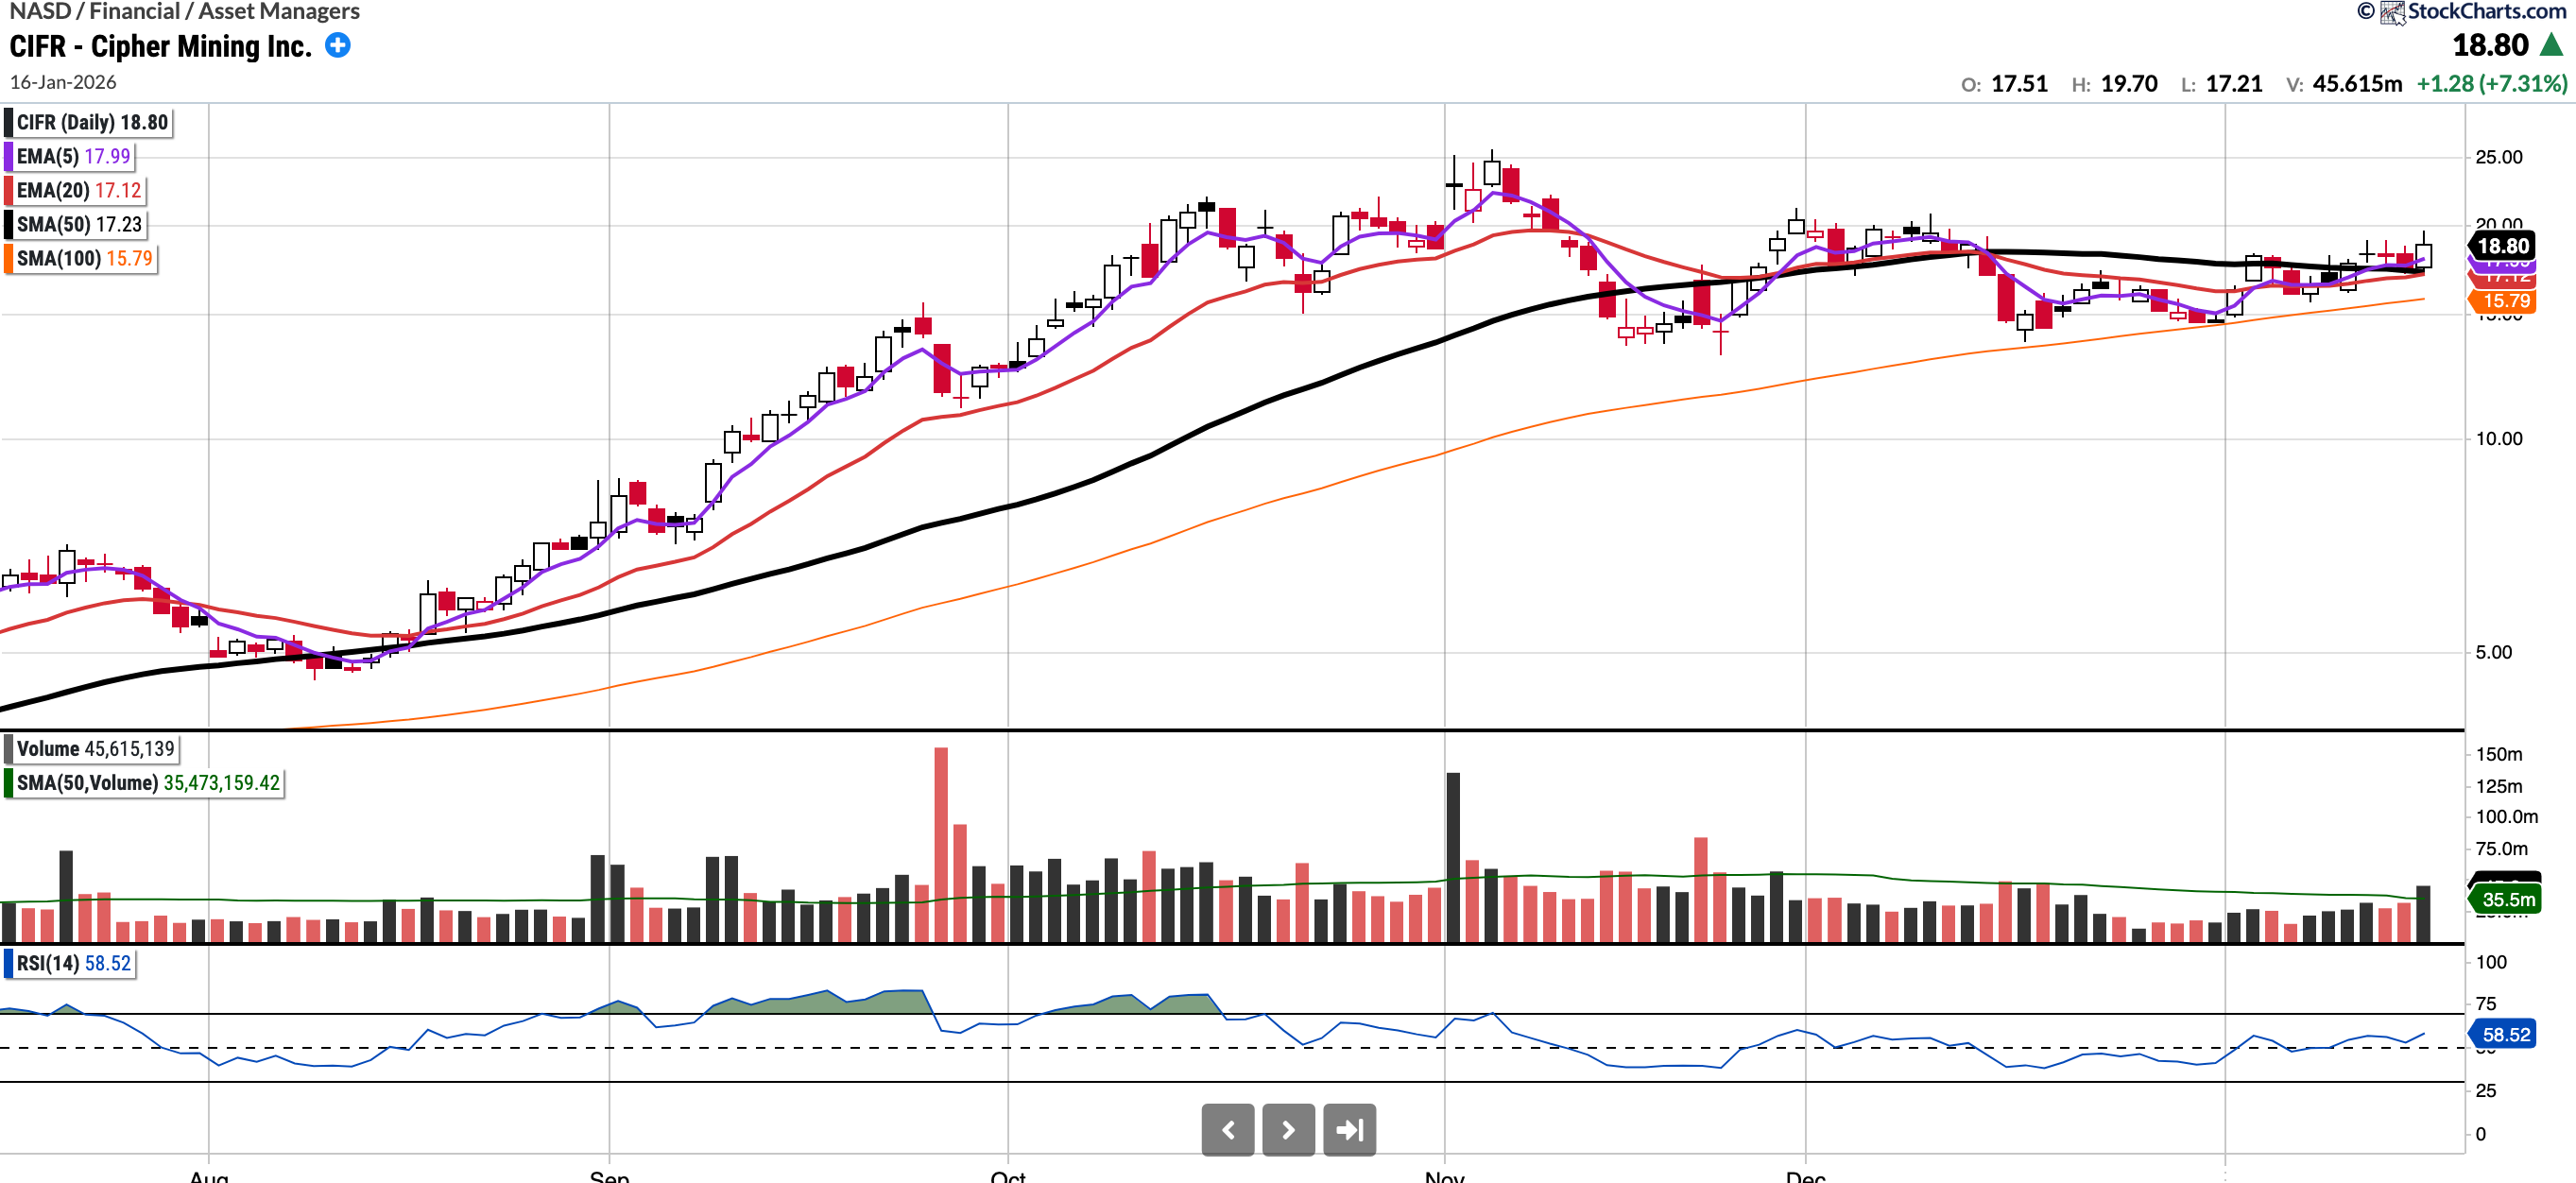
CIFR
Currently trades at $18.8, 9.08% above the 50SMA and 87.8% above the SMA 200.
RSI 58.52
+16.05% YTD
$CIFR is another player in the HPC/AI data center space, though unlike IREN, it carries much lower hardware depreciation risk. The chart is setting up very nicely; for CIFR, the key level to watch is the 100-day SMA, which the stock has been respecting of late.
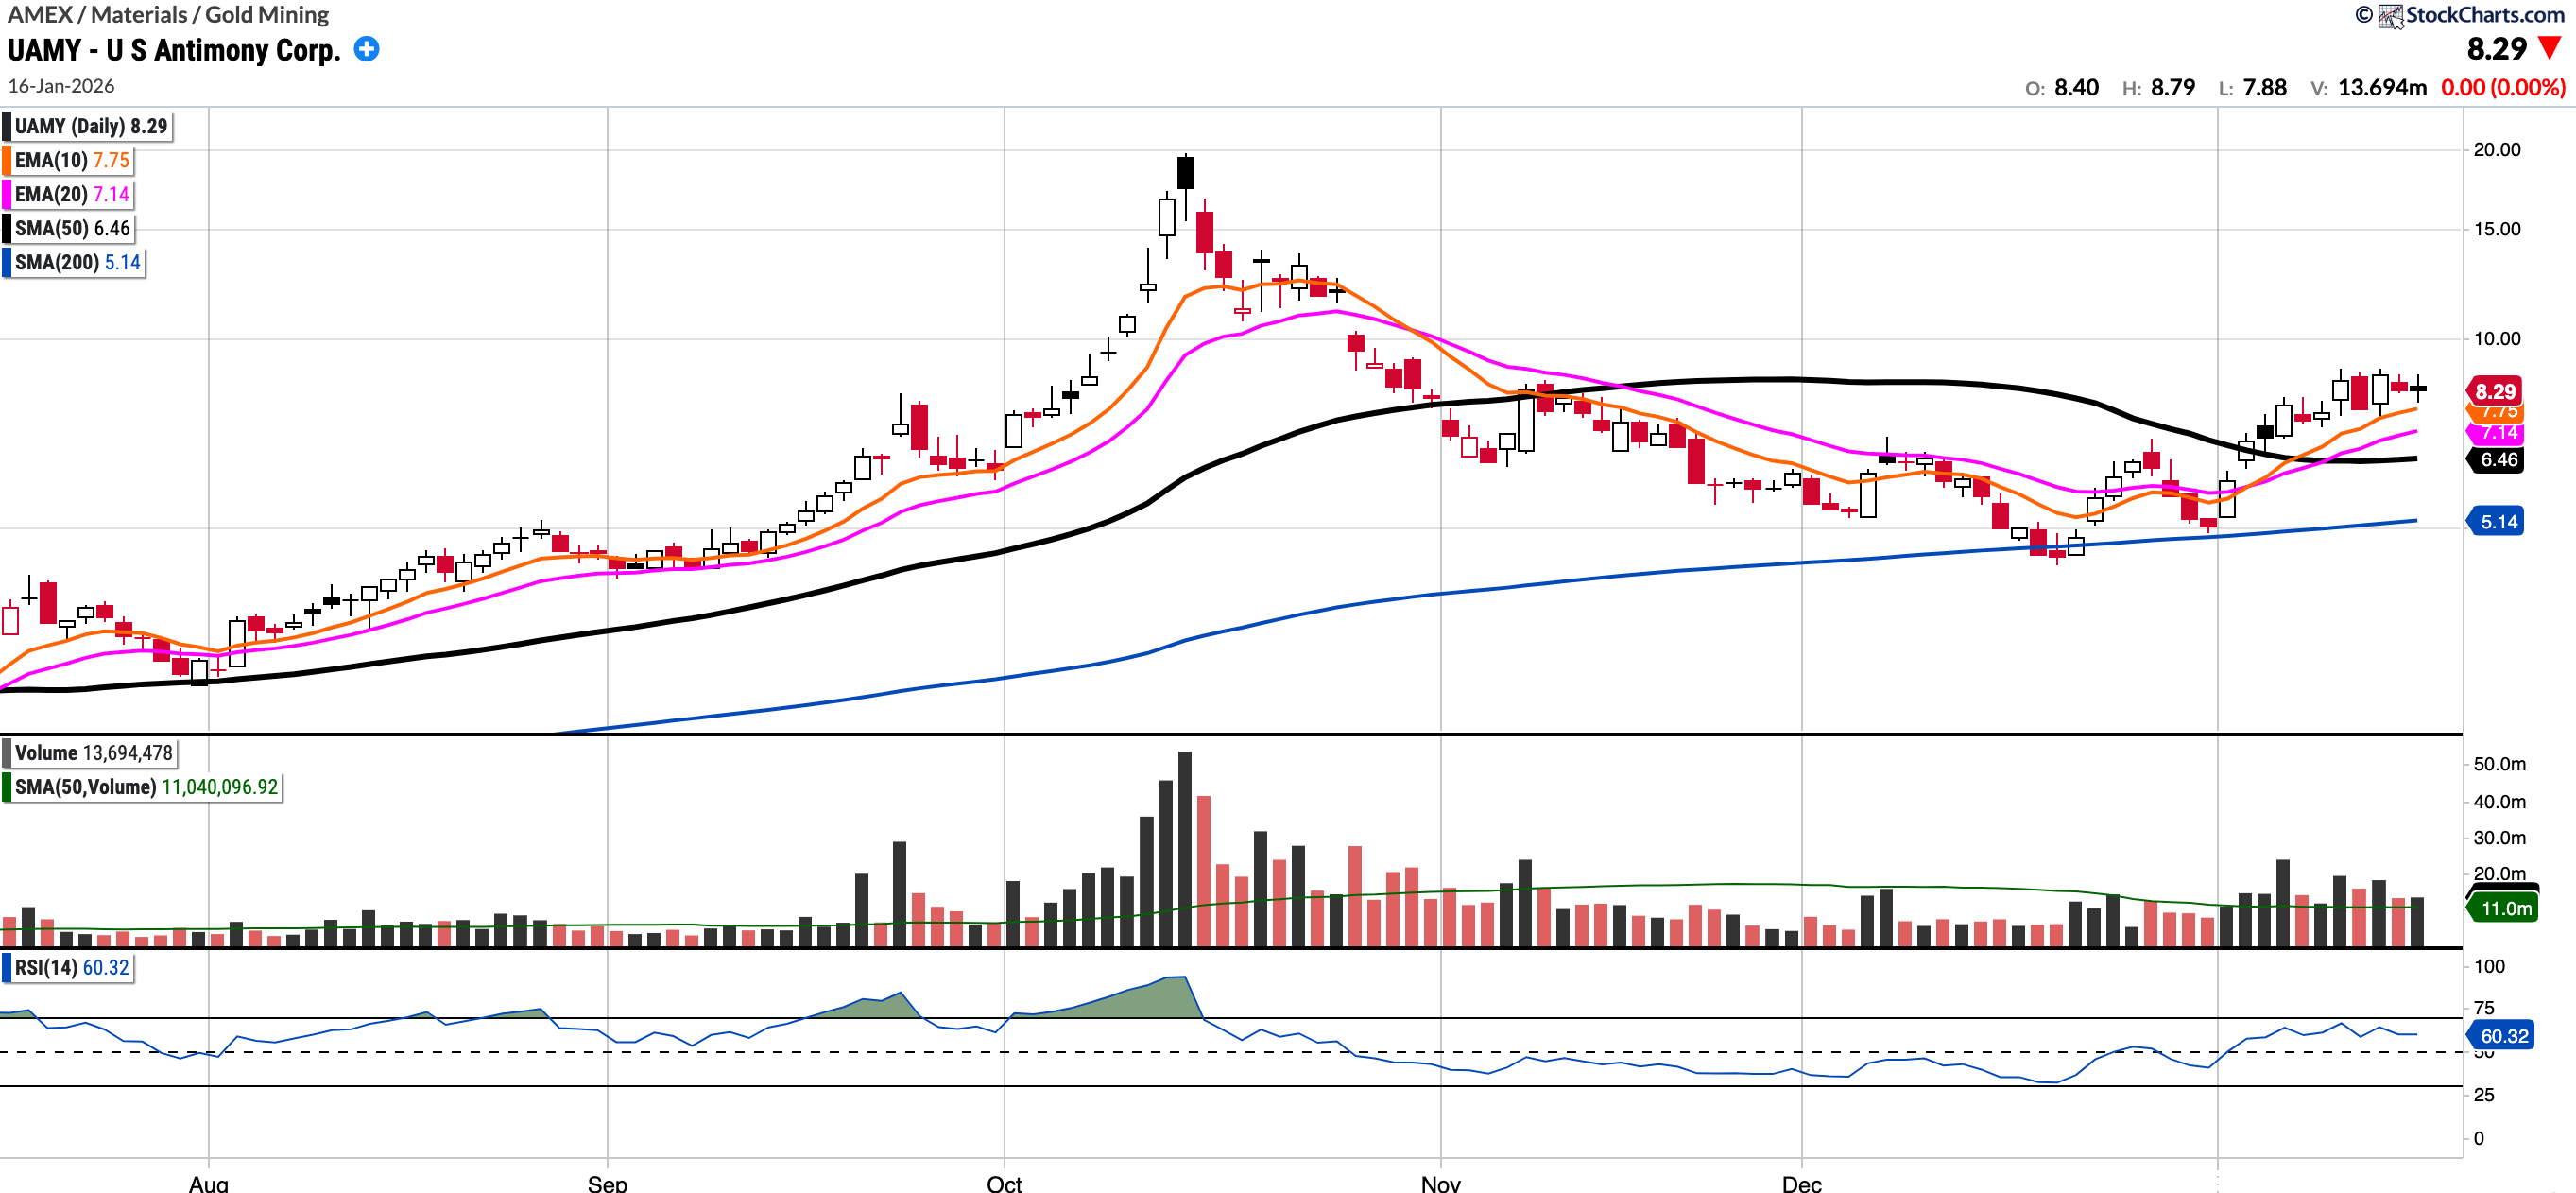
UAMY (No position at present)
Currently trades at $8.29, 28.4% above the 50SMA and 61.31% above the 200SMA.
RSI 60.32
+39.8% YTD
UAMY (US Antimony Corp) is the only fully integrated antimony producer and smelter in North America. They restarted domestic mining this year and they have recently secured two five-year contracts one of which includes a $245M deal with the Defense Logistics Agency (DLA) for high-purity antimony, and a $107M commercial agreement for industrial antimony trioxide.
The bull case for this stock is built on the U.S. government’s continued prioritisation of domestic mineral independence.
I featured this stock at the start of the year, and it is already up over 50%. I’ve traded in and out of the position, but given the ongoing "critical minerals war," I believe $UAMY still has upside if one can get a good entry. The chart is setting up nicely with strong volume and a bullish moving average crossover. For those looking for a new entry, I feel it’s best to wait for a retest of the 10 or 20 EMA. Watching closely.
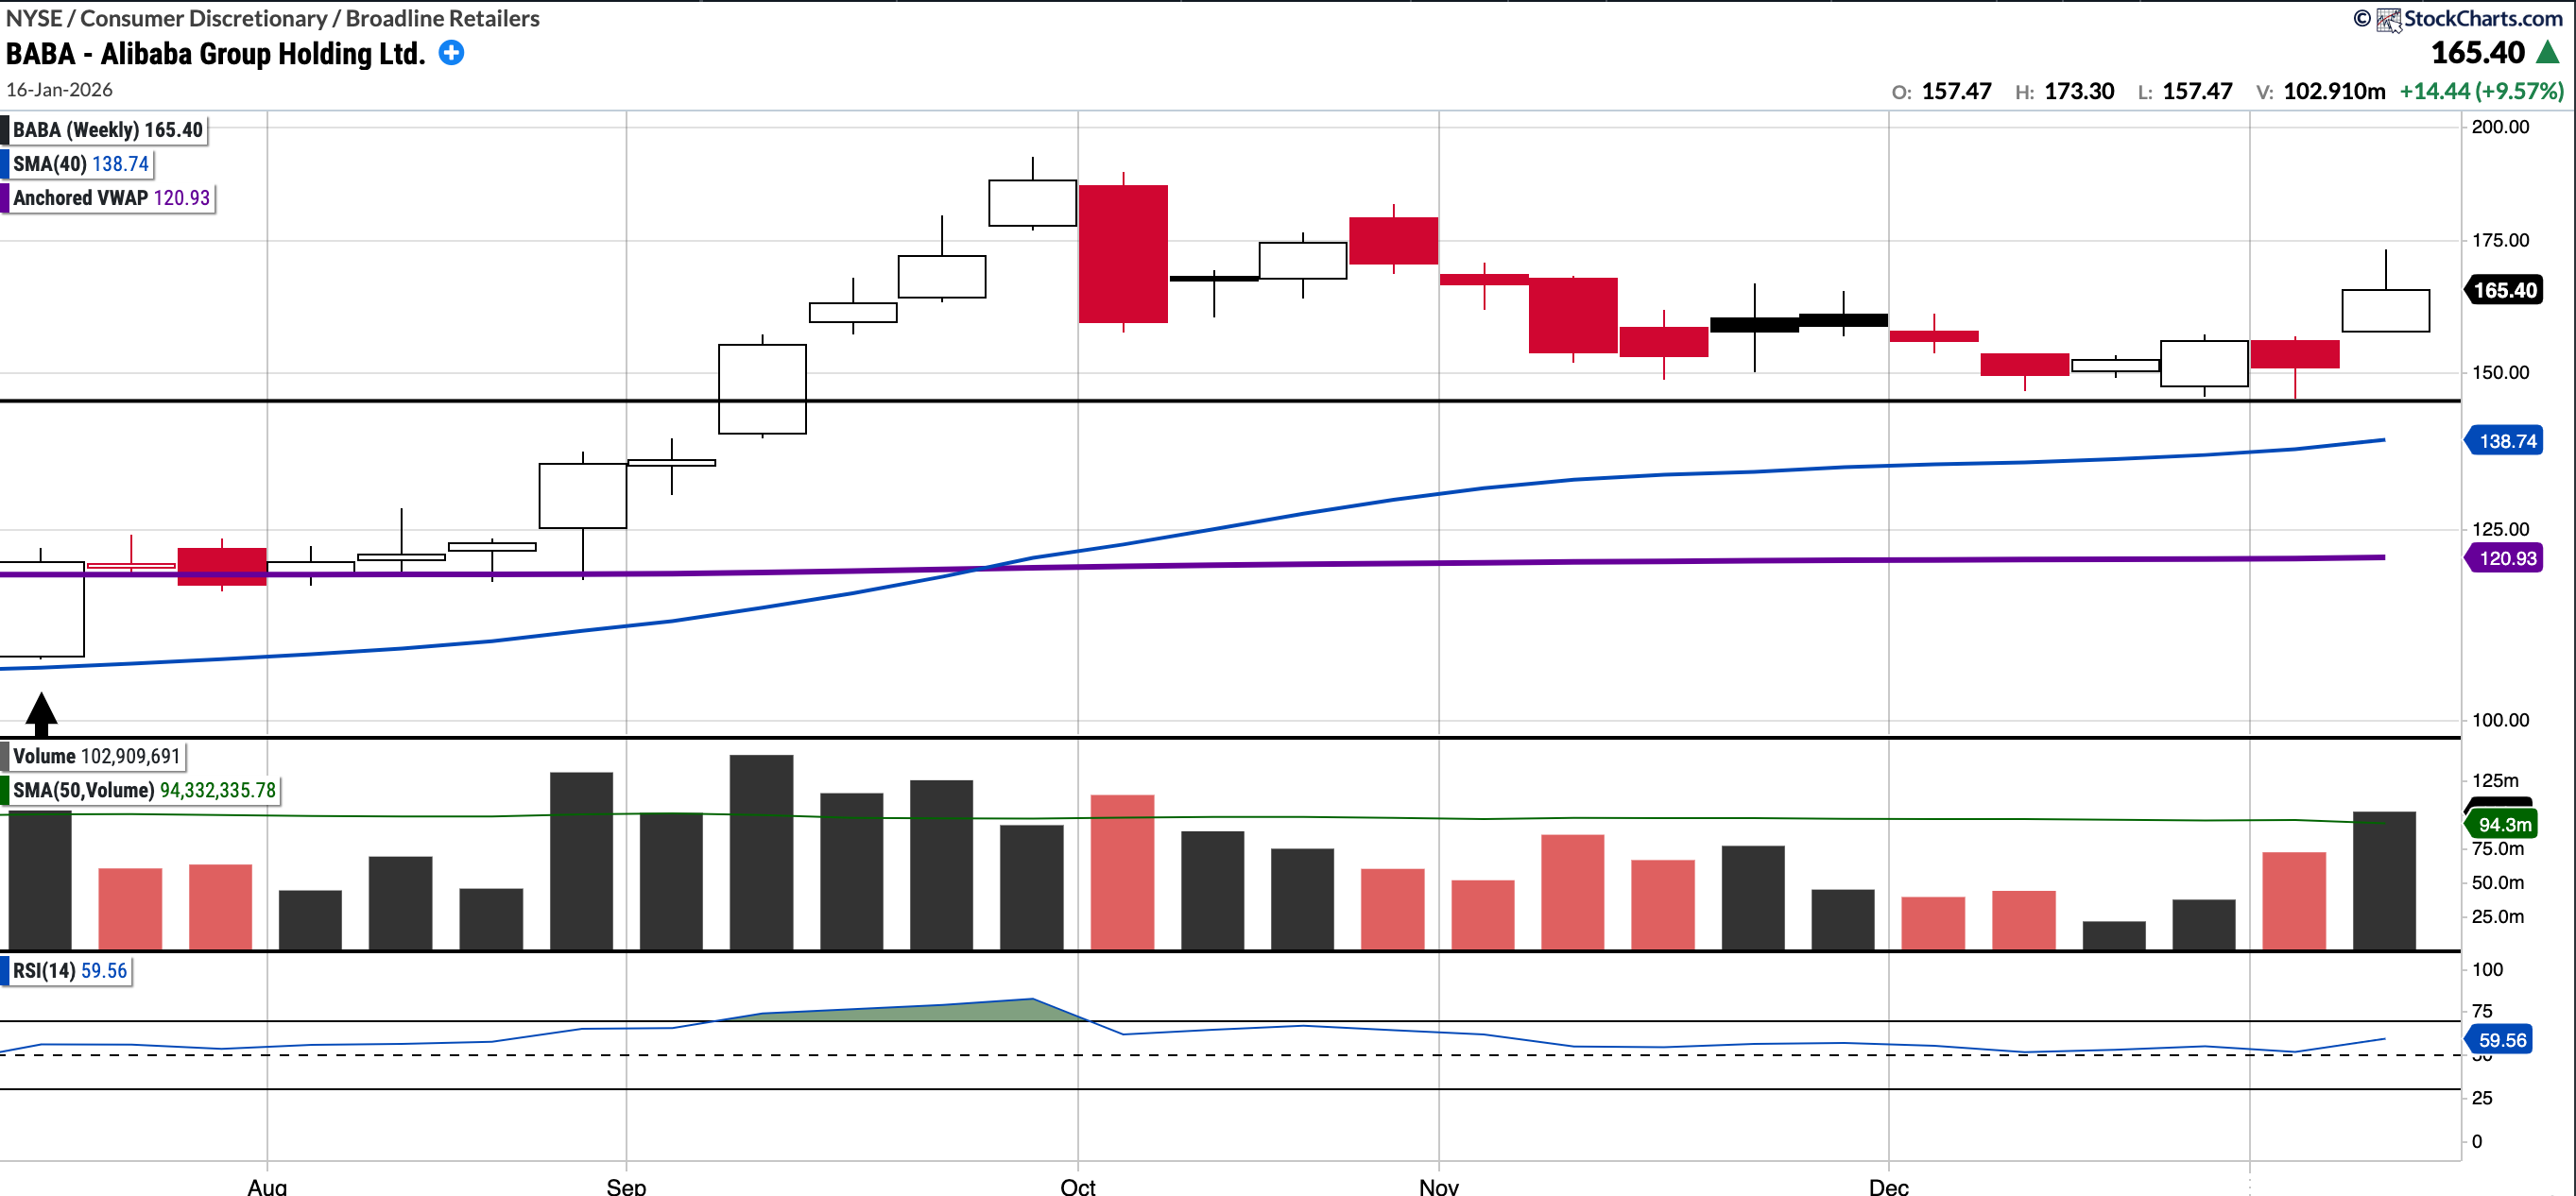
BABA (currently Long)
Currently trades at $165.4, 5.46% above the 50SMA and 19.54 above the 200SMA.
RSI 58.12 (daily chart)
+12.45% YTD
In recent weeks, BABA held exactly where it needed to and was consolidating with price compression above the 145 breakout level. This week there was clean action with a break out of a descending wedge on volume, although did end the week with a red day.
I had stated “The 160 level represents the first major resistance overhead due to the descending moving average and upper Bollinger Band. If the price breaks above this, I believe it could test 180”. Whilst we did break above the 160’s we only got as far as 174 this week. A shallow pullback to mid 150’s would not be unusual especially given the tariff drama.
Notable portfolio changes in previous week (all updated live in subscriber channels):
No notable changes this week.
Note that I have separated my accounts: my main Investment Account is shown below, alongside a separate, smaller Trading Portfolio. Read this post for more details.
Current Positions in Size Order with Cost Basis:
Cash: 17.1%
