
Preview of the Week Ahead
W/C Jan 12, 2026

Hope you all are having a good weekend. Below we will be previewing the upcoming week and providing a portfolio update as usual.
Format for what is covered in this weekly preview:
A look at the indices
Key upcoming economic events
Upcoming earnings reports
Charts
Notable portfolio changes from the previous week
Current Portfolio Holdings (Position size, cost basis, and commentary on each holding regarding the intended holding period and any planned activity)
Closing Thoughts
I highly recommend checking out the latest Monthly Portfolio and Performance Update (TWR +400% since Jan ‘23), as well as my post below covering the stocks and setups I like heading into 2026.


Furthermore, taking on board the feedback from the Six Sigma Research poll, I have extended a discount on the annual membership (long term games with long term people).
This saves approximately 30% compared to the monthly rate and is more than 45% cheaper than the Substack app price. This offer will expire at the end of the month.
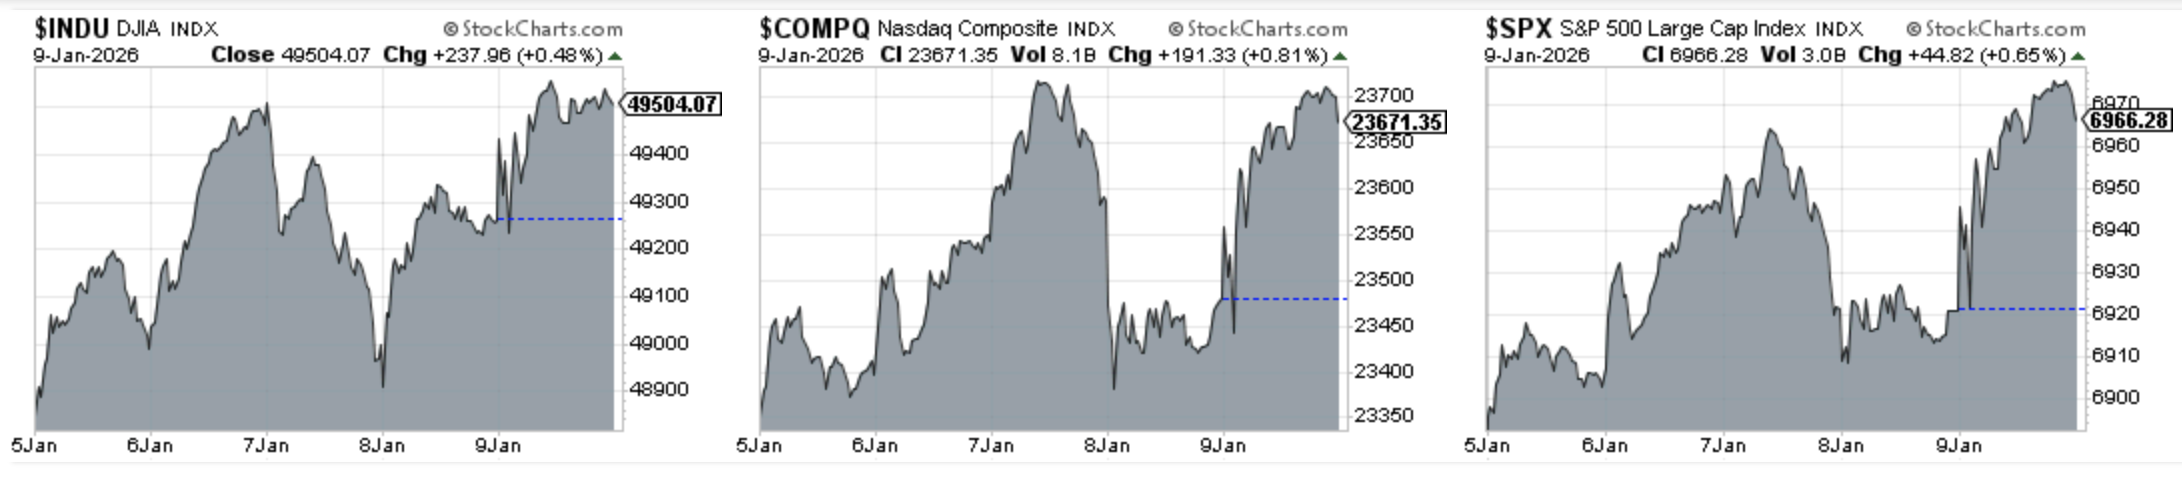
Indices
Dow Jones advanced 1.58% in the last week
S&P 500 advanced 0.99% in the last week
Nasdaq Composite advanced 1.25% in the last week
IWM advanced 4.04% in the last week
Key upcoming economic events:
Monday, January 12
Federal Reserve Speeches: Richmond Fed President Thomas Barkin (12:45 PM ET) and New York Fed President John Williams (6:00 PM ET) are scheduled to speak.
Treasury Auctions
Employment Trends Index
Tuesday, January 13
Consumer Price Index (CPI): 8:30AM ET
Real Income Data
New Home Sales
Federal Budget Balance
Fed Speeches: St. Louis Fed President Alberto Musalem (10:00 AM ET) and Thomas Barkin (4:00 PM ET).
Wednesday, January 14
Producer Price Index (PPI): 8:30 AM ET.
Retail Sales
Existing Home Sales
U.S. Supreme Court: Expected to rule on the legality of the administration’s reciprocal tariff policy.
Thursday, January 15
Fed Beige Book
Manufacturing Surveys
Weekly Jobless Claims
Friday, January 16
Industrial Production
Upcoming Earnings
This week is notable for the Banking Earning reports such as JPM, WFC, Citi and Morgan Stanley. I have no portfolio positions reporting. Below is the infographic by Earnings Whispers:

Charts
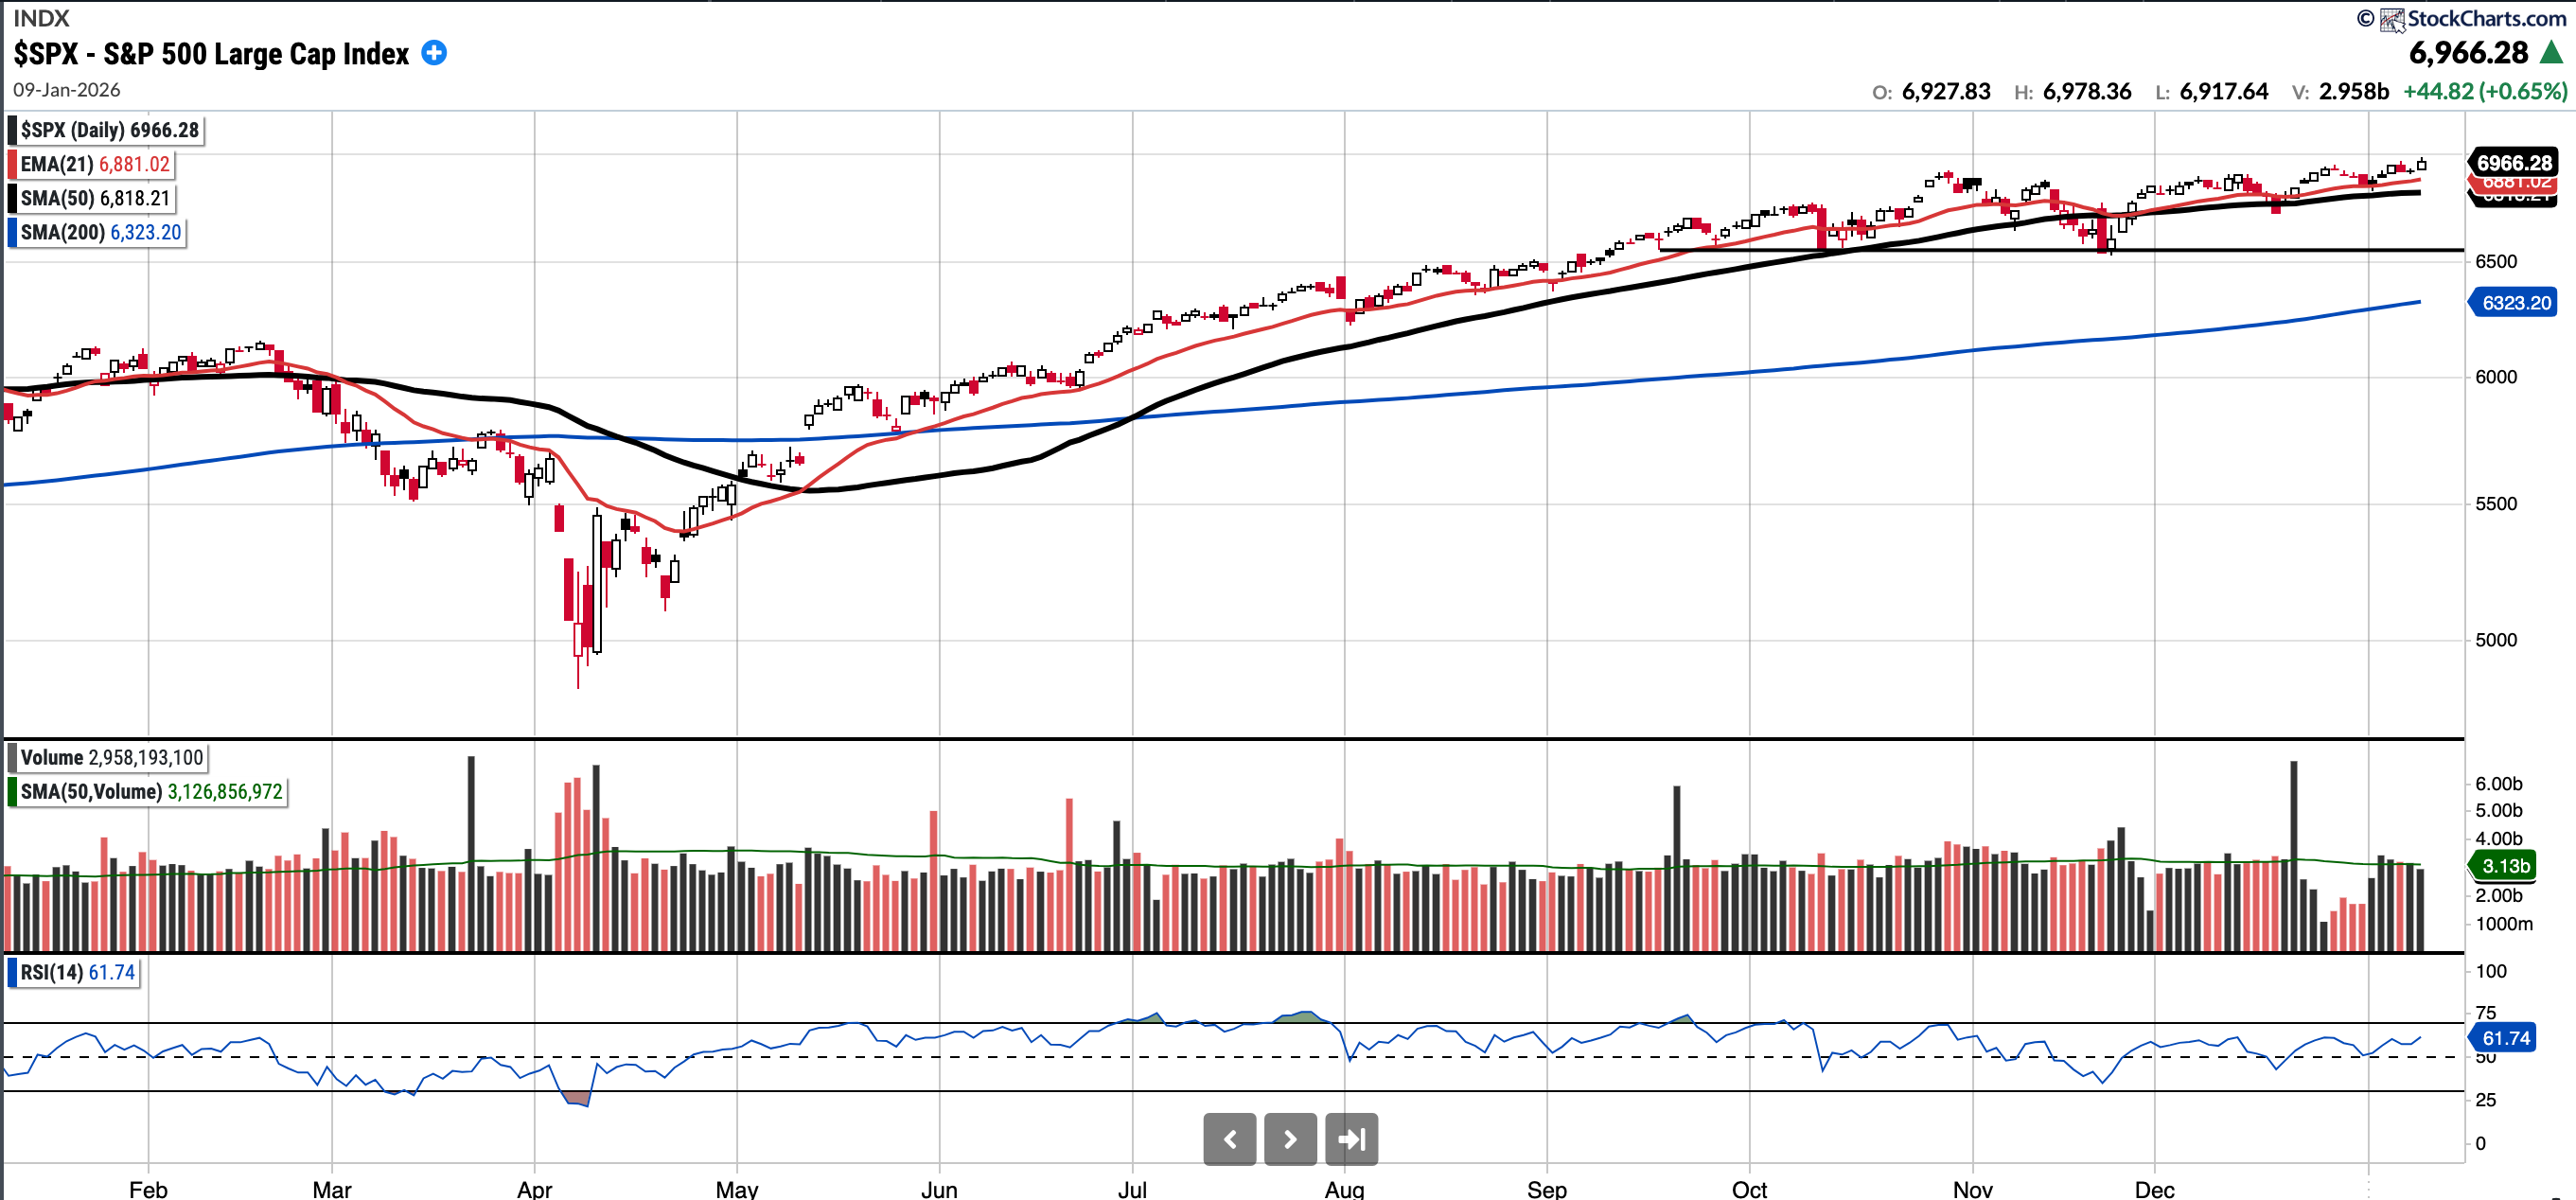
SPX
Currently trades at 6966.28, 2.17% above a rising 50SMA and 10.17% above the 200SMA.
RSI 61.74
+1.57% YTD
Distribution days in the last week: 0
The SPX remains above all key MA’s and printed a new ATH to close the week.
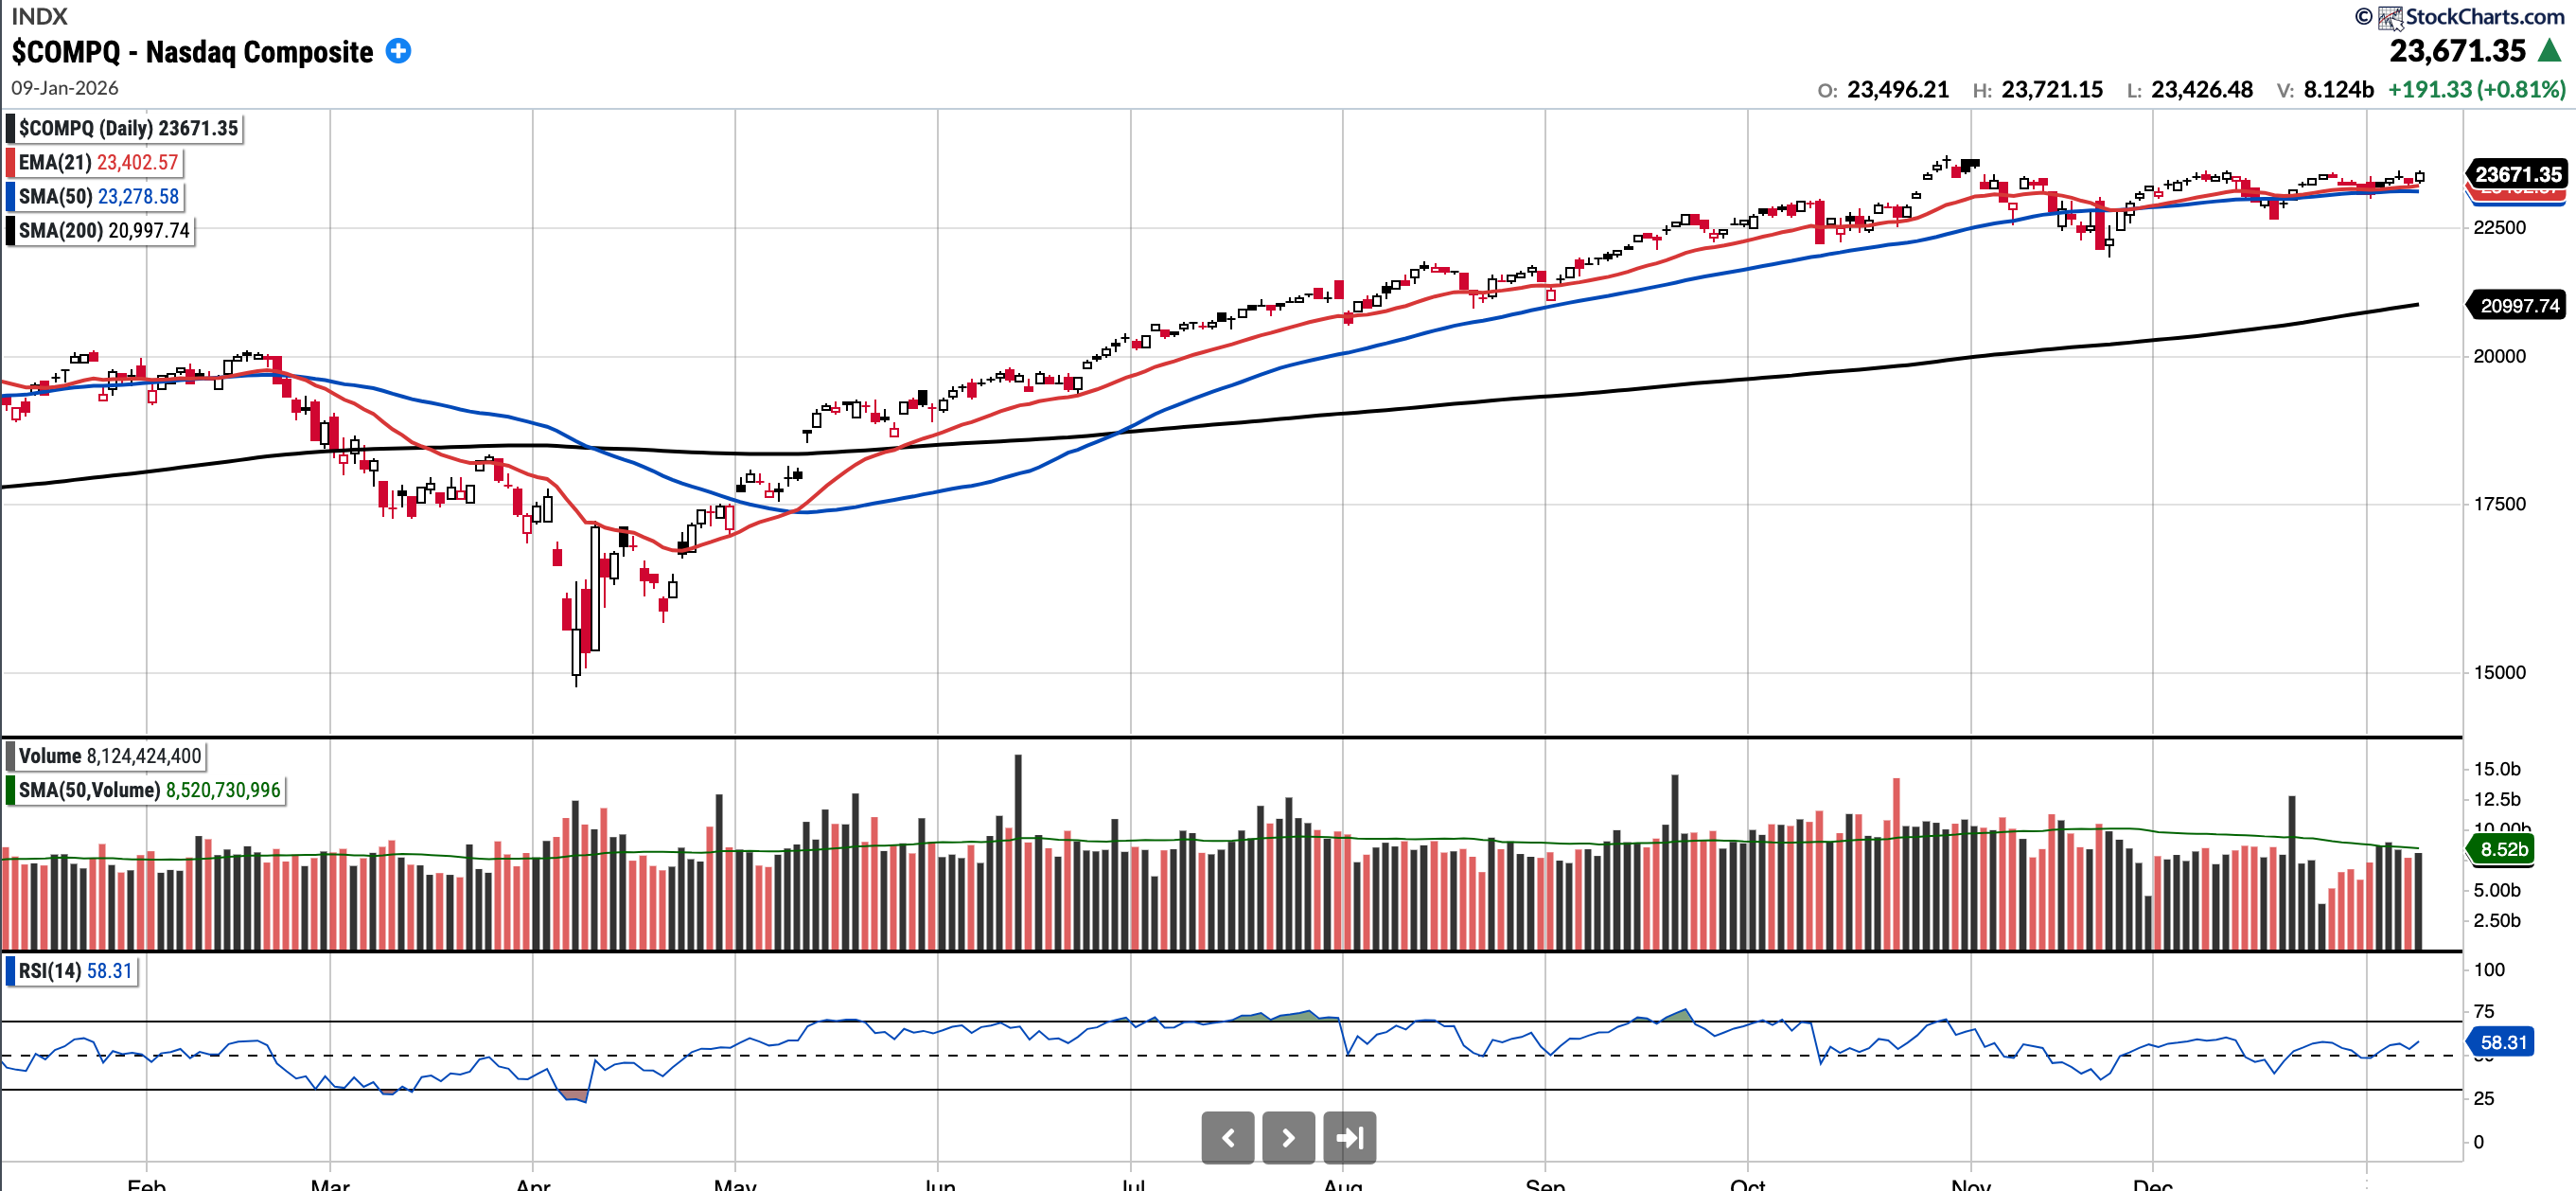
COMPQ
Currently trades at 23,671.35, 1.69% above a rising 50SMA and 12.73% above the 200SMA.
RSI 58.31
1.88% YTD
Distribution days in the last week: 0
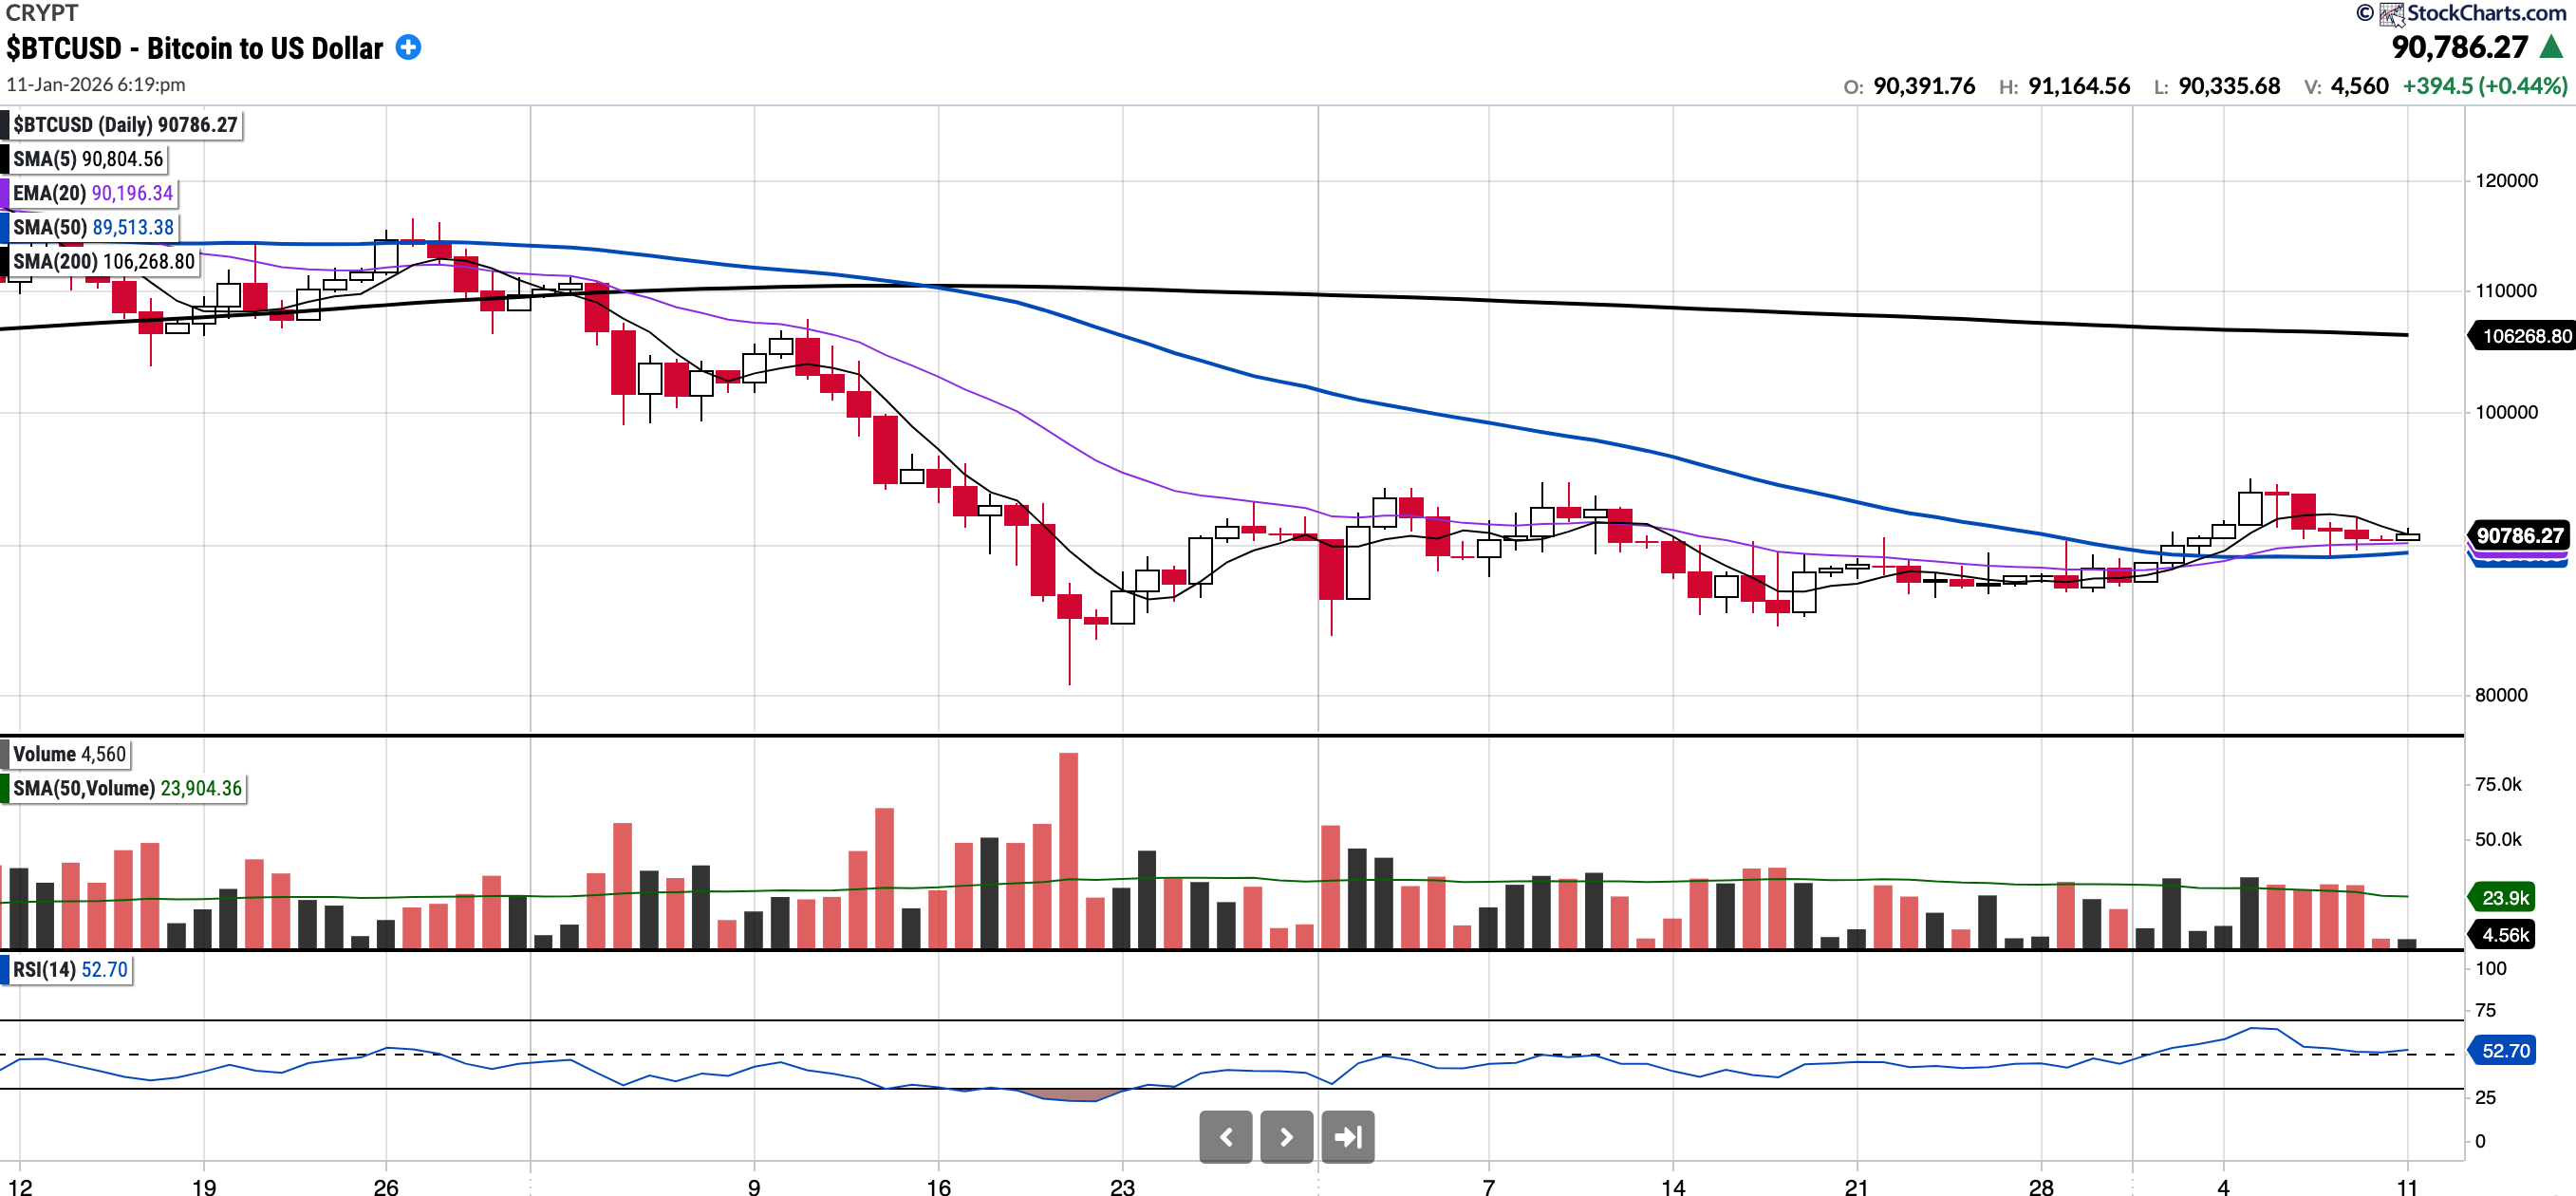
BTC (currently Long)
Currently trades at $90,786.27, 1.42% above the 50SMA and 14.57% below the 200SMA.
RSI 52.7
2.3% YTD.
BTC is down 3% or so on the week. Whilst it has reclaimed the EMA 20 and SMA 50 for me above 94.5k is where it starts to look interesting.
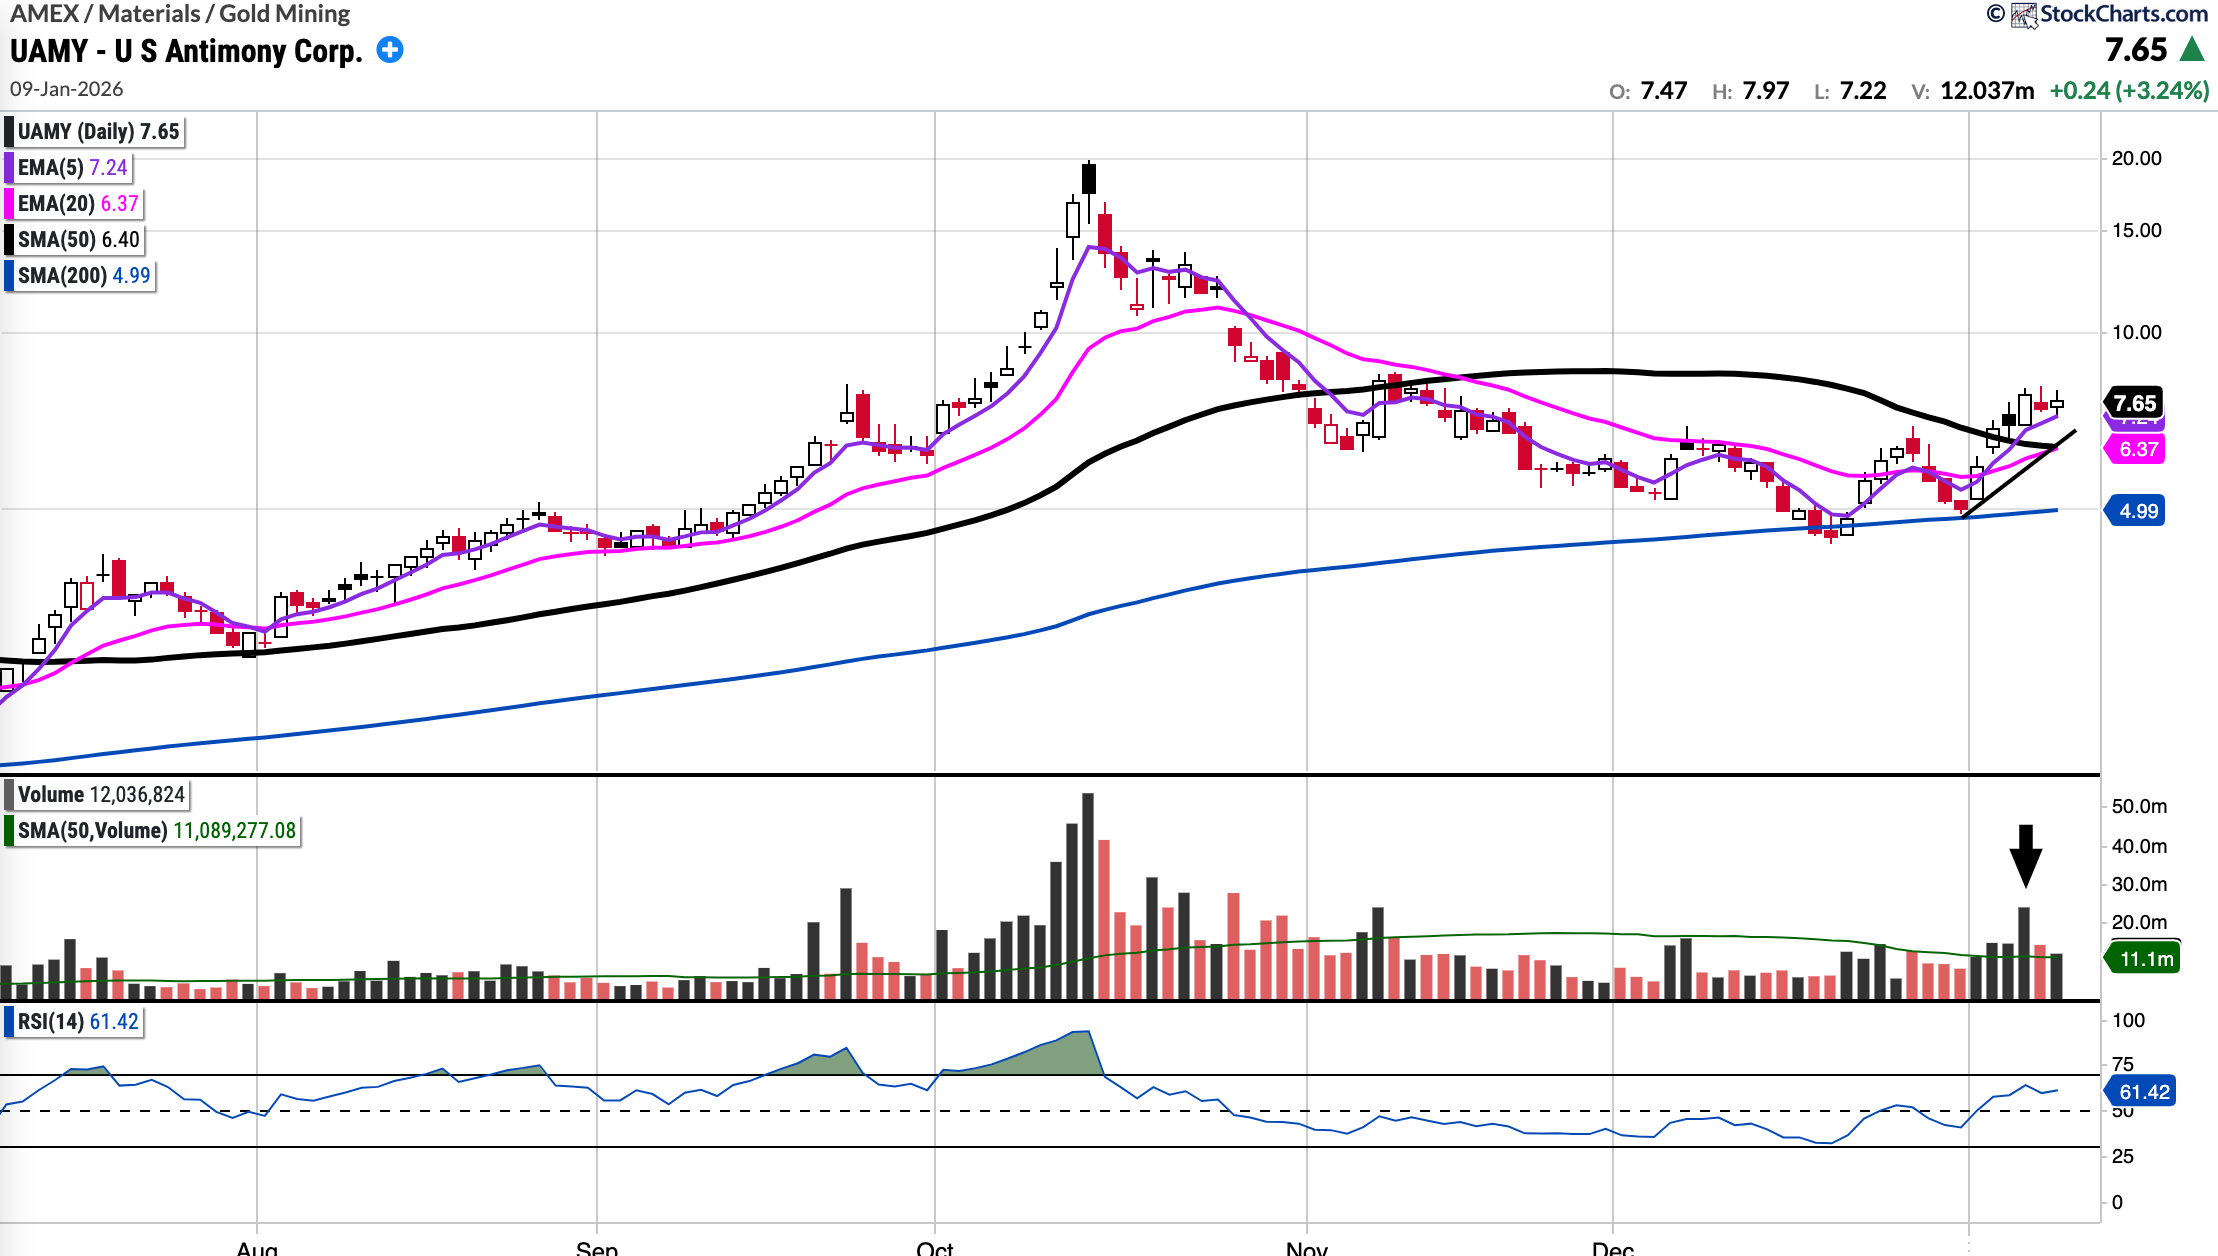
UAMY (No position at present)
Currently trades at $7.65, 19.55% above the 50SMA and 53.39% above the 200SMA.
RSI 61.42
+29.01% YTD
UAMY (US Antimony Corp) is the only fully integrated antimony producer and smelter in North America. They restarted domestic mining this year.
They have recently secured two five-year contracts one of which includes a $245M deal with the Defense Logistics Agency (DLA) for high-purity antimony, and a $107M commercial agreement for industrial antimony trioxide.
The bull case for this stock is built on the U.S. government’s continued prioritisation of domestic mineral independence. Given the recent capture of Maduro in Venezuela and President Trump’s repeated emphasis on rare earth security, this remains a compelling stock for the watchlist.
UAMY stock is up 30% or so since I featured this stock last Sunday. The chart is starting to really set-up now with all nearer-term moving averages crossing over the longer term ones. Good volume is entering. For a new entry, one may have to wait for an EMA 20 re-test or to grab on the EMA 5 pullback.
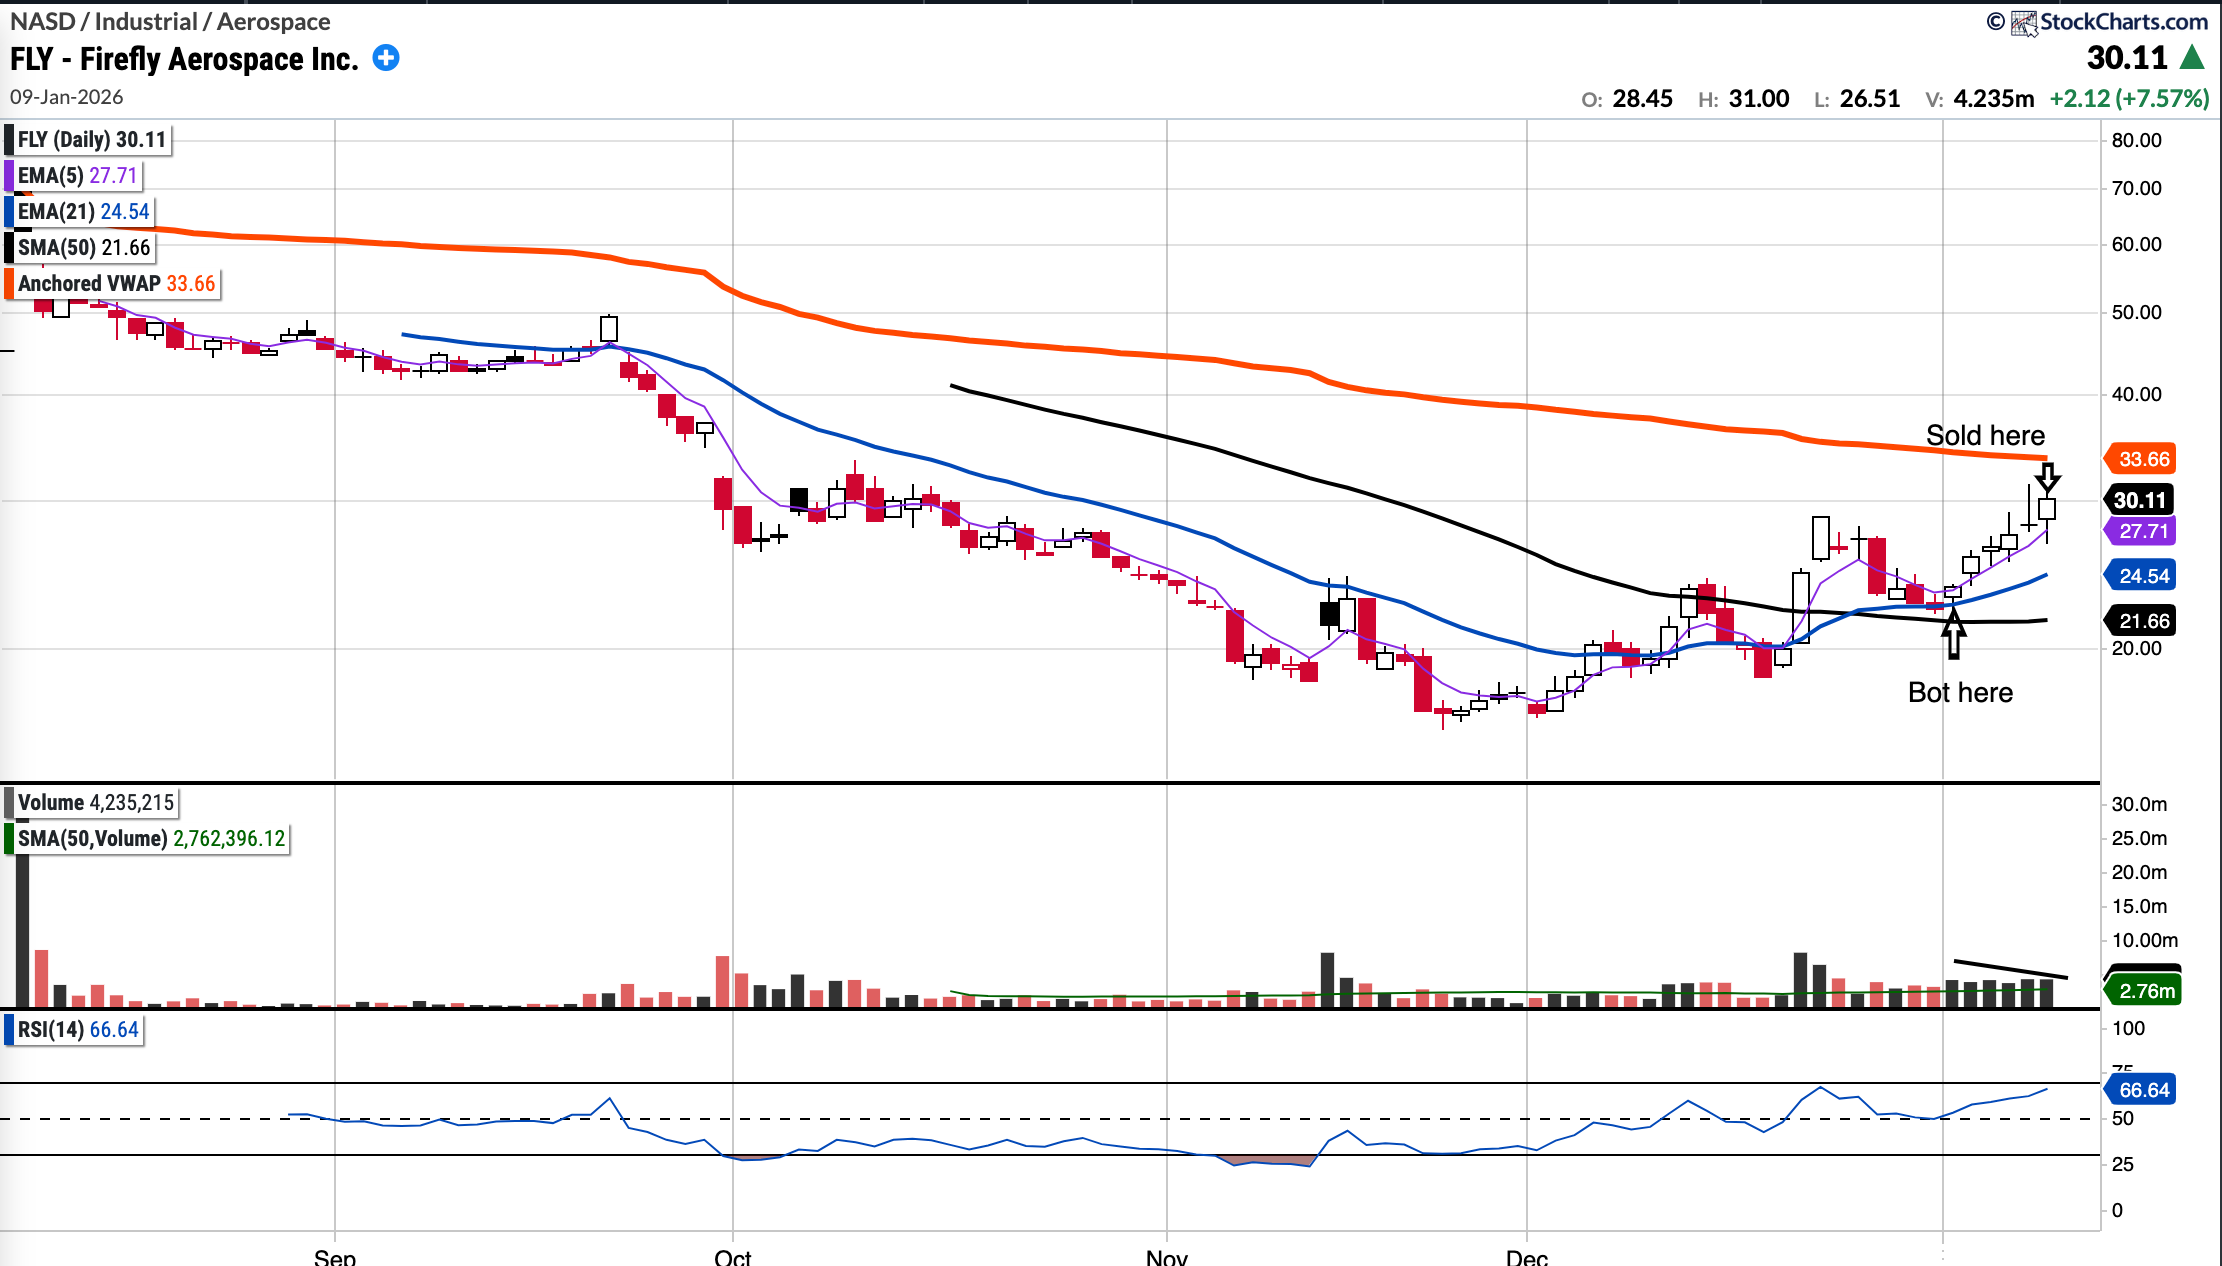
FLY (No position at present)
Currently trades at $30.11, 39.02% above the 50SMA.
RSI 66.64
+26.73% YTD
Firefly Aerospace ($FLY) is speculative aerospace play with a high ADR. I had good success trading it this last week for +36% in 6 sessions.
It remains a strong thematic play for the watchlist, as I expect the space sector to gain momentum ahead of the highly anticipated SpaceX IPO. I’ll be watching its reaction at the overhead IPO Anchored VWAP; if it pulls back to retest the 21 EMA, I may look to re-enter.
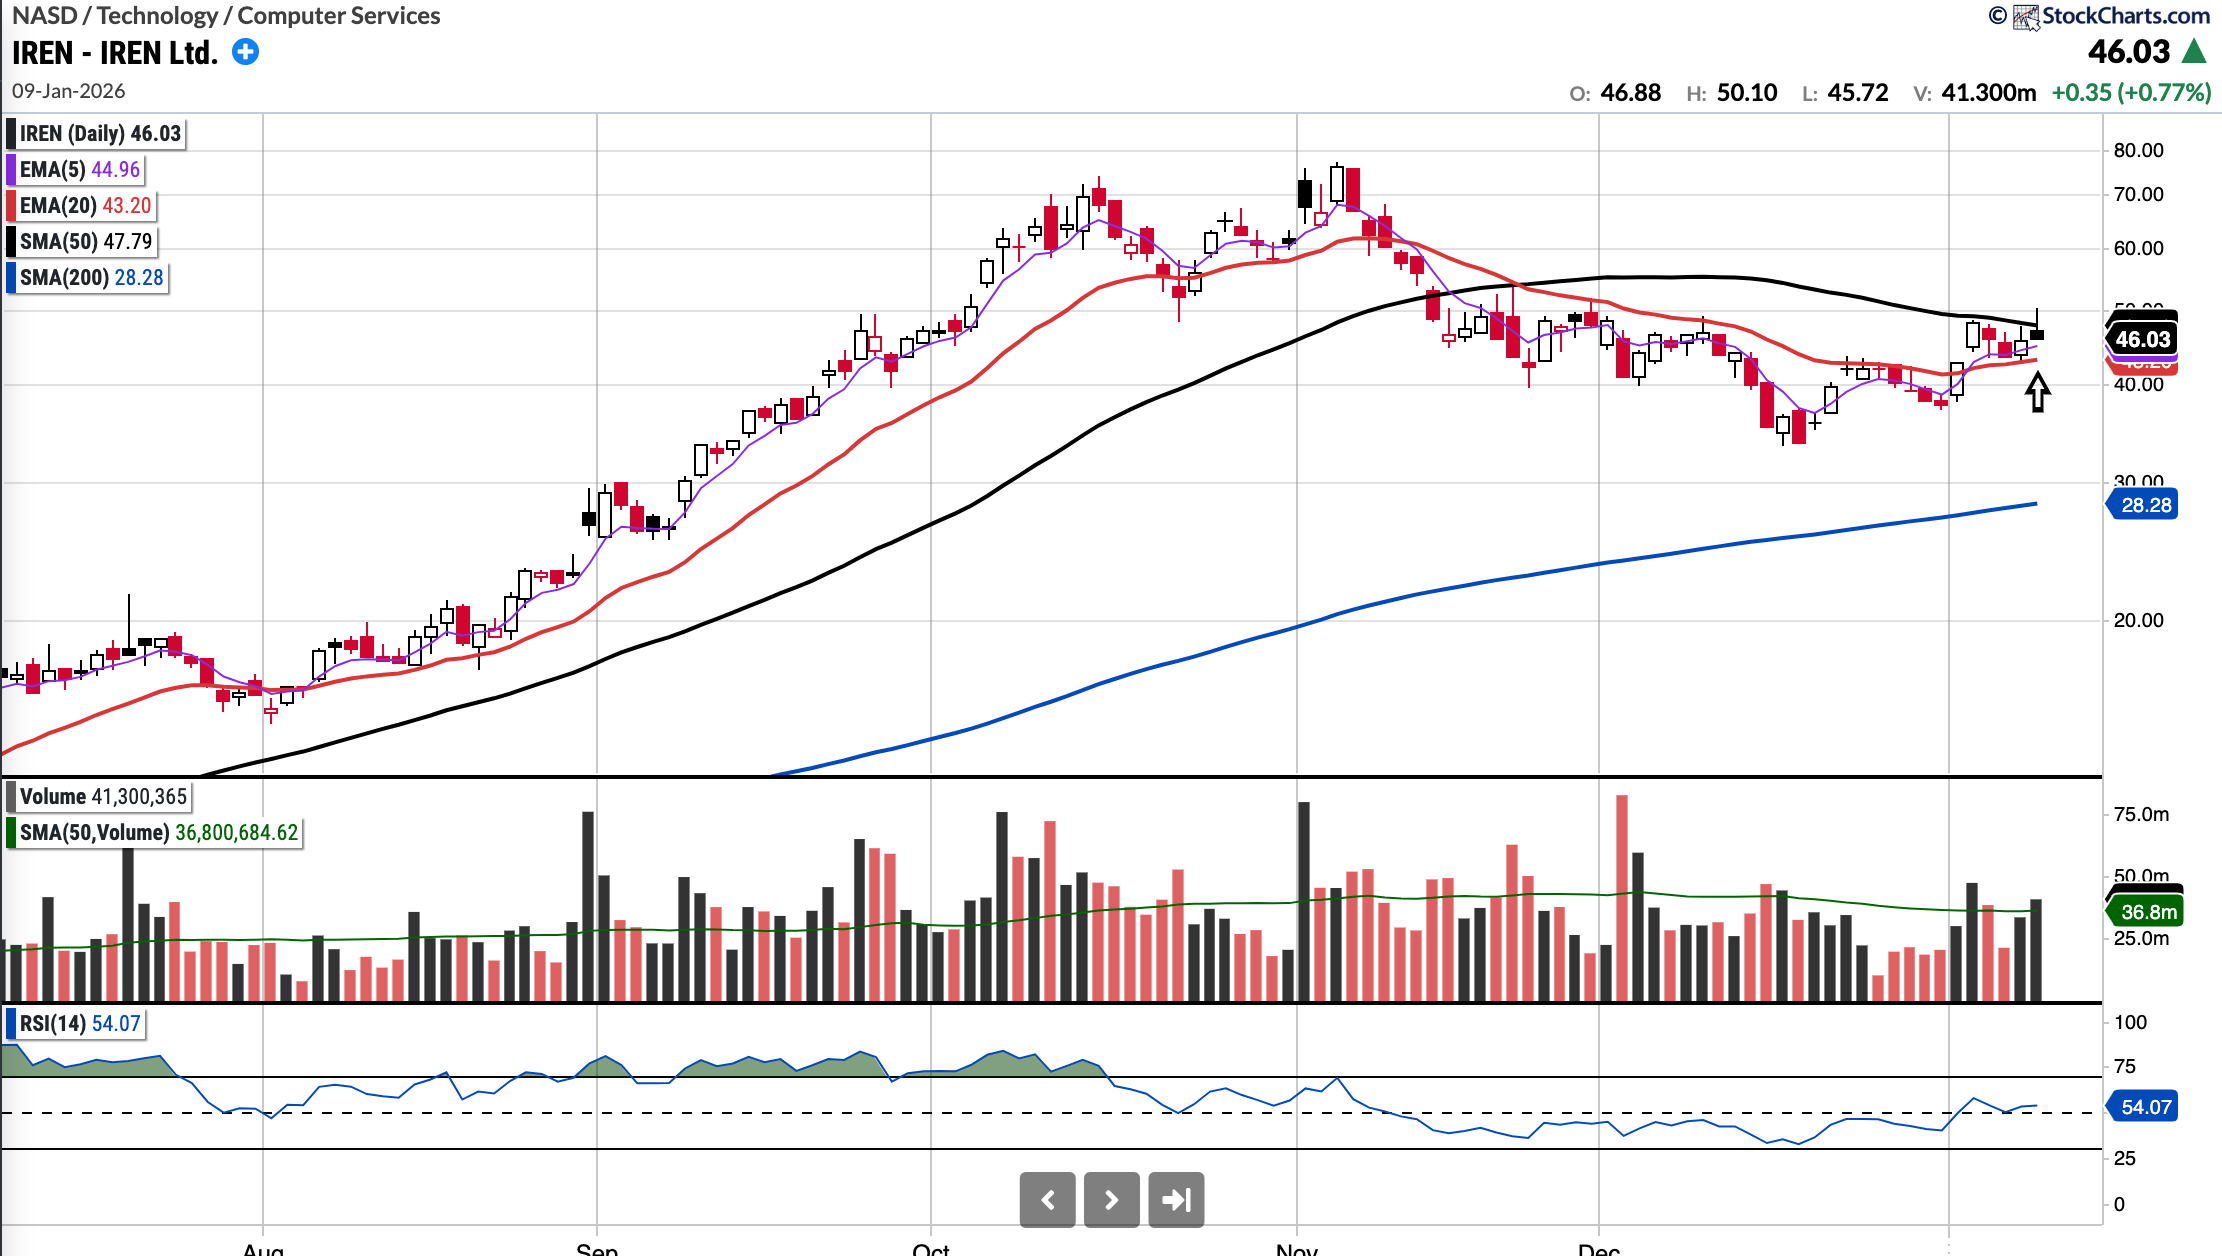
IREN (No position at present)
Currently trades at $46.03, 3.68% below the 50SMA and 62.74% above the SMA 200.
RSI 54.07
+7.8% YTD
IREN remains in an uptrend on a longer time frame although remains below the descending overhead SMA 50.
The chart is starting to look a lot more constructive with the 5EMA crossing above the 20EMA, the 20EMA serving as support plus some volume entering the stock. I will be looking for an entry either on a low volume pullback to support or if and when it flips the SMA 50 and holds that as support. I expect this moves higher this week.
Notable portfolio changes in previous week (all updated live in subscriber channels):
Exit ARKG
Note that I have separated my accounts: my main Investment Account is shown below, alongside a separate, smaller Trading Portfolio. Read this post for more details.
Current Positions in Size Order with Cost Basis:
