
Preview of the Week Ahead
W/C December 22, 2025

Hope you all are having a good weekend. Below we will be previewing the upcoming week and providing a portfolio update as usual.
Format for what is covered in this weekly preview:
A look at the indices
Key upcoming economic events
Upcoming earnings reports
Charts
Notable portfolio changes from the previous week
Current Portfolio Holdings (Position size, cost basis, and commentary on each holding regarding the intended holding period and any planned activity)
Closing Thoughts
Highly recommend to check out the most recent Monthly Portfolio and Performance Update (TWR +392.9% since Jan ‘23) below if you have not done so

If it is your first time here, read the below post on how to navigate the SixSigmaCapital Website and subscribe to the option that suits.

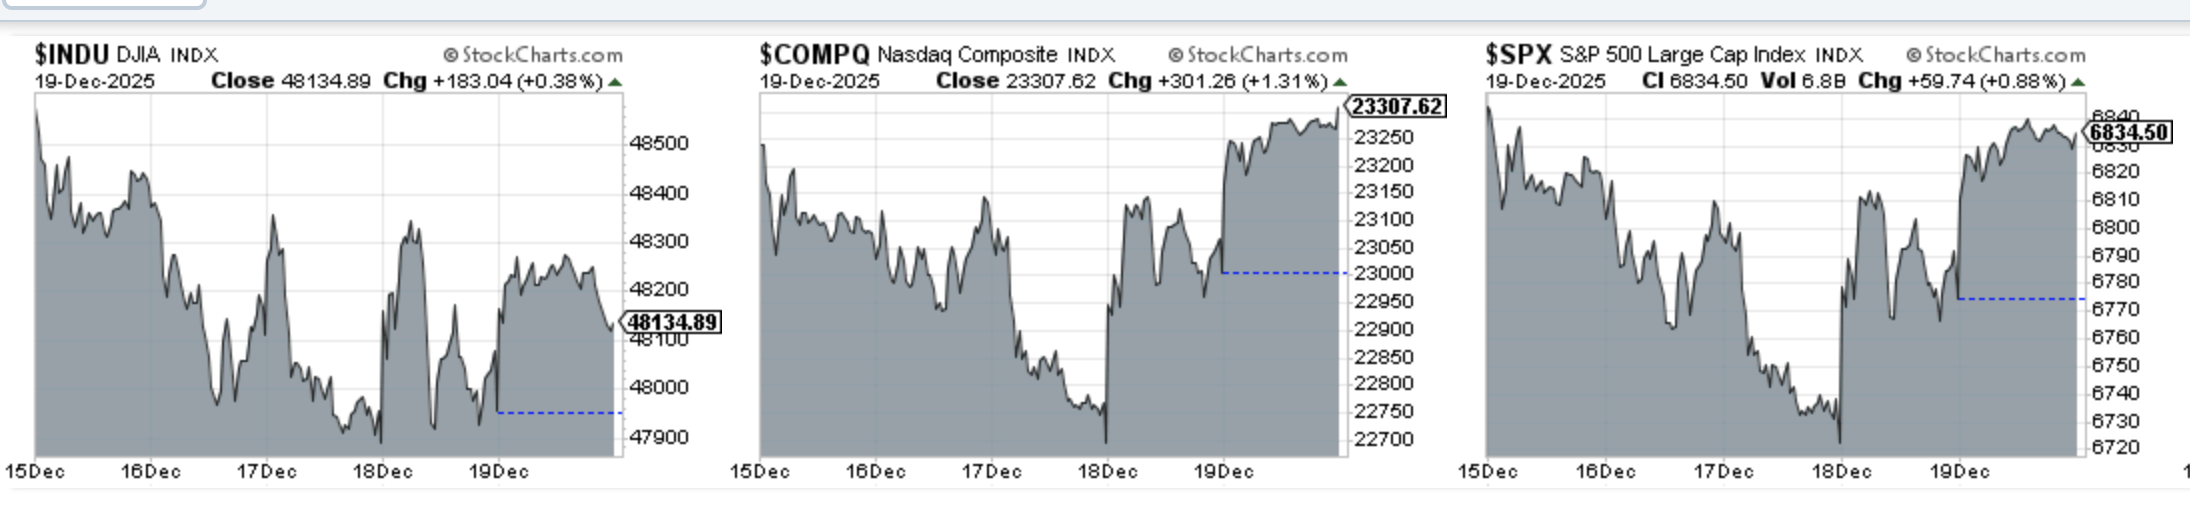
Indices
Dow Jones declined 0.96% in the last week
S&P 500 declined 0.19% in the last week
Nasdaq Composite advanced 0.17% in the last week
IWM declined 1.6% in the last week
Key upcoming economic events:
Monday, December 22
Chicago Fed National Activity Index
Tuesday, December 23
GDP Growth Rate (Q3 Final Estimate)
Durable Goods Orders (November)
Core PCE Price Index
New Home Sales (November)
CB Consumer Confidence (December
Wednesday, December 24
Initial Jobless Claims
Stock market closes at 1:00 PM ET
Thursday, December 25
Market closed
Friday, December 26
No major economic data releases scheduled.
Upcoming Earnings
There is no company of note reporting in the next 2 weeks. Below is the infographic by Earnings Whispers:

Charts
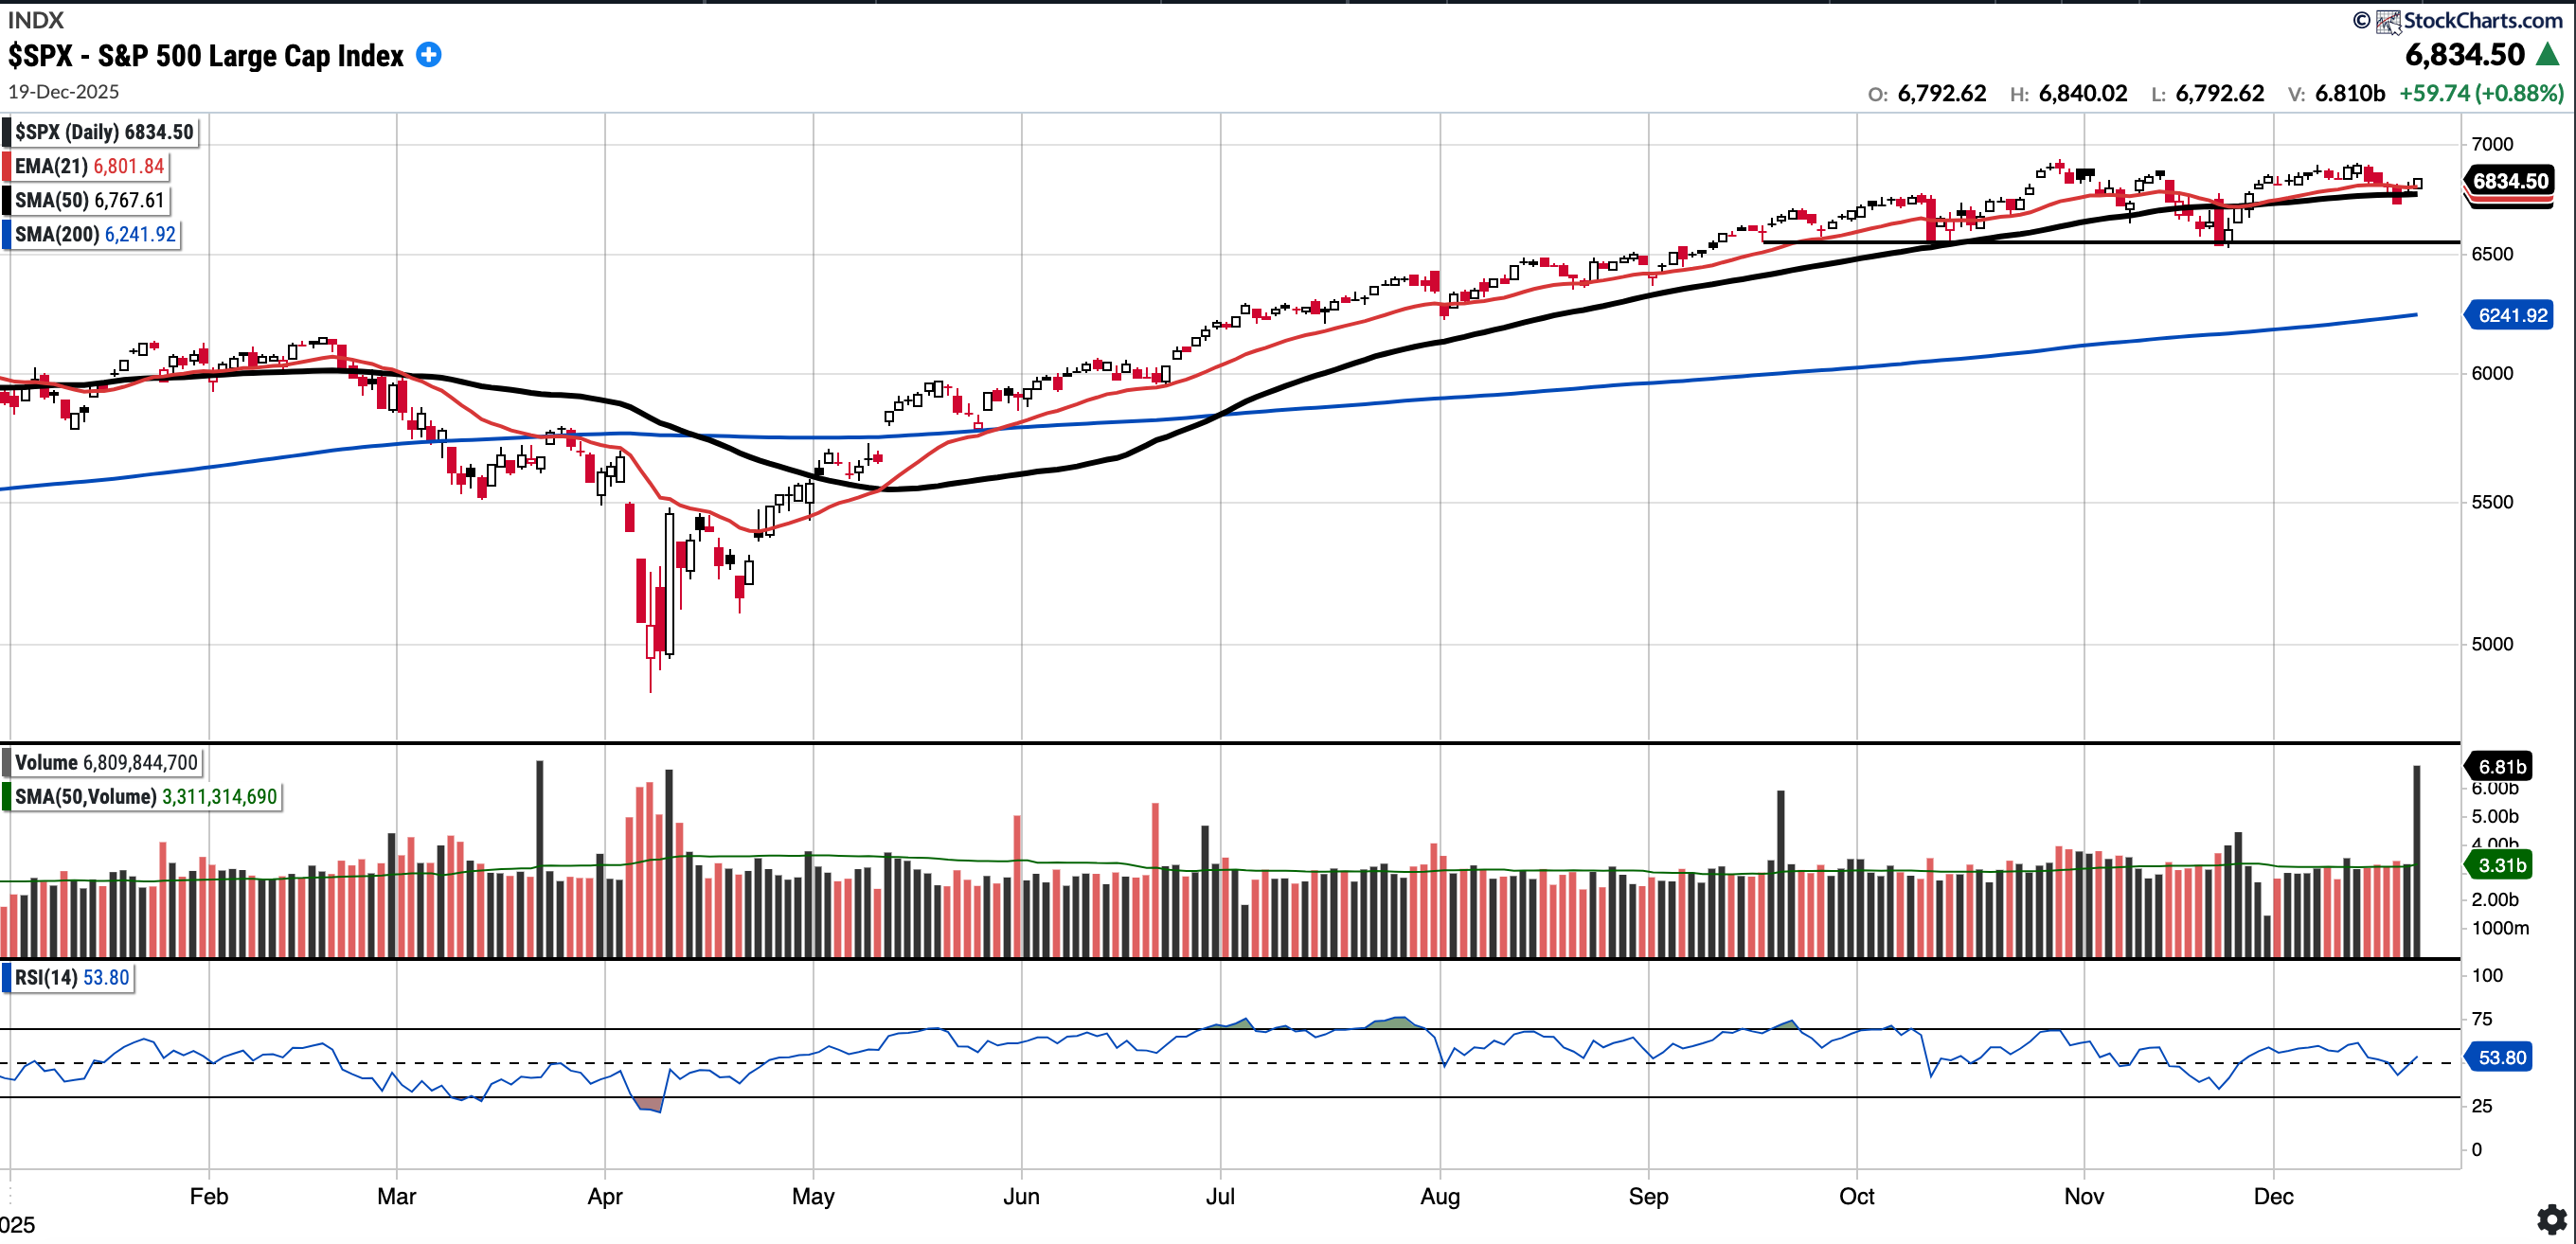
SPX
Currently trades at 6834.5, 0.99% above a rising 50SMA and 9.49% above 200SMA.
RSI 53.8
16.46% YTD
Distribution days in the last week: 1
Whilst the SPX did trade below the EMA 21 and SMA 50 on volume, it reclaimed them both into the end of the week. Positive development.
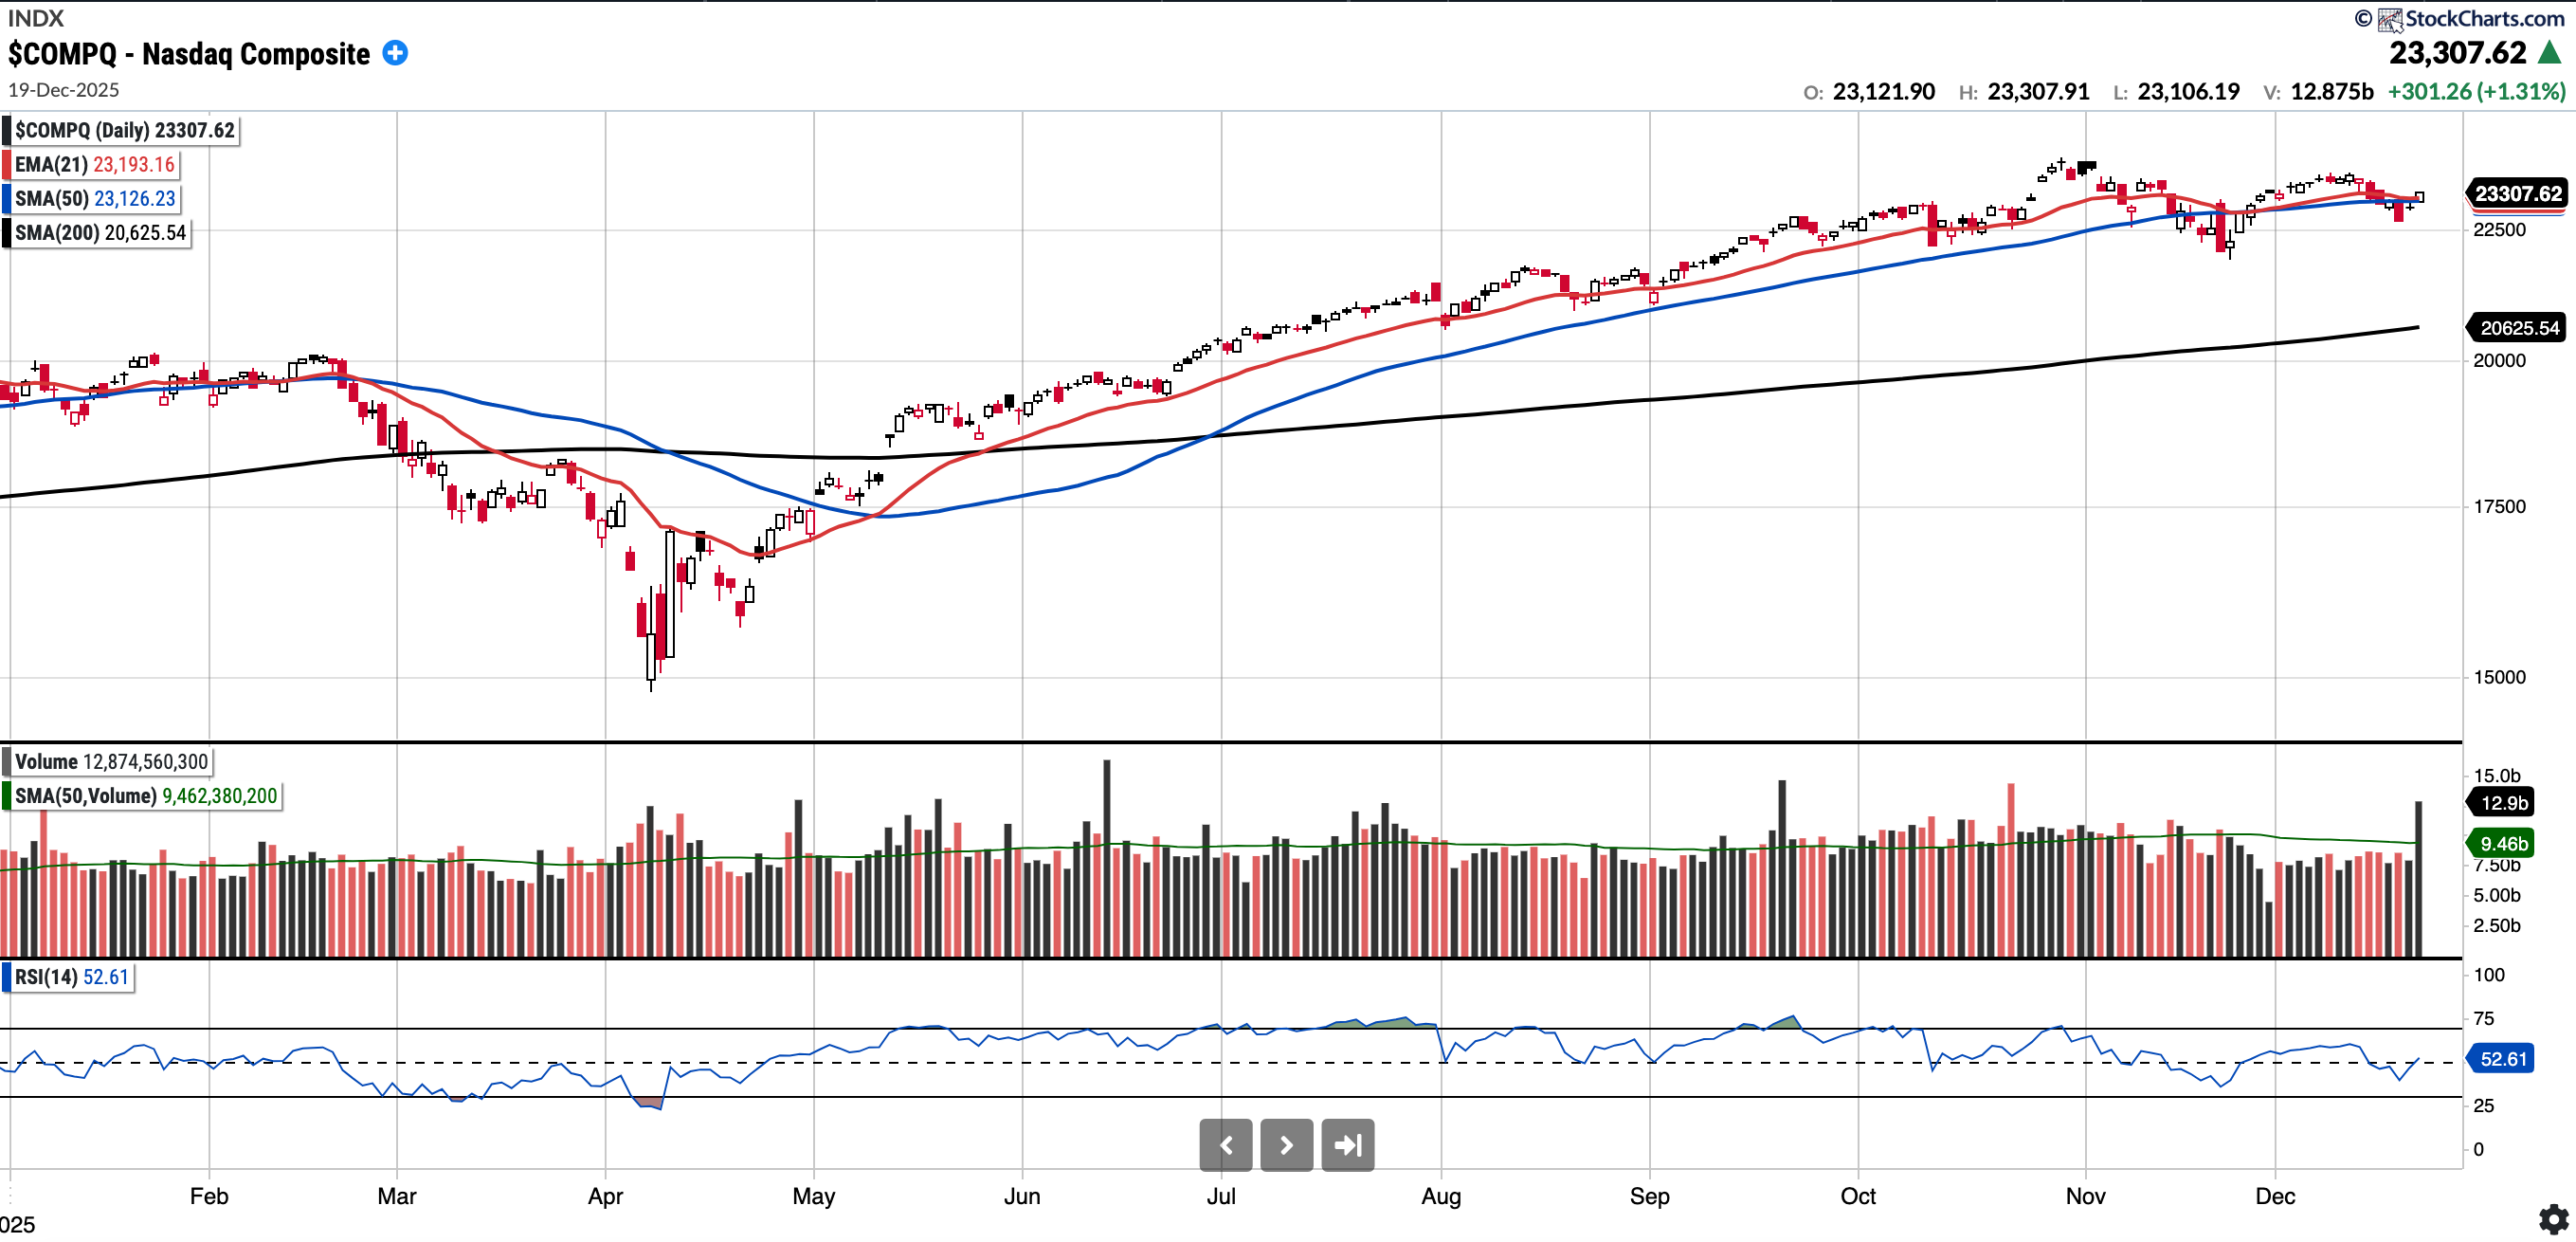
COMPQ
Currently trades at 23,307.62, 0.78% above a rising 50SMA and 13.00% above 200SMA.
RSI 52.61
20.89% YTD
Distribution days in the last week: 1
The Nasdaq Composite is above both the EMA 21 and SMA 50 after the rally in the AI complex to end the week.
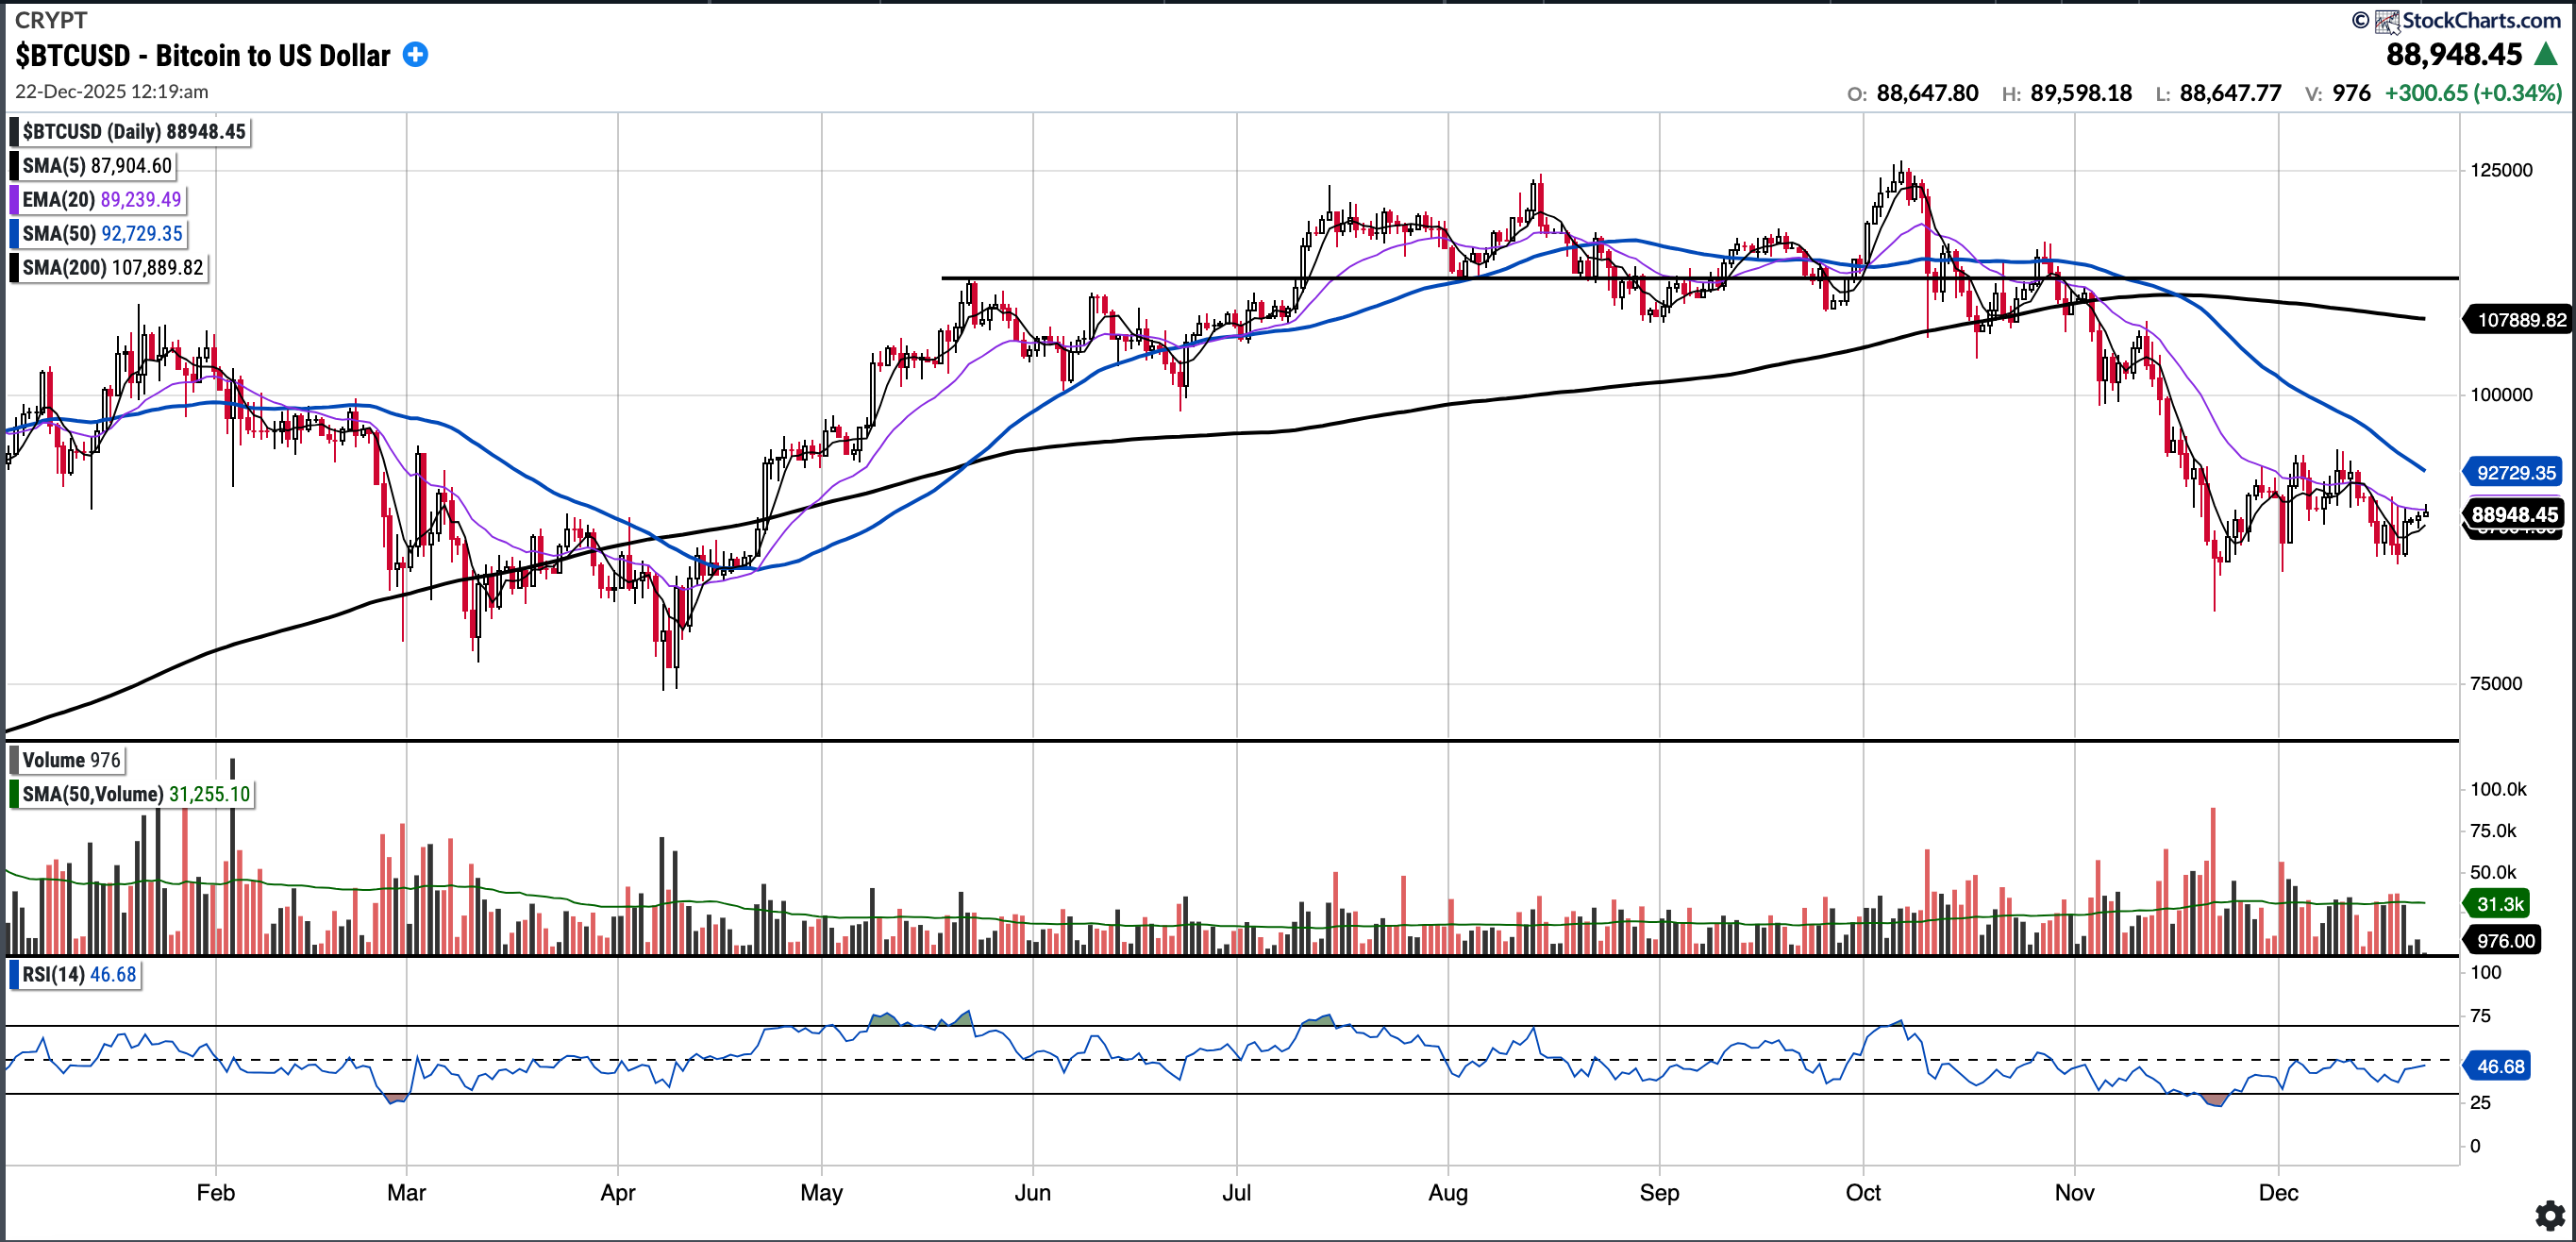
BTC (currently Long)
Currently trades at $88,948.45, 4.08% below the 50SMA and 17.56% below the 200SMA.
RSI 46.68
-5.6% YTD.
BTC continues to perform poorly since the liquidation event on October 10th. It had been making higher highs and higher lows, briefly reclaiming the EMA 20 but after last weeks poor price action it is firmly below all key moving averages.
The BTC chart requires significant time and work to look constructive again.
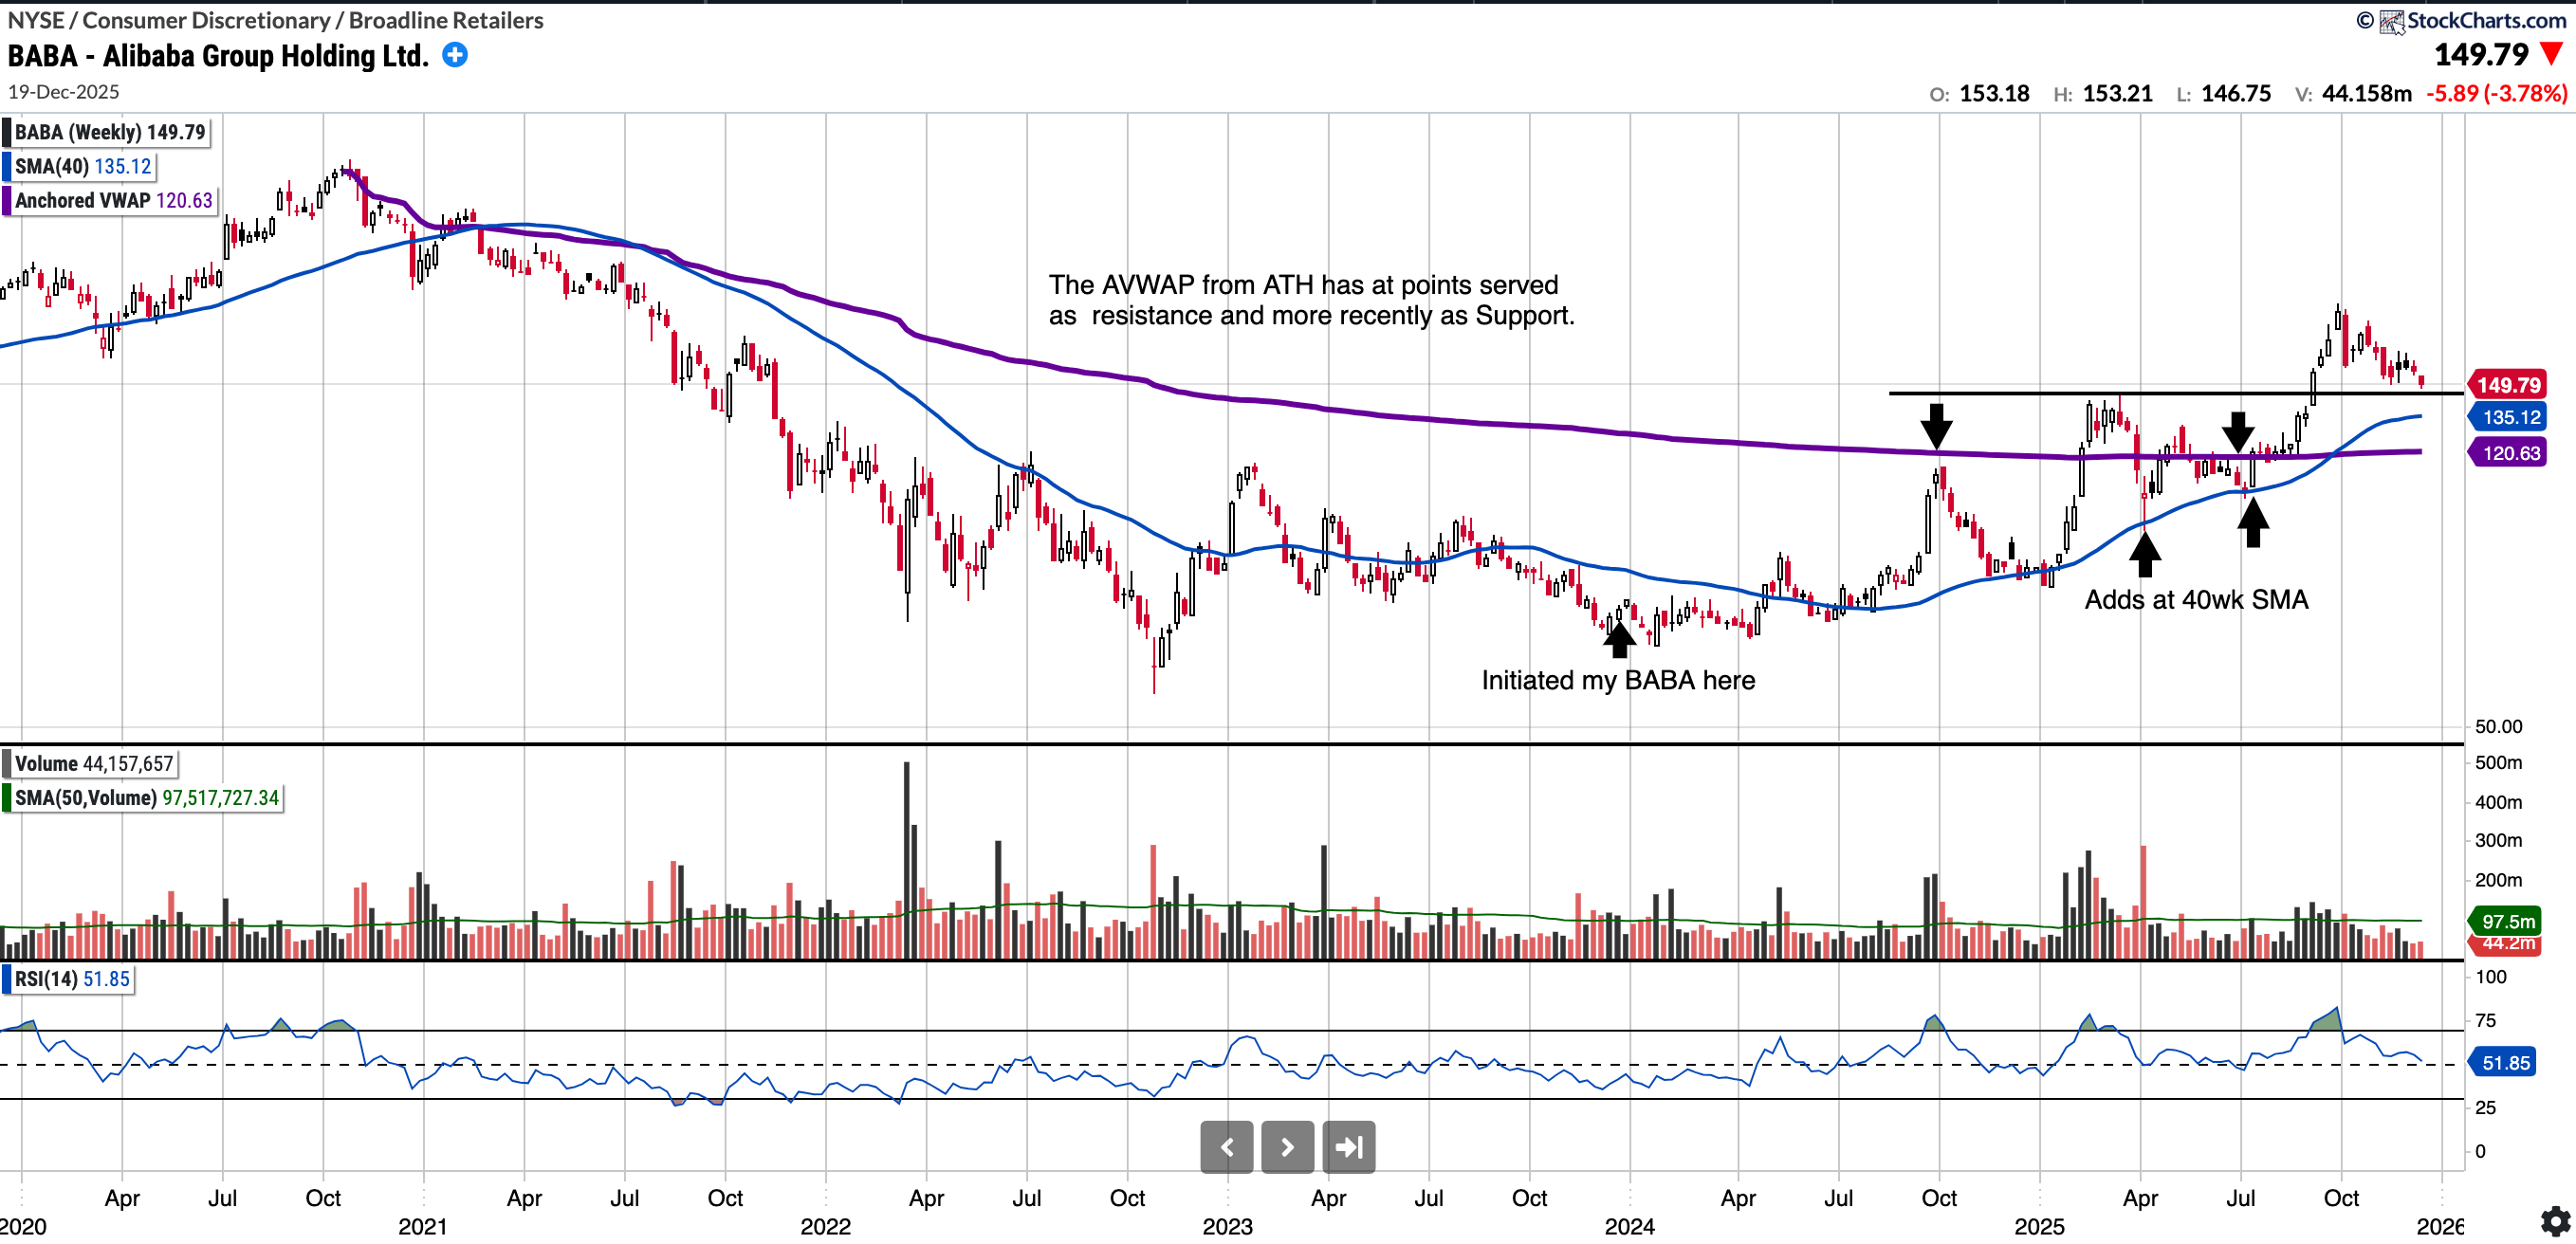
BABA (currently Long)
Currently trades at $149.79, 7.45% below the 50SMA and 10.01% above the 200SMA.
RSI 39.75 (daily chart)
+76.33% YTD
Whilst down on the week, BABA stock still appears to be consolidating above the 145 breakout level. I will be looking to see if it can hold the $145 support level, below that the SMA 200 and the AVWAP from ATH which has more more recently served as support. The AVWAP sits at 120.63.
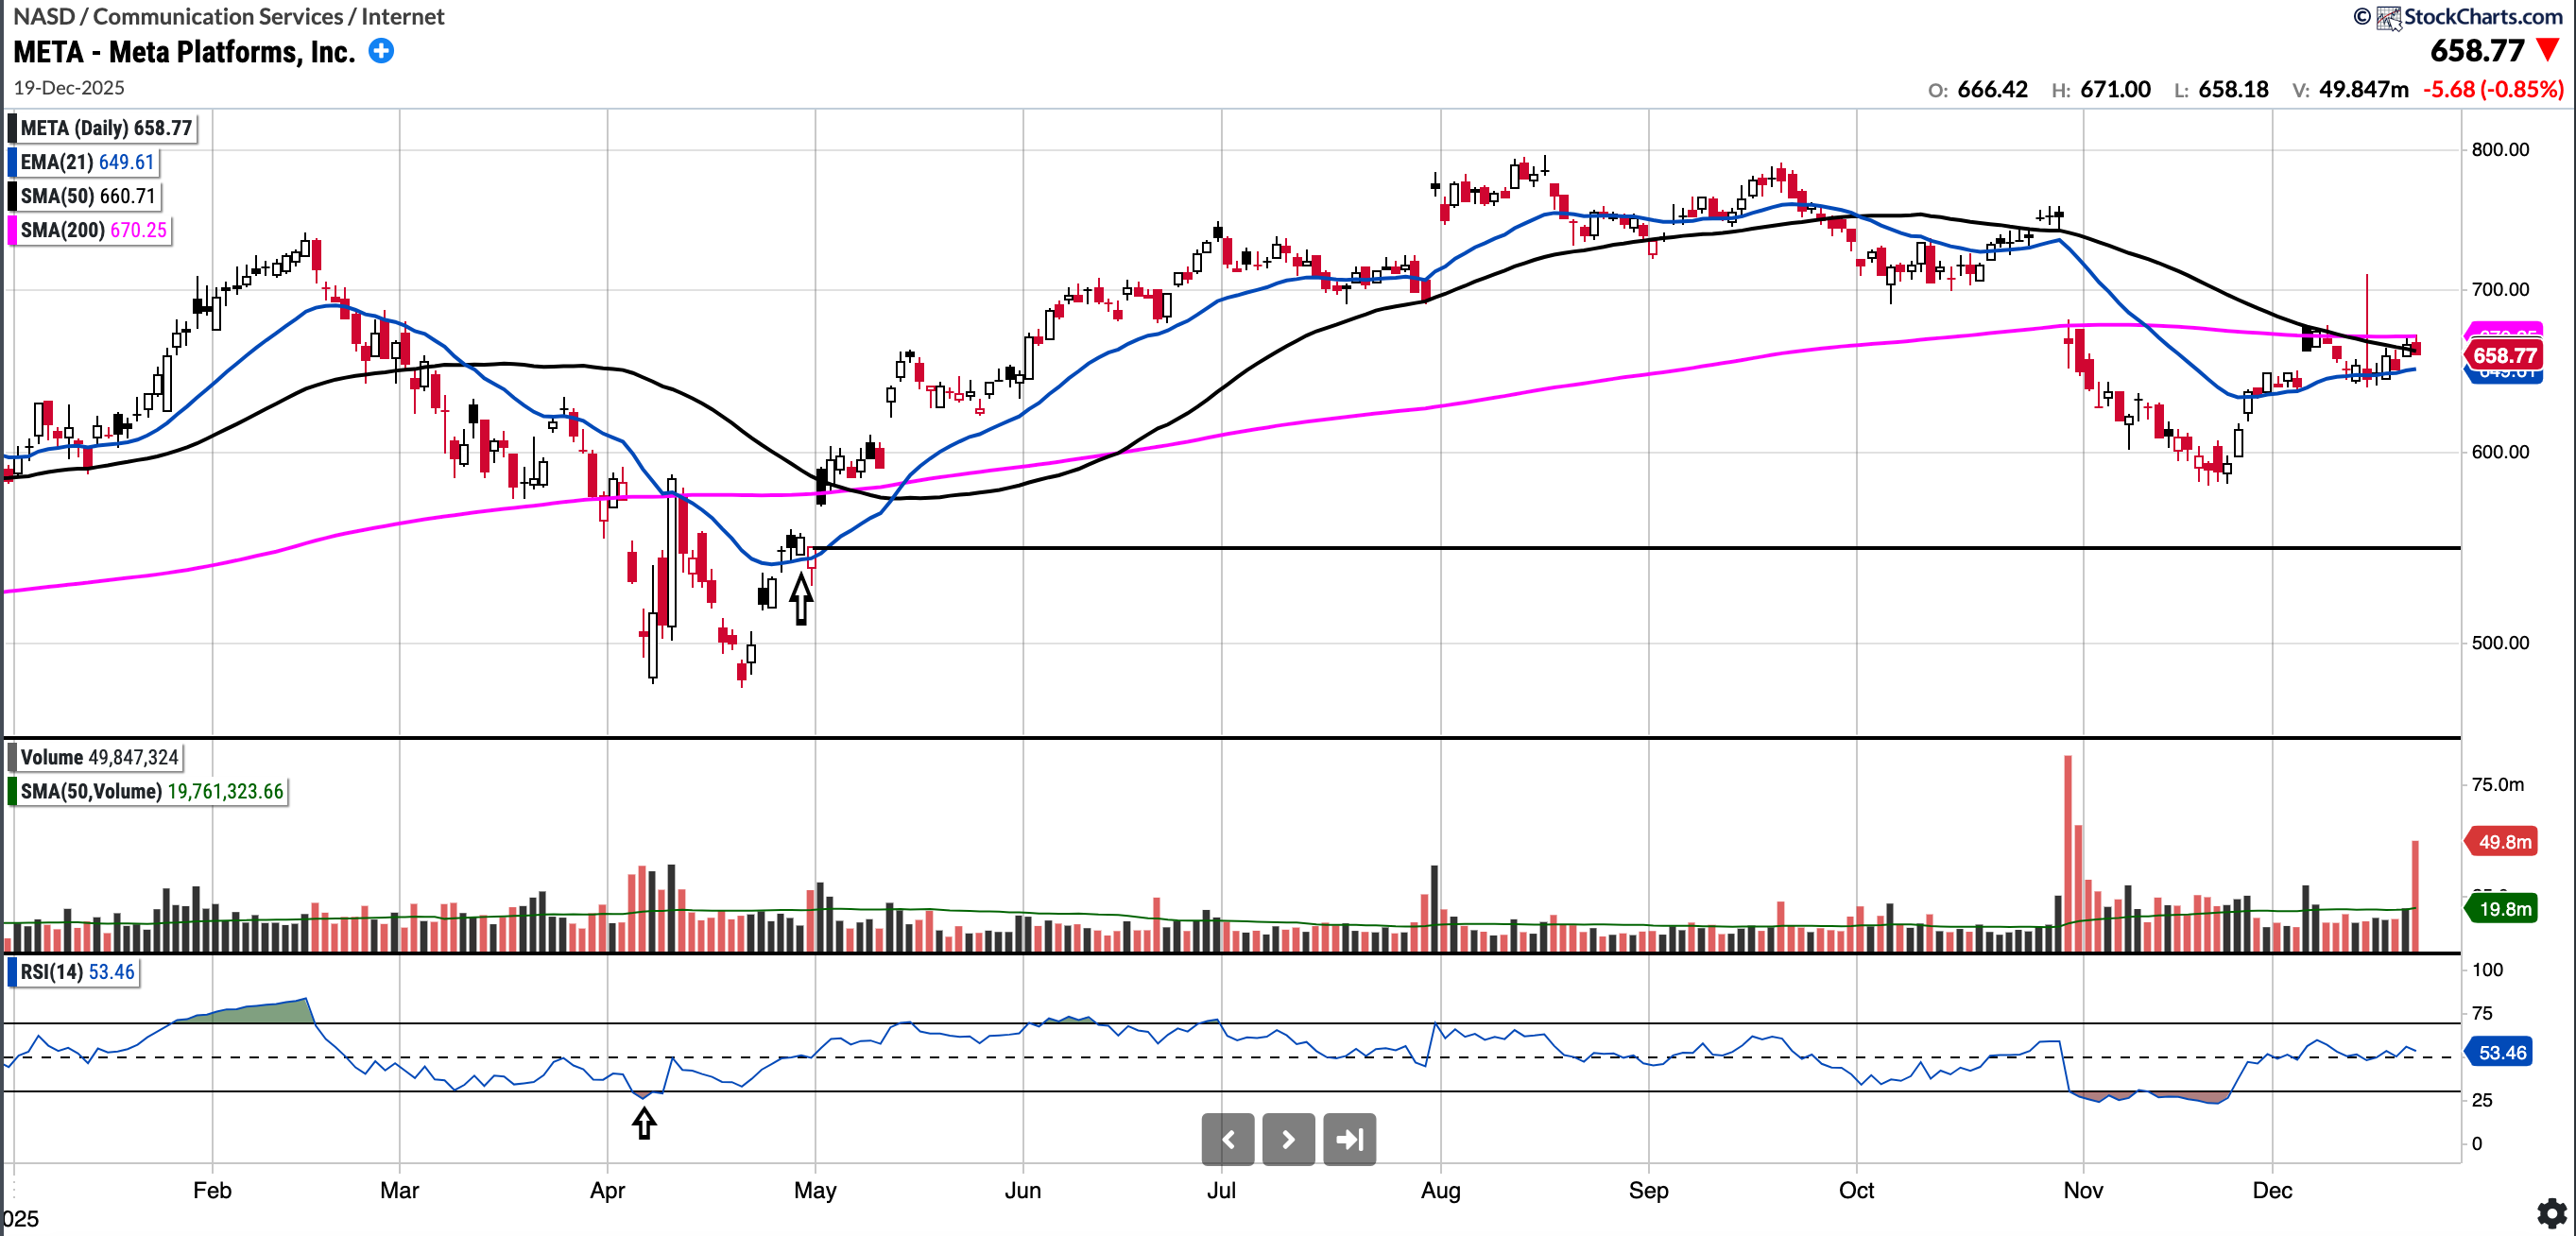
META (currently Long)
Currently trades at $658.77, 0.29% % below the 50SMA and 1.71% below the 200SMA.
RSI 53.46
+9.93% YTD
META sold off sharply post-earnings and actually reached more oversold levels than the April low. It has since started to turn a little, bouncing roughly 16% from the recent lows. There was news in recent weeks that Meta is looking to cut 30% of the Metaverse spend within Reality Labs. This could be a catalyst to turn the stock around.
For the chart to look more constructive, META needs to reclaim the SMA 200 (where it has been finding resistance) and then a logical upside target is the gap fill to $743. Note the 5EMA has recently ticked above the EMA 21 which is a constructive initial sign. This week the stock was rejected twice at the SMA 200, bulls would like to see this cleanly reclaimed.
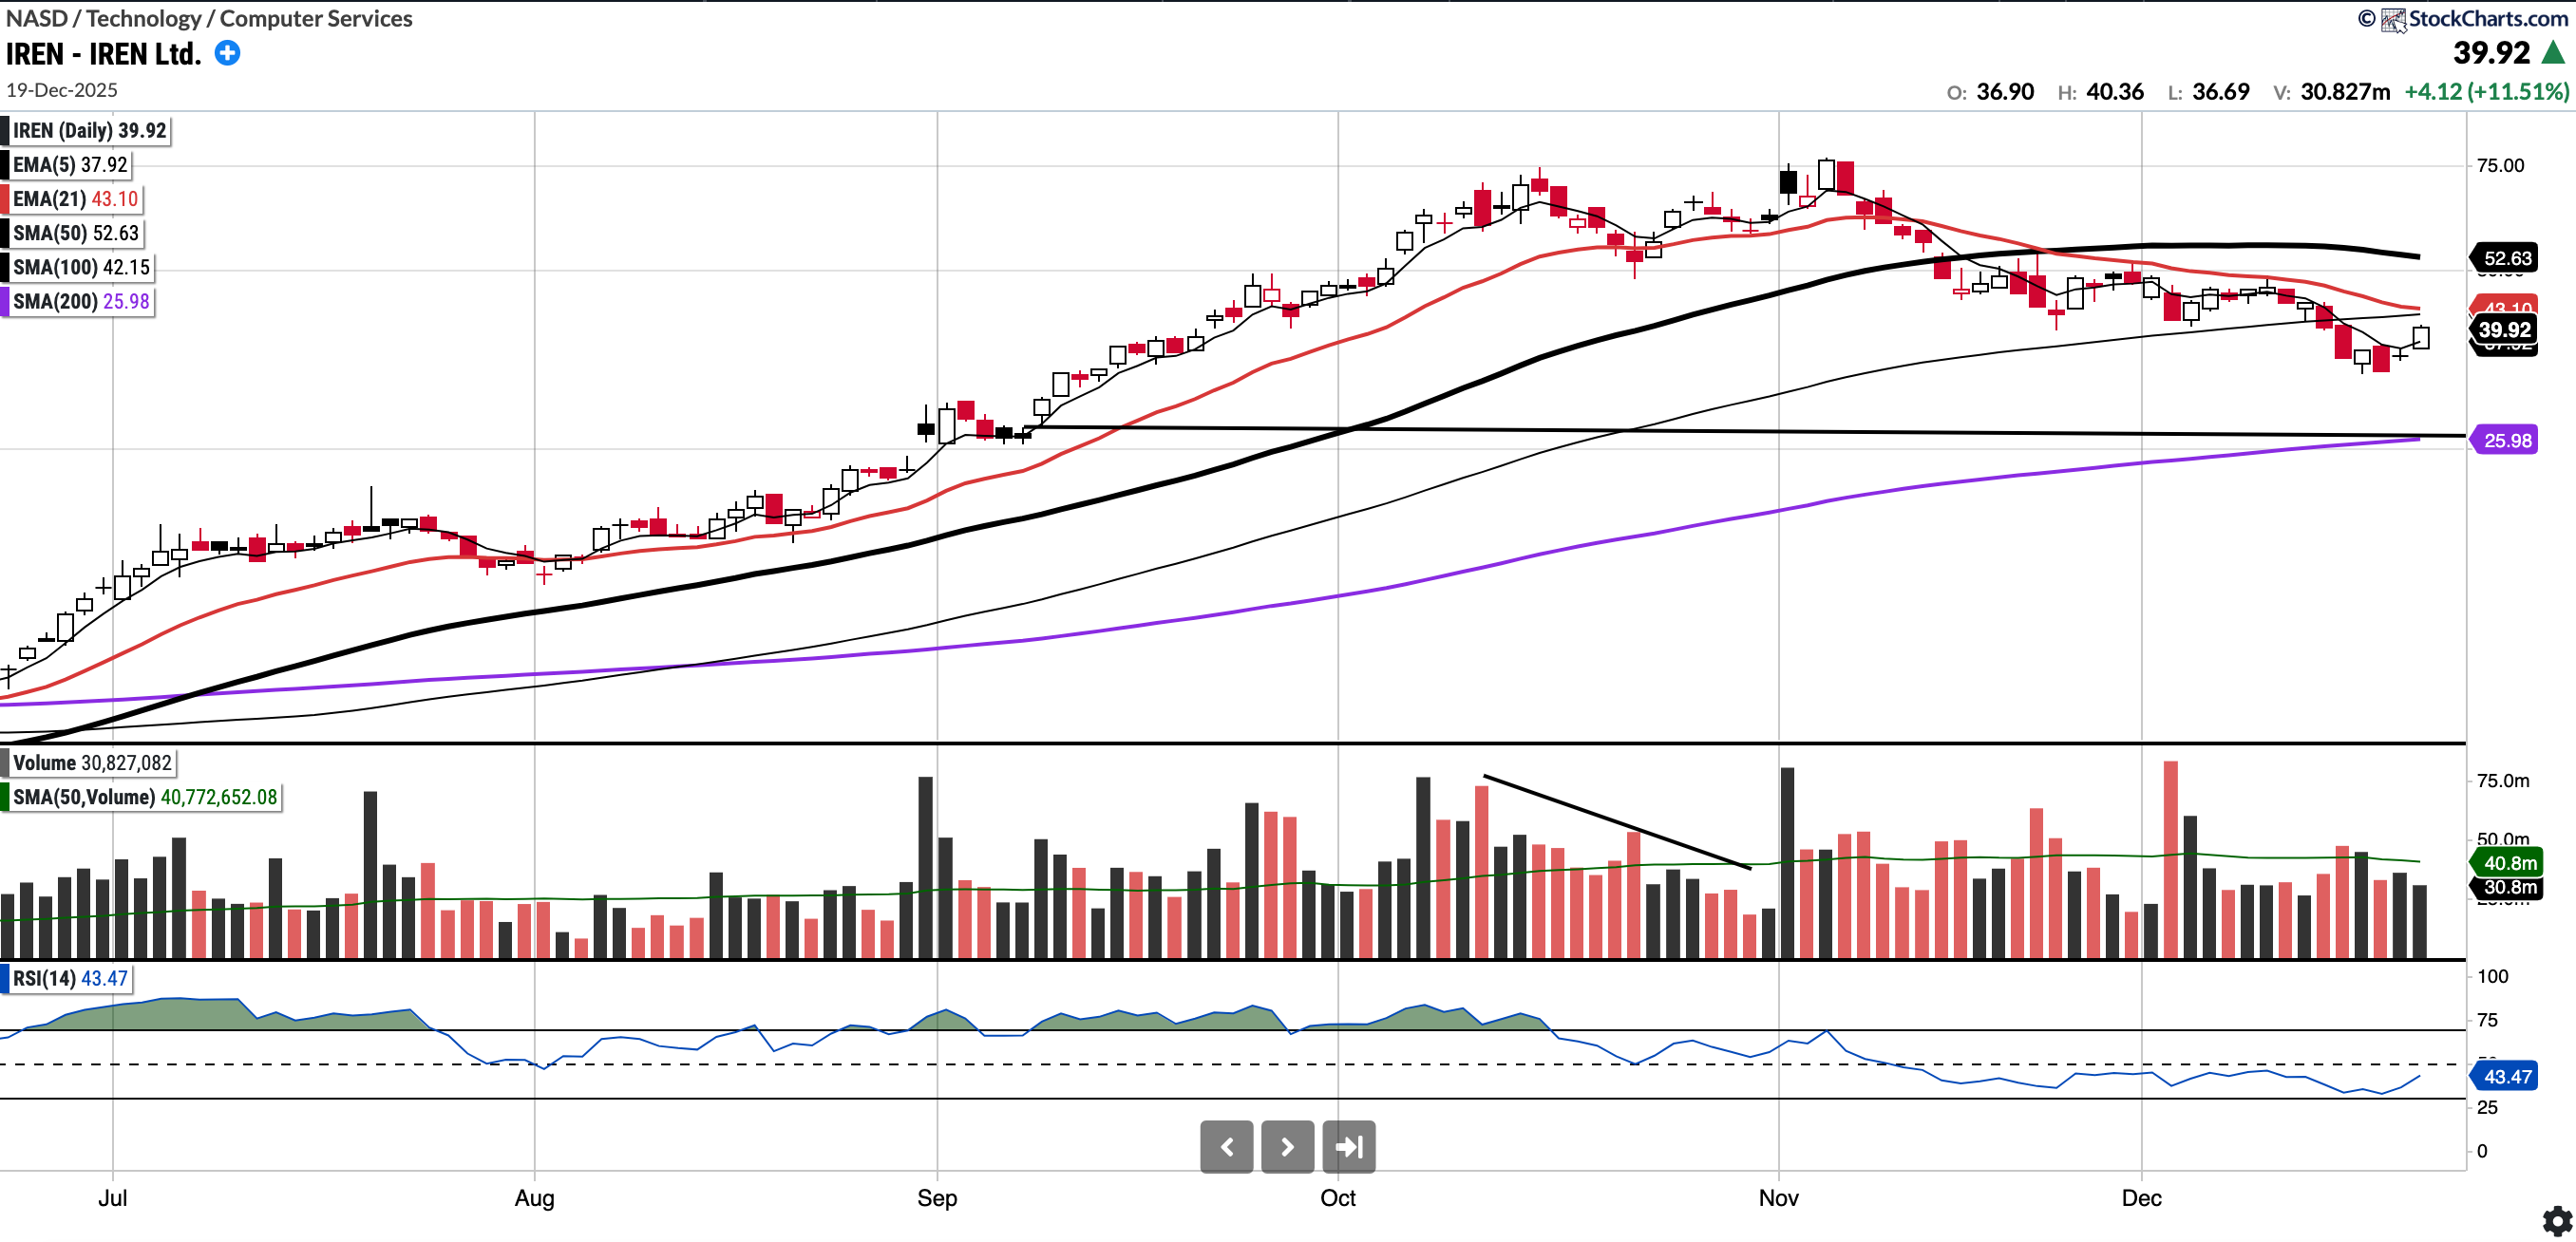
IREN (No position)
Currently trades at 39.92, 24.16% below a declining 50SMA and 53.66% above the 200SMA.
RSI 43.47
281.64% YTD
Notable recent event: IREN recently announced they were selling shares to buy back debt. Alongside the share sale which closed on December 8, 2025, they announced a private offering of $2 billion in new low interest, convertible senior notes not due until 2032 and 2033.
The IREN chart remains in an uptrend on a longer time frame but has lost key moving averages, most recently the 100SMA. IREN fell as low as $33 this week but has now rebounded to above $39, a level bulls would like it to hold as previously has served as support. A tradable set-up is forming I believe.
Notable portfolio changes in previous week (all updated live in subscriber channels):
