
Preview of the Week Ahead
W/C November 17, 2025

Hope you all are having a good weekend. Below we will be previewing the upcoming week and providing a portfolio update as usual.
Format for what is covered in this weekly preview:
A look at the indices
Key upcoming economic events
Upcoming earnings reports
Charts
Notable portfolio changes from the previous week
Current Portfolio Holdings (Position size, cost basis, and commentary on each holding regarding the intended holding period and any planned activity)
Ensure you check out the most recent Monthly Portfolio and Performance Update (including Market Overview) below if you have not done so.

If it is your first time here, read the below post on how to navigate the SixSigmaCapital Website and subscribe to the option that suits.

Indices
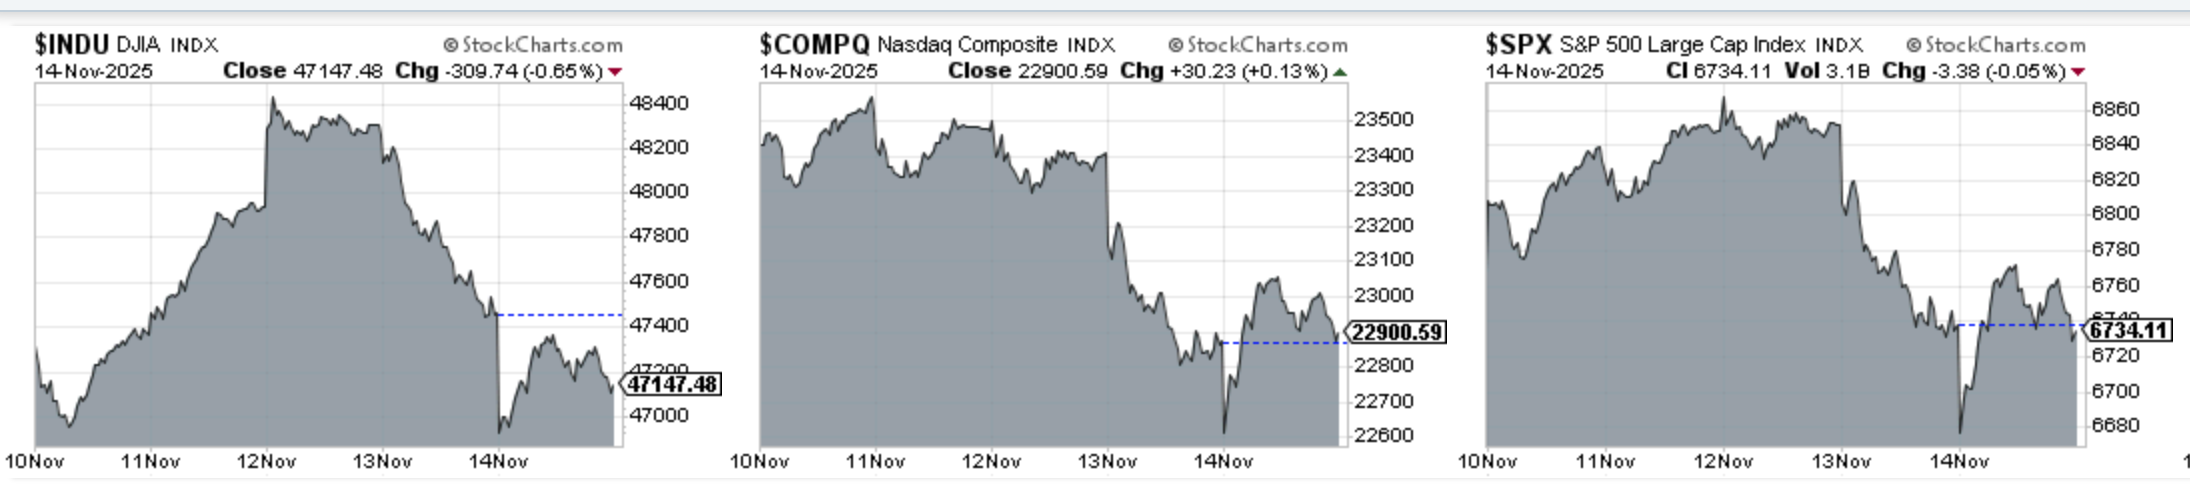
Dow Jones declined 0.26% in the last week
S&P 500 declined 0.95% in the last week
Nasdaq Composite declined 2.07% in the last week
IWM declined 2.92% in the last week
Key upcoming economic events:
Monday, November 17
NY Empire State Manufacturing Index (November)
Tuesday, November 18
Import and Export Prices (October)
Industrial Production (October)
NAHB Housing Market Index (November)
Wednesday, November 19
Existing Home Sales (October)
FOMC Meeting Minutes: 2:00 PM ET
Thursday, November 20
Initial Jobless Claims (Weekly)
Philadelphia Fed Manufacturing Index (November)
New Home Sales (October)
Friday, November 21
S&P Global Flash PMIs (Manufacturing & Services, November)
University of Michigan Consumer Sentiment (Preliminary, November)
Upcoming Earnings
Last week was an extremely busy schedule for me with several portfolio names reporting. This week I have 0 portfolio names reporting but we do have NVDA which the market will be watching very closely.
Below is the infographic by Earnings Whispers:

Charts
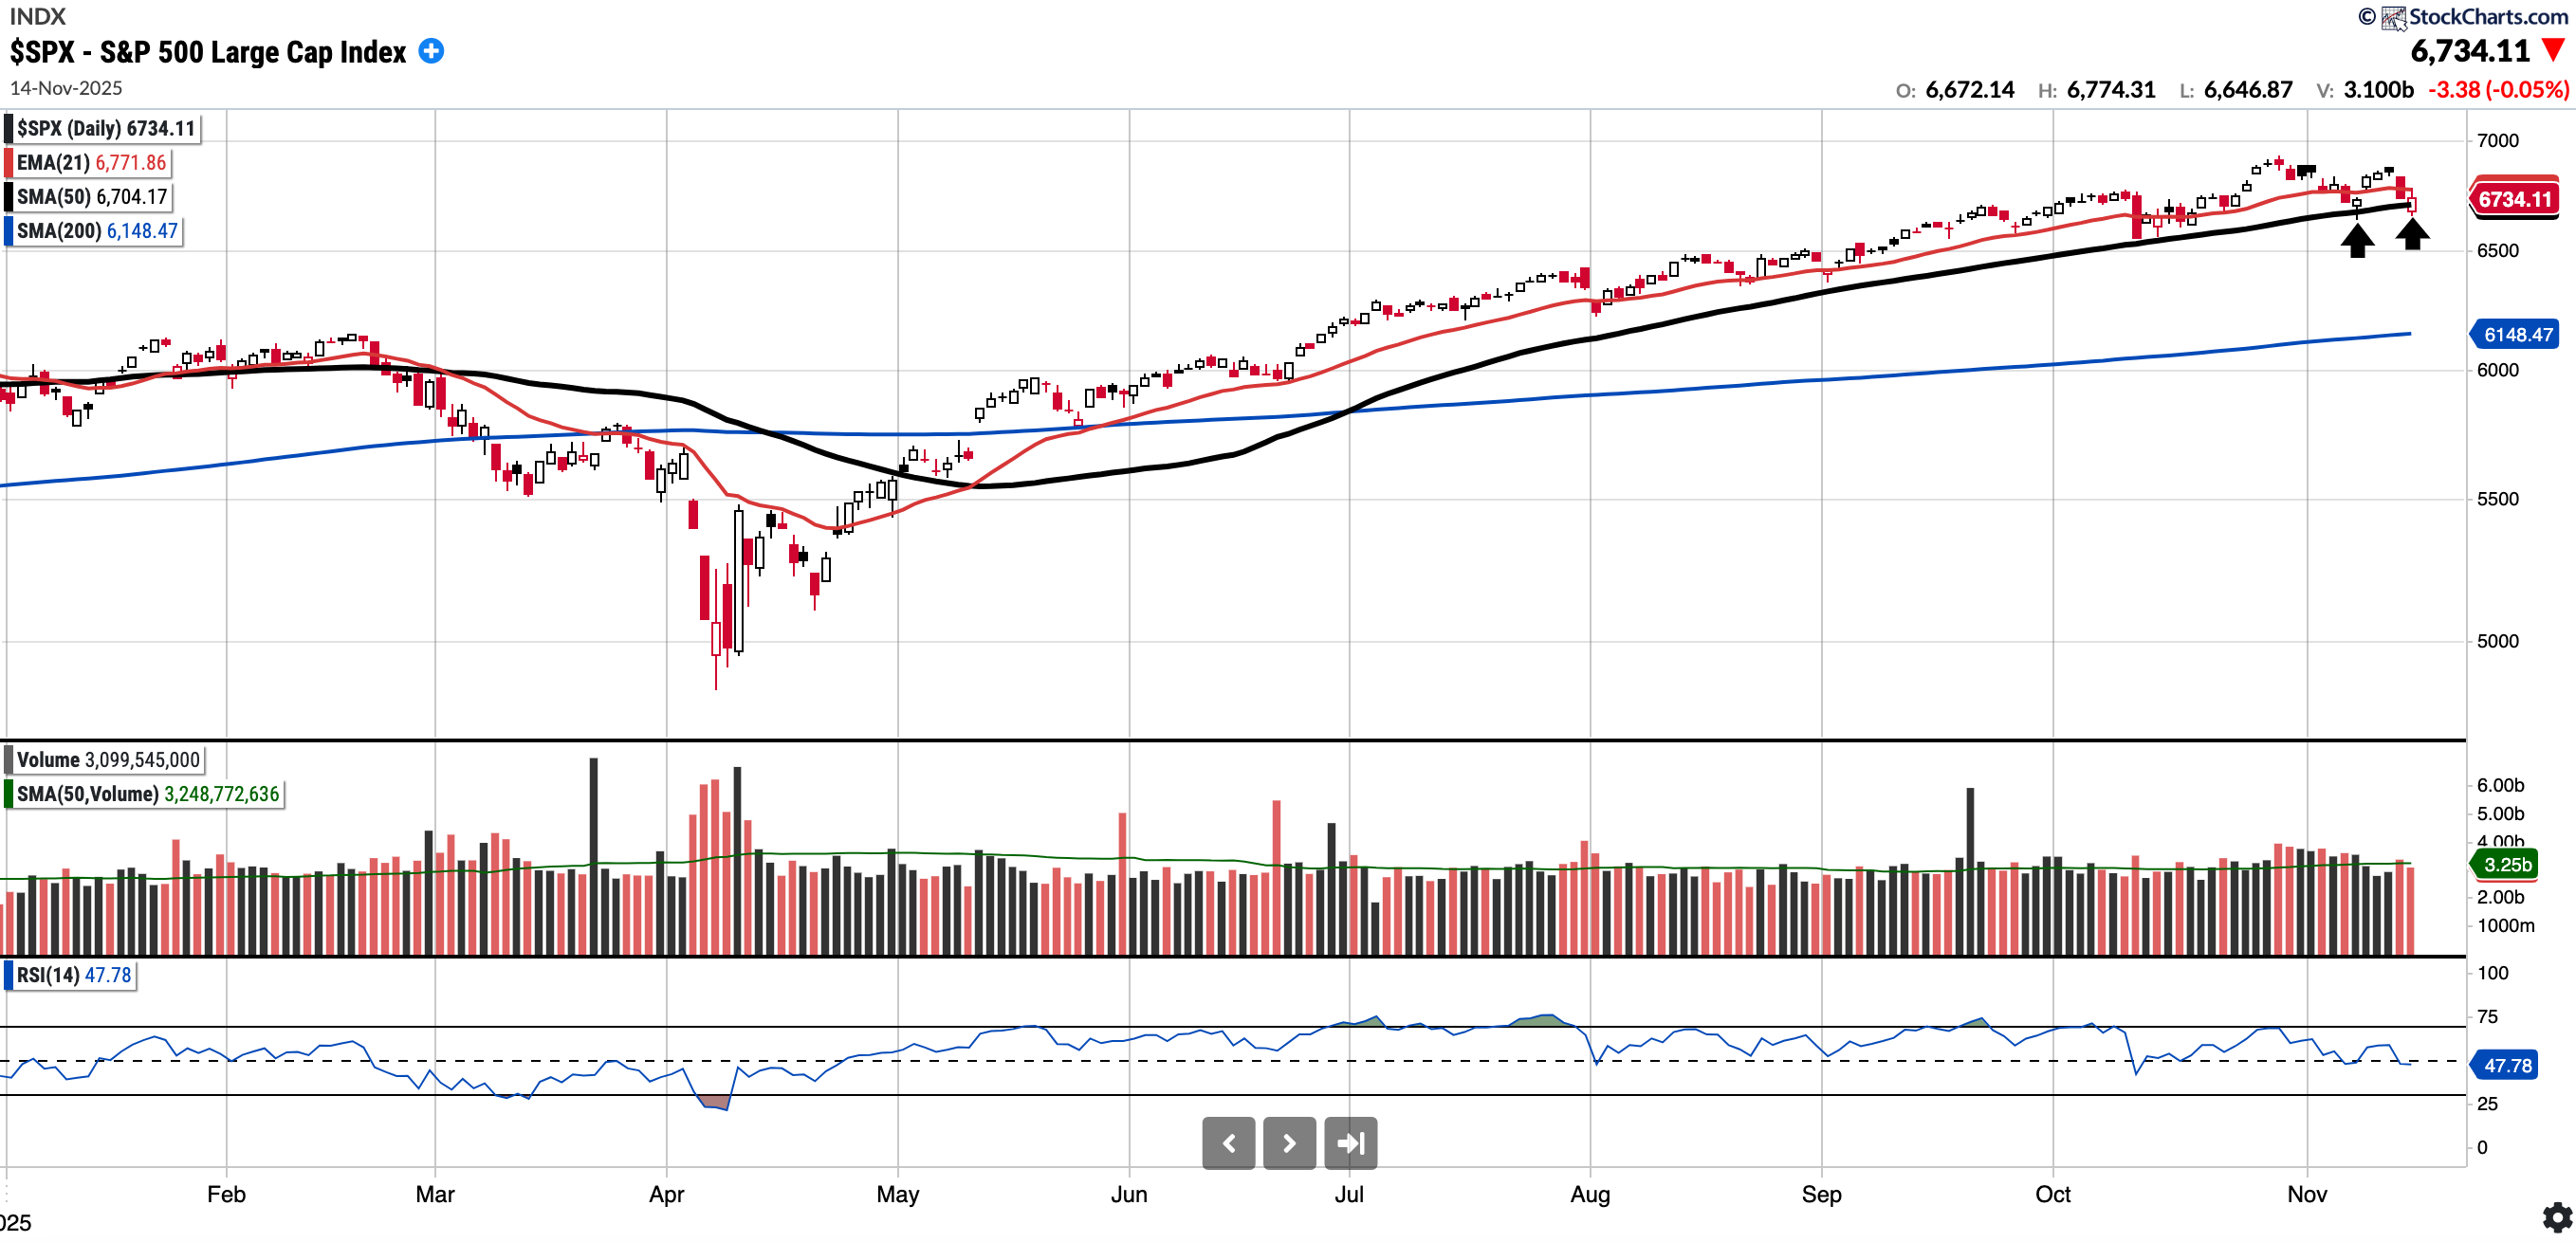
SPX
Currently trades at 6734.11, 0.45% above a rising 50SMA and 9.52% above 200SMA.
RSI 47.78
14.75% YTD
Distribution days in the last week: 1
We tested the SMA 50 again on Friday which held, for now. Bulls would like to see it defended and the EMA 21 being reclaimed.
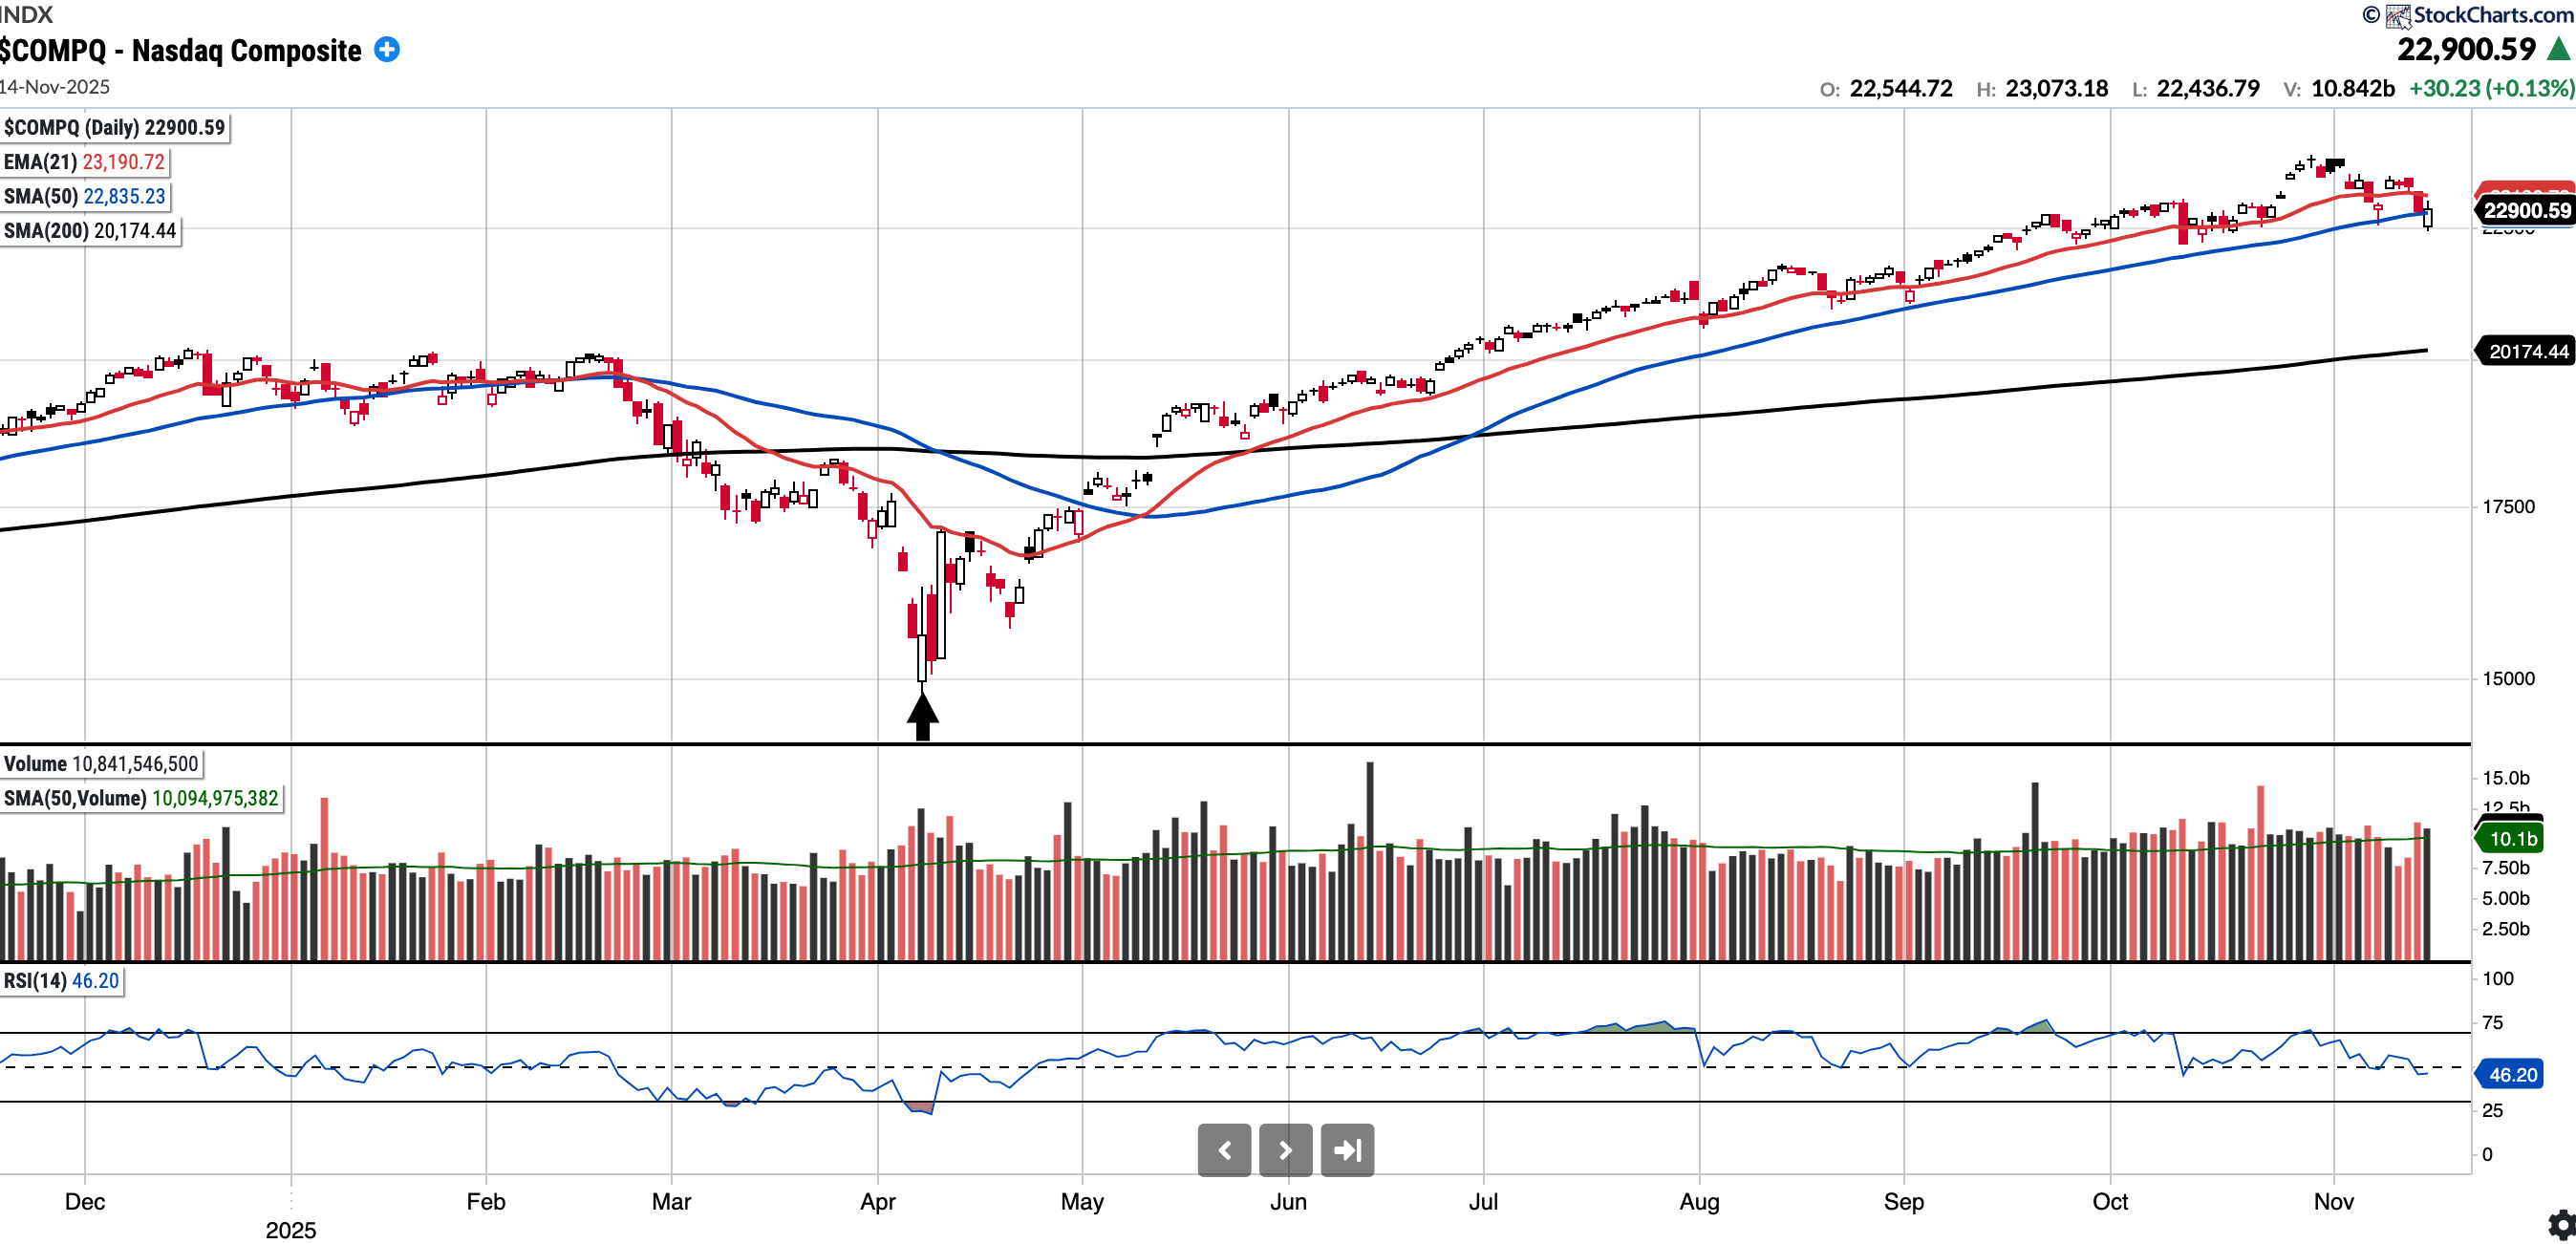
COMPQ
Currently trades at 22,900.59, 0.29% above a rising 50SMA and 13.51% above 200SMA.
RSI 46.20
18.77% YTD
Distribution days in the last week: 1
Similarly to the S&P 500, the Nasdaq Composite tested and held the SMA 50 on Friday.
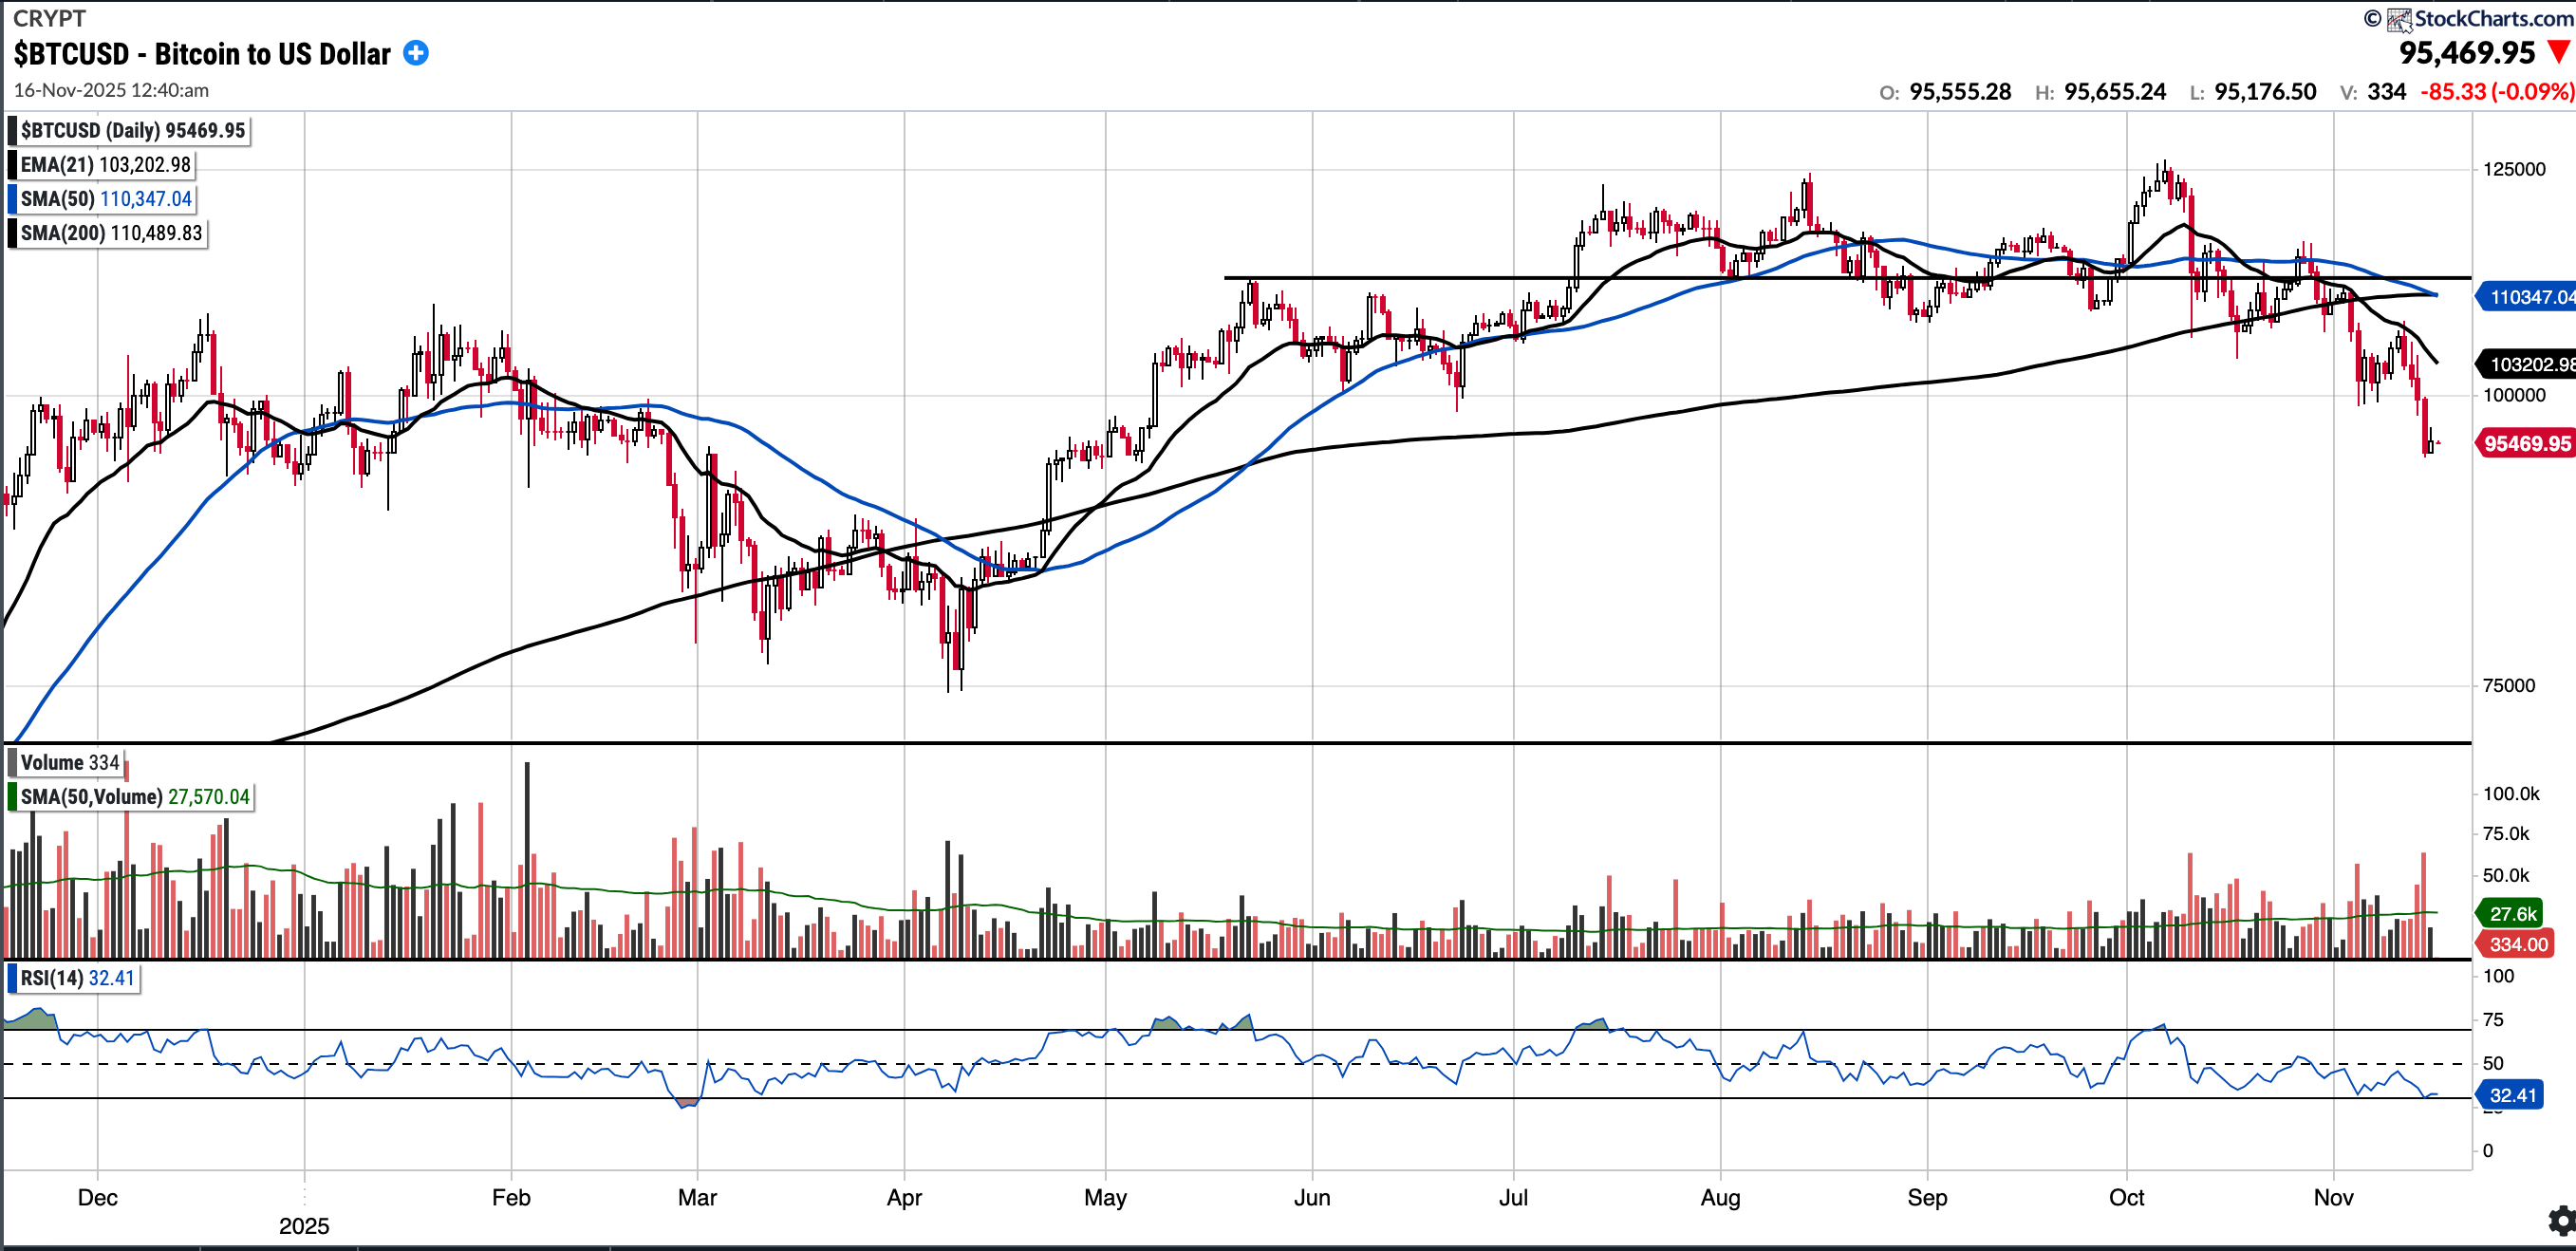
BTC (currently Long)
Currently trades at $95,385.86, 13.78% below the 50SMA and 13.66% below the 200SMA.
RSI 32.41
+1.02% YTD.
BTC broke below the 100k psychological level last week for the first time since June and this week has spent the latter part in the low to mid 90,000’s.
BTC now remains firmly below the SMA 50, SMA 200 and the 112k level, the prior support now turned resistance level. Last week I had speculated “With the government shutdown potentially adding would like to see how BTC responds especially as it can be a barometer of risk”. BTC remained flat on the news which I shared concerned me, and the next day we got a huge sell off across the board. Furthermore, from the chart you will notice BTC has formed a “death cross”.
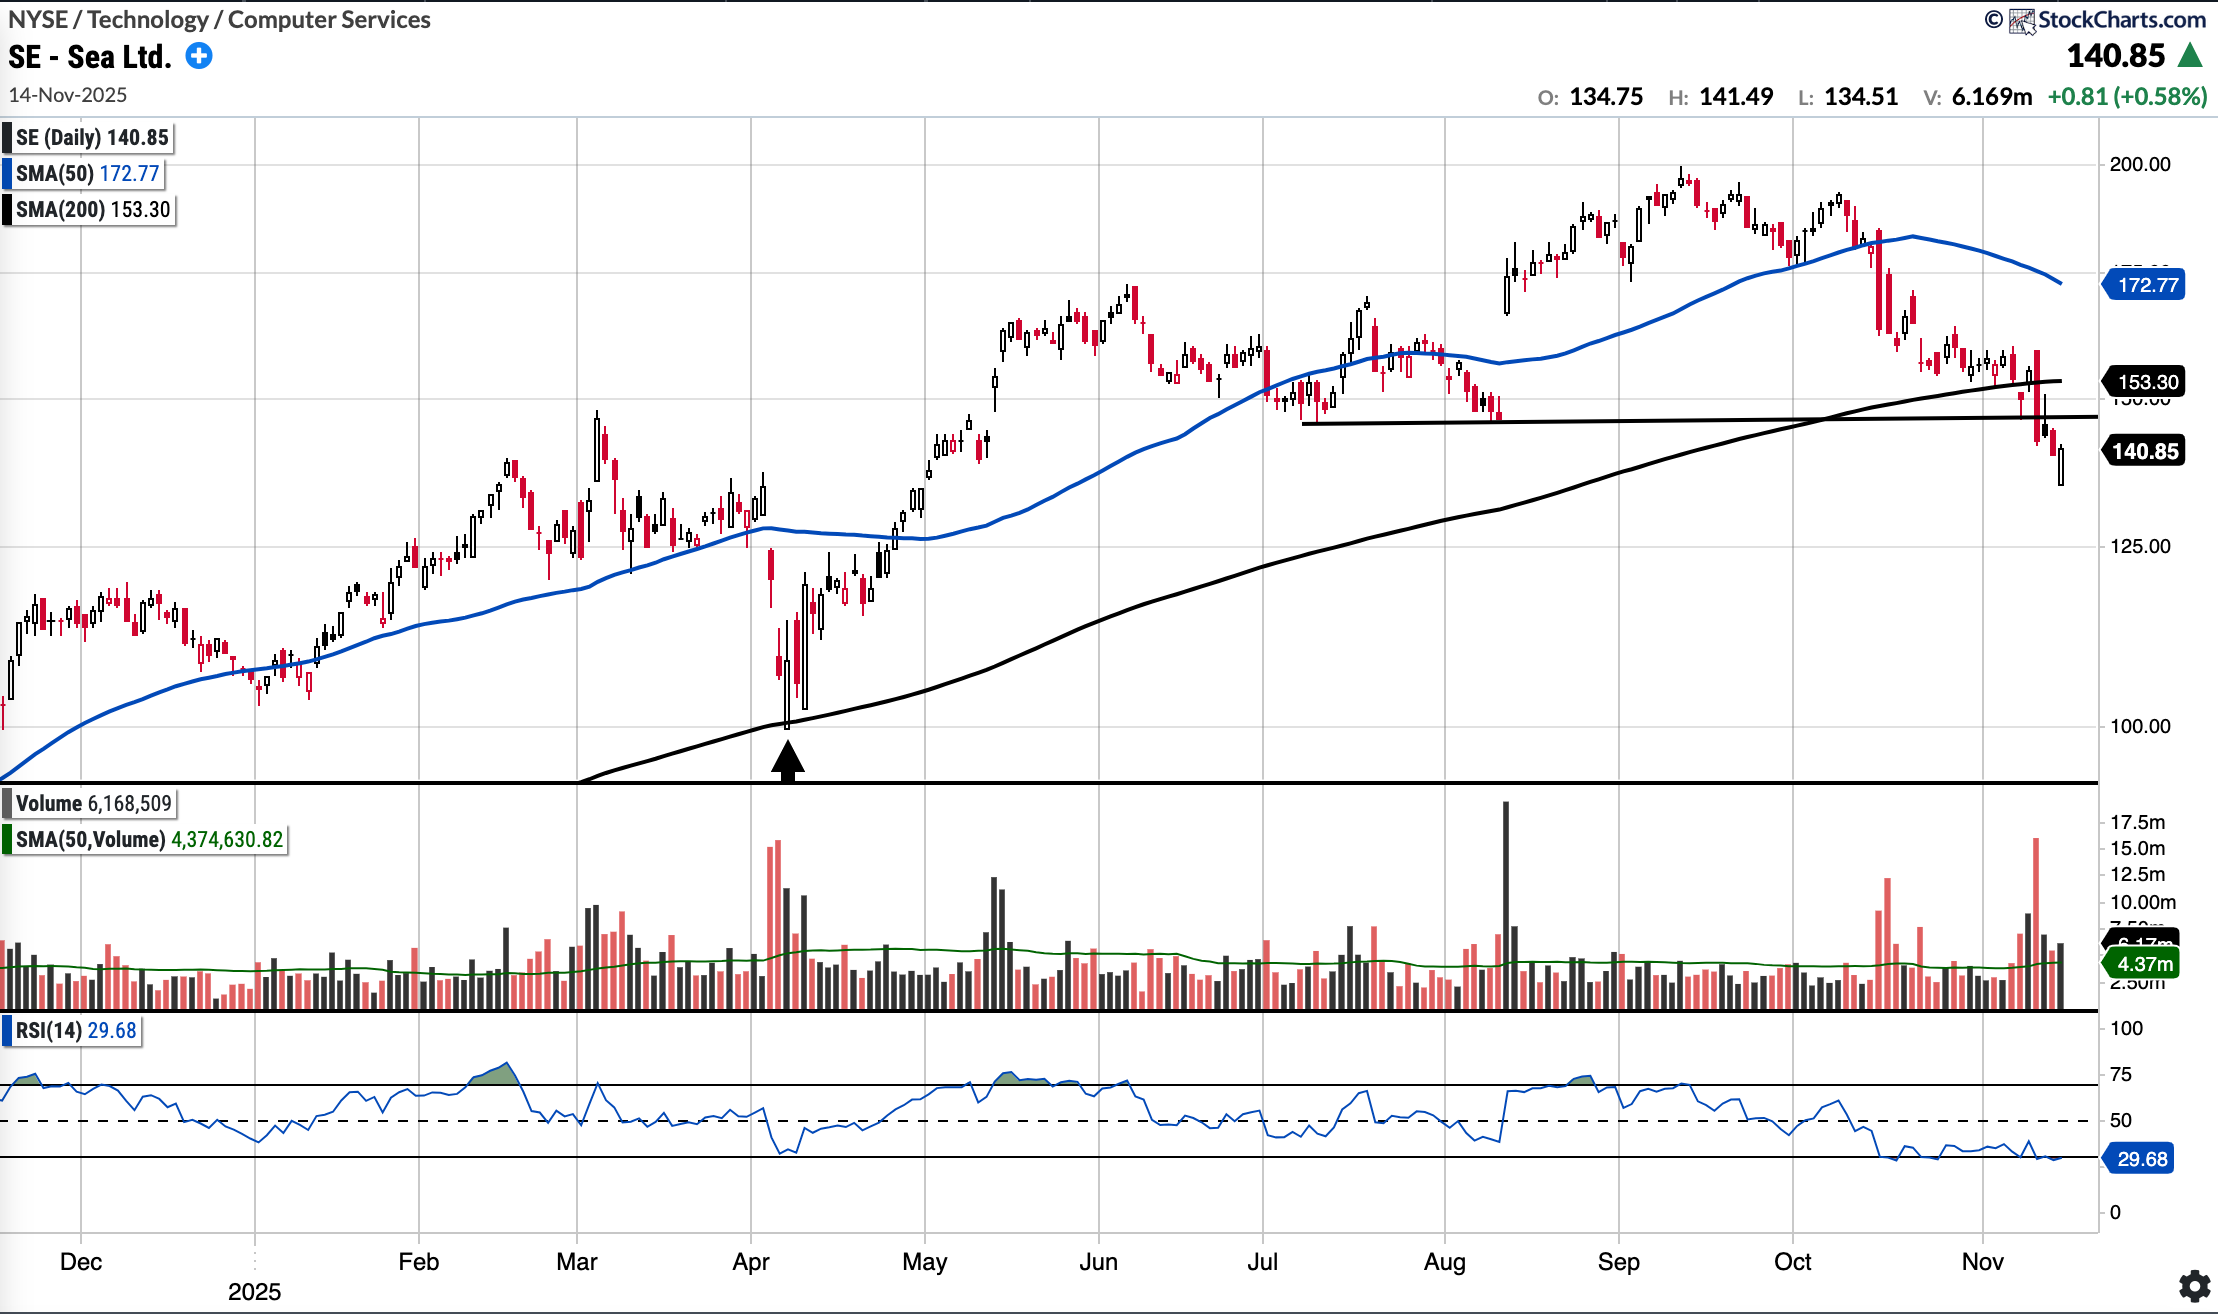
SE (currently Long)
Currently trades at $140.85, 18.48% below the 50SMA and 8.12% below the 200SMA.
RSI 29.68
+34.31% YTD
I had reported recently that SE has pulled back from its recent high of $199 on almost no known news and the sell volume has been notable. At that point it had held the horizontal 145 support although was trading below the SMA 200.
SE reported earnings on Tuesday, missing on the bottom line but beating significantly on the top line. Since then, the stock has lost the horizontal $145 support, although buyers stepped in at the low $130 level. However, substantial work is required for the chart to become constructive again. Reclaiming the $145 level and the SMA 200 are the first two hurdles I will be watching. I have been nibbling away with some buys for the long-term.
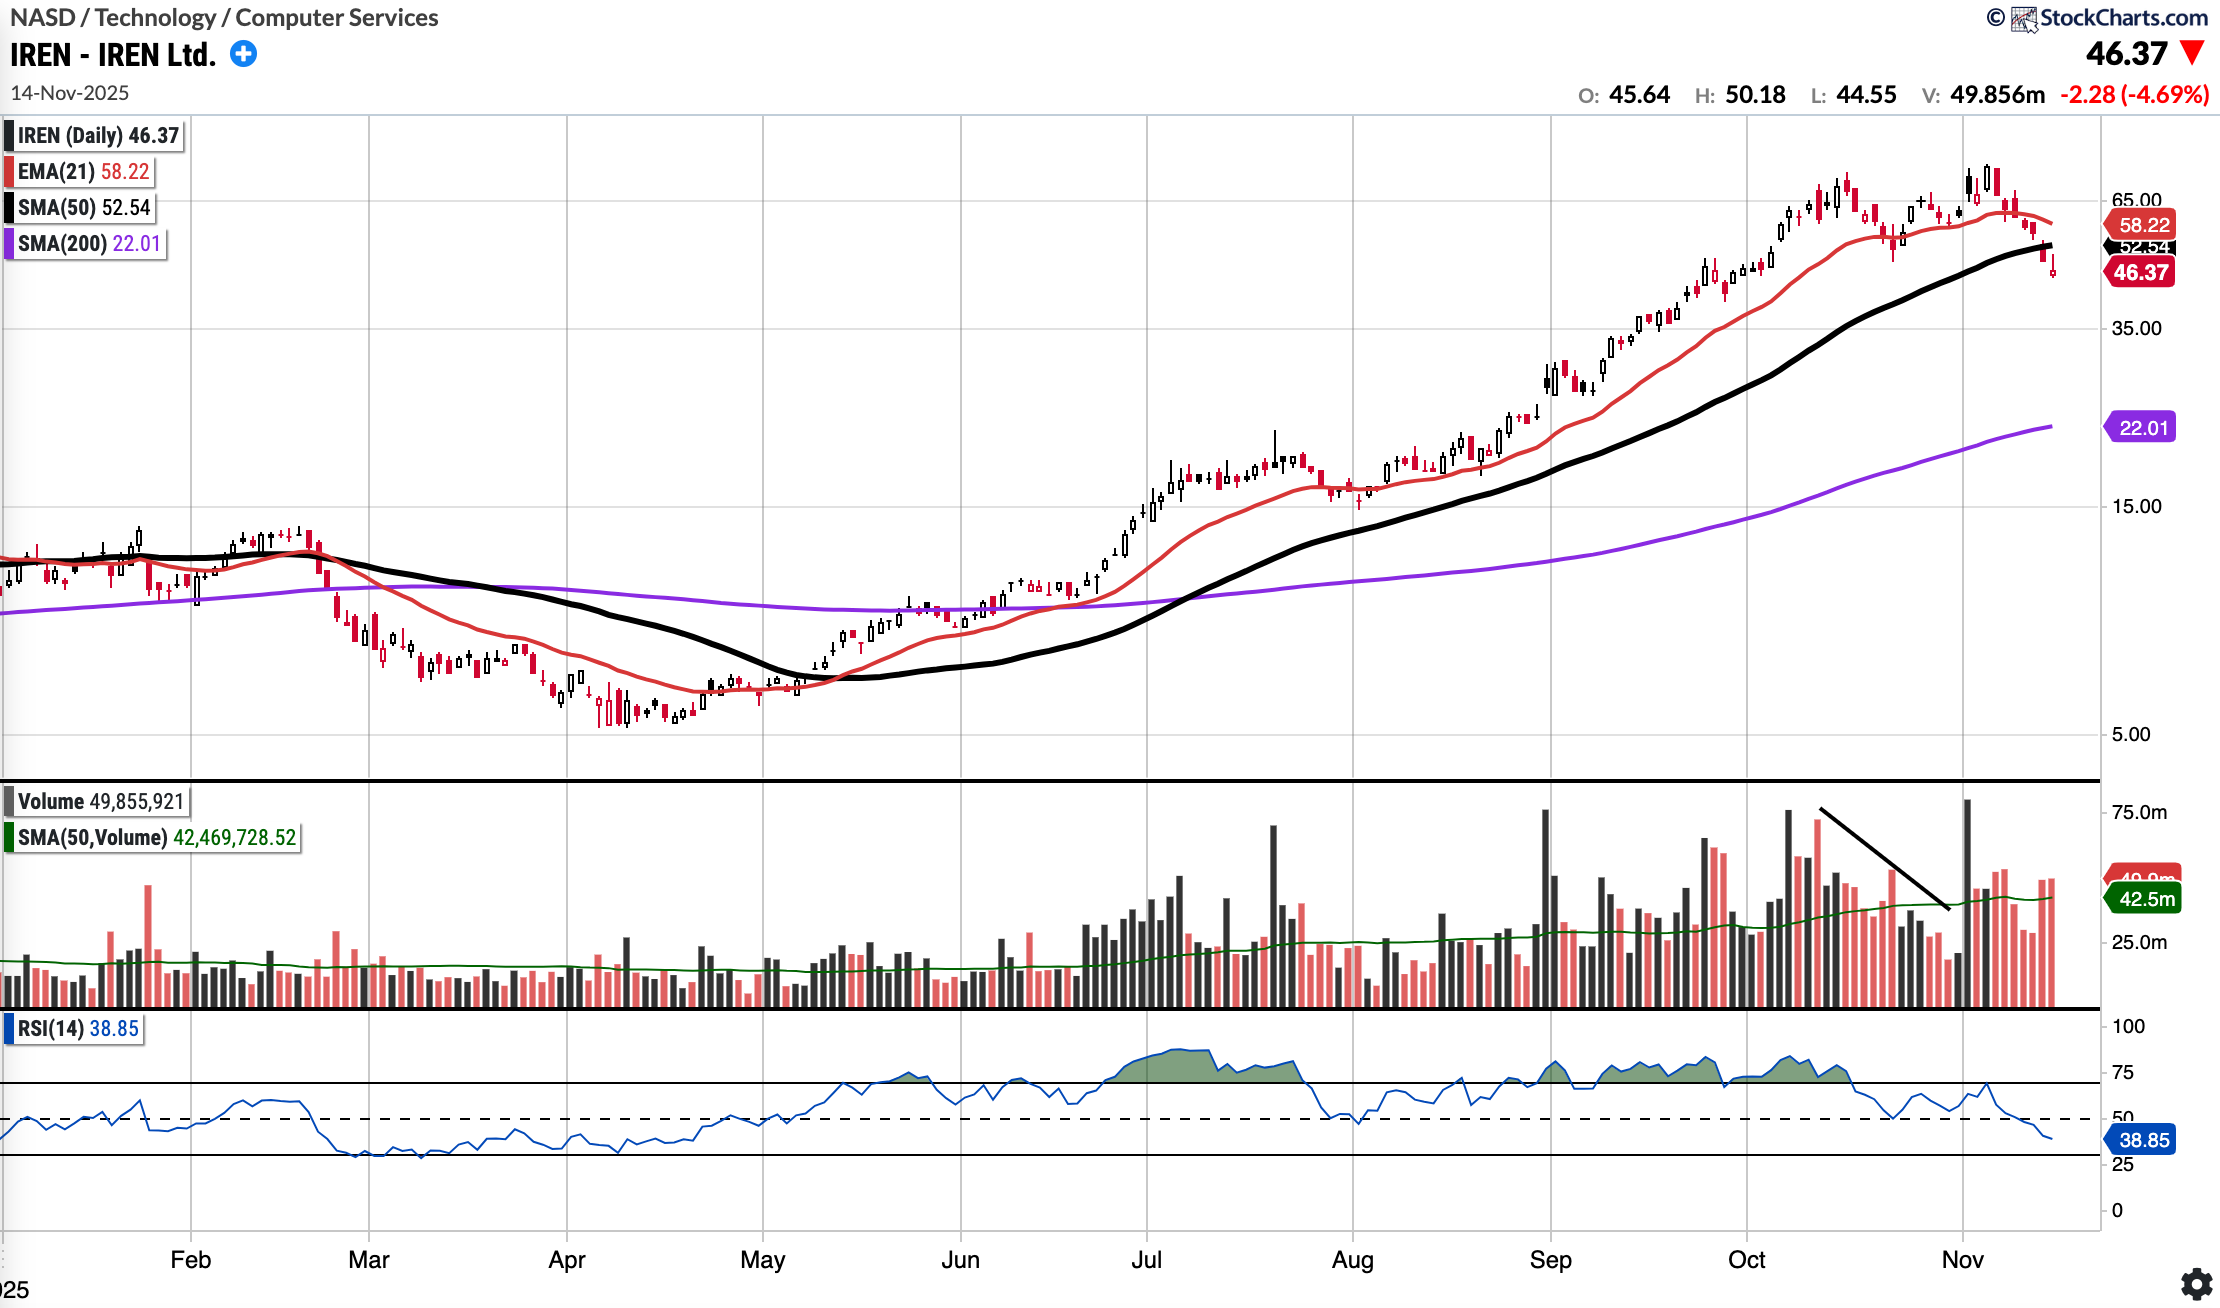
IREN (Currently Long)
Currently trades at 46.37, 11.75% below a rising 50SMA and 110.63% above the 200SMA.
RSI 52.94
343.31% YTD
I had stated last week that IREN “remains somewhat extended still and I expect IREN will consolidate, either over time or by price. A pullback to the SMA 50 will happen at some point and may offer a better entry, this also coincides with the $49-$50 support”
In fact IREN was red each day this week and now sits 11% or so below the SMA 50! The chart has turned and quickly. A mean reversion test of the SMA 50 is very likely but Bulls would like it to reclaim the SMA 50 and EMA 21, with conviction, before can feel good about a resumed uptrend. Bears are in charge for now.
Notable portfolio changes in previous week (all updated live in subscriber channels):
