
Preview of the Week Ahead
W/C March 2, 2026

Hope you all are having a good weekend. Below we will be previewing the upcoming week and providing a portfolio update as usual.
Format for what is covered in this weekly preview:
A look at the indices
Key upcoming economic events
Upcoming earnings reports
Charts
Notable portfolio changes from the previous week
Current Portfolio Holdings (Position size, cost basis, and commentary on each holding regarding the intended holding period and any planned activity)
Closing Thoughts
I highly recommend checking out the latest Monthly Portfolio and Performance Update below:

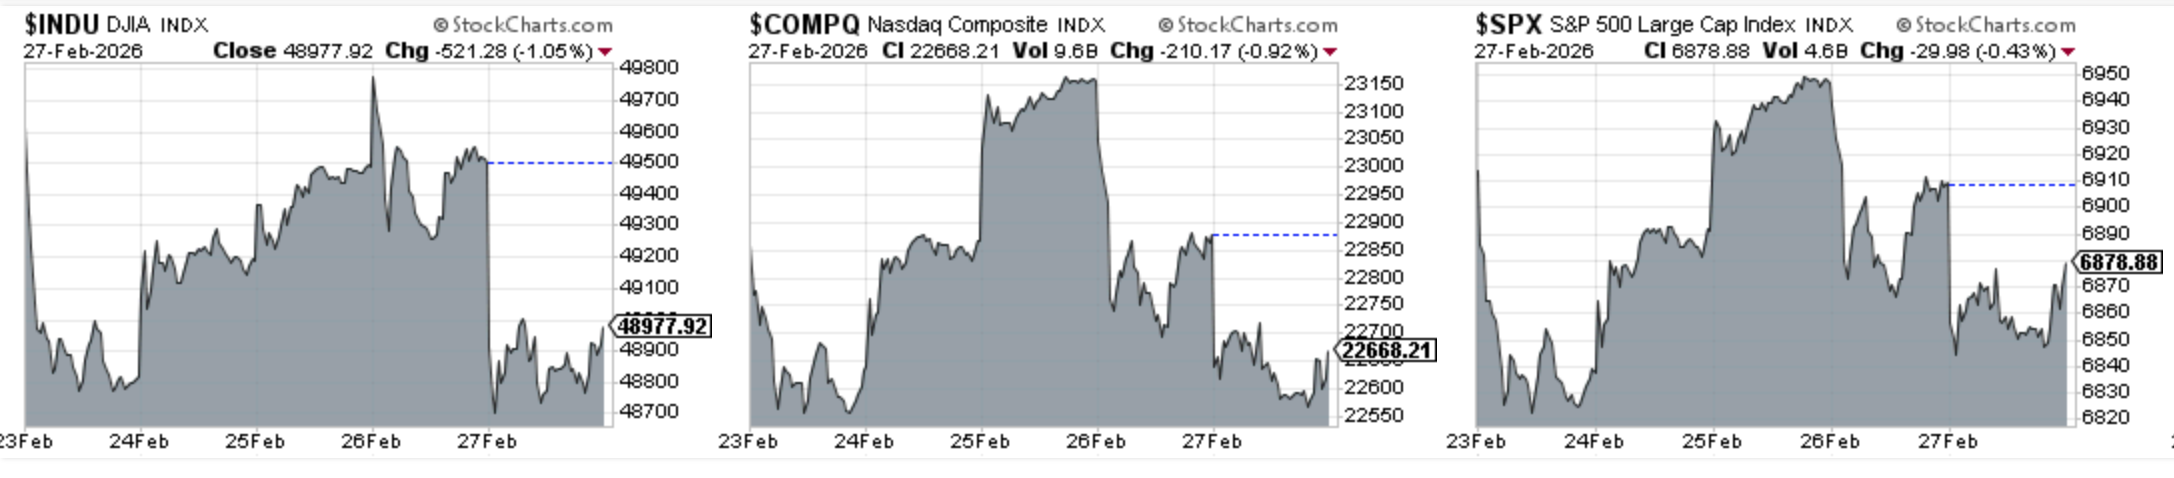
Indices
Dow Jones declined 1.37% in the last week
S&P 500 declined 0.46% in the last week
Nasdaq Composite declined 0.88% in the last week
IWM declined 0.84% in the last week
Key upcoming economic events:
Monday, March 2
S&P Global Manufacturing PMI (Final, Feb)
ISM Manufacturing PMI (Feb)
Construction Spending (Dec)
ISM Manufacturing Prices
Tuesday, March 3
JOLTS Job Openings (Jan)
Ward’s Total Vehicle Sales (Feb)
UK Spring Statement
Wednesday, March 4
ADP Employment Report (Feb)
ISM Services PMI (Feb)
S&P Global Services PMI (Final, Feb)
The Fed “Beige Book”
Thursday, March 5
Weekly Initial Jobless Claims
Productivity and Costs (Q4 Prelim)
U.S. Trade Balance (Jan)
Challenger Job Cuts (Feb)
Friday, March 6
The Employment Situation (Feb): Includes Nonfarm Payrolls, Unemployment Rate, and Average Hourly Earnings.
Retail Sales (Jan)
Business Inventories (Dec)
Upcoming Earnings
The schedule this week is again a busy one. I have two portfolio companies reporting plus many other notable ones I will be keeping an eye on such as CRWD, AVGO, COST and TGT. Below is the infographic by Earnings Whispers:
, Rigetti Computing #RGTI, Norwegian Cruis Line #NCLH, BigBear.ai #BBAI, Marvell Technology #MRVL, and Veeva Systems #VEEV.")
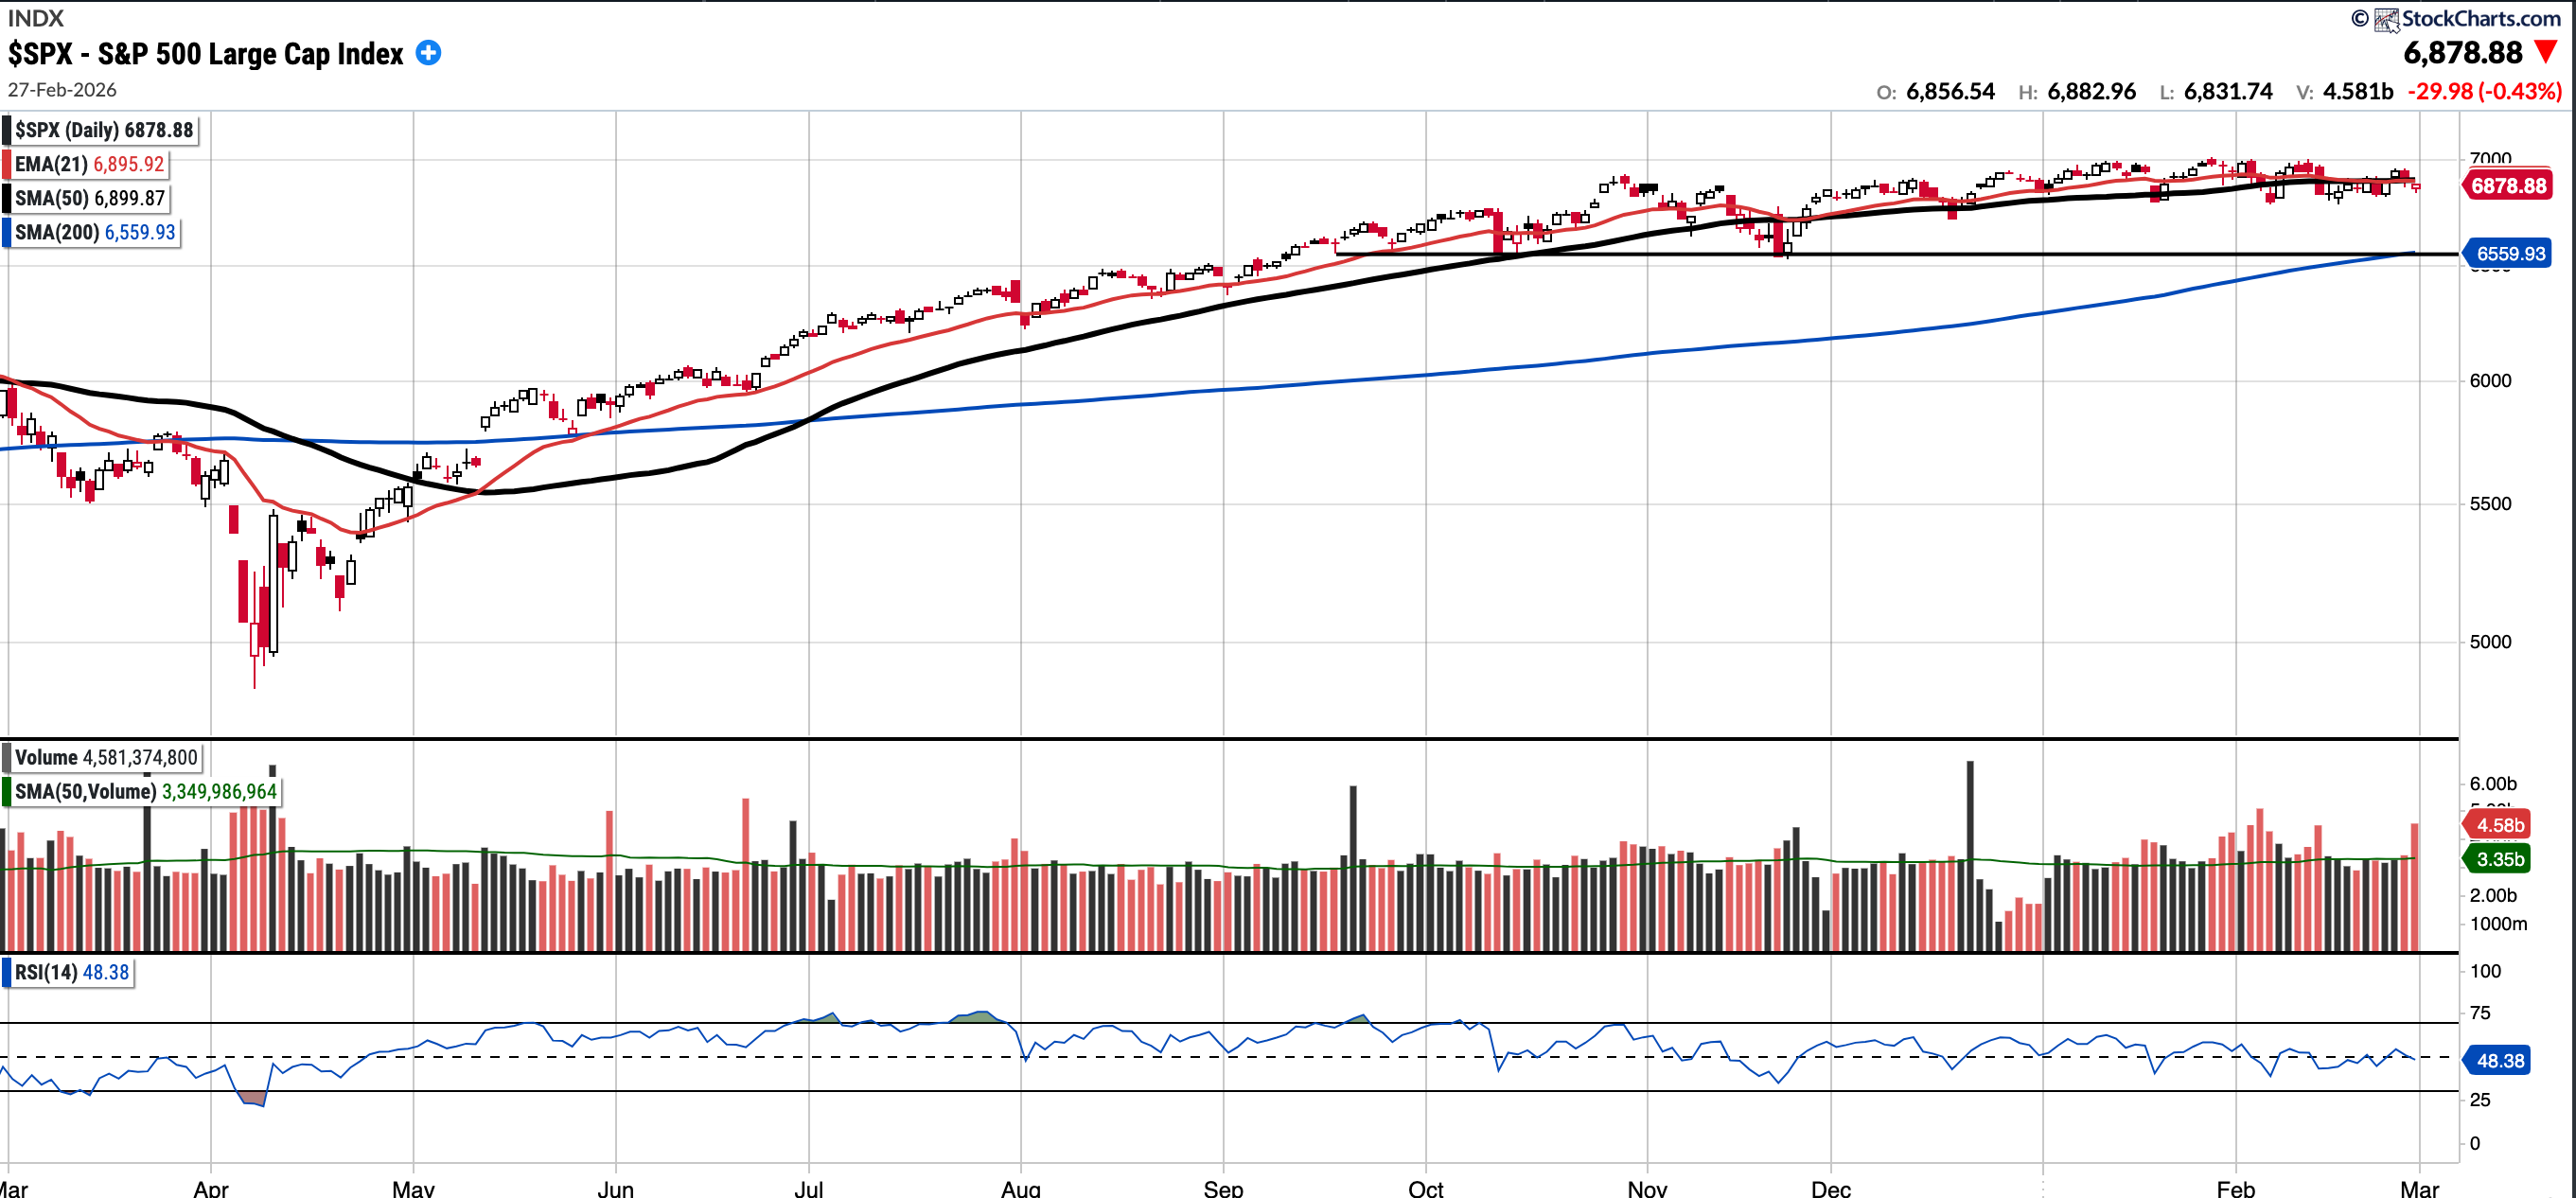
SPX
Currently trades at 6,878.88, 0.3% below the 50SMA and 4.86% above the 200SMA.
RSI 48.38
0.30% YTD
Distribution days in the last week: 2
There were 2 distribution days this week and the SPX closed below both the EMA 21 and SMA 50. The EMA 21 has also undercut the SMA 50 which is not constructive to see. The last time this happened, and held, was last March.
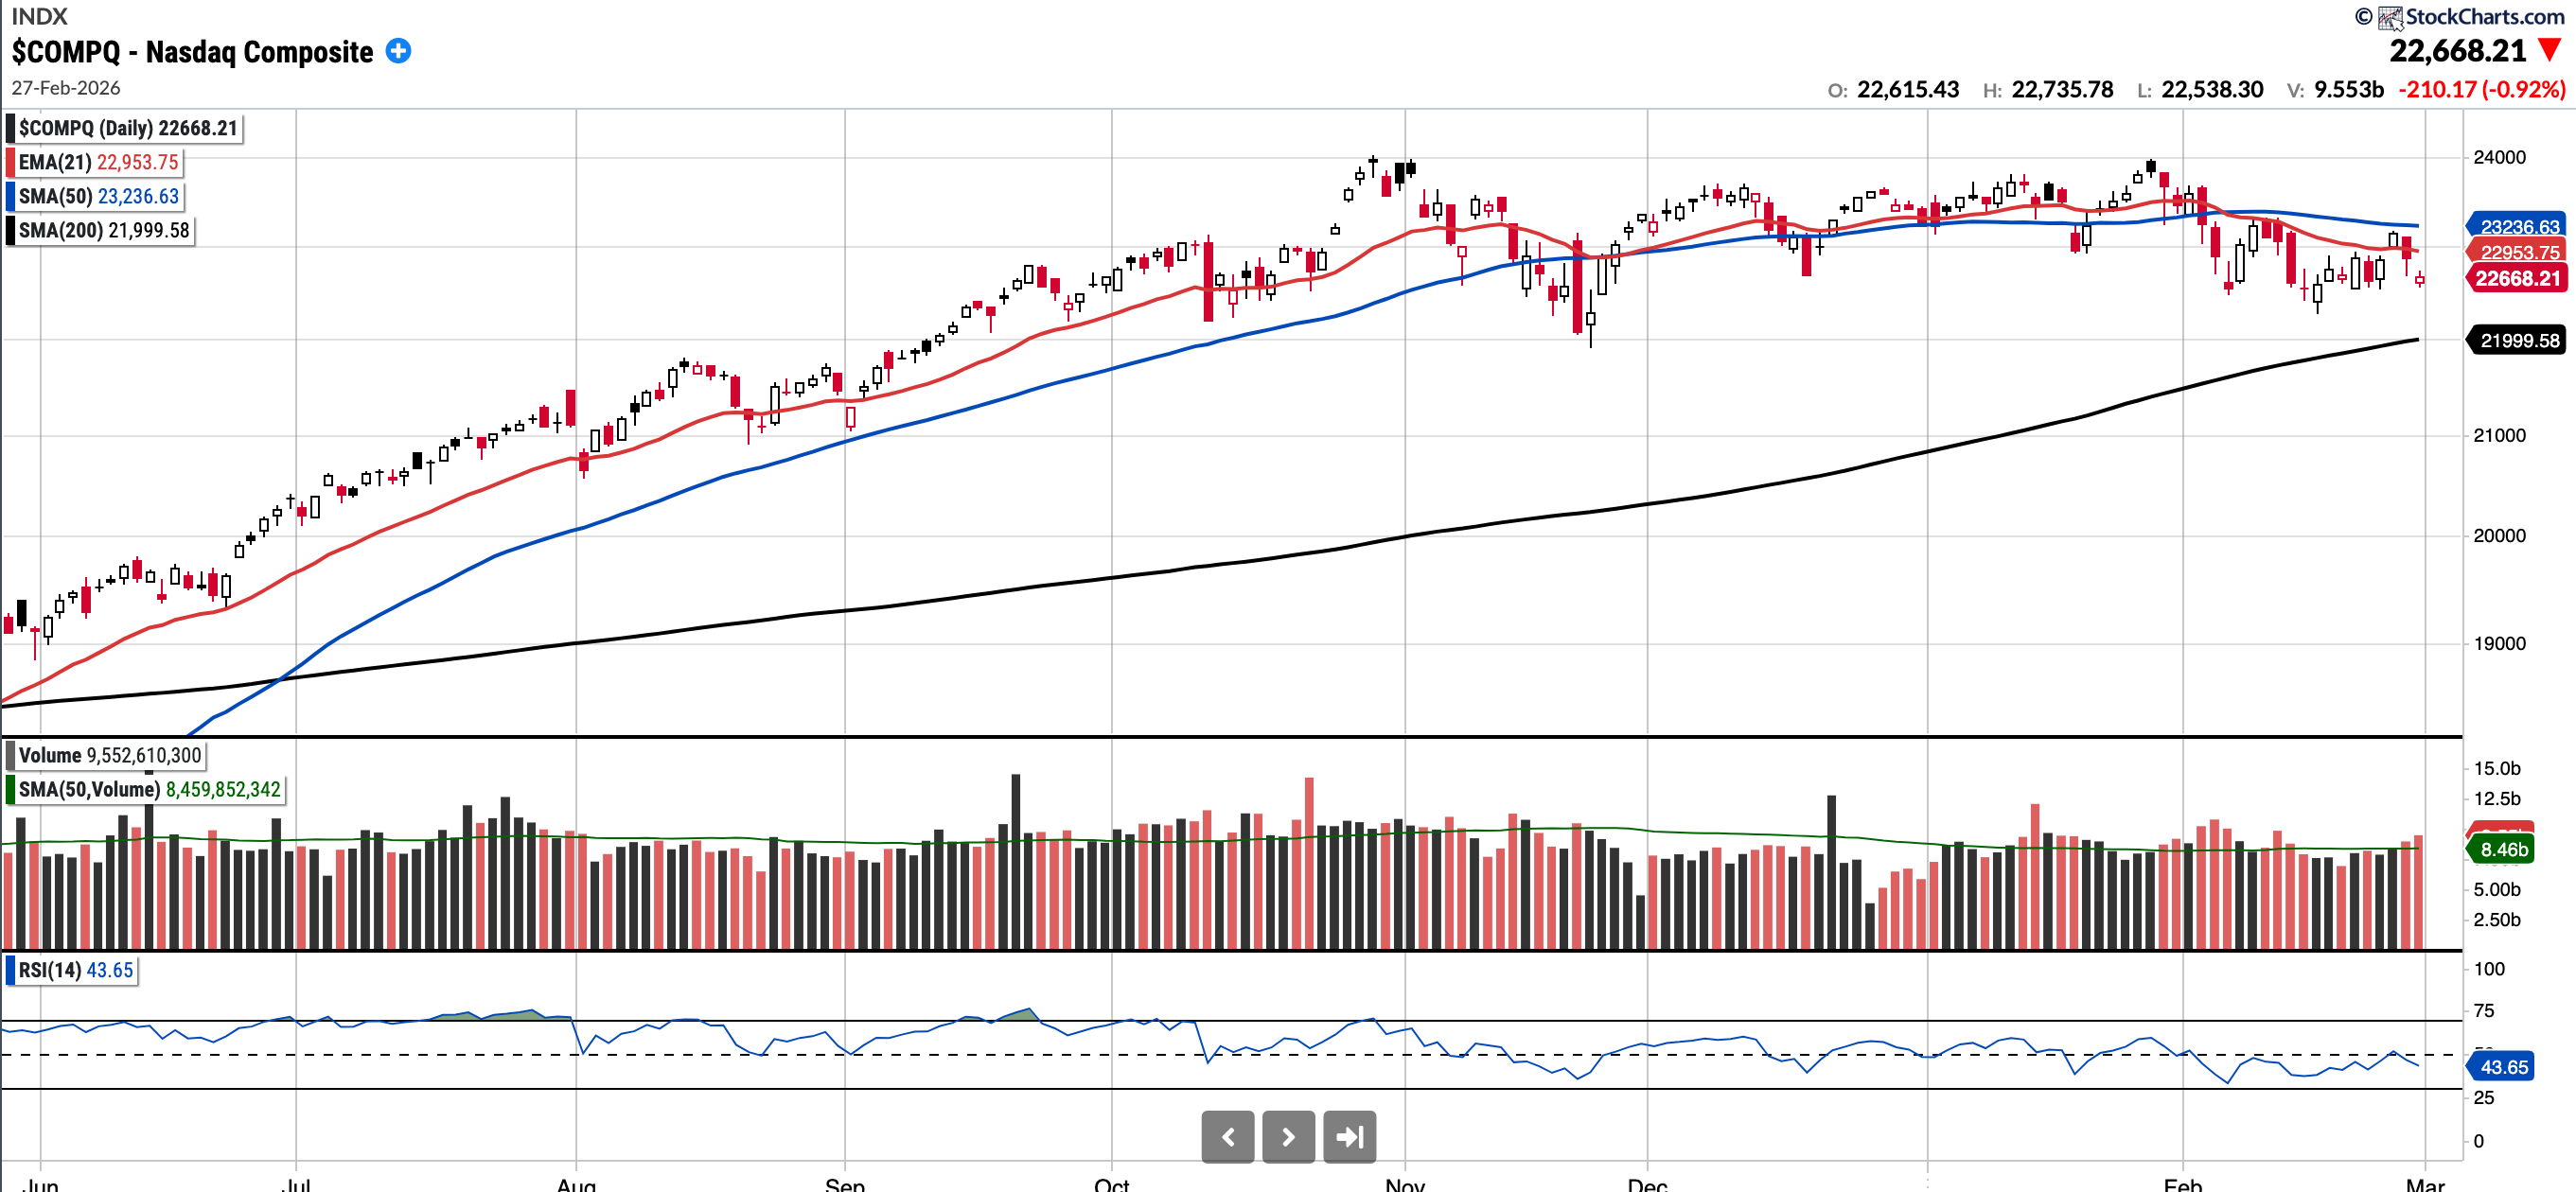
COMPQ
Currently trades at 22,668.21, 2.45% below a declining 50SMA and 3.04% below the 200SMA.
RSI 43.65
-2.44% YTD
Distribution days in the last week: 3
The Nasdaq Composite had a volatile week, with 3 distribution days and closing below both the 21EMA and 50SMA. Not constructive in the slightest and downturn probability remains quite high.
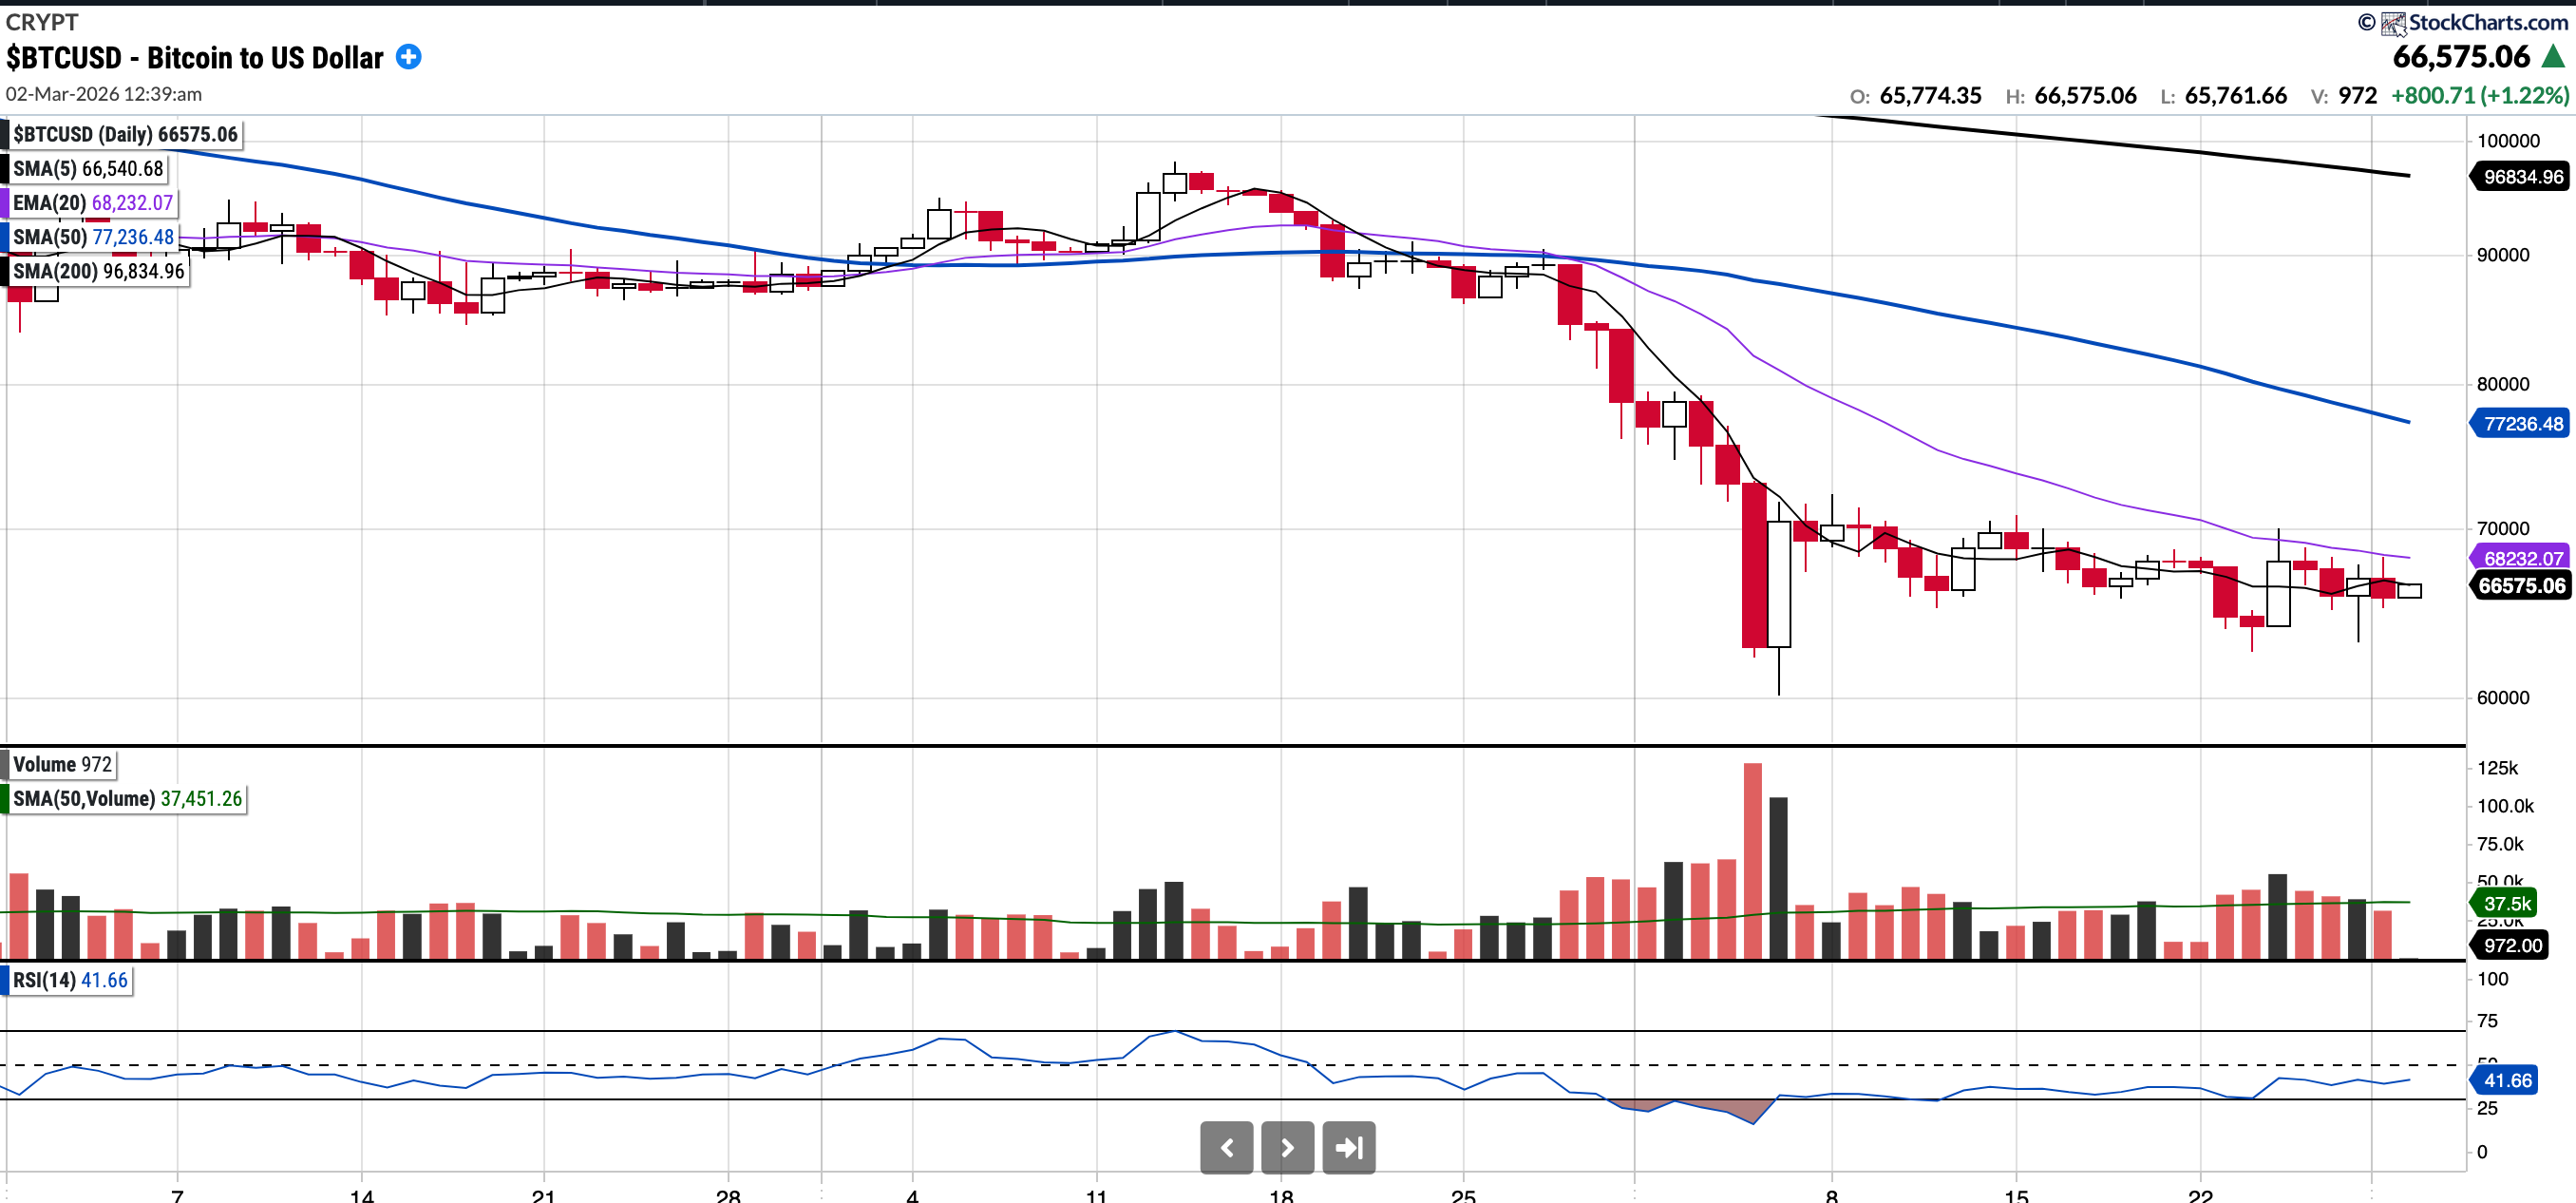
BTC (currently Long)
Currently trades at $67,6226.22, 13.8% below the 50SMA and 31.25% below the 200SMA.
RSI 41.66
-25% YTD.
Since testing the 200 week moving average on Thursday the 5th of February, Bitcoin has traded mostly in the 63-69k range since. Currently, it remains just above the 5 day moving average but significant technical work remains to be done before the chart looks constructive again. In the first instance, I would like to see the EMA 20 held and surpassed, in the process flipping 71k from resistance to support.
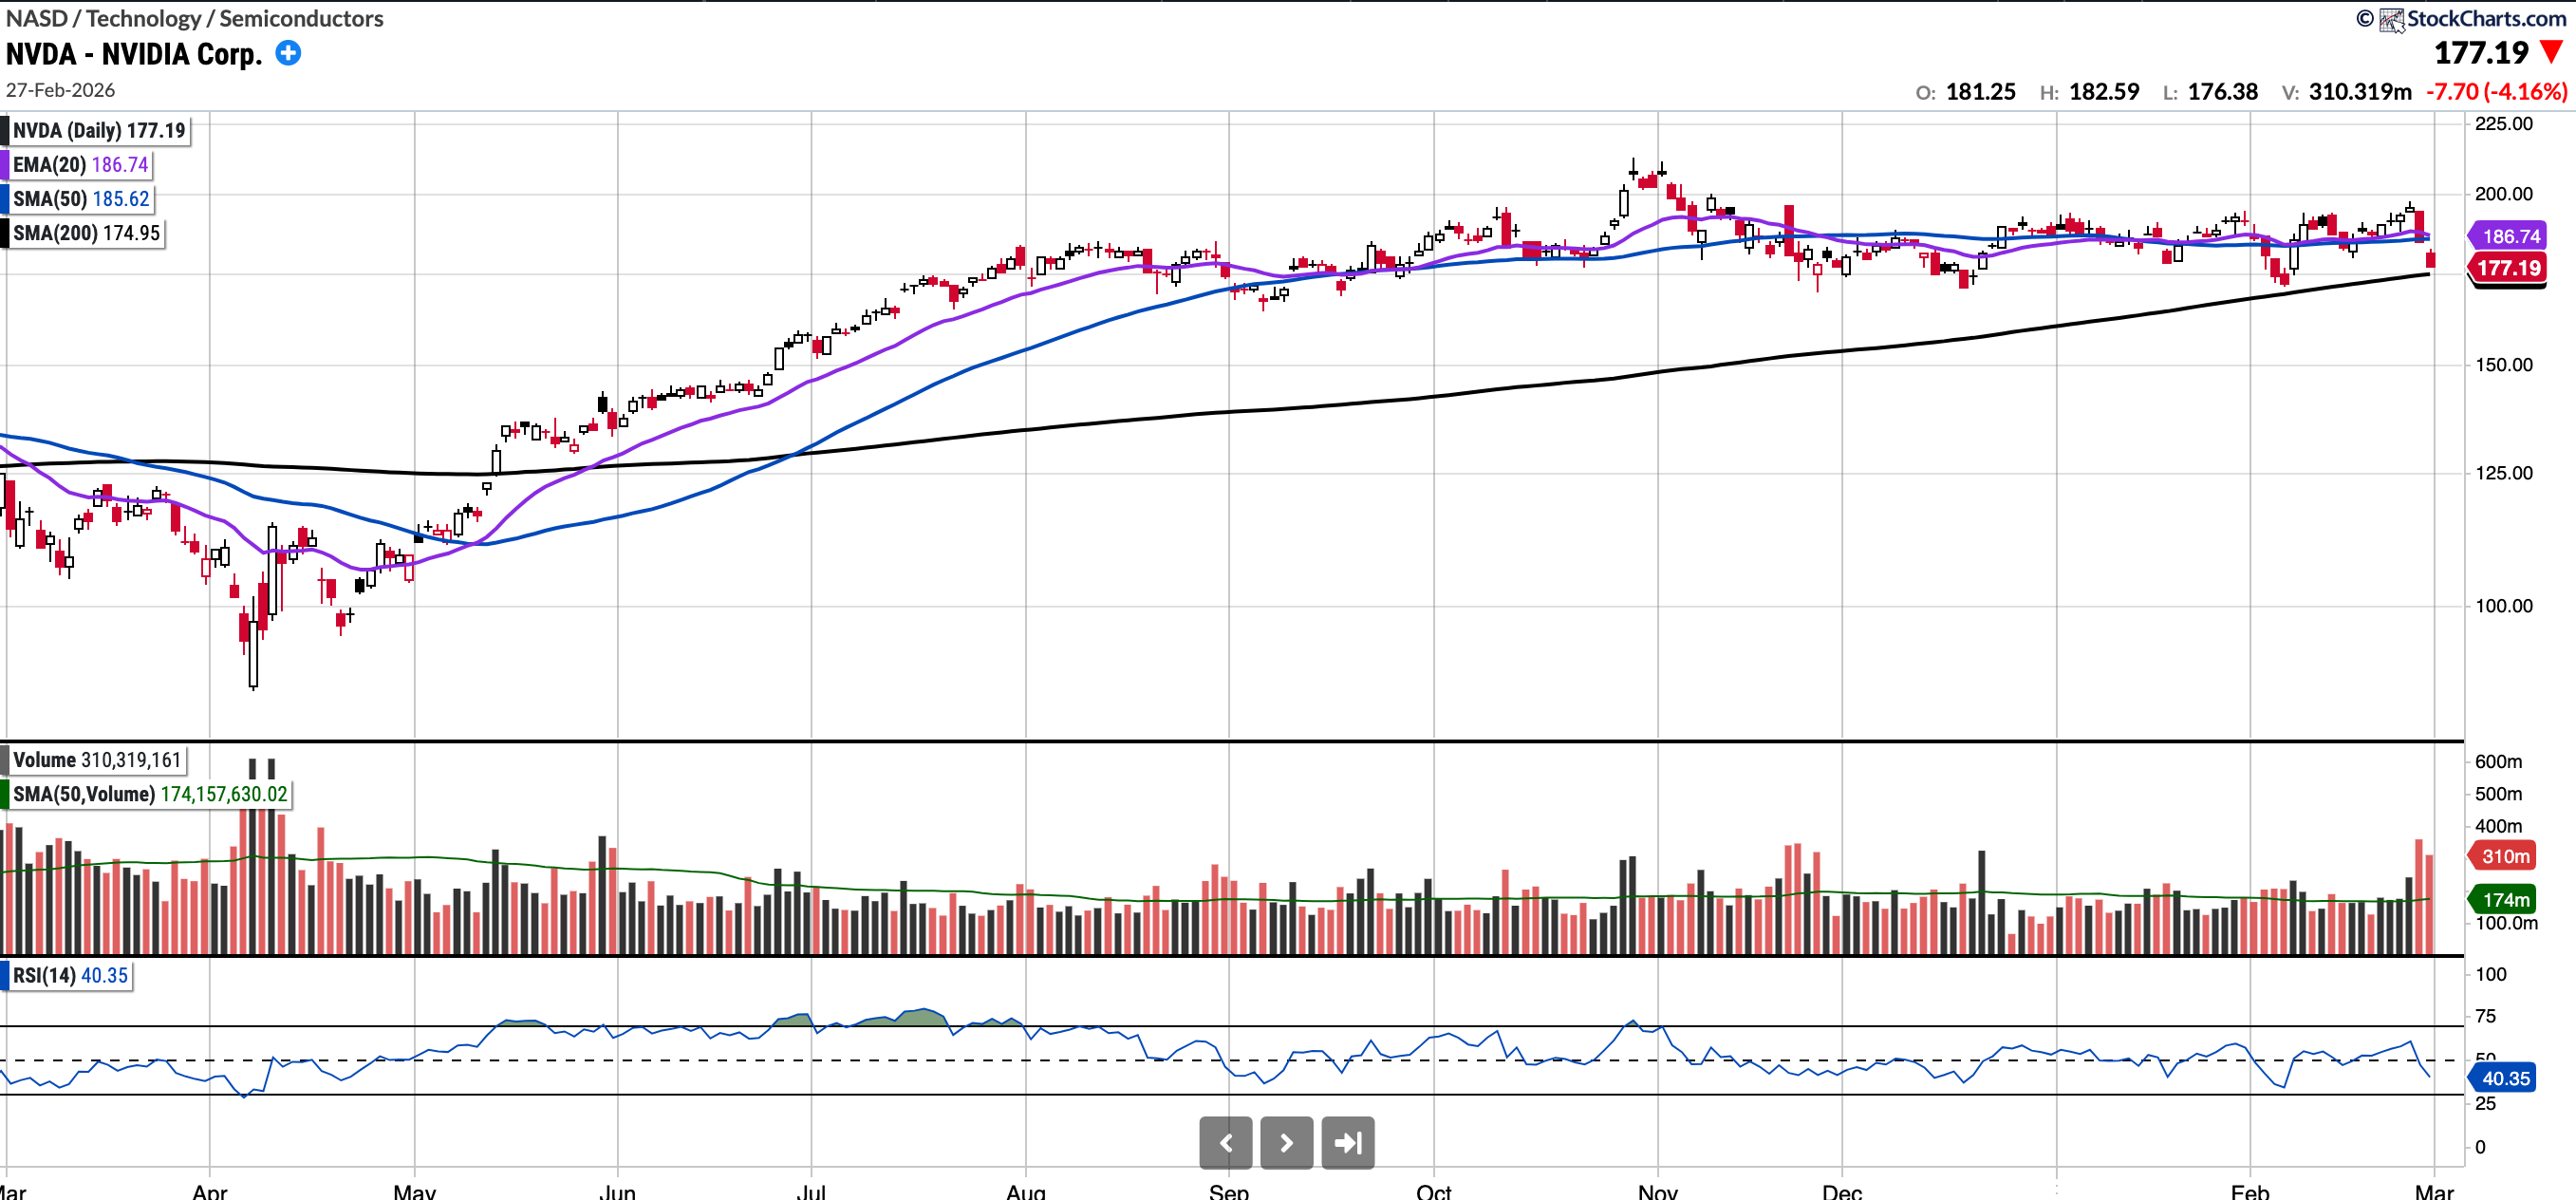
NVDA
Currently trades at $177.19, 4.54% below the 50SMA and 1.28% above the 200SMA.
RSI 32.29
-6.17% YTD.
NVDA has sold off despite very impressive earnings. This could be perceived, on the one hand, as a red flag (selling off on good news) or, conversely, as an opportunity to buy the world's premier company near its 200-day SMA at a below-market multiple. It’s certainly a name for the watchlist. Another thing to consider is it tends to trade favourably into GTC.
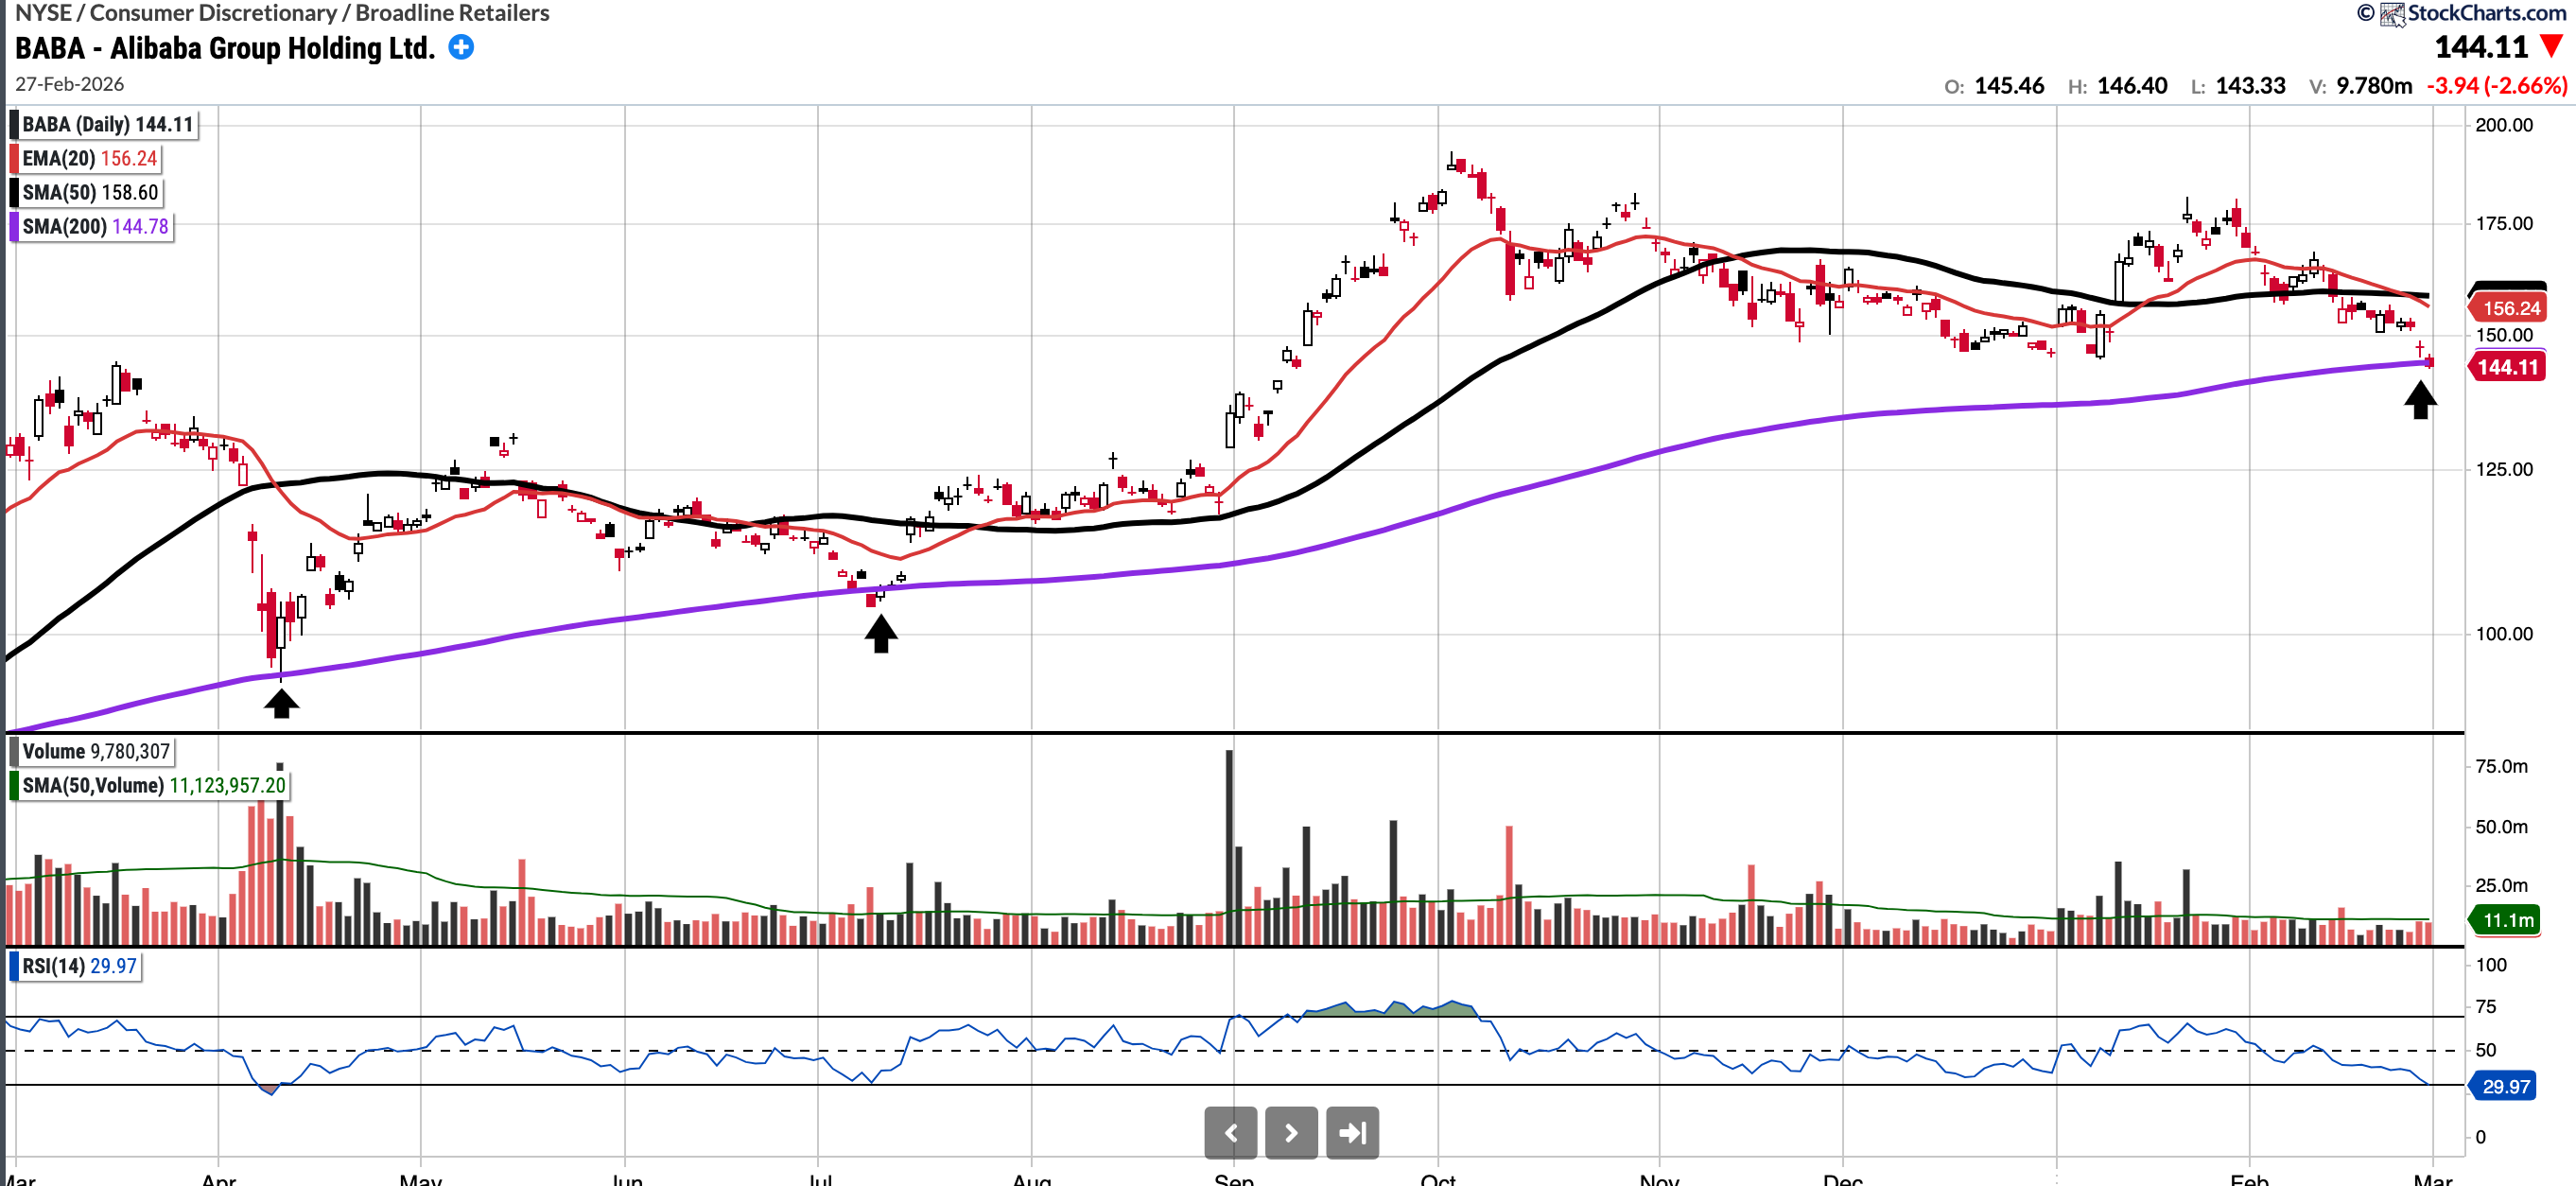
BABA (Currently Long)
Currently trades at $144.11, 9.14% below the 50SMA and 0.53% below the 200SMA.
RSI 32.29
-7.47% YTD.
BABA is back at the SMA 200 for the first time since July 2025. The stock has tended to hold this level and respond favourably previously. However, in the current geopolitical environment it will be interesting to see if this holds. Interestingly in the overnight session it has lost the SMA 200 convincingly. An undercut and rally, a “U&R”, would be the kind of set-up one should look for before getting involved.
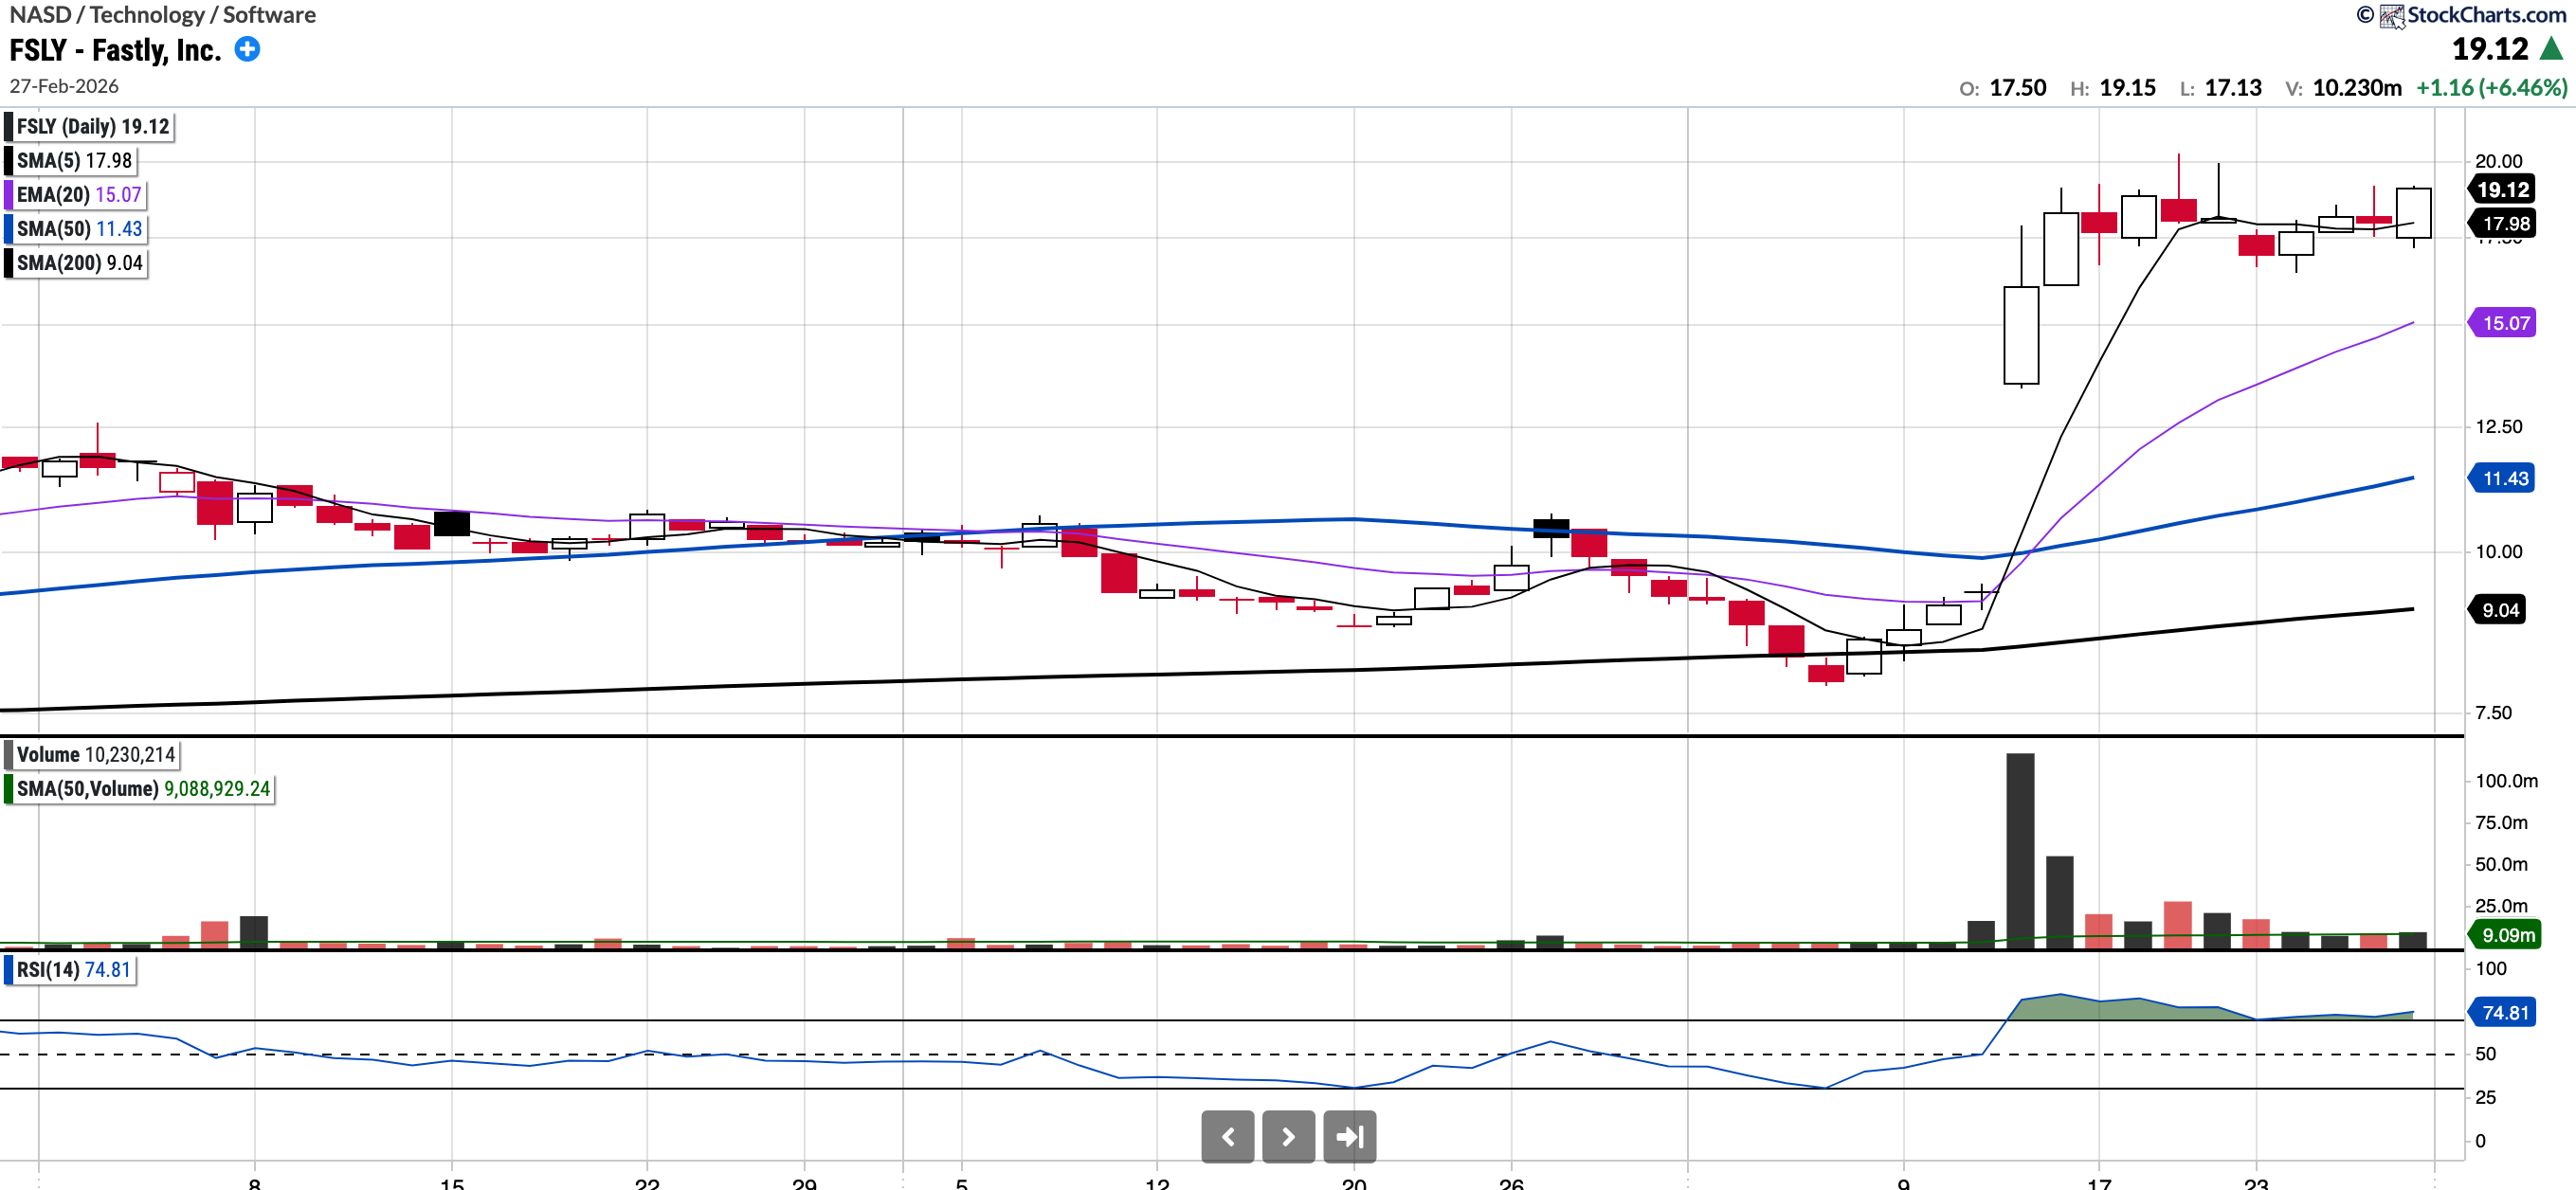
FSLY
Currently trades at $19.12, 67.31% above the 50SMA and 111.44% above the 200SMA.
RSI 74.81
87.63% YTD.
FSLY reported earnings recently beating and raising upon analysts expectations. The stock printed a highest ever volume candle recently and is forming a “high tight flag” like chart pattern. I would like to see it consolidate here but the relative strength it has showed suggest it could be a new leading stock.
Notable portfolio changes in previous week (all updated live in subscriber channels):
