
Preview of the Week Ahead
W/C March 16, 2026

Hope you all are having a good weekend. Below we will be previewing the upcoming week and providing a portfolio update as usual.
Format for what is covered in this weekly preview:
A look at the indices
Key upcoming economic events
Upcoming earnings reports
Charts
Notable portfolio changes from the previous week
Current Portfolio Holdings (Position size, cost basis, and commentary on each holding regarding the intended holding period and any planned activity)
Closing Thoughts
I recommend checking out the latest Monthly Portfolio and Performance Update below:

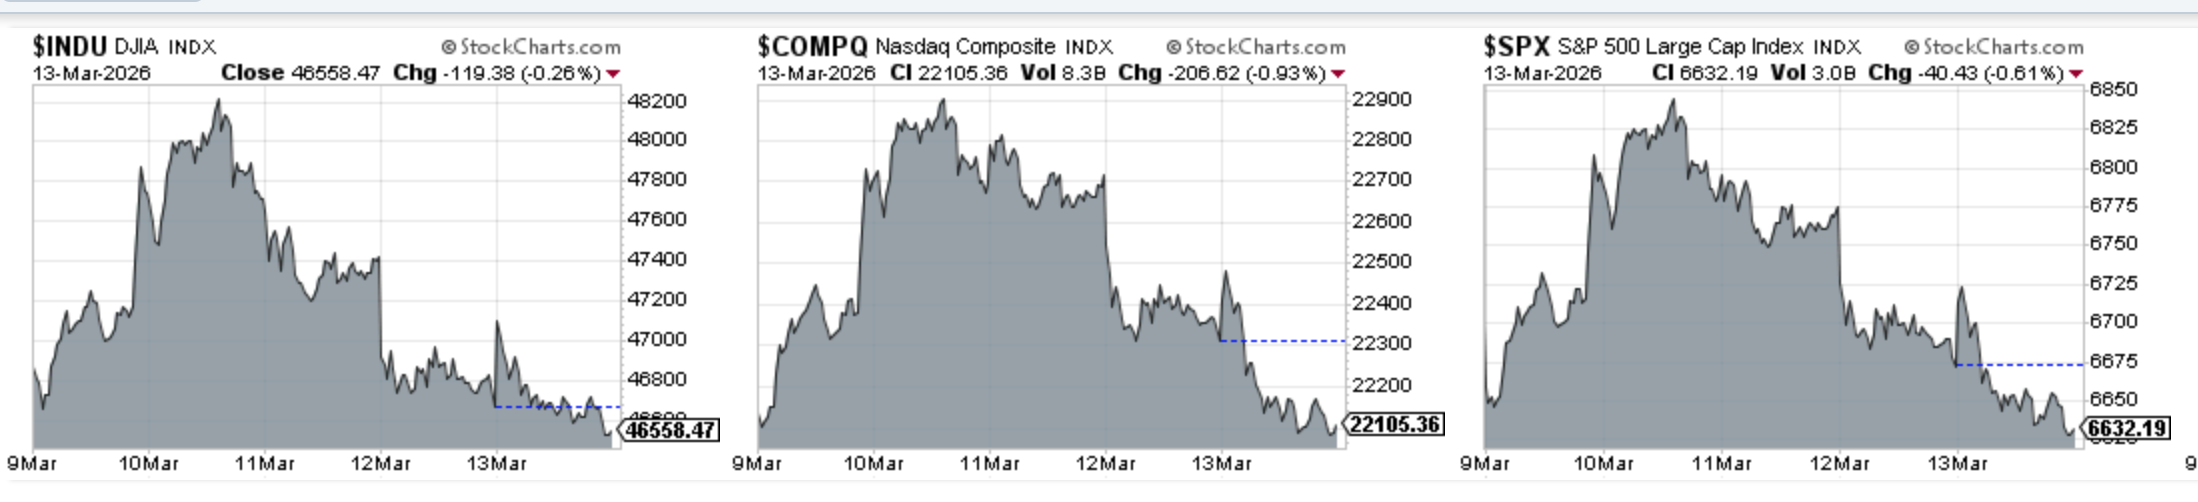
Indices
Dow Jones declined 0.8% in the last week
S&P 500 declined 0.64% in the last week
Nasdaq Composite declined 0.47% in the last week
IWM declined 0.35% in the last week
Key upcoming economic events
Monday, March 16
NY Empire State Manufacturing Index:
A regional look at factory activity in New York; expectations lean toward a softening trend.
Industrial Production (February):
Expected to rise roughly 0.2% to 0.3%, reflecting the resilience of the manufacturing sector.
Capacity Utilisation (February):
Forecasted at approximately 76.5%, providing insight into how much slack remains in the economy.
Tuesday, March 17
Retail Sales (February):
Measure of consumer spending; analysts are watching for signs of how high energy prices are impacting discretionary budgets.
FOMC Meeting (Day 1):
The FOMC begins its two-day meeting.
Wednesday, March 18
Producer Price Index (PPI) for February:
Released at 8:30 AM ET. Forecasts suggest a M/M increase of 0.3%.
Federal Reserve Rate Decision:
Release at 2:00 PM ET. Expected to hold the target range steady at 3.50% to 3.75%.
Summary of Economic Projections (SEP):
The “Dot Plot,” this will reveal officials’ updated forecasts for inflation, unemployment, and the path of future rate cuts.
Jerome Powell Press Conference:
Beginning at 2:30 PM ET.
Thursday, March 19
Initial Jobless Claims:
For the week ending March 14; forecasted to remain rangebound around 213k–215k.
Philadelphia Fed Manufacturing Index:
Another regional indicator; expected to dip slightly as borrowing costs remain elevated.
New Home Sales (January):
Market watchers are looking for stability in the housing market, though activity is expected to remain subdued.
Friday, March 20
Existing Home Sales (February)
Employer Costs for Employee Compensation:
A quarterly look at what businesses are paying for labor, including benefits, which feeds into long-term inflation outlooks.
Upcoming Earnings
The schedule for this week is below. this week is again a busy one. I have two portfolio companies reporting. Below is the infographic by Earnings Whispers:

Charts
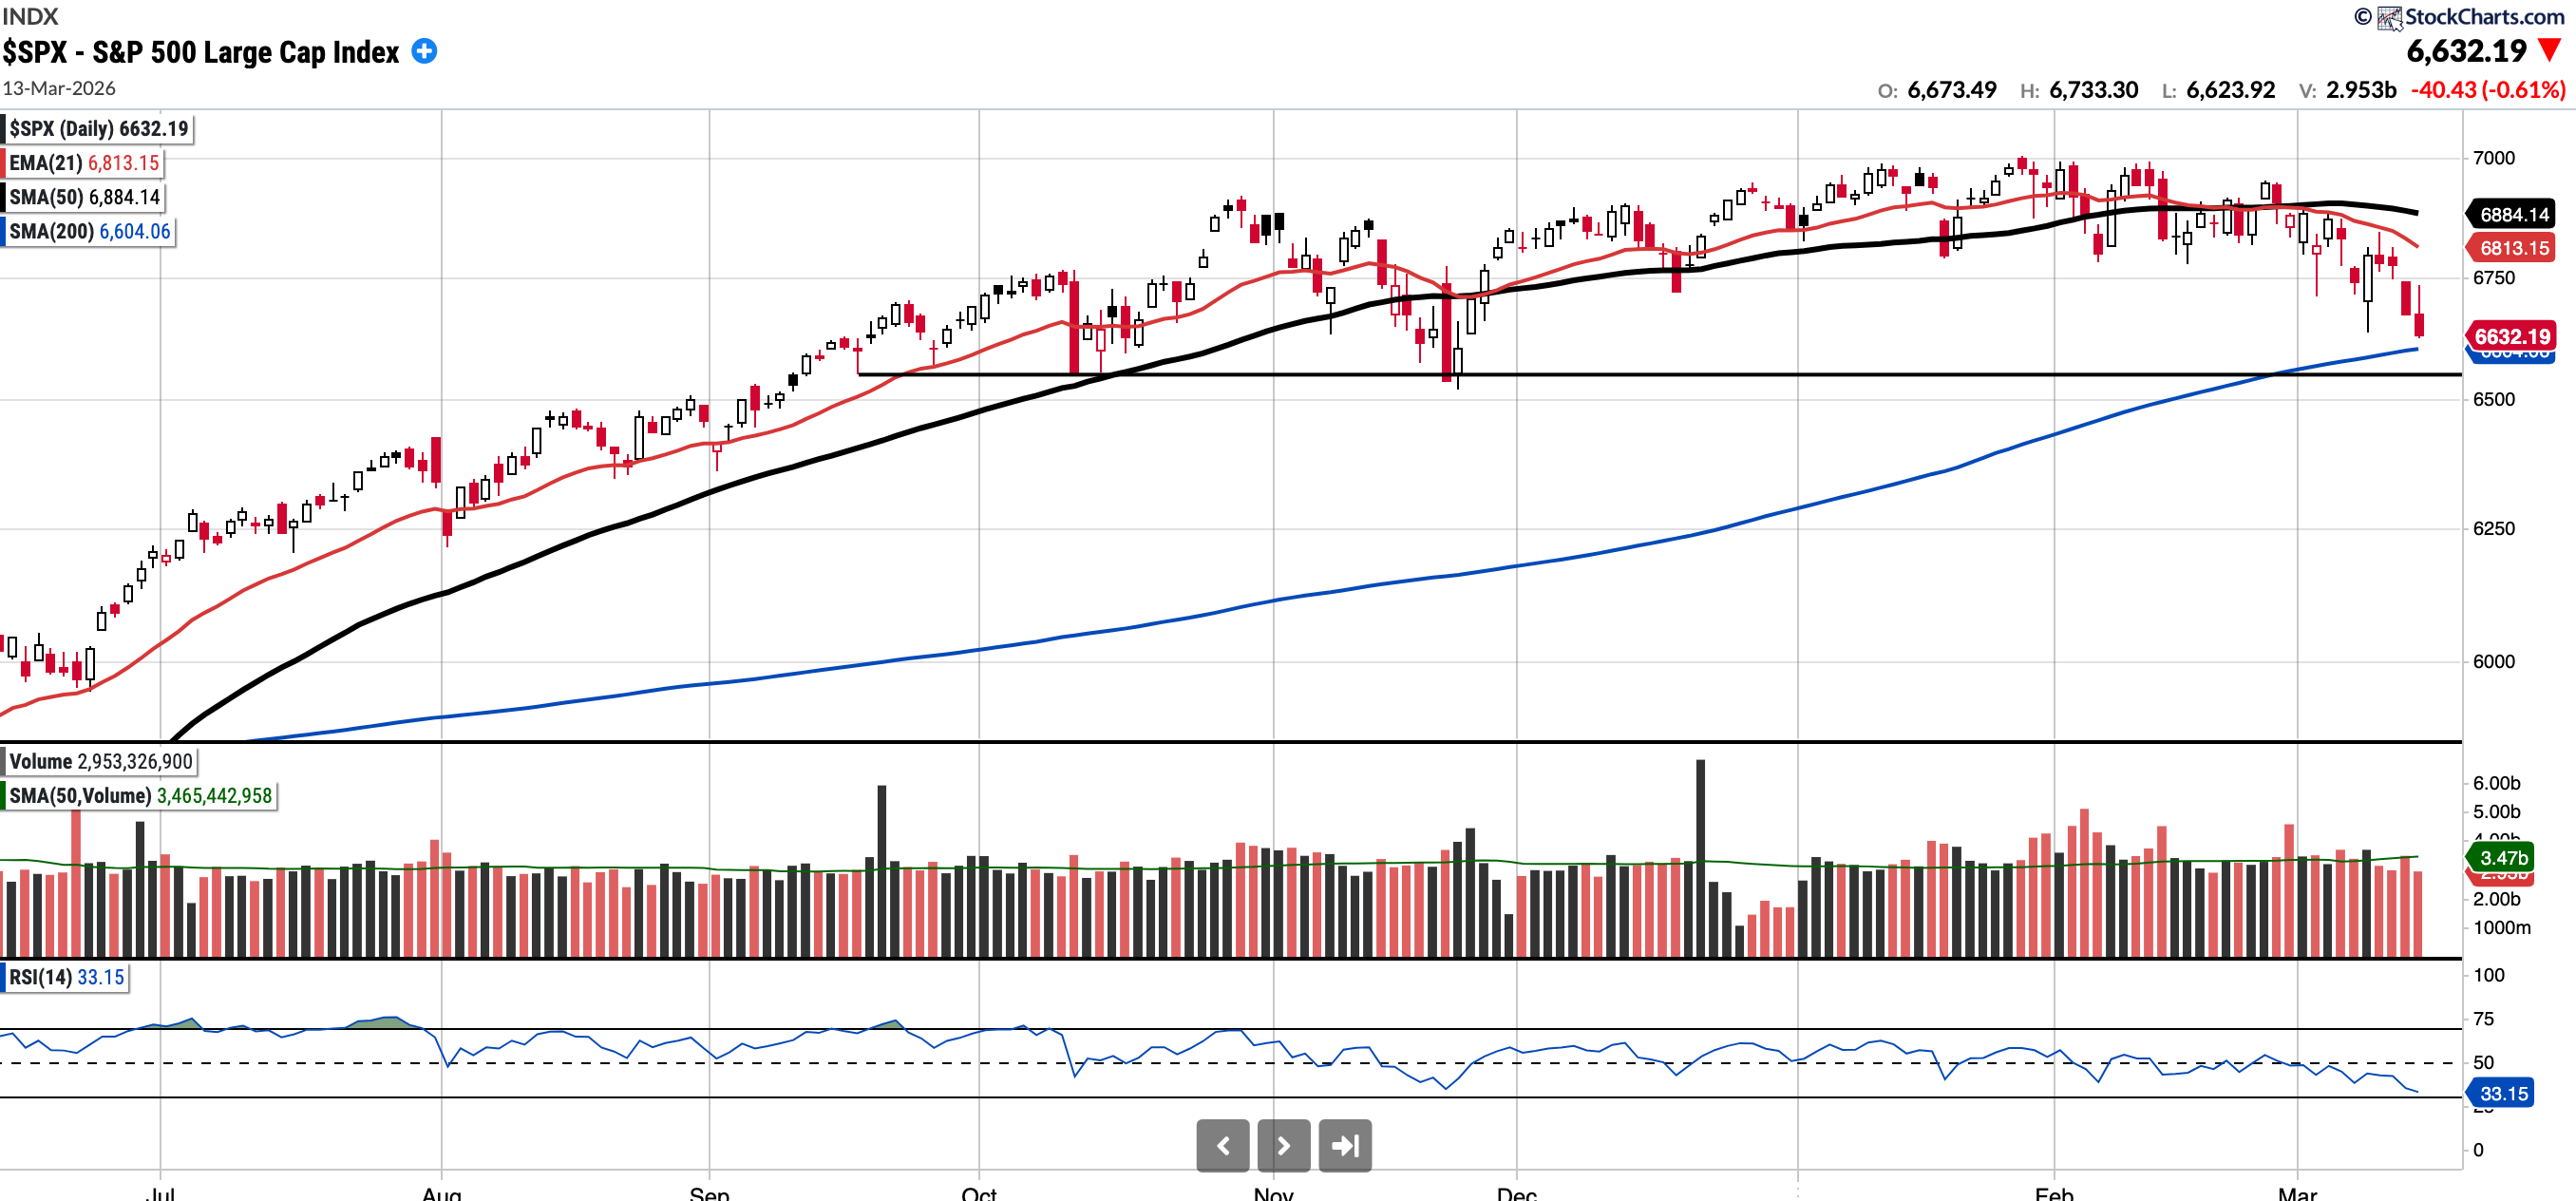
SPX
Currently trades at 6,632.19, 3.66% below the 50SMA and 0.43% above the 200SMA.
RSI 33.15
-3.3% YTD
Distribution days in the last week: 1
There was one distribution day this week though three sessions in total where the index was down more than 0.2%. The SPX remains firmly below both the 21-day EMA and 50-day SMA.
I suspect we will retest the 6550–6580 level, likely as soon as Monday, which represents the Oct/Nov support and the 200-day SMA. For bulls, this is a very important level to hold.
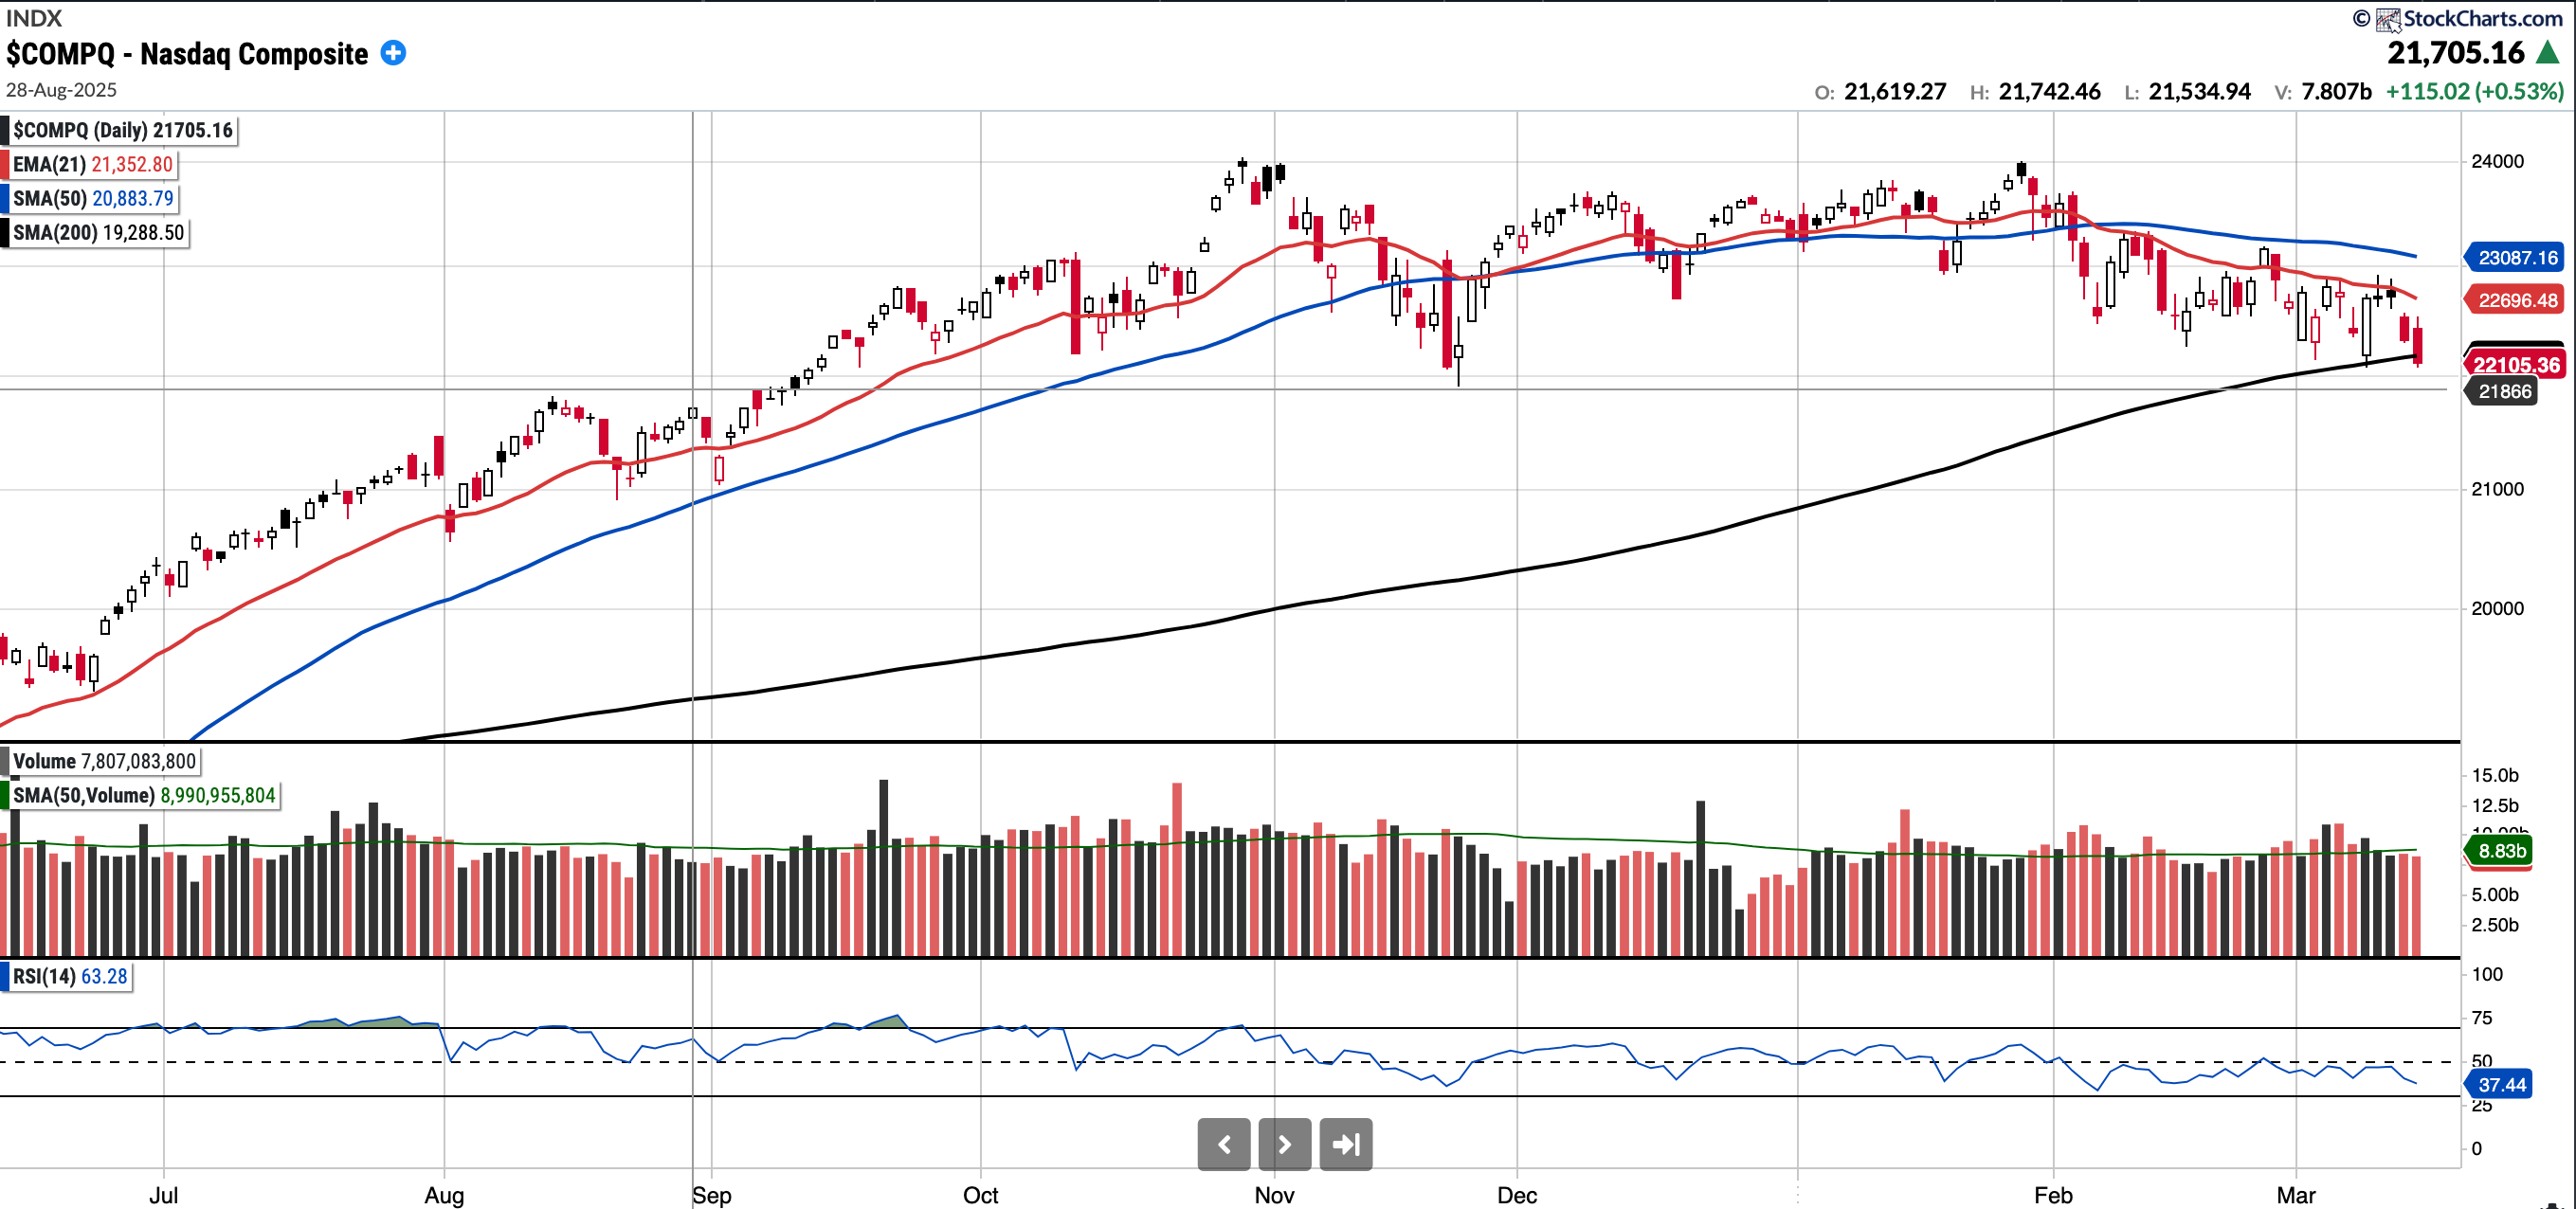
COMPQ
Currently trades at 22,105.36, 4.25% below a declining 50SMA and 0.32% below the 200SMA.
RSI 37.44
-4.86% YTD
Distribution days in the last week: 1
The Nasdaq Composite had a volatile week, with one distribution day (but two days down 0.9% or more), and it remains below both the 21-day EMA and 50-day SMA.
Last week I stated this is "not constructive in the slightest and downturn probability remains quite high. The 200-day SMA is also within touching distance below."
We are now below the 200-day SMA, and the next level of note is 21,850, which served as the November low and also the August high. Bulls would want this level to hold and for the 200-day SMA to be reclaimed. Caution is advised.
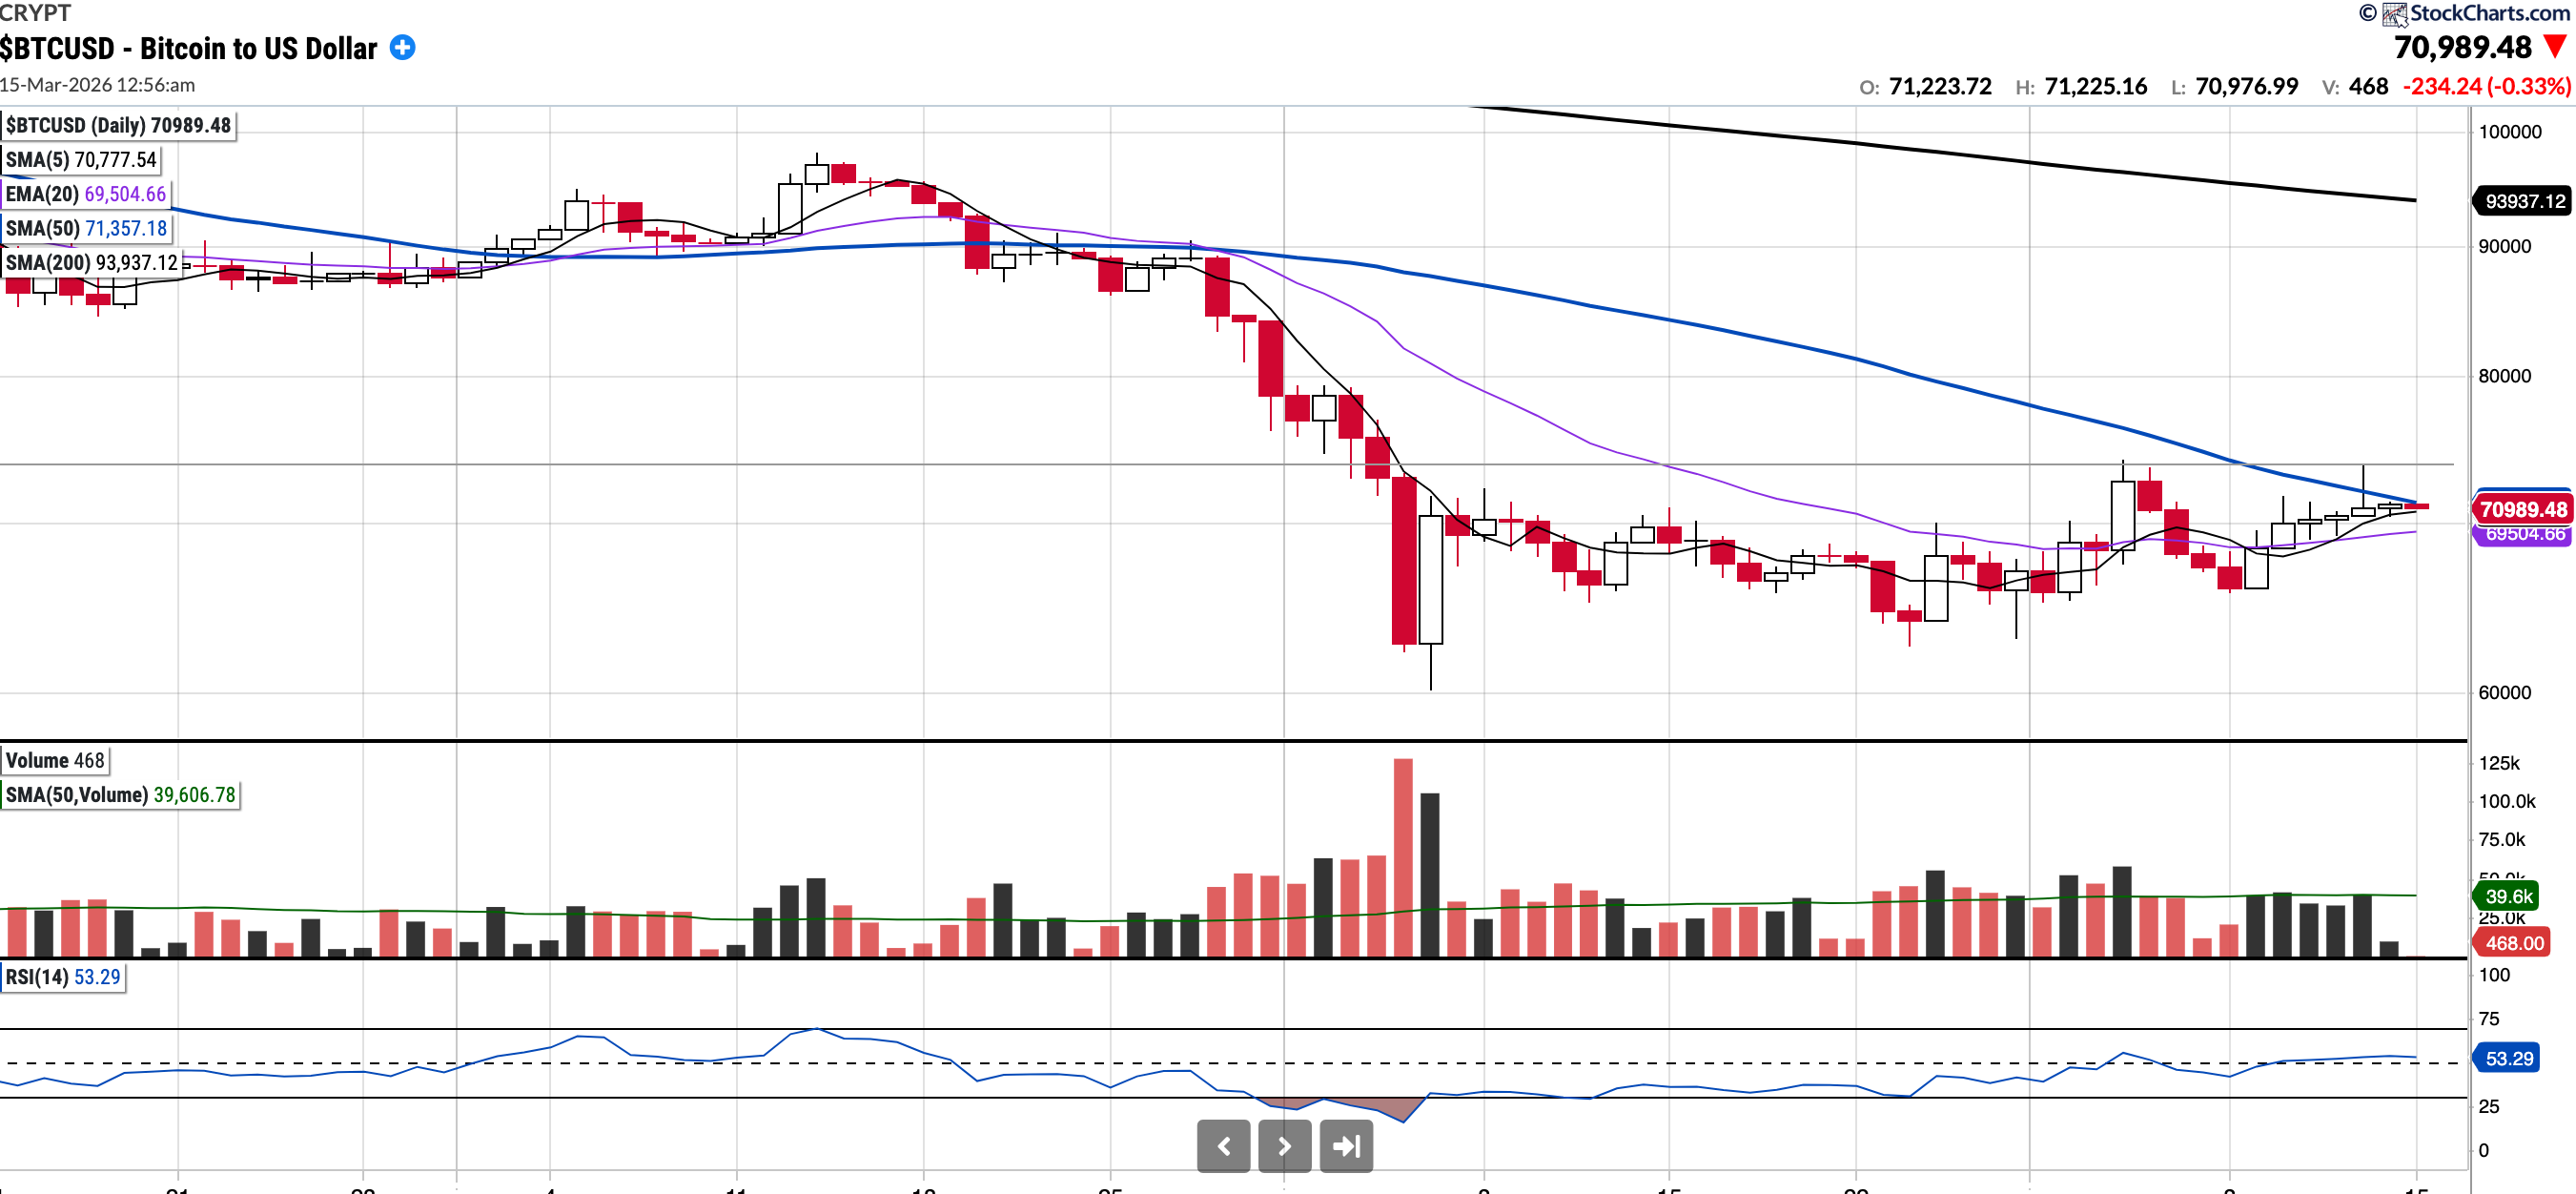
BTC (currently Long)
Currently trades at $70.989, 0.52% below the 50SMA and 24.43% below the 200SMA.
RSI 53.37
-20% YTD.
Since testing the 200-week moving average on Thursday, February 5th, Bitcoin has traded primarily within the $63,000–$70,000 range. Last week, and again on Friday this week, it broke out of that range to momentarily trade as high as $74,000. That seems like an important resistance level for now.
We remain in a position where significant technical work is required before the chart looks constructive. In the first instance, however, the 5-day EMA has crossed above the 20-day EMA. I would like to see the 20-day EMA held and surpassed now, with the $71,000 level flipping from resistance to support in the process.
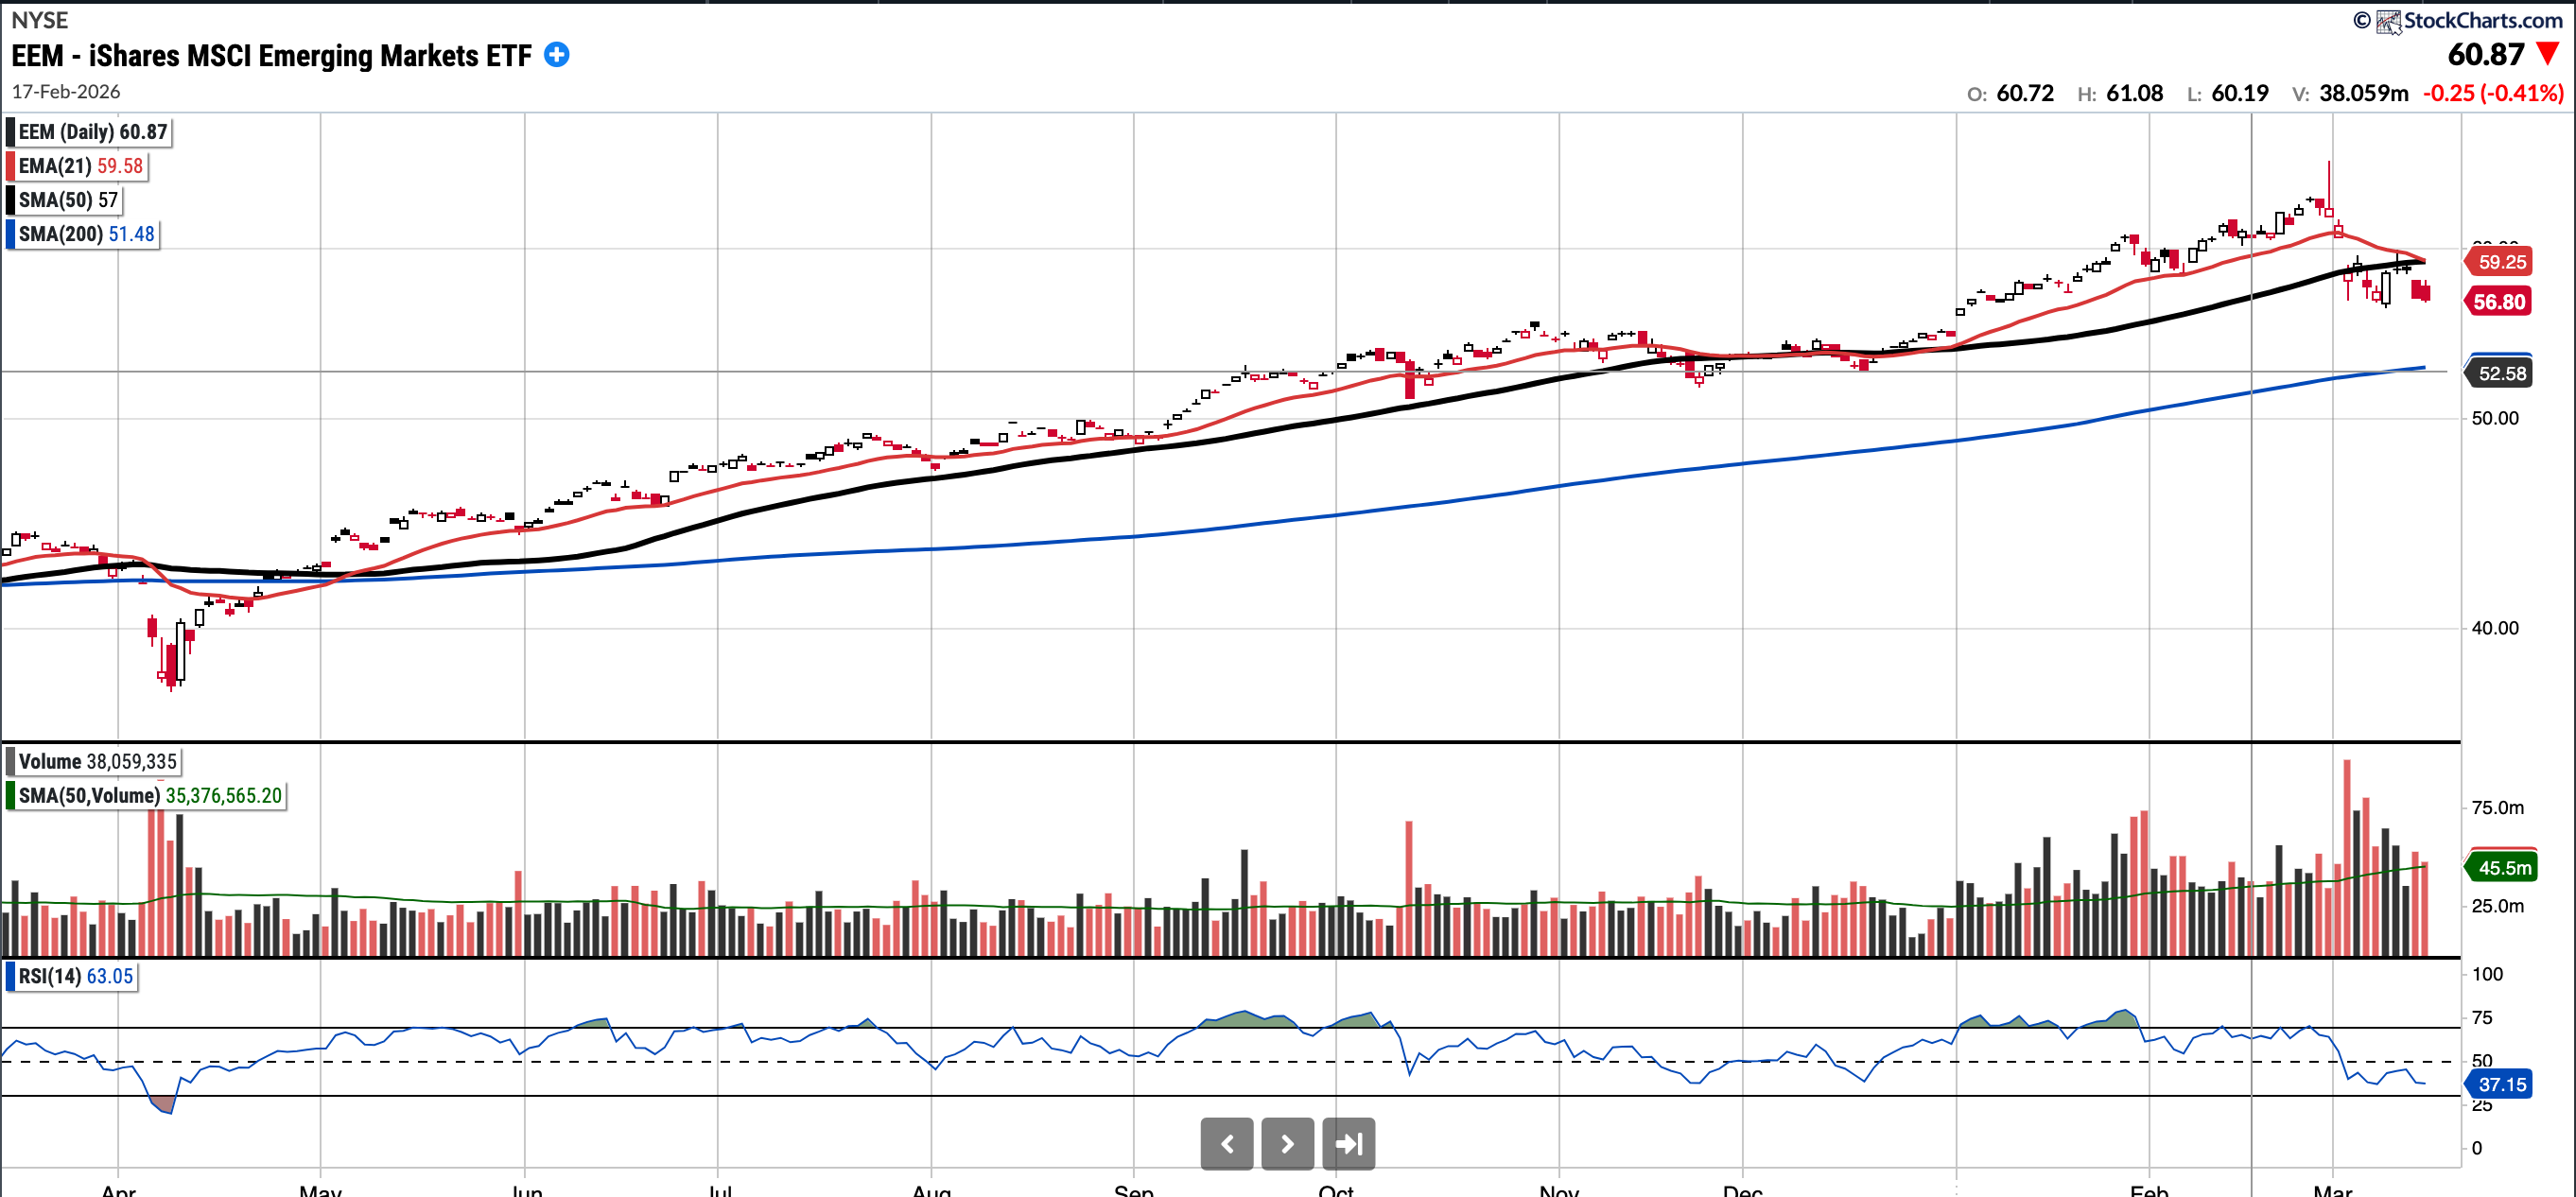
EEM
Currently trades at $56.8, 4.09% below the 50SMA and 7.42% above the 200SMA
RSI 37.15
1.00% YTD
$EEM has been outperforming the U.S. indices comfortably year-to-date, but it has pulled back sharply over the last couple of weeks amid events in the Middle East. It remains in an uptrend; however, the levels to watch for pullback buys are $55.00 and, below that, the ascending 200-day SMA at $52.58. I suspect these levels may be tested in the coming weeks.
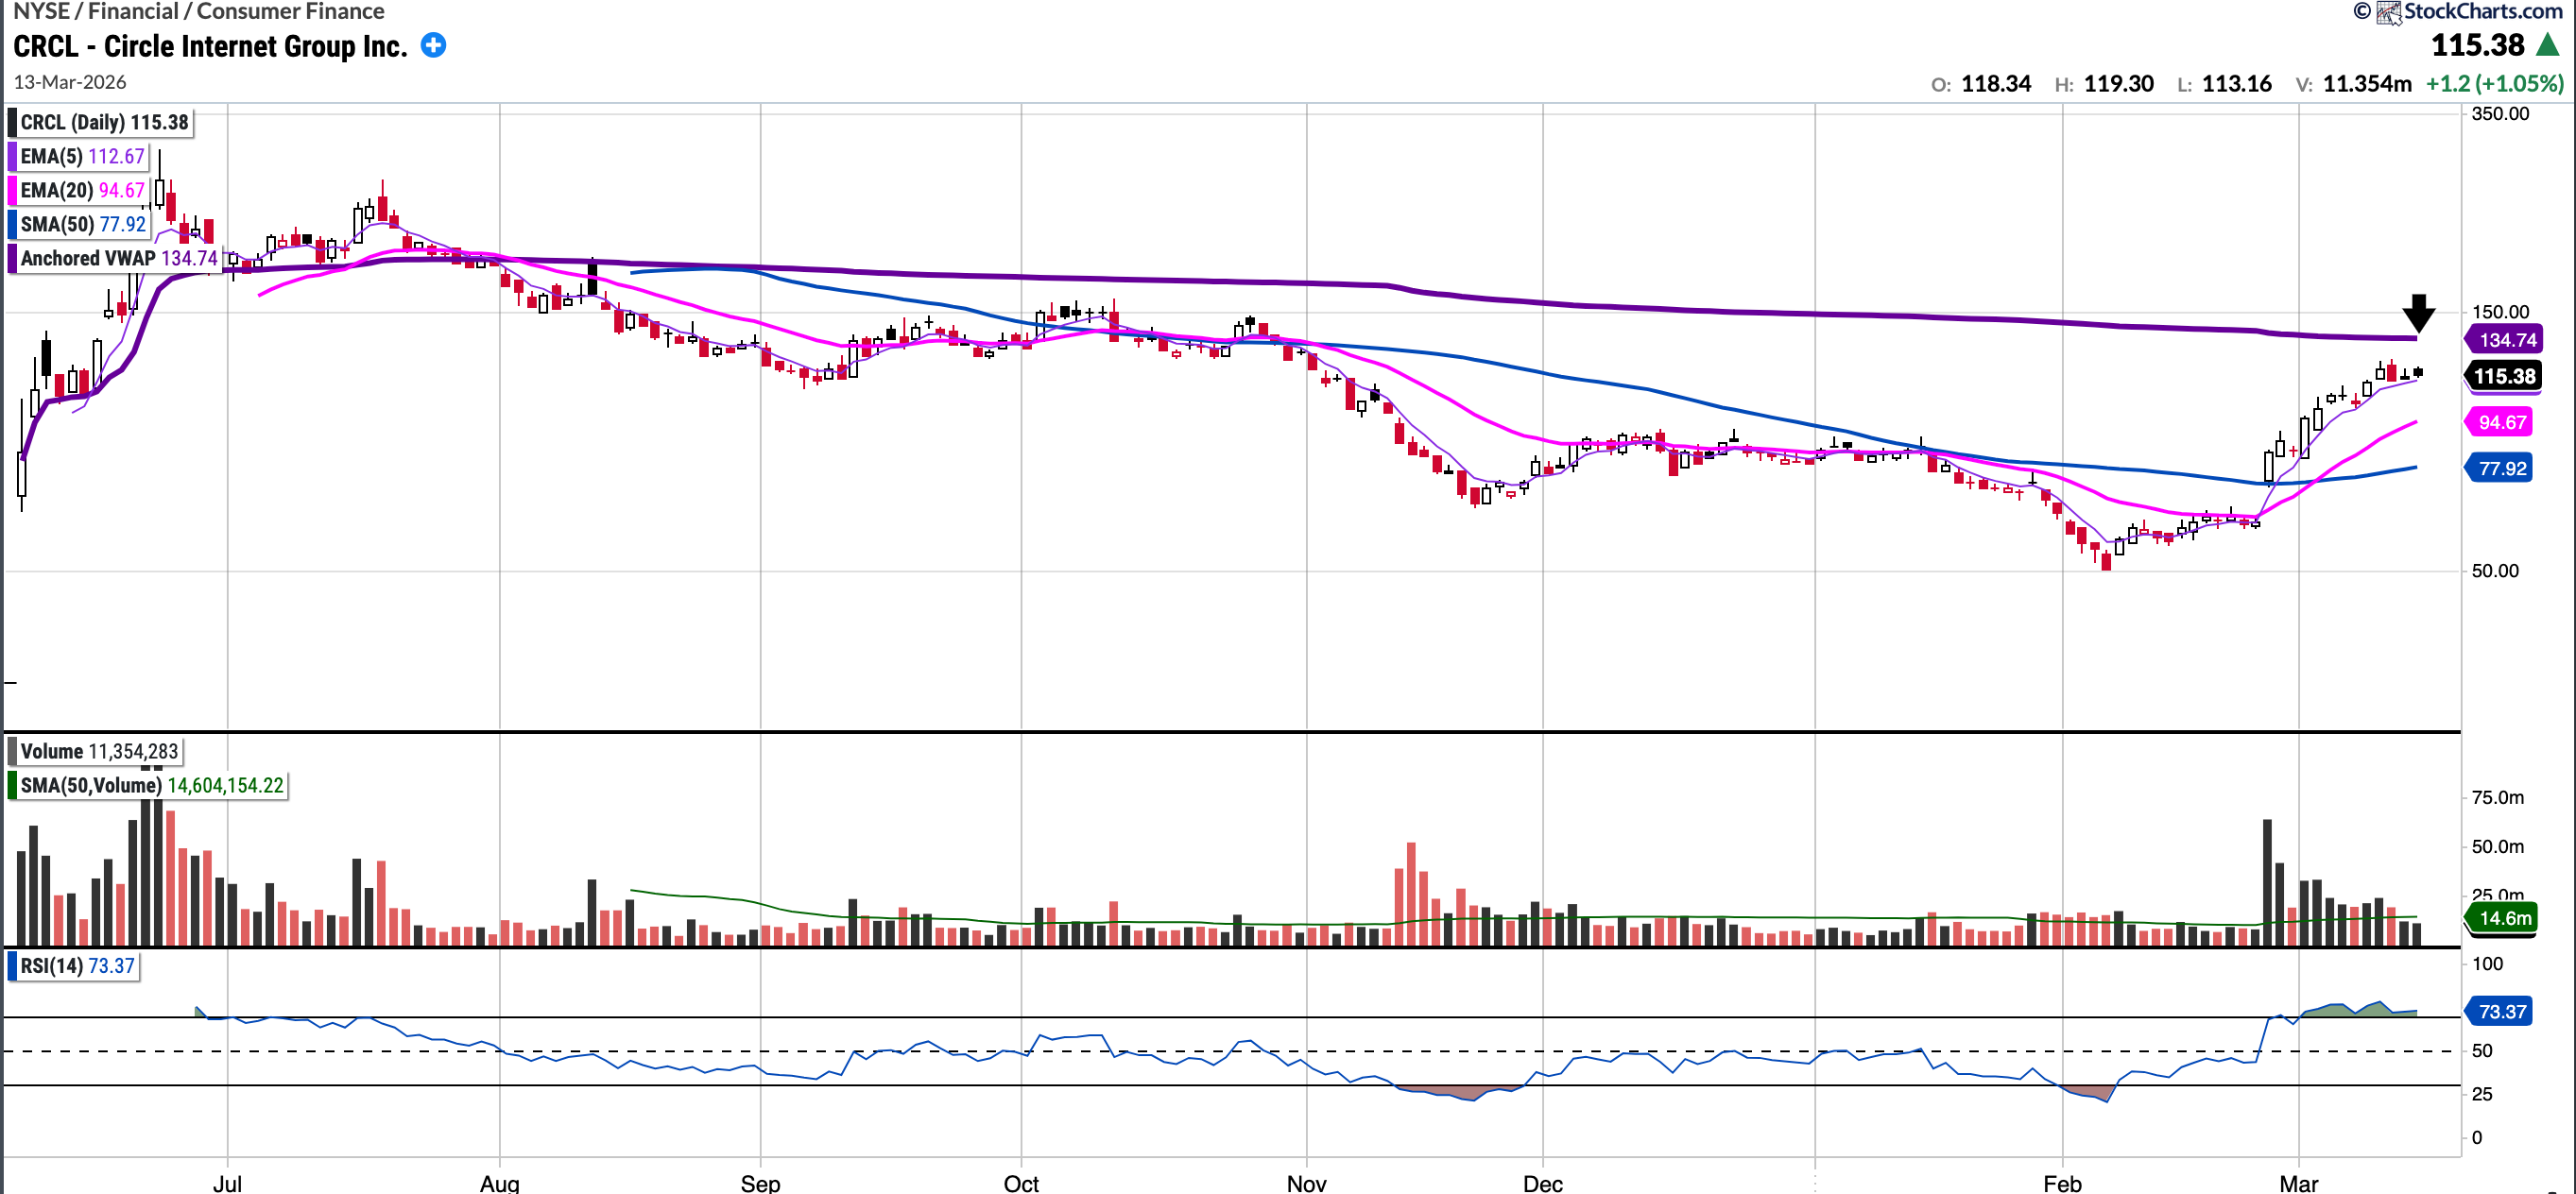
CRCL
Currently trades at $115.38, 48.07% above the 50SMA
RSI 73.37
38.23% YTD
$CRCL has surged ~90% over the past month, demonstrating tremendous strength despite broader market weakness. In my view, the stock is being recognised as a beneficiary of the current inflationary environment (as rate cuts are negative for Circle’s business model), a potential pure play on ‘agentic money’ and is being rewarded for its impressive earnings beats.
The stock is currently trading above all key moving averages and has been riding the 5SMA on it’s recent rise.The $135 level, which represents the AVWAP from its IPO, will be a significant technical level that may act as resistance.
While I like $CRCL, I do also have a position in COIN. A pullback to the mid 90’s would likely present an interesting entry point.
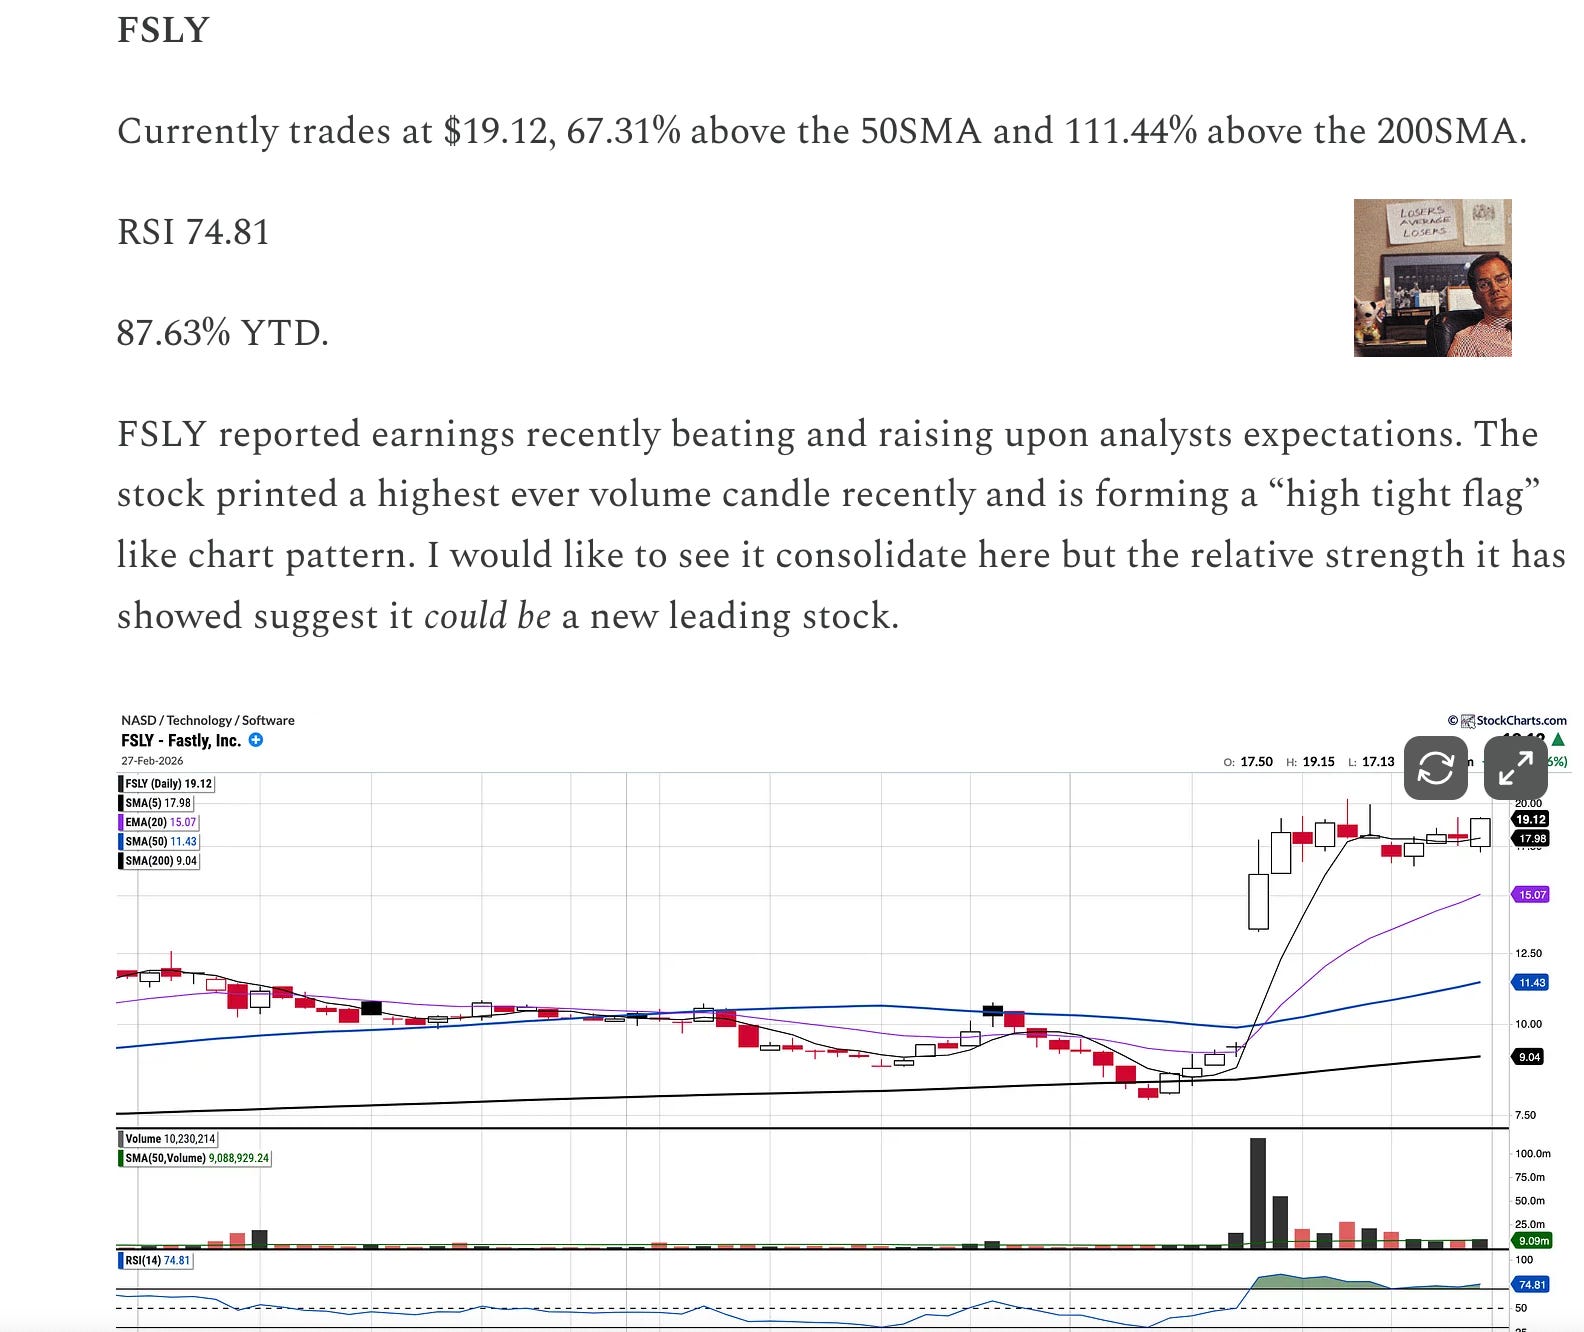
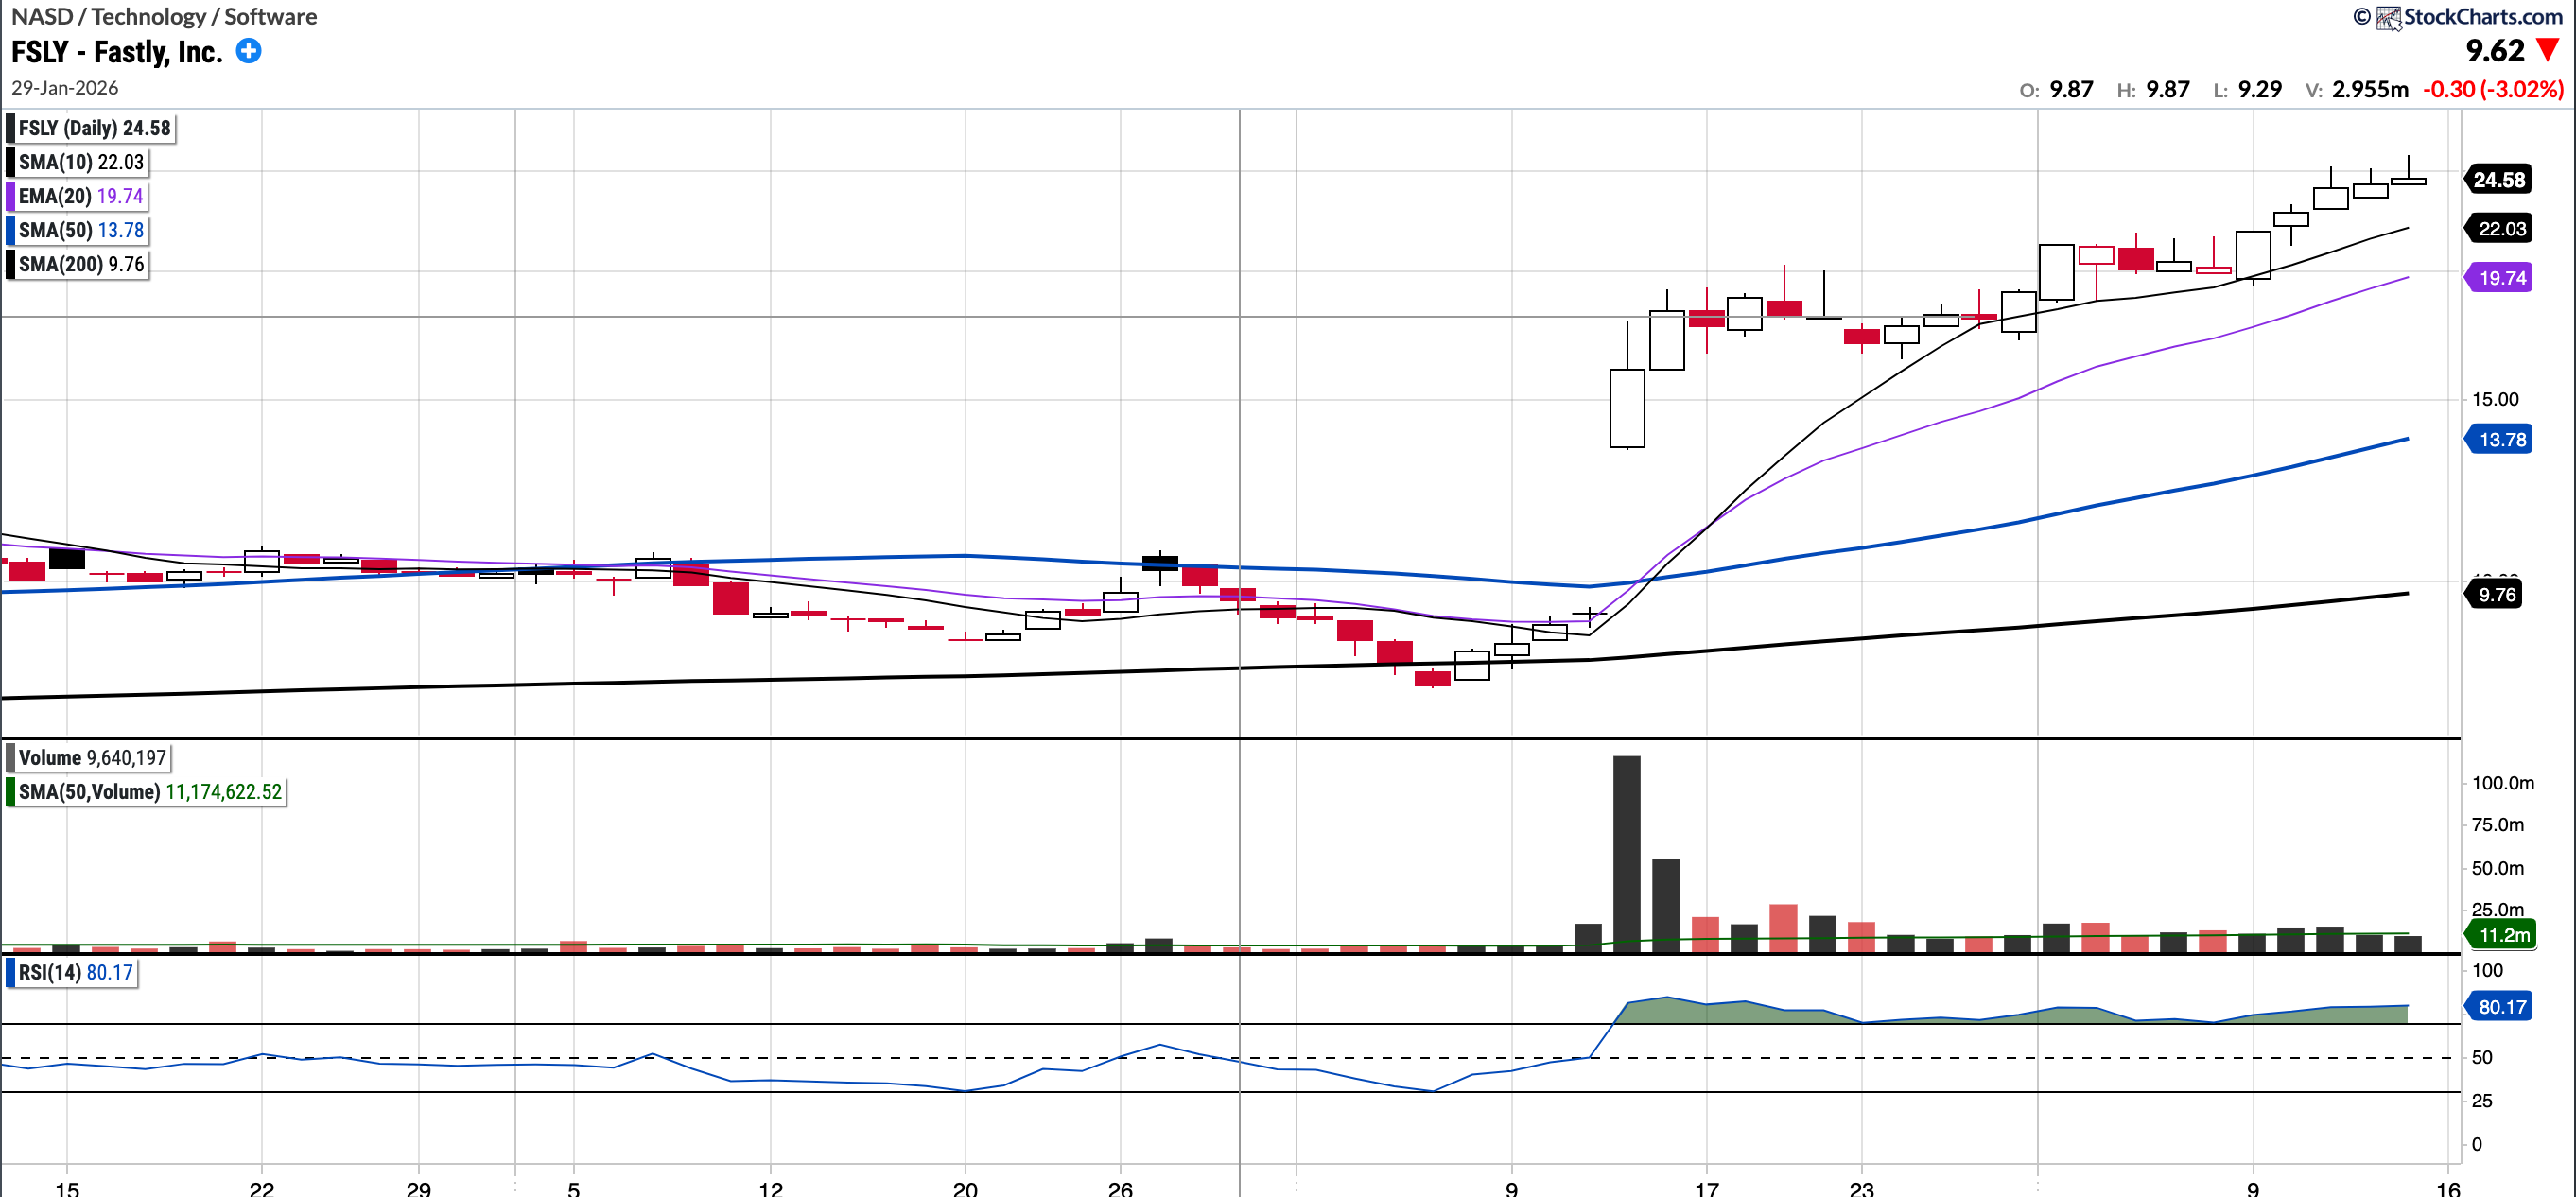
FSLY
Currently trades at $24.58, 78.43% above the 50SMA and 151.9% above the 200SMA.
RSI 74.81
141.22% YTD.
I featured FSLY a couple of weeks ago (see below), and it is up >35% since then. I ultimately did not get positioned. On reflection, when it did offer an opportunity, such as a pullback to the 5-day moving average, other names were also down, which is where my focus remained. It is no doubt extended in the near term but is certainly a leading stock in the market right now. It remains on the watchlist, and I will see if I can get positioned.
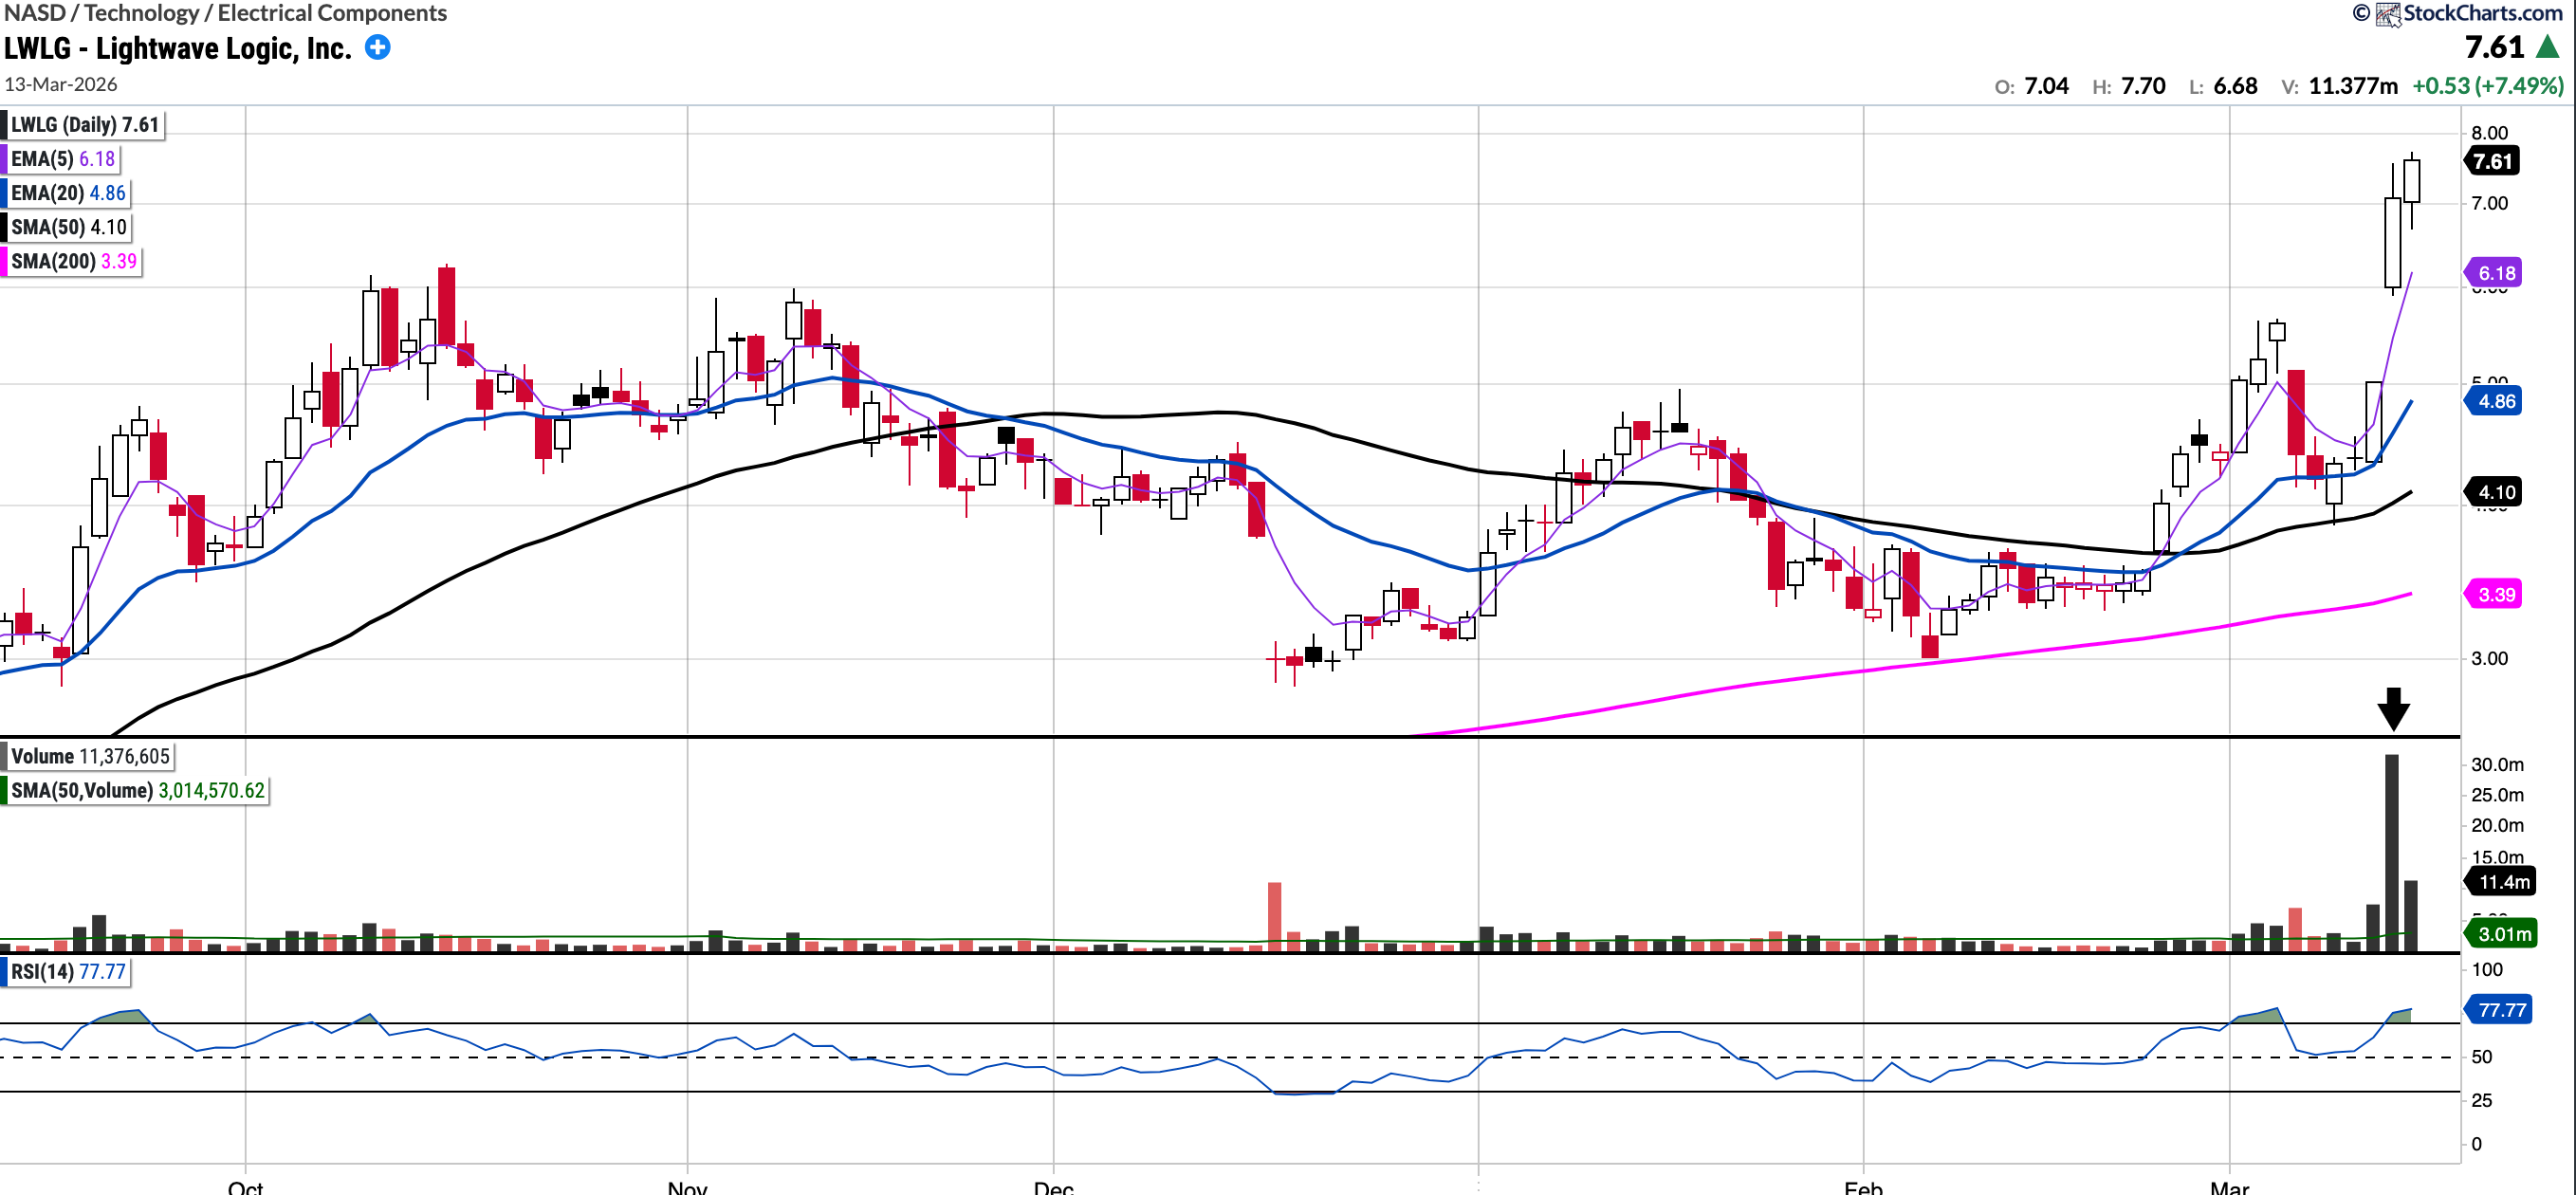
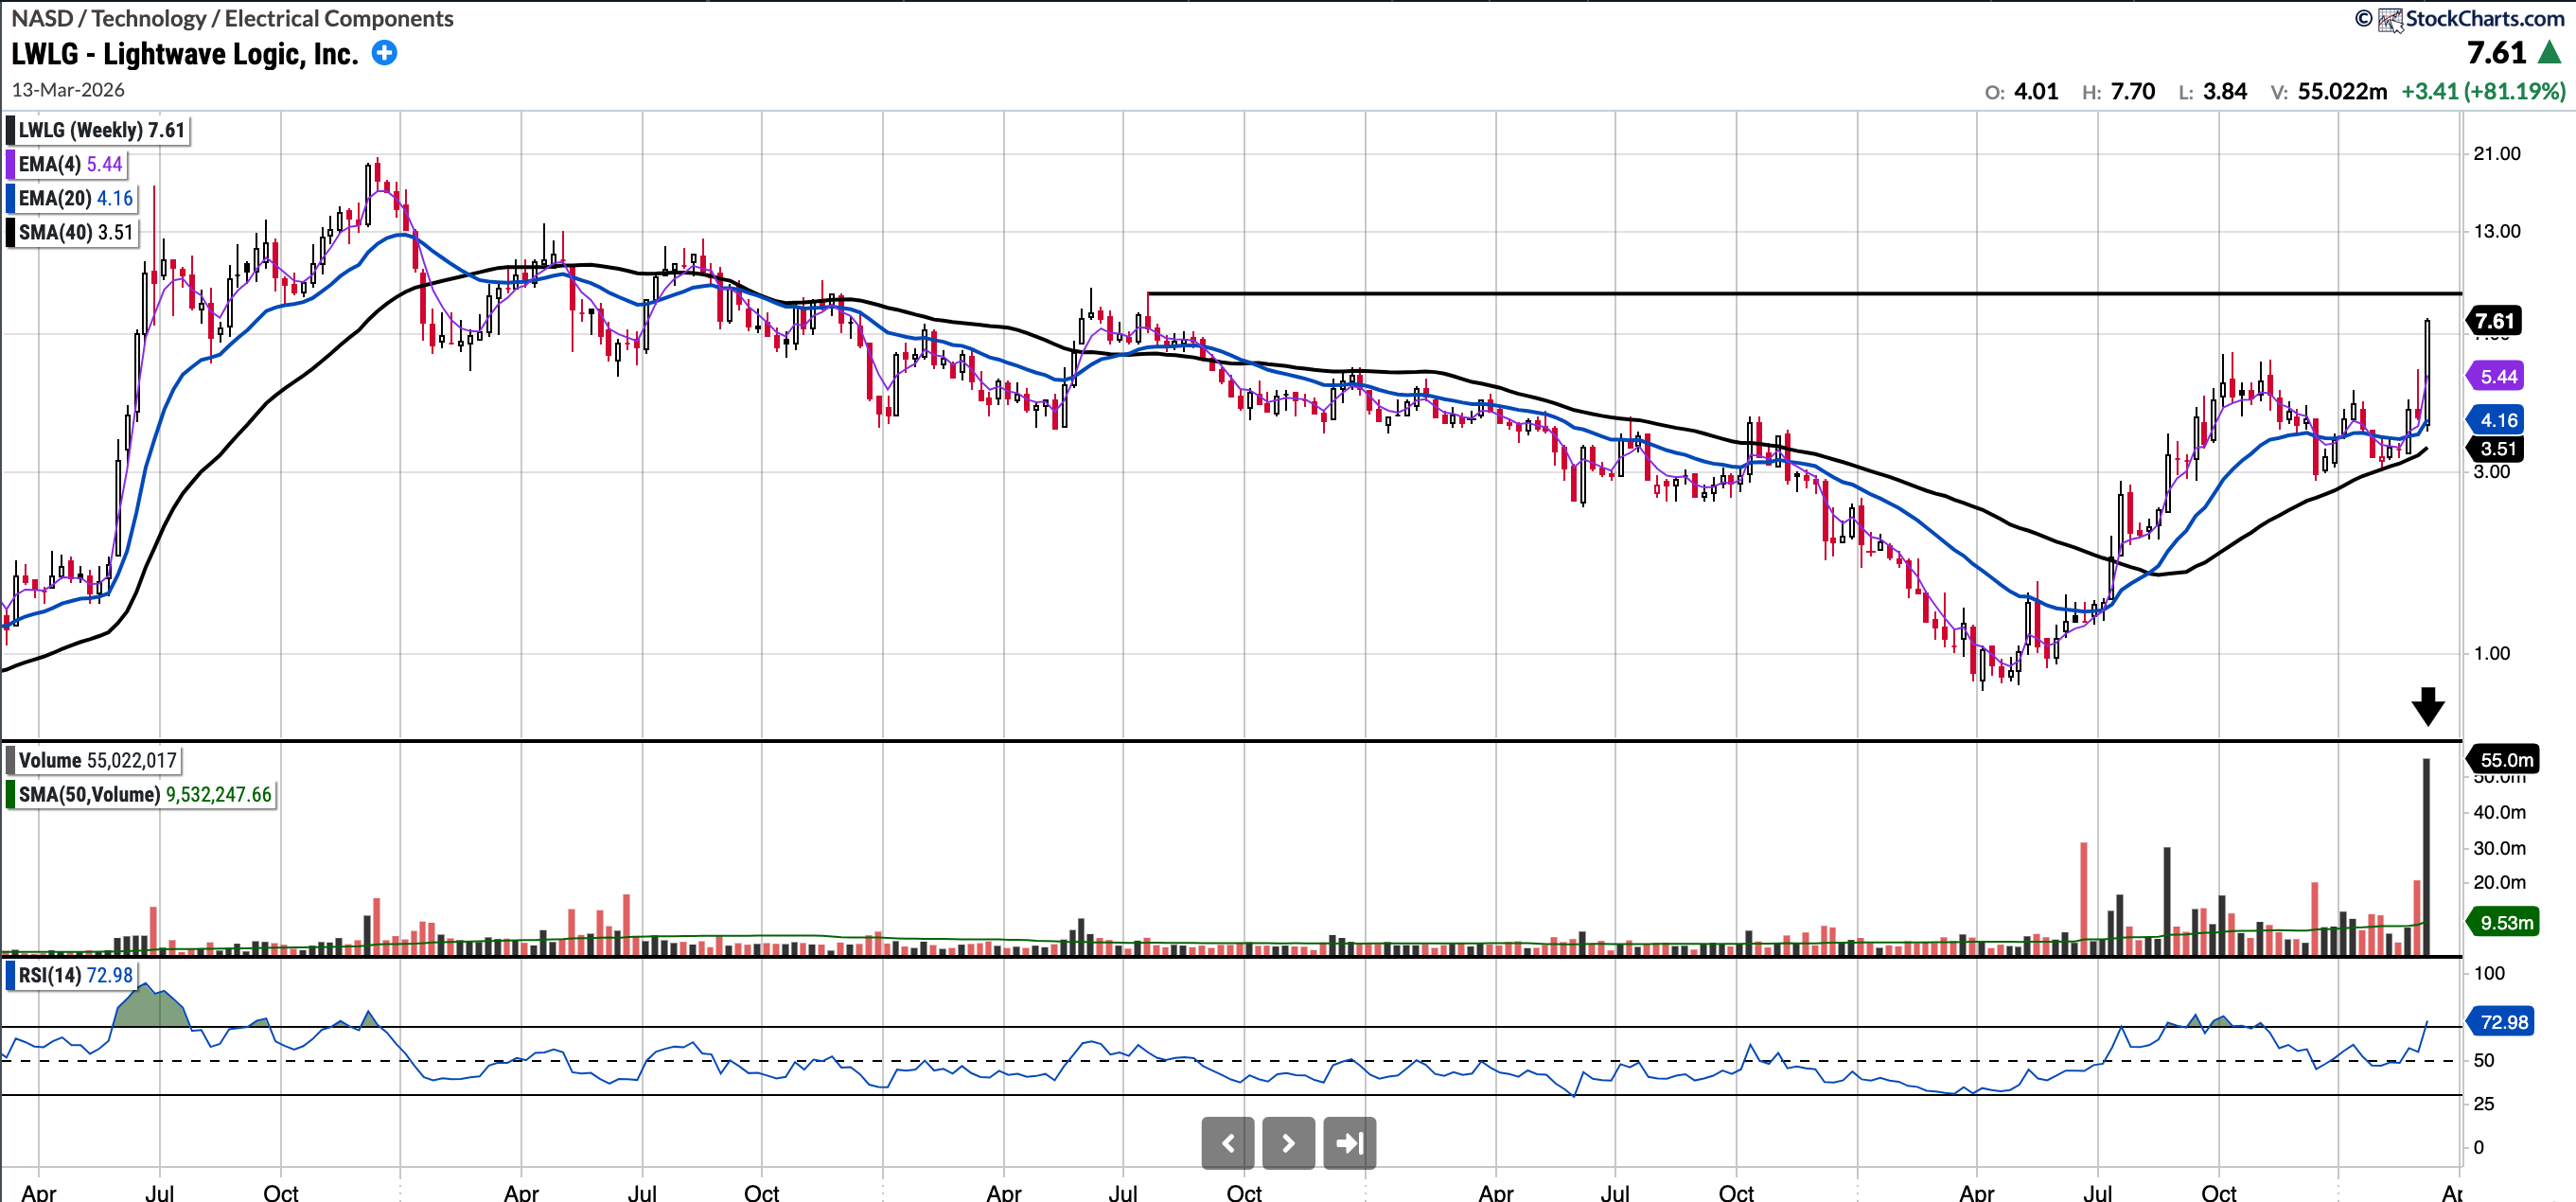
LWLG (Lightwave Logic Inc)
Currently trades at $7.61, 85.57% above the 50SMA and 124.5% above the 200SMA.
RSI 74.81
107.92% YTD.
LWLG focuses on the development of photonic devices and electro-optical polymer materials systems for fiber-optic data communications, telecommunications, and optical computing markets in the United States. It recently printed highest volume ever daily and weekly candles, subsequent to a landmark development agreement with Tower Semiconductor ($TSEM). This gives them commercial validation.
The stock is near term extended on the daily but not so on the weekly chart. I expect it may find resistance at ~9 in the near term and I will be watching the 6.2 to 7 level.
An interesting name for the watchlist.
Notable portfolio changes in previous week (all updated live in subscriber channels):