
Preview of the Week Ahead: W/C April 6, 2026
SPX Reclaims 6500: Recovery or Bull Trap?

Hope you all are having a good weekend. Below, we will be previewing the upcoming week’s events and providing a portfolio update as usual.
Format for what is covered in this weekly preview:
A Look at the Indices
Key Upcoming Economic Events
Upcoming Earnings Reports
Charts
Notable Portfolio Changes from the Previous Week
Current Portfolio Holdings
Position size, cost basis, and commentary on each holding regarding the intended holding period and any planned activity
Closing Thoughts
I highly recommend checking out the latest Monthly Portfolio and Performance Update below:

As a reminder, here is a summary of the changes taking effect after the 7th of April:
The monthly cost will increase by 25% by April 7th. (If you are already a monthly subscriber, this will not impact you unless you unsubscribe and later rejoin)
The annual price will remain the same. I prefer to play long-term games with long-term people, and this structure ensures we are better aligned.
The Discord will become exclusive to annual members after this date. This is to ensure neither of us are wasting our times. (Current members will be grandfathered in)
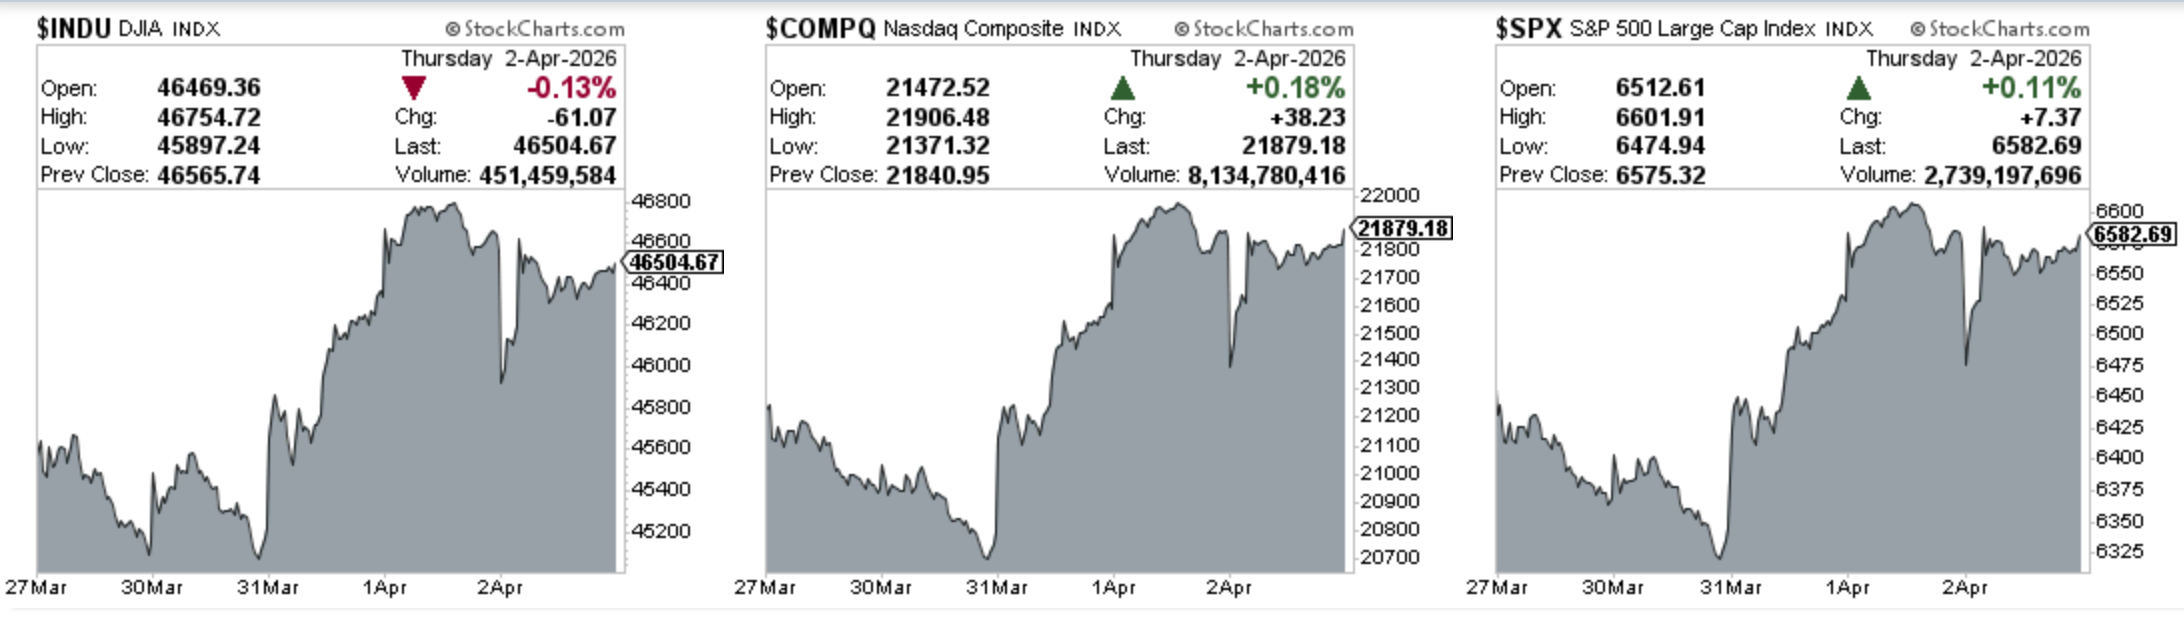
Indices
Dow Jones advanced 2.02% in the last week
S&P 500 advanced 2.37% in the last week
Nasdaq Composite advanced 3.17% in the last week
IWM advanced 2.21% in the last week
Key upcoming economic events
Monday, April 6
ISM Services PMI (March): (10:00 AM ET)
Tuesday, April 7
Durable Goods Orders: (8:30 AM ET)
Fed Goolsbee Speech: (4:35 PM ET)
Wednesday, April 8
FOMC Meeting Minutes: (2:00 PM ET)
Business Formation Statistics: (10:00 AM ET)
Thursday, April 9
Weekly Unemployment Claims: (8:30 AM ET)
Core PCE Price Index (February): (8:30 AM ET)
Friday, April 10
Consumer Price Index (CPI) - March: (8:30 AM ET)- Forecasts are currently eyeing a sharp jump (potentially +0.9% MoM).
University of Michigan Consumer Sentiment (Prelim): (10:00 AM ET)
Upcoming Earnings
Below is the infographic by Earnings Whispers highlighting the schedule for this week:

Charts
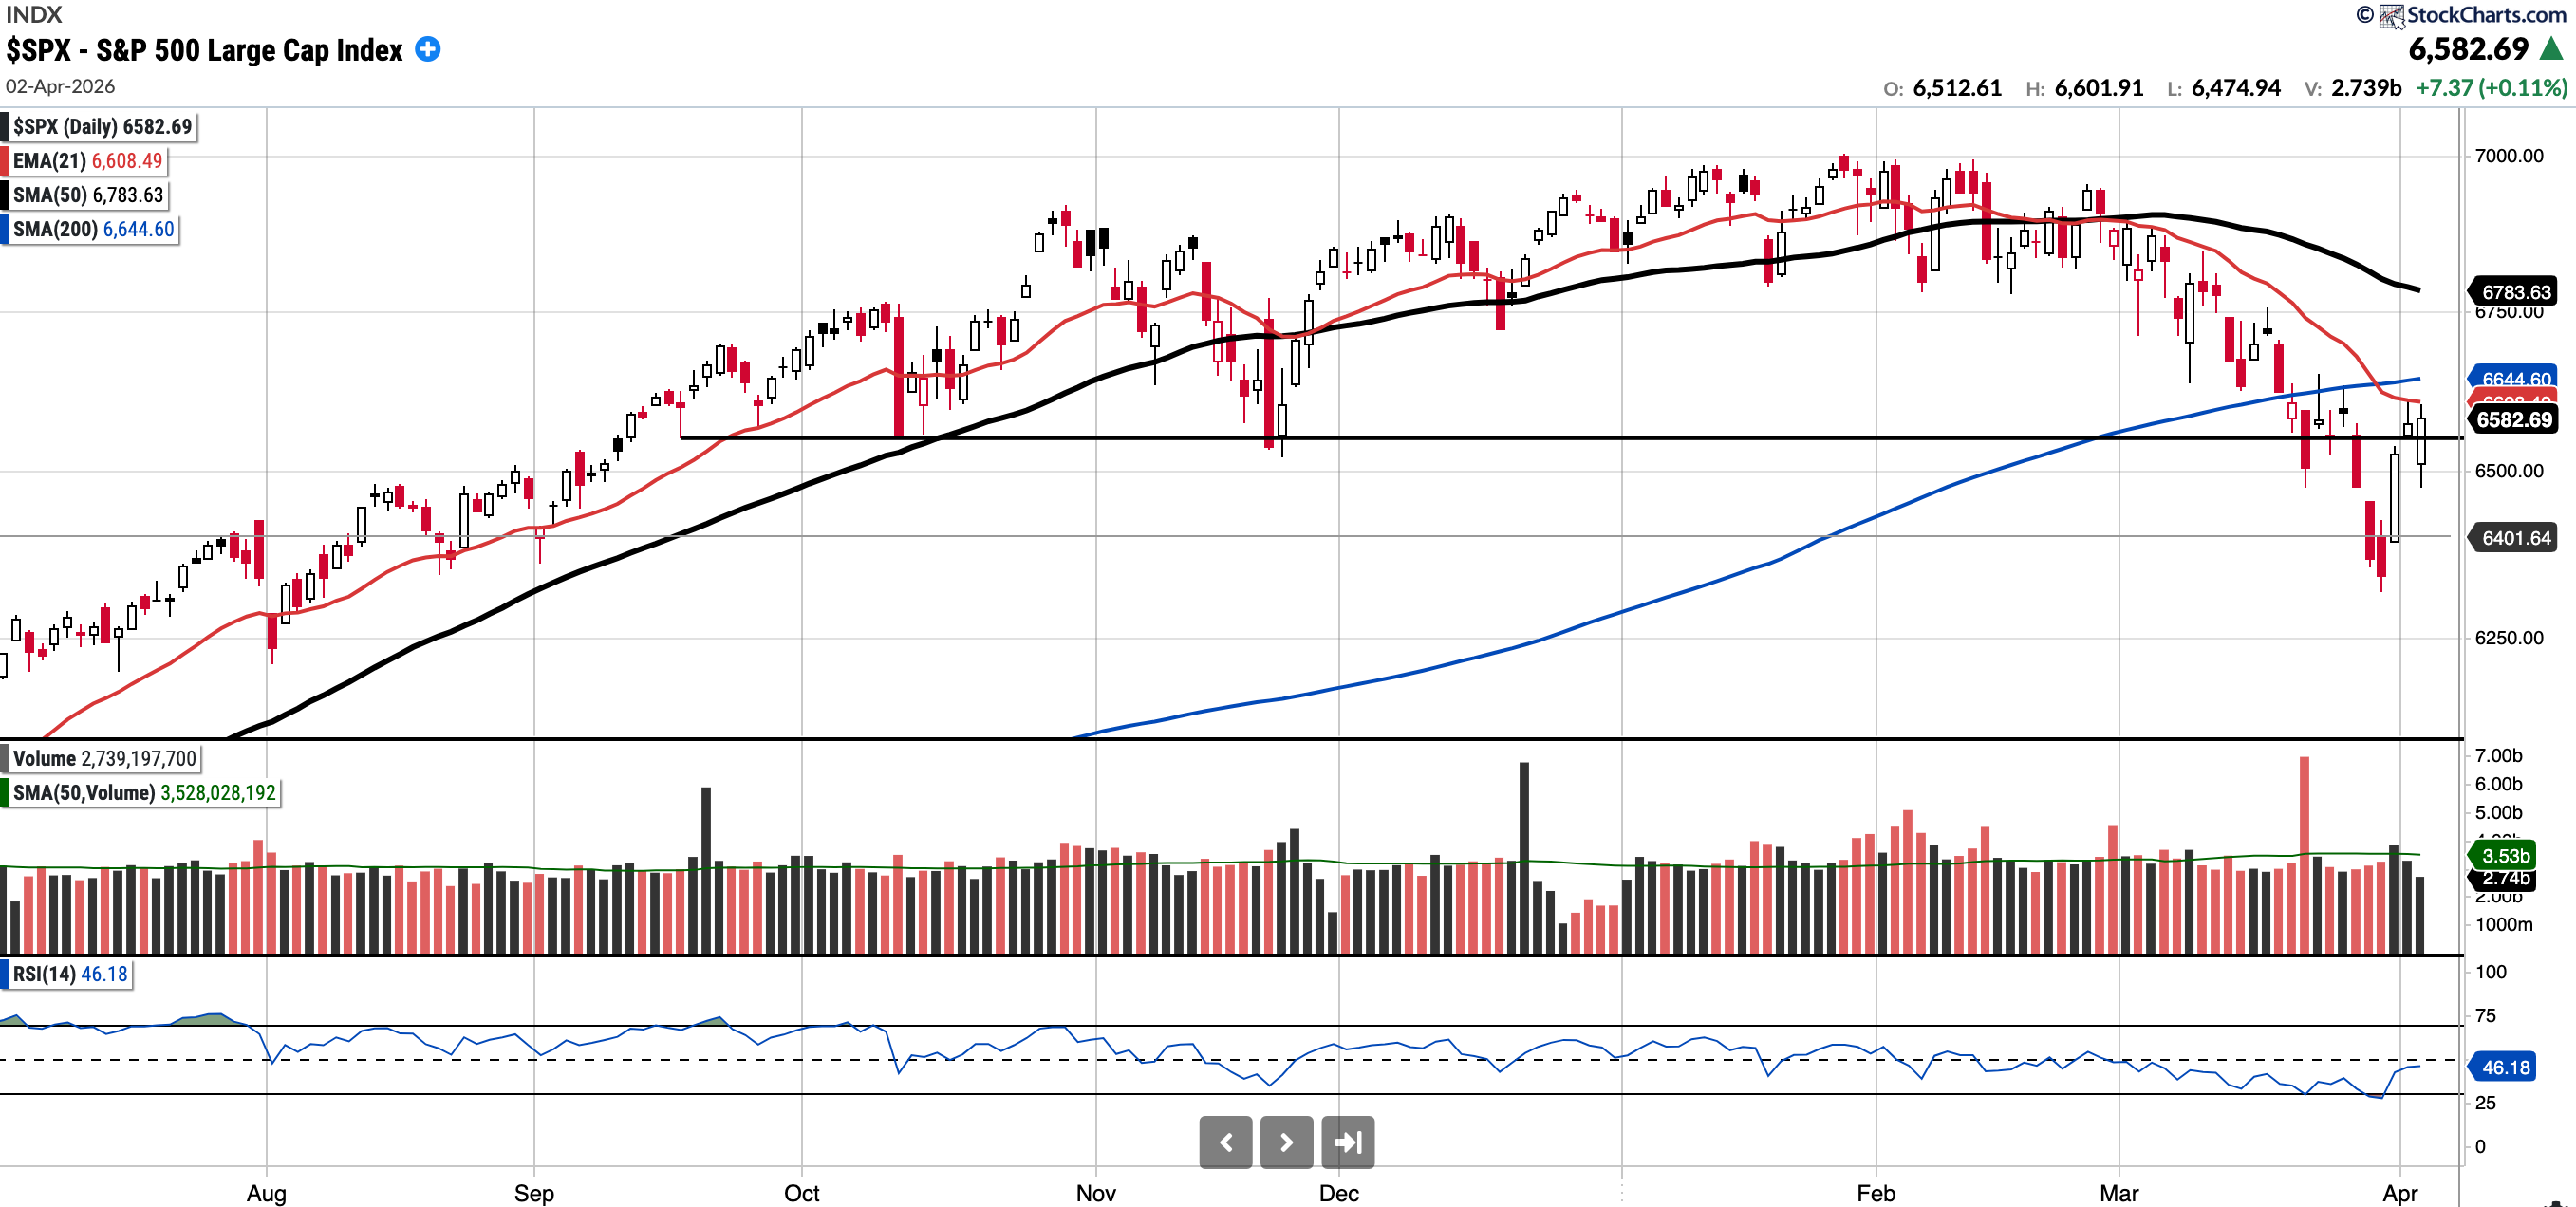
SPX
Currently trades at 6,582.69, 2.96% below the 50SMA and 0.93% below the 200SMA.
RSI 46.18
-4.02% YTD
Distribution days in the last week: 1
Whilst the SPX remains below all key moving averages, it did reclaim and hold the 6400 and 6520 support levels. To the upside, bulls would want to see the 200 SMA reclaimed, but if rejected, recent lows of 6300 are likely to be tested; below that, 6050 is a level of interest.
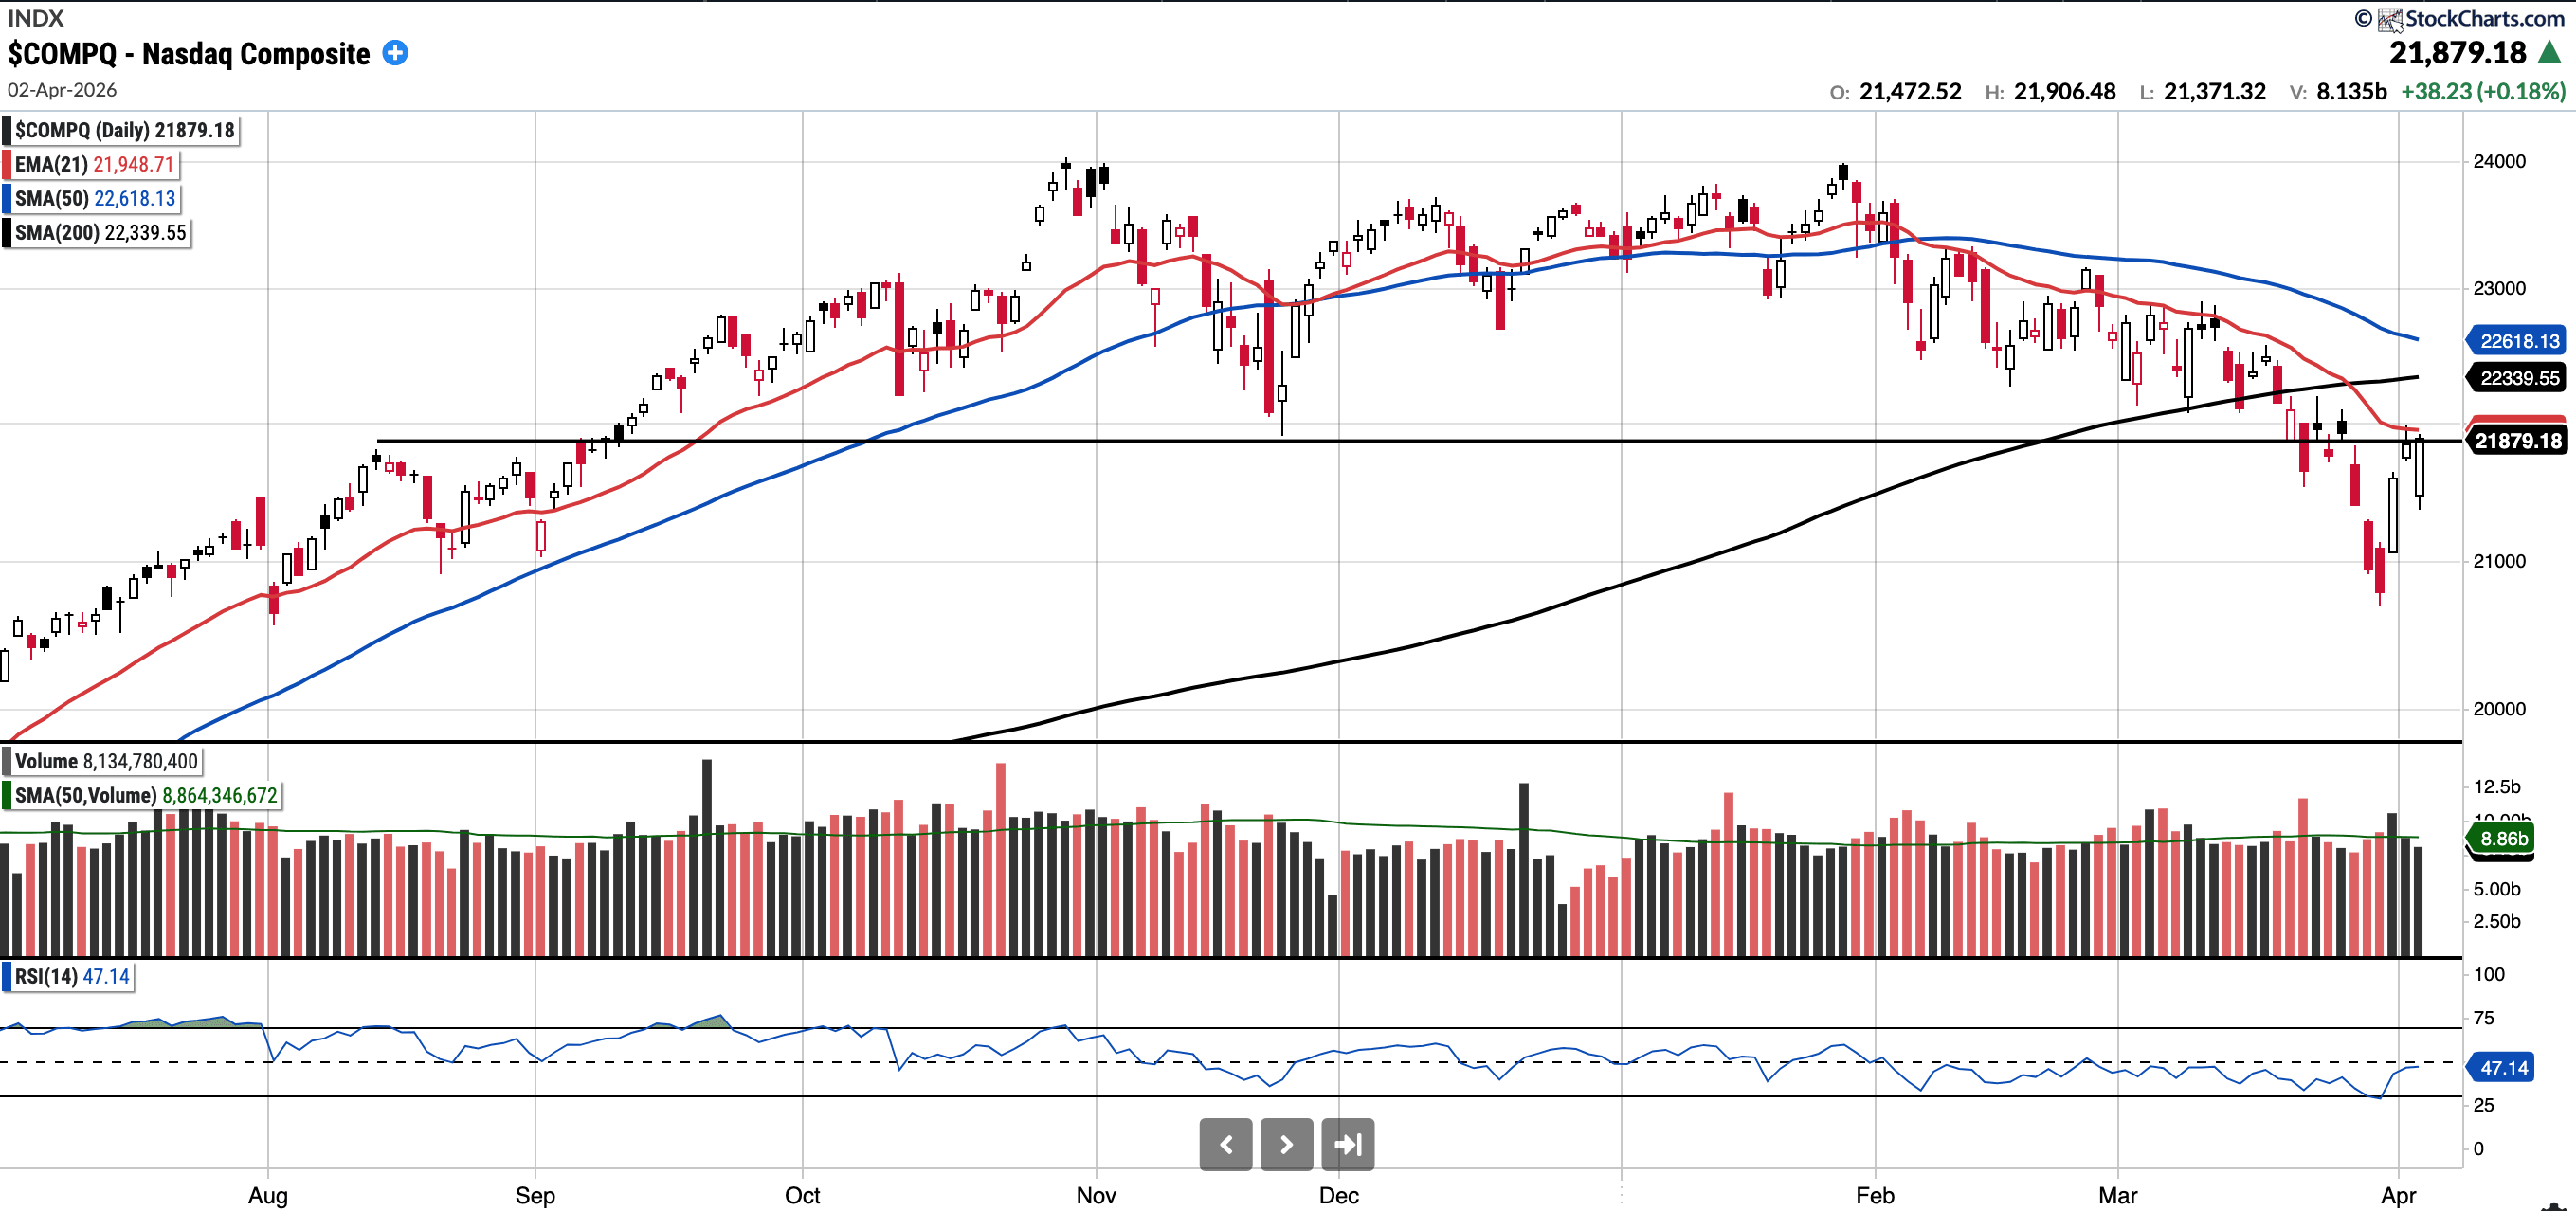
COMPQ
Currently trades at 21,879.18, 3.27% below the 50SMA and 2.06% below the 200SMA.
RSI 47.14
-5.84% YTD
Distribution days in the last week: 1
There was 1 distribution day this week. The Nasdaq Composite remains below all key moving averages. Interestingly, we did end the week above the 21,850 level of Interest.
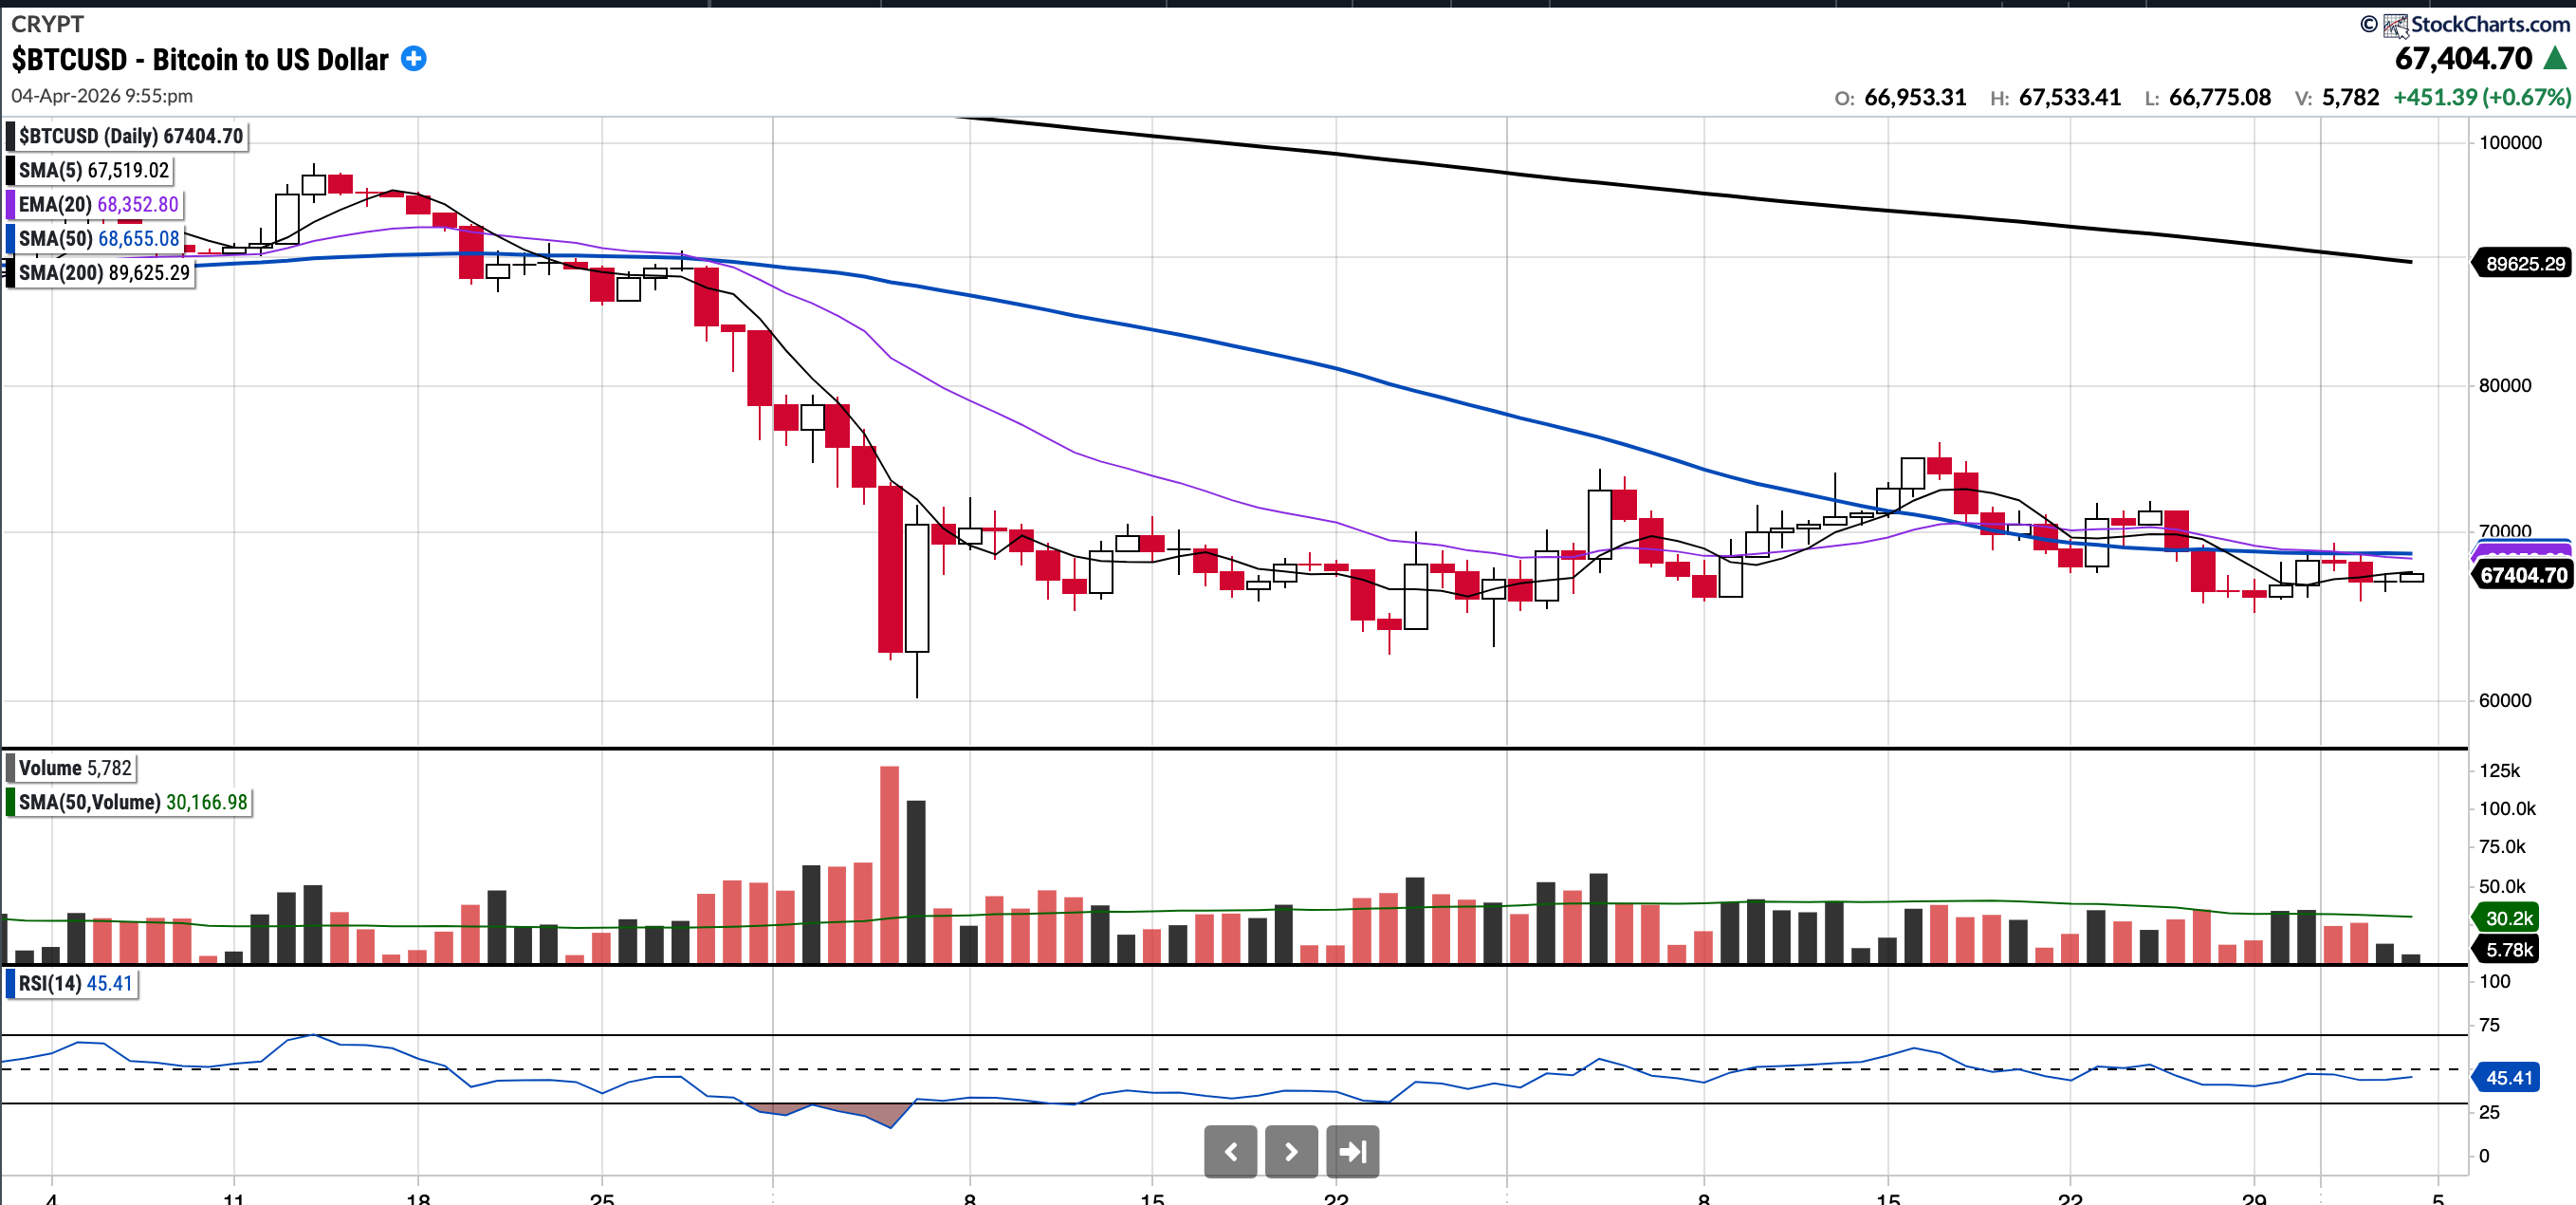
BTC (currently Long)
Currently trades at $67,404.7, 1.84% below the 50SMA and 24.8% below the 200SMA.
RSI 45.41
-24% YTD.
Since testing the 200-week moving average on Thursday, February 5th, Bitcoin has continued to trade primarily within the $63,000–$70,000 range.
In early March, BTC had exhibited some strength , putting together a string of 8 green days in a row and trading as high as $76,000 for a moment, though it is again some way off those levels. $74,000 remains an important resistance level.
As of Saturday 22:57 BST, BTC remains below all key moving averages. We remain in a position where significant technical work is required before the chart looks constructive.
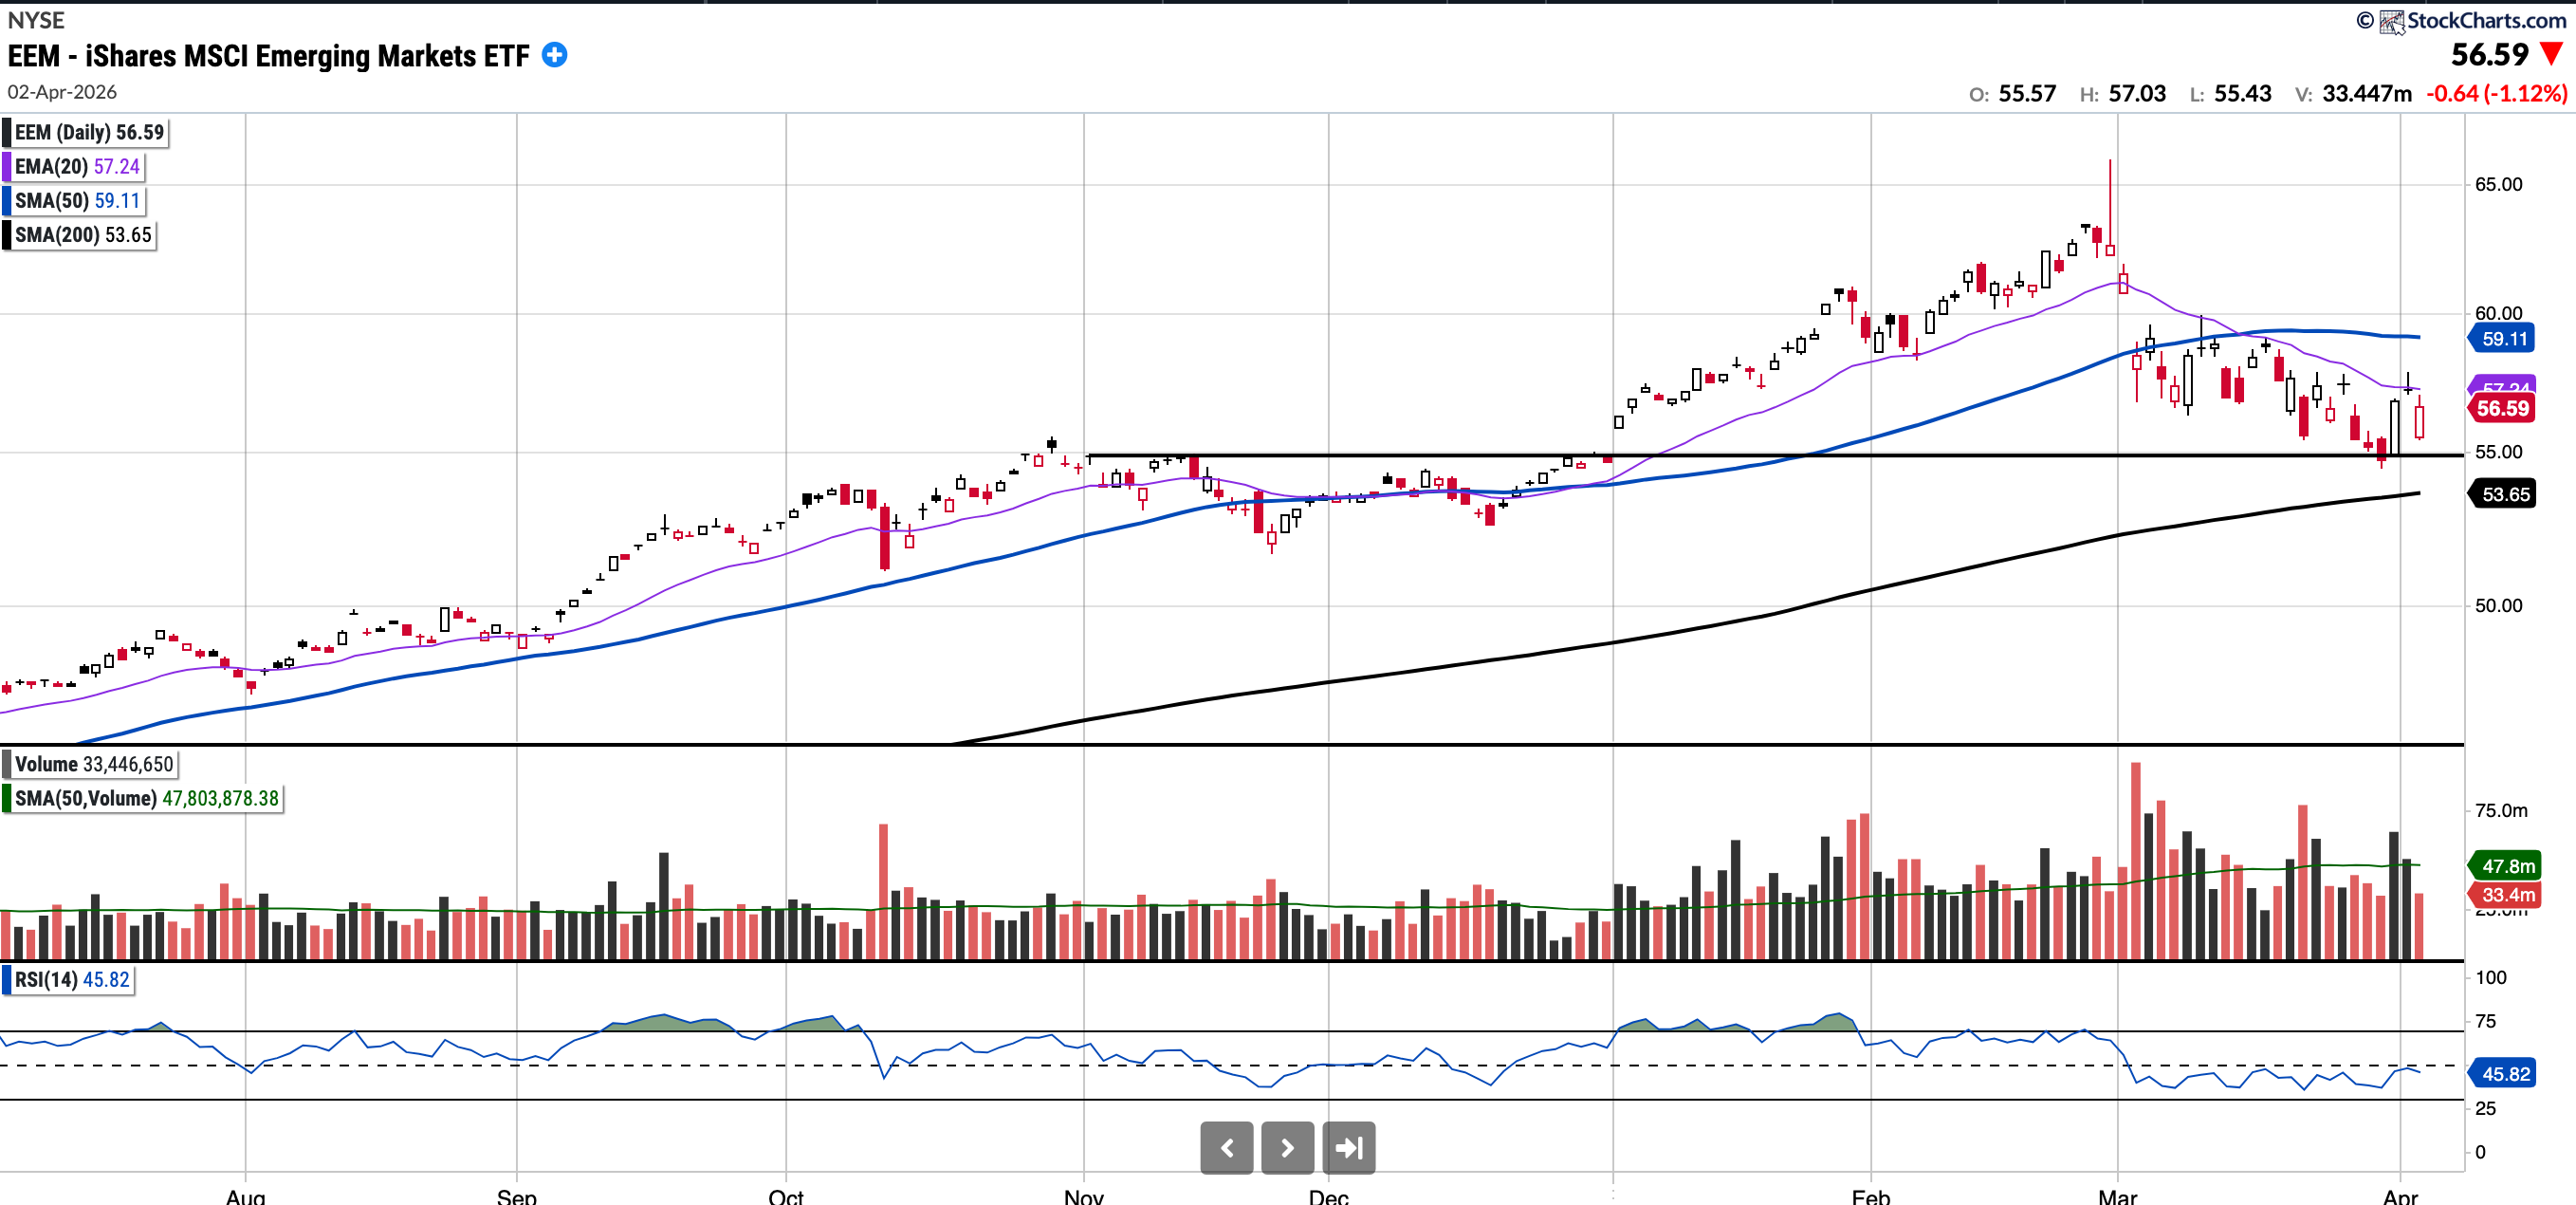
EEM
Currently trades at $56.59, 4.27% below the 50SMA and 5.47% above the 200SMA
RSI 45.82
+0.62% YTD
$EEM continues to outperform the U.S. indices comfortably year-to-date, though it has pulled back sharply over the last few weeks amid events in the Middle East. This makes sense given the higher oil and energy costs.
EEM remains in an uptrend; however, the levels to watch for pullback buys are $55.00 (horizontal support) and the ascending 200-day SMA at $53.46. While it has held the $55.00 support for now, if that level is lost, the 200-day SMA will come into play. I believe EEM could be setting up for multi-year out performance hence I continue to watch it closely.
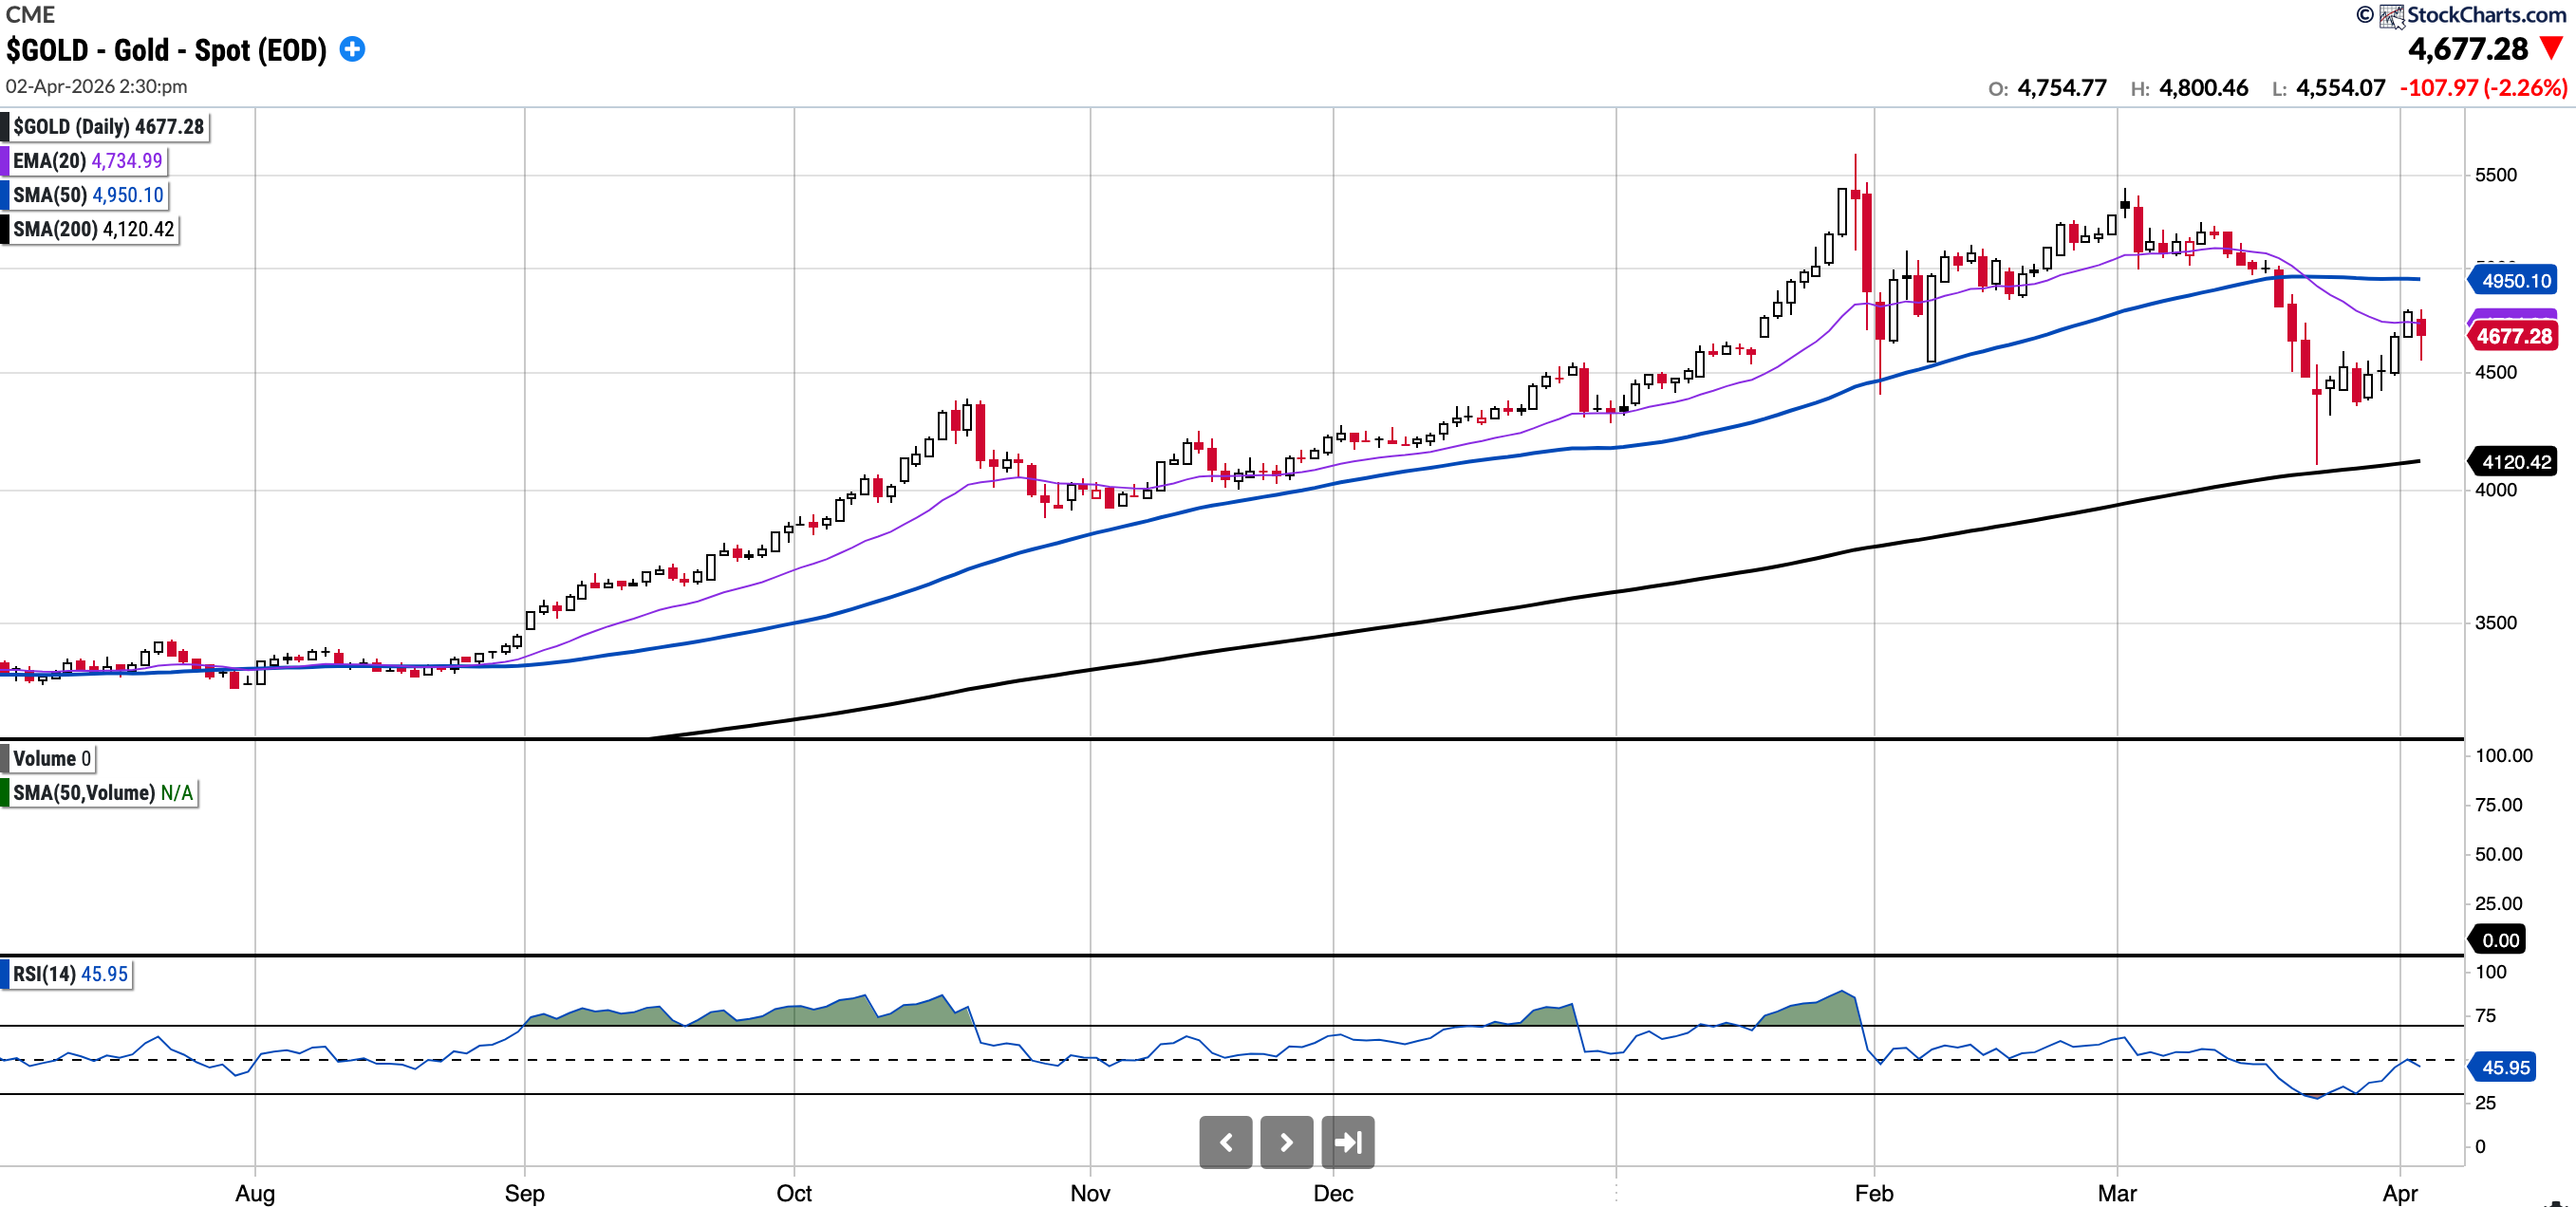
GOLD (Long Physical)
Currently trades at $4677, 5.51% below the 50SMA and 13.51% above the 200SMA
RSI 45.95
8.2% YTD
Gold has started to show surprising weakness despite ongoing geopolitical uncertainty. It remains 15% or so off the highs though remains in a long term up trend.
The overhead 50SMA (4950) will be an important level to watch and below that the 200 day SMA (4120)
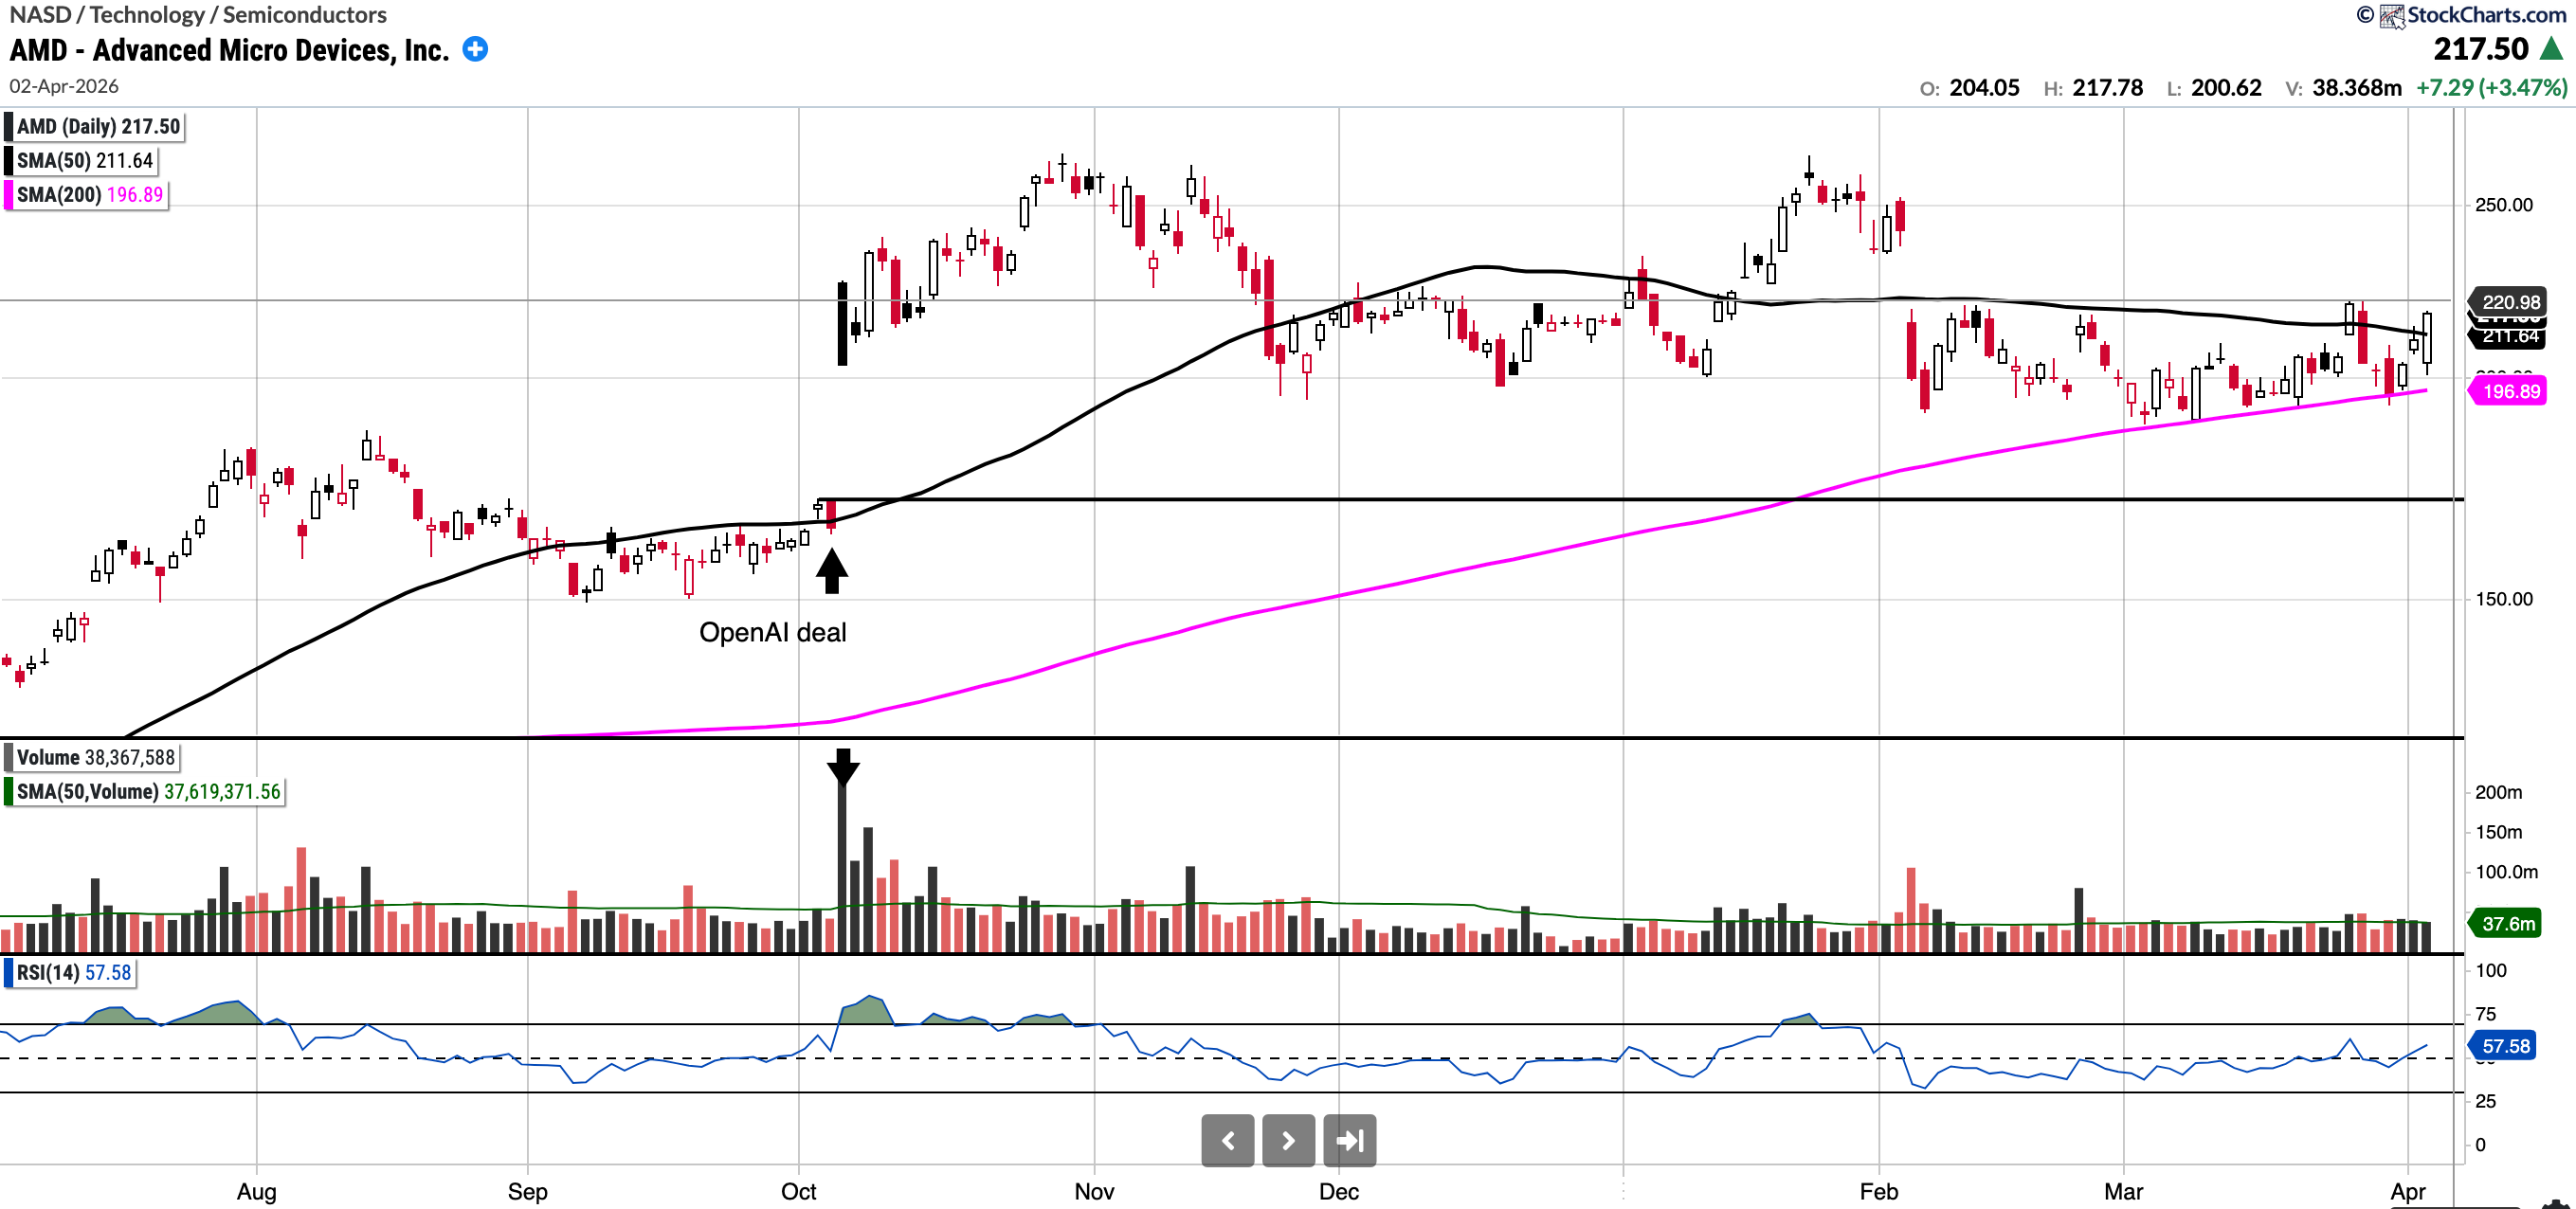
AMD (Currently Long)
Currently trades at $217.5, 2.77% above the 50SMA and 10.47% above the 200SMA
RSI 45.95
-2.67% YTD
AMD has held up well relative to the indexes, showing relative strength. I like the way the chart is setting up; a break above 221 could bring a move to ~237 very quickly. To the downside, the 200 SMA is the level to play risk against.
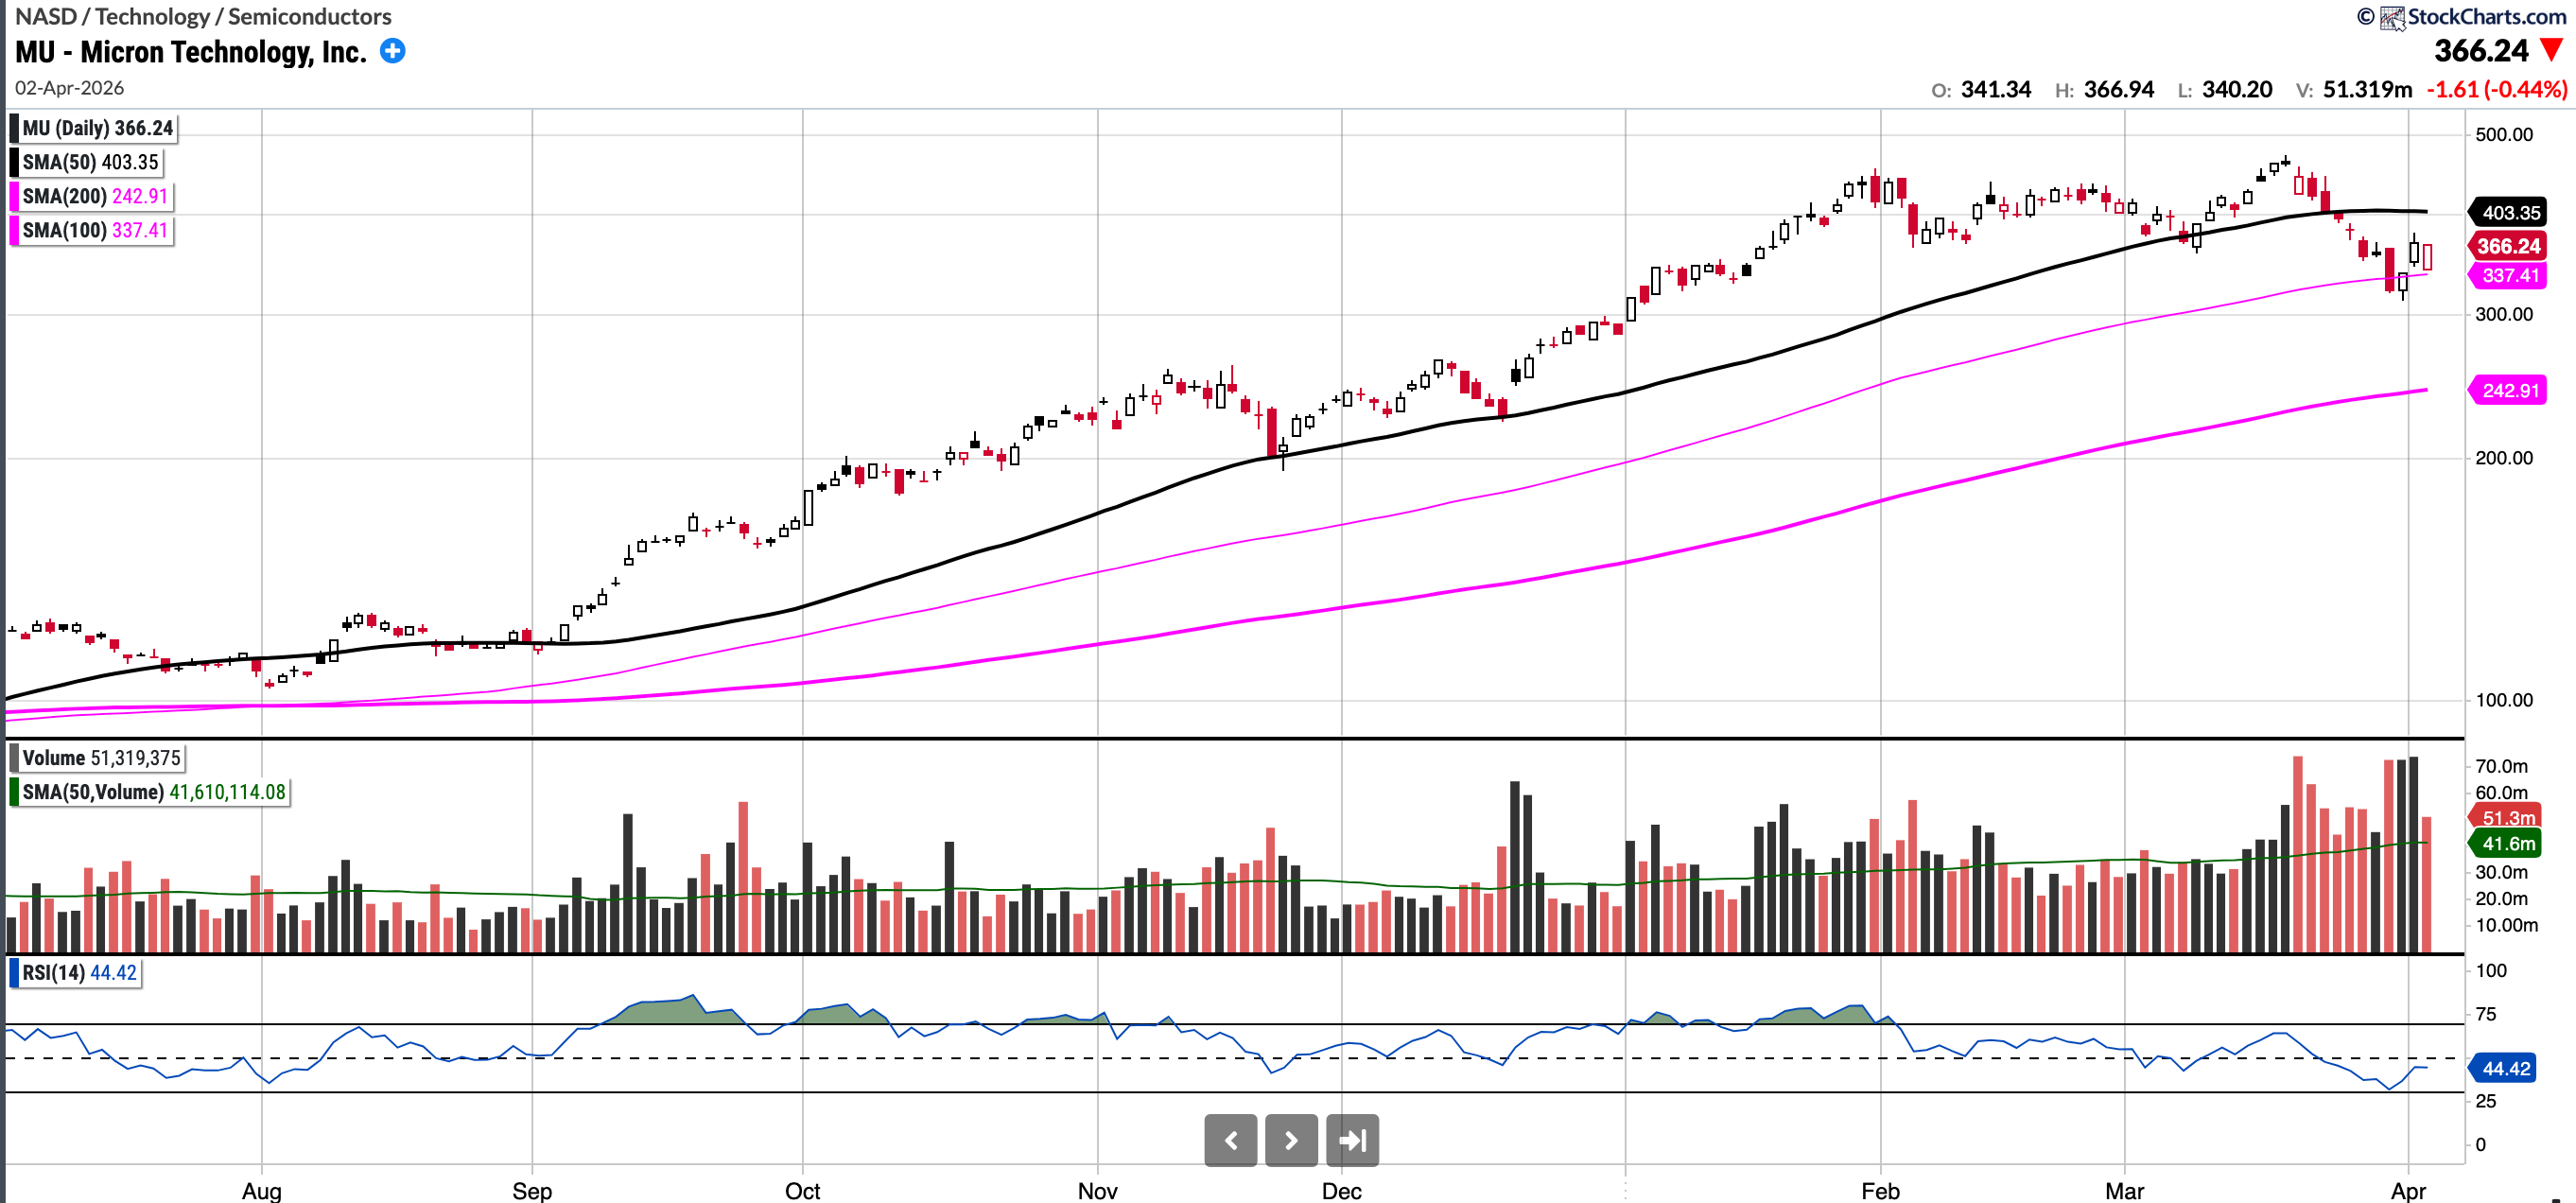
MU
Currently trades at $366.24, 9.2% below the 50SMA and 50.77% above the 200SMA
RSI 44.42
-16.16% YTD
MU has been on a stellar run in the last year, though it has pulled back 25% or so from the highs. The stock is very cheap on a forward P/E basis, though the 'E' is always in question with such a cyclical company.
I am watching to see if it can stabilise in the mid 300’s and especially if it can hold the SMA 100. I am interested in initiating a trading position.
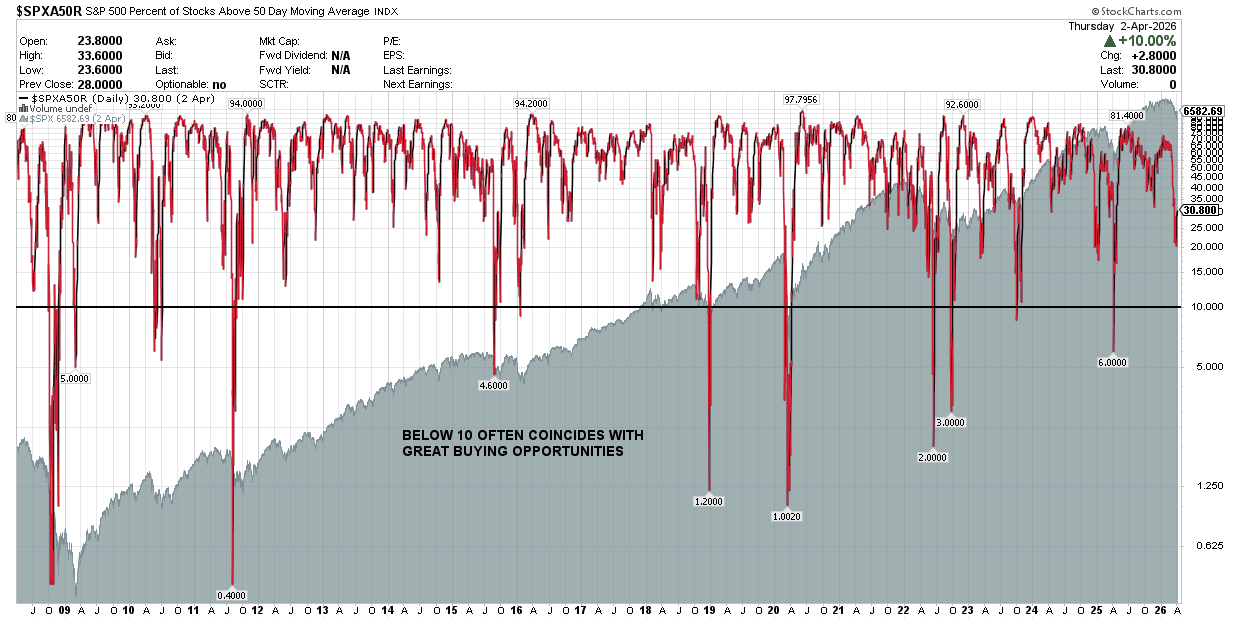
S&P 500 Percentage of Stocks Below the 50 Day Moving Average
Below 10 tend to be fantastic buying opportunities. We did get to 20 at the recent pico low on the SPX.
Notable portfolio changes in previous week (all updated live in subscriber channels):
No new positions or exits.
Important: To familiarise yourself with the notification process, please read the following post regarding the notification system.
I have also included the link to the Live Updates thread on the Substack chat below, which is where I post all moves related to my investment account. Turn the notifications on. Live Updates Thread
Note that these updates are posted simultaneously on Discord as well.
Current Positions in Size Order with Cost Basis:
