
Preview of the Week Ahead: W/C April 20, 2026
SPX Reaches New All-Time Highs Amid a Historic Market Rebound

Hope you all are having a good weekend. Below, we will be previewing the upcoming week’s events and providing a portfolio update as usual.
Format for what is covered in this weekly preview:
A Look at the Indices
Key Upcoming Economic Events
Upcoming Earnings Reports
Charts
Notable Portfolio Changes from the Previous Week
Current Portfolio Holdings
Position size, cost basis, and commentary on each holding regarding the intended holding period and any planned activity
Closing Thoughts

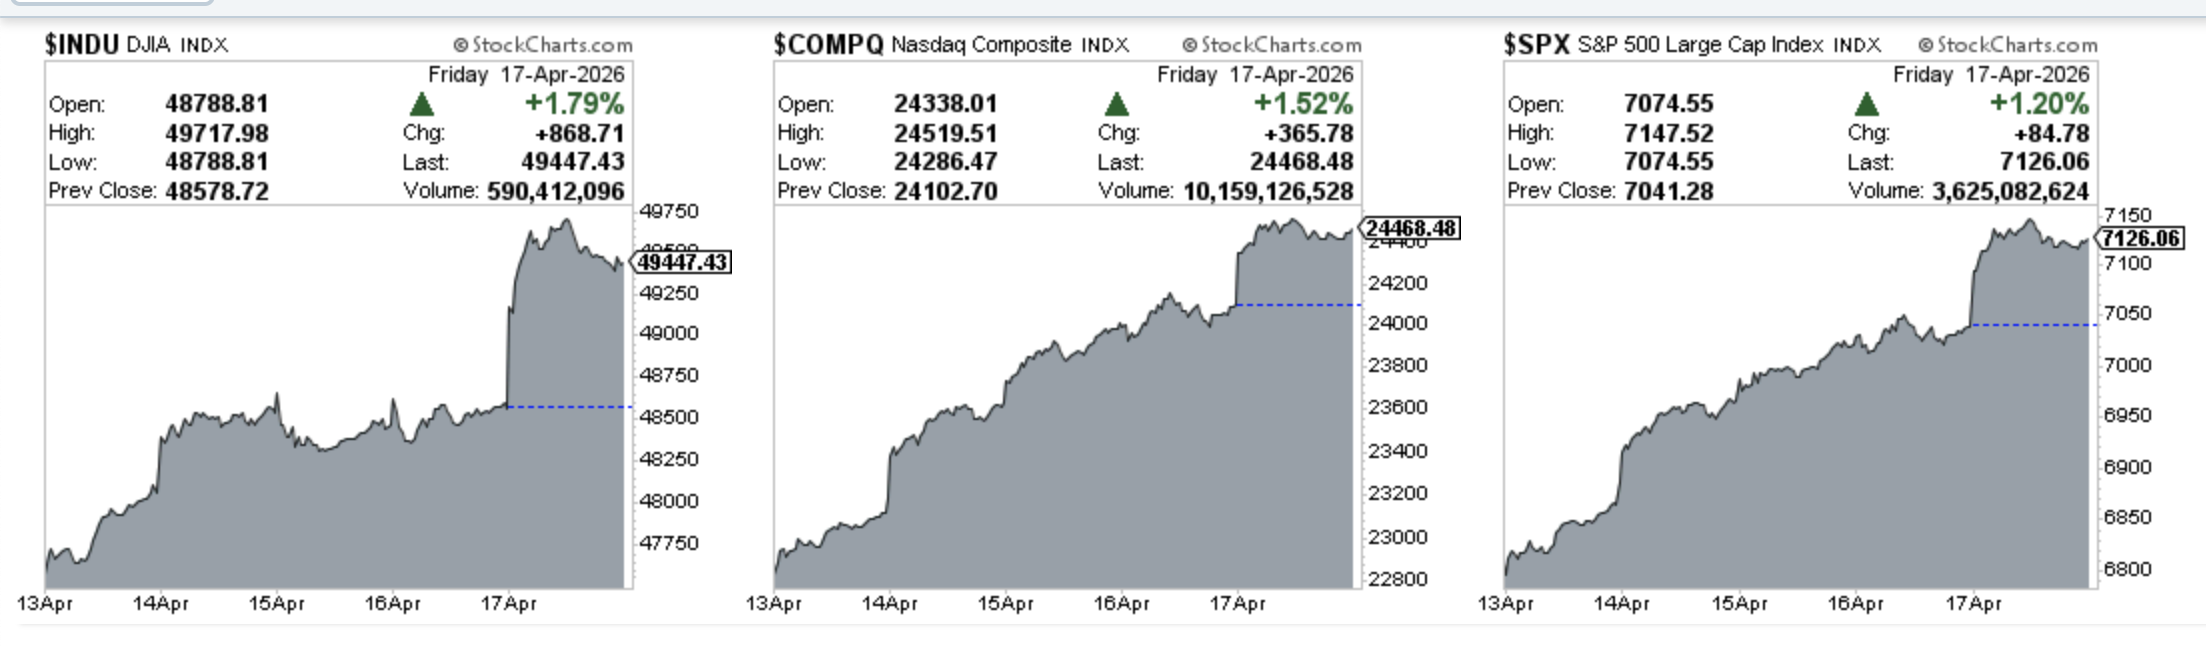
Indices
Dow Jones advanced 3.93% in the last week
S&P 500 advanced 4.82% in the last week
Nasdaq Composite advanced 7.12% in the last week
IWM advanced 5.81% in the last week
Key upcoming economic events
Monday, April 20
Fed Speeches: Insights from Thomas Barkin and Christopher Waller
3-Month & 6-Month Bill Auctions
Tuesday, April 21
Retail Sales (March):
High-impact release of the day.
Markets expect a1.3% rise, signalling continued consumer resilience despite high energy costs.
Pending Home Sales: Expected to show a modest 0.5% uptick.
Business Inventories
ADP Employment Change (Weekly)
Wednesday, April 22
MBA Mortgage Applications
EIA Crude Oil Stocks
20-Year Bond Auction
Thursday, April 23
Initial Jobless Claims: Consensus: ~212K.
S&P Global Flash PMIs:
Manufacturing and Services PMIs will be released.
Kansas Fed Manufacturing Index
Warsh Testimony
Friday, April 24
Michigan Consumer Sentiment (Final)
Baker Hughes Rig Count: Monitoring U.S. oil production capacity
Upcoming Earnings
Below is the infographic by Earnings Whispers highlighting the schedule for this week:

Charts
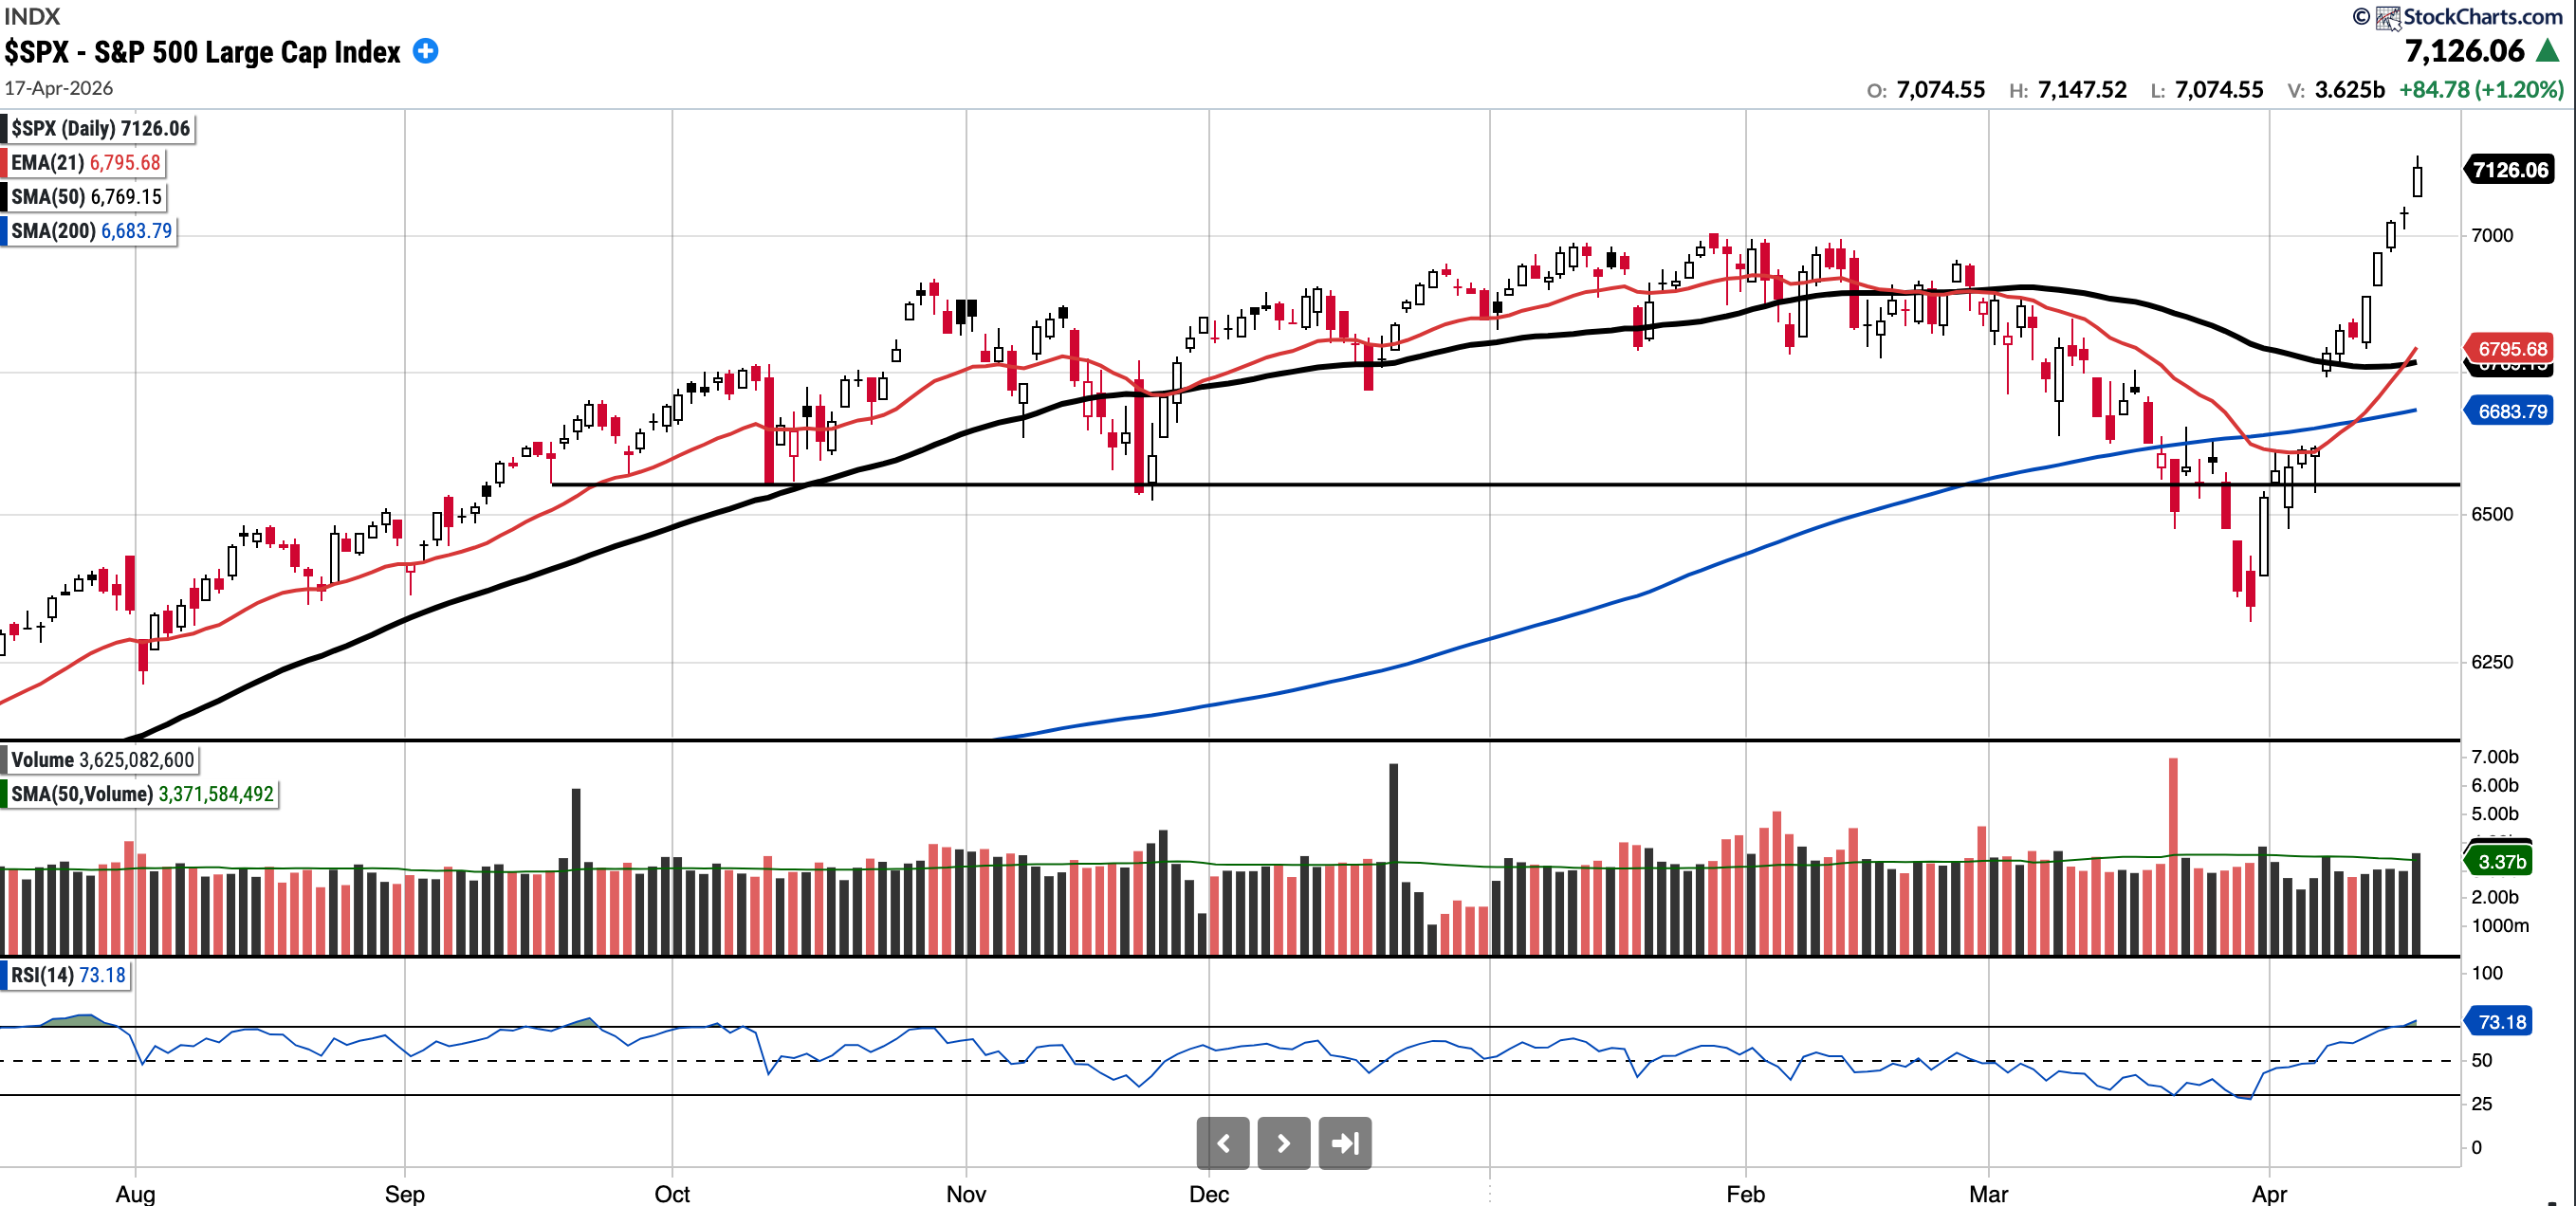
SPX
Currently trades at 7,126.06, 5.27% above the 50SMA and 6.62% above the 200SMA.
RSI 73.18
3.9% YTD
Distribution days in the last week: 0
The SPX had five consecutive green days this week and made new ATHs on Thursday and Friday. A Remarkable turnaround.
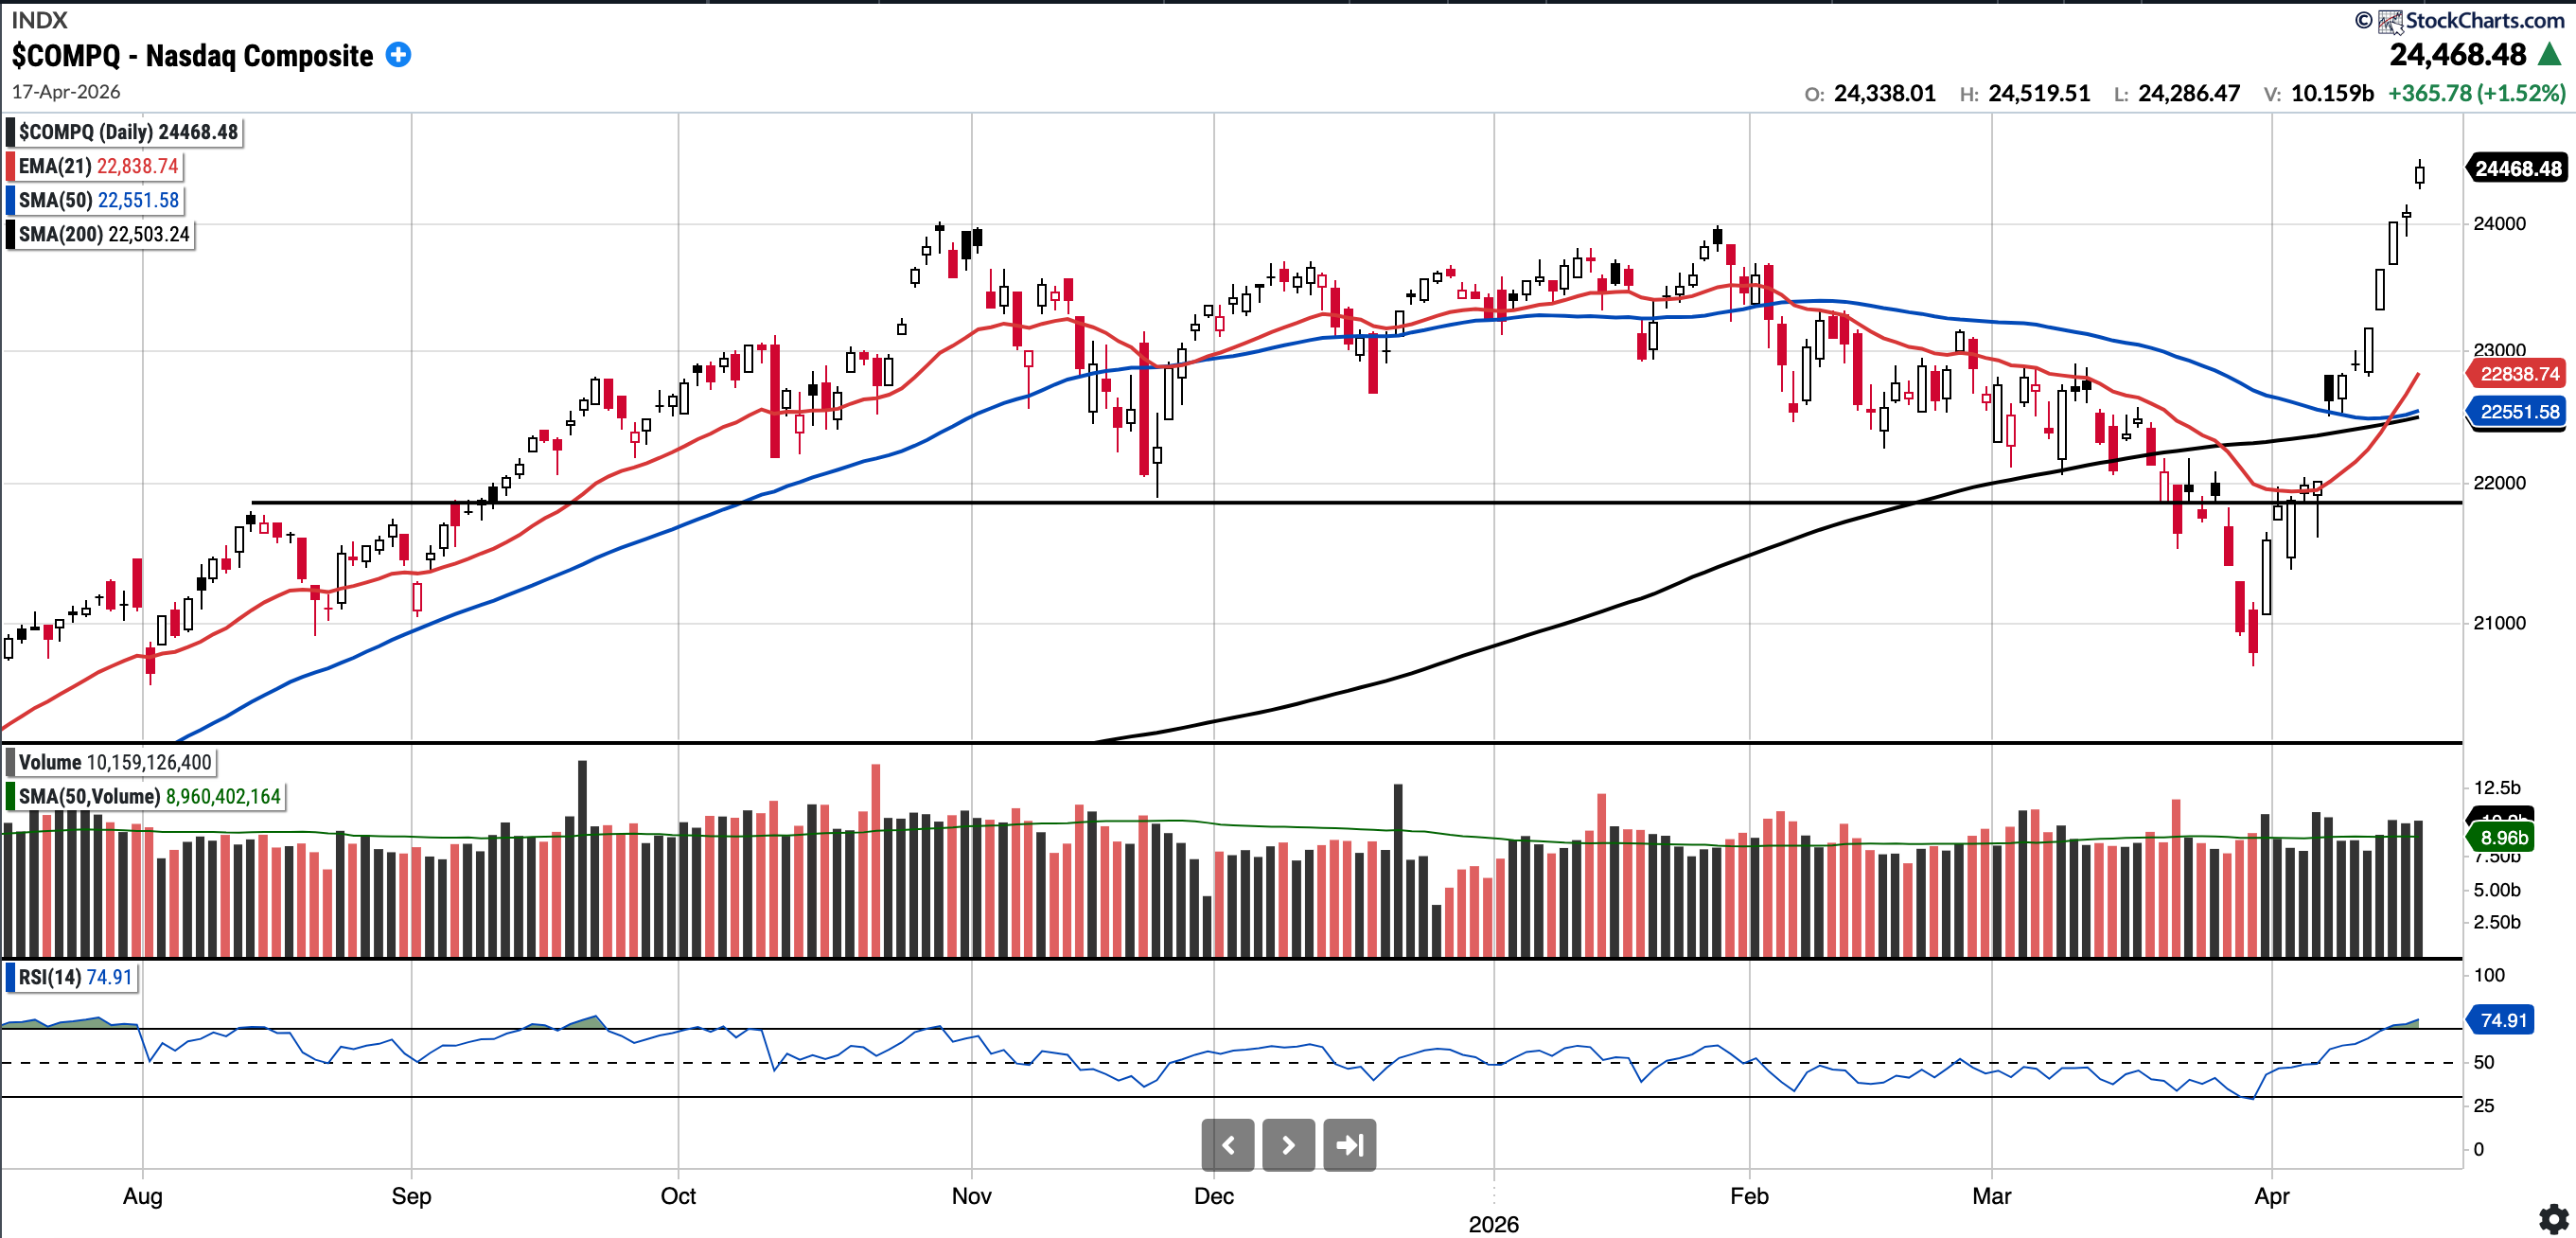
COMPQ
Currently trades at 24,468.48, 8.5% above the 50SMA and 8.73% above the 200SMA.
RSI 74.91
5.31% YTD
Distribution days in the last week: 0
The Nasdaq Composite has been green for a record 13 consecutive days. It ended the week above all key moving averages, though it is 8.53% above the SMA 50, which is pretty extended.
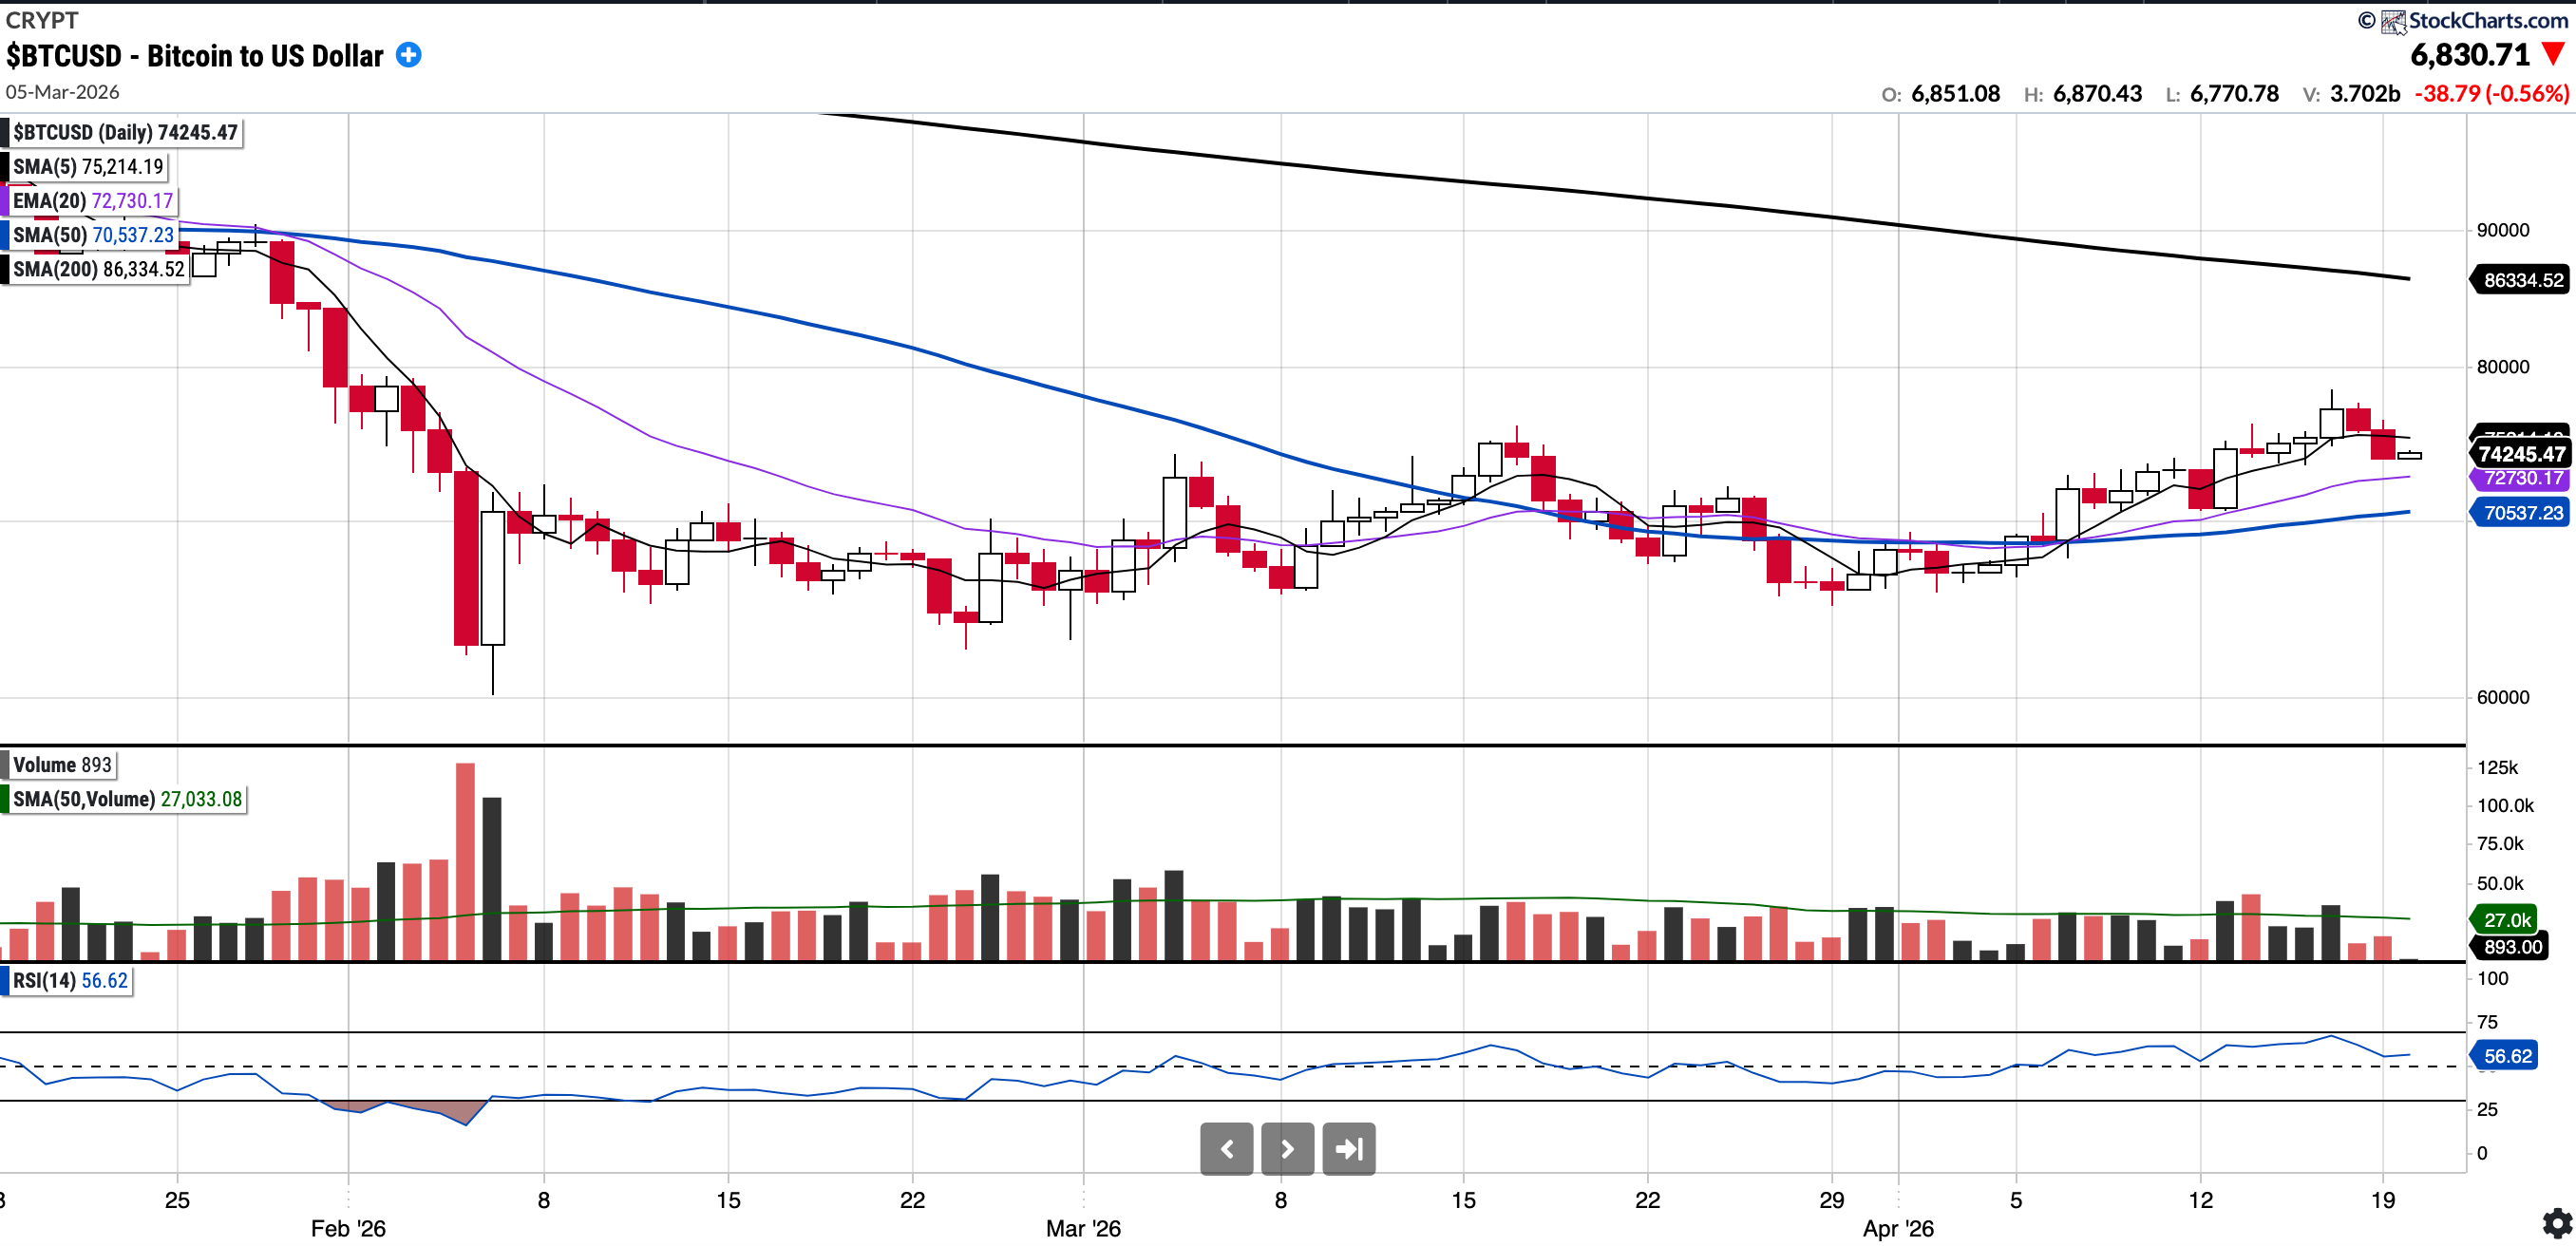
BTC (currently Long)
Currently trades at $74,245, 5.26% above the 50SMA and 14.00% below the 200SMA.
RSI 56.62
-16.33% YTD.
Since testing the 200-week moving average on Thursday, February 5th, Bitcoin has continued to trade primarily within the $63,000–$70,000 range.
This week, we did trade as high as $78,000, though we have pulled back a little since then. As of Monday 01:50 BST, BTC is above the EMA 20 and SMA 50, which is a positive development initially. Furthermore, BTC is trading above $74,000, which I have mentioned consistently remains an important resistance level. Bulls would want to flip that to become firm support.
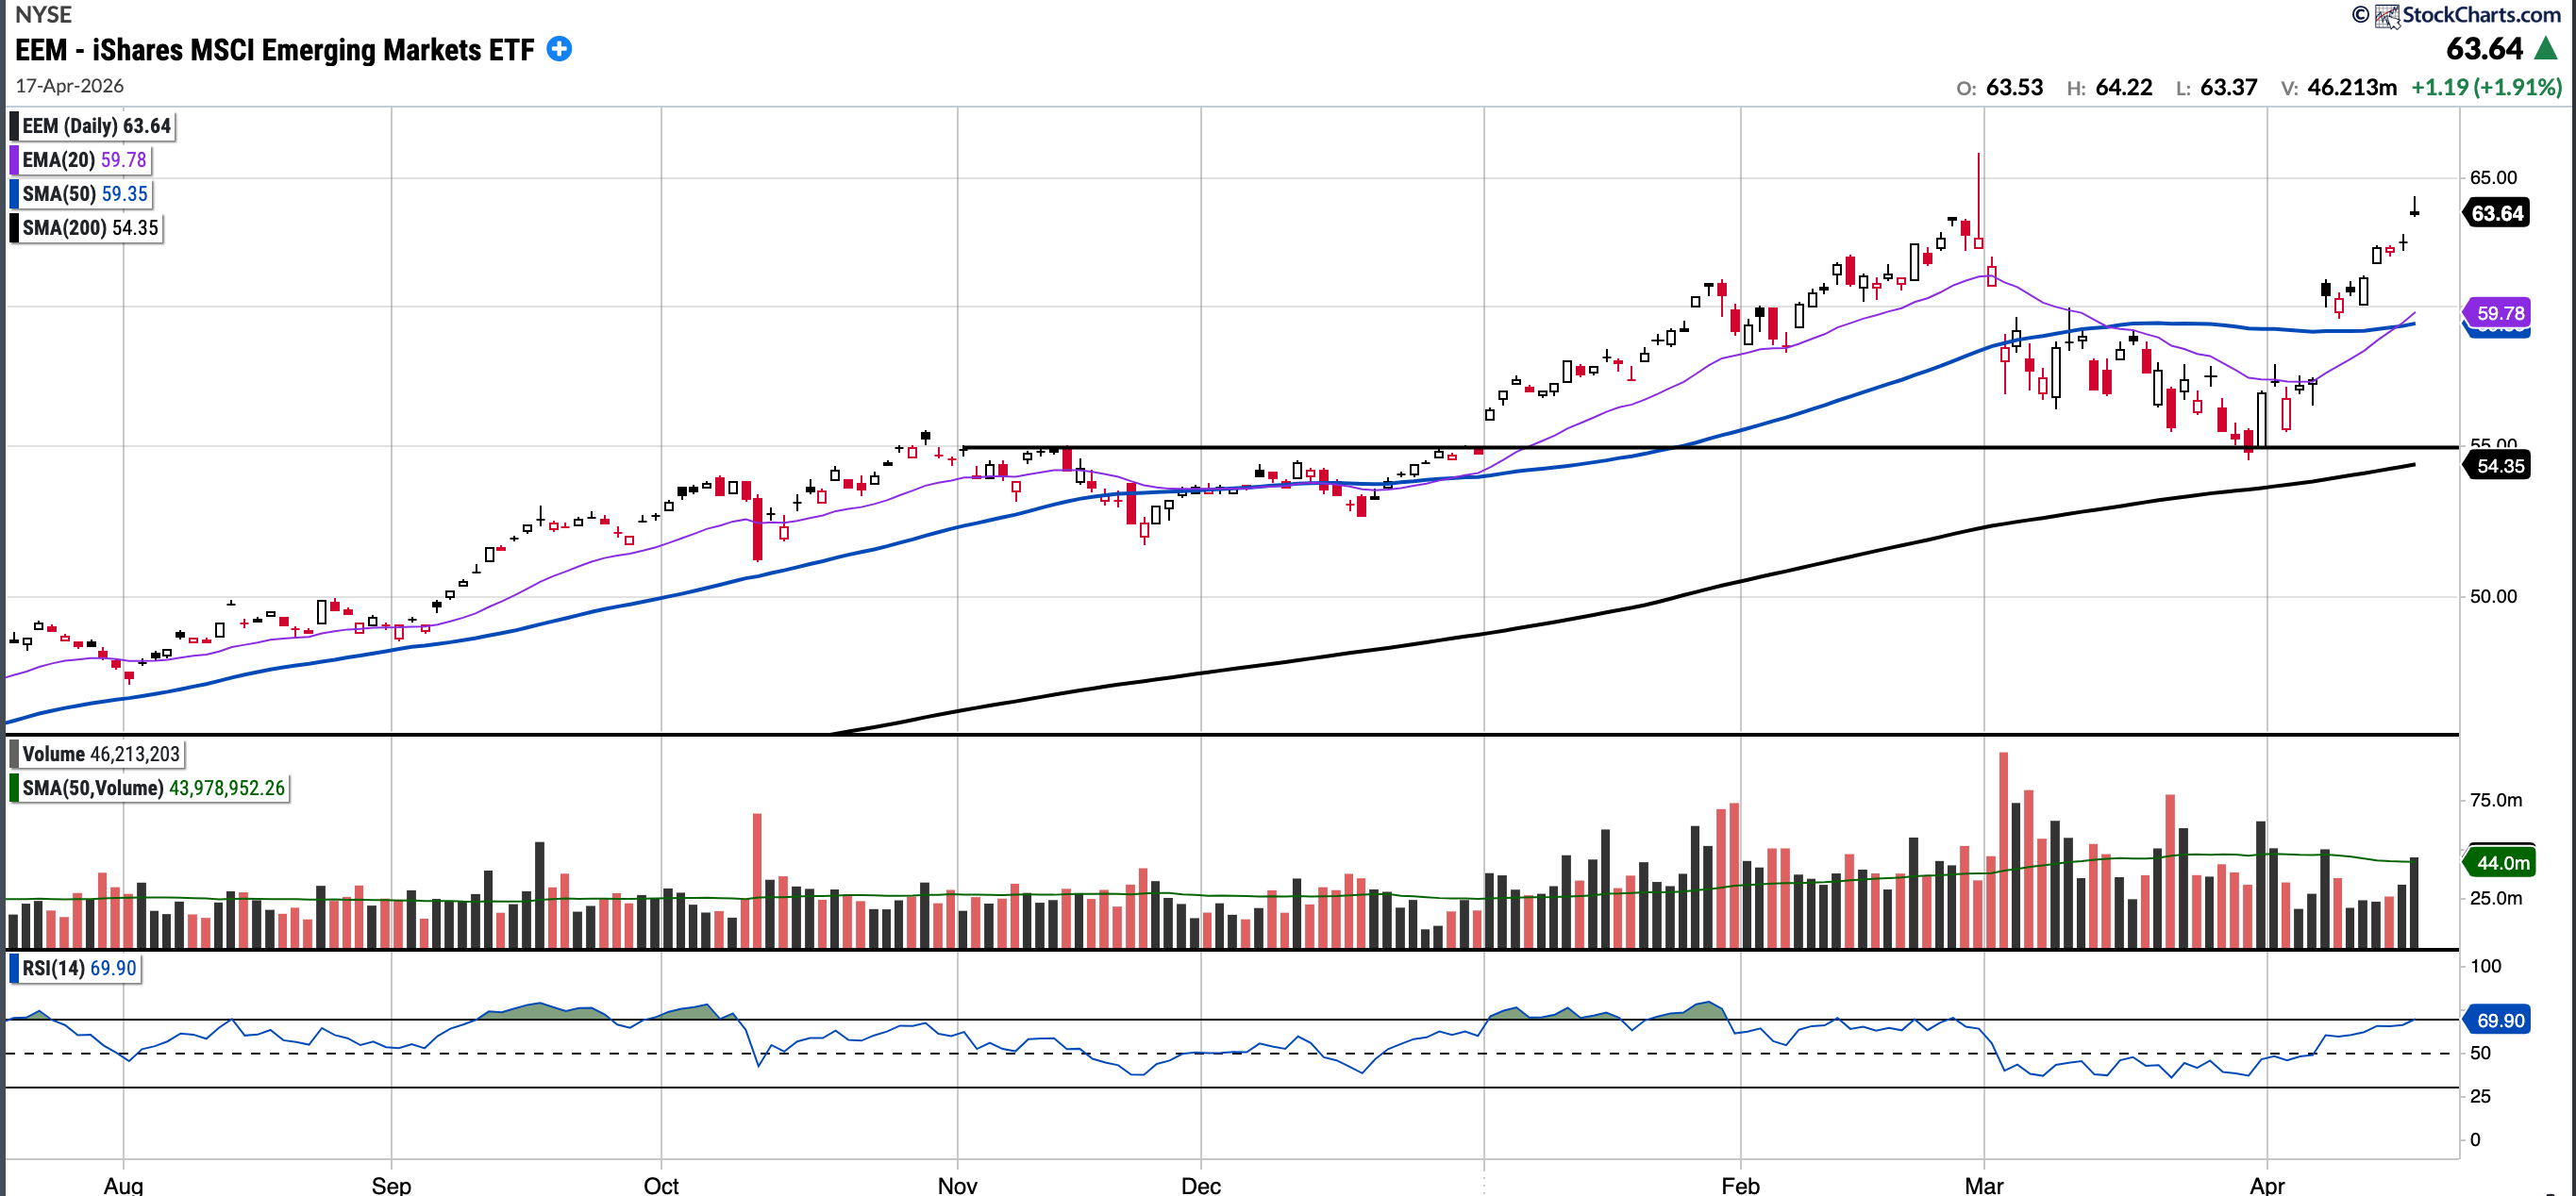
EEM
Currently trades at $63.64, 7.22% above the 50SMA and 17.1% above the 200SMA
RSI 69.9
+13.16% YTD
EEM remains in a strong uptrend and continues to outperform U.S. indices comfortably year-to-date by more than 900 bps.
The levels to watch for pullback buys are the SMA at 59.35 and then $55.00 (horizontal support). I do not expect it to trade as low as $55 again unless there are significant disturbances in the Middle East. I believe EEM could be setting up for multi-year outperformance; hence, I continue to watch it closely.
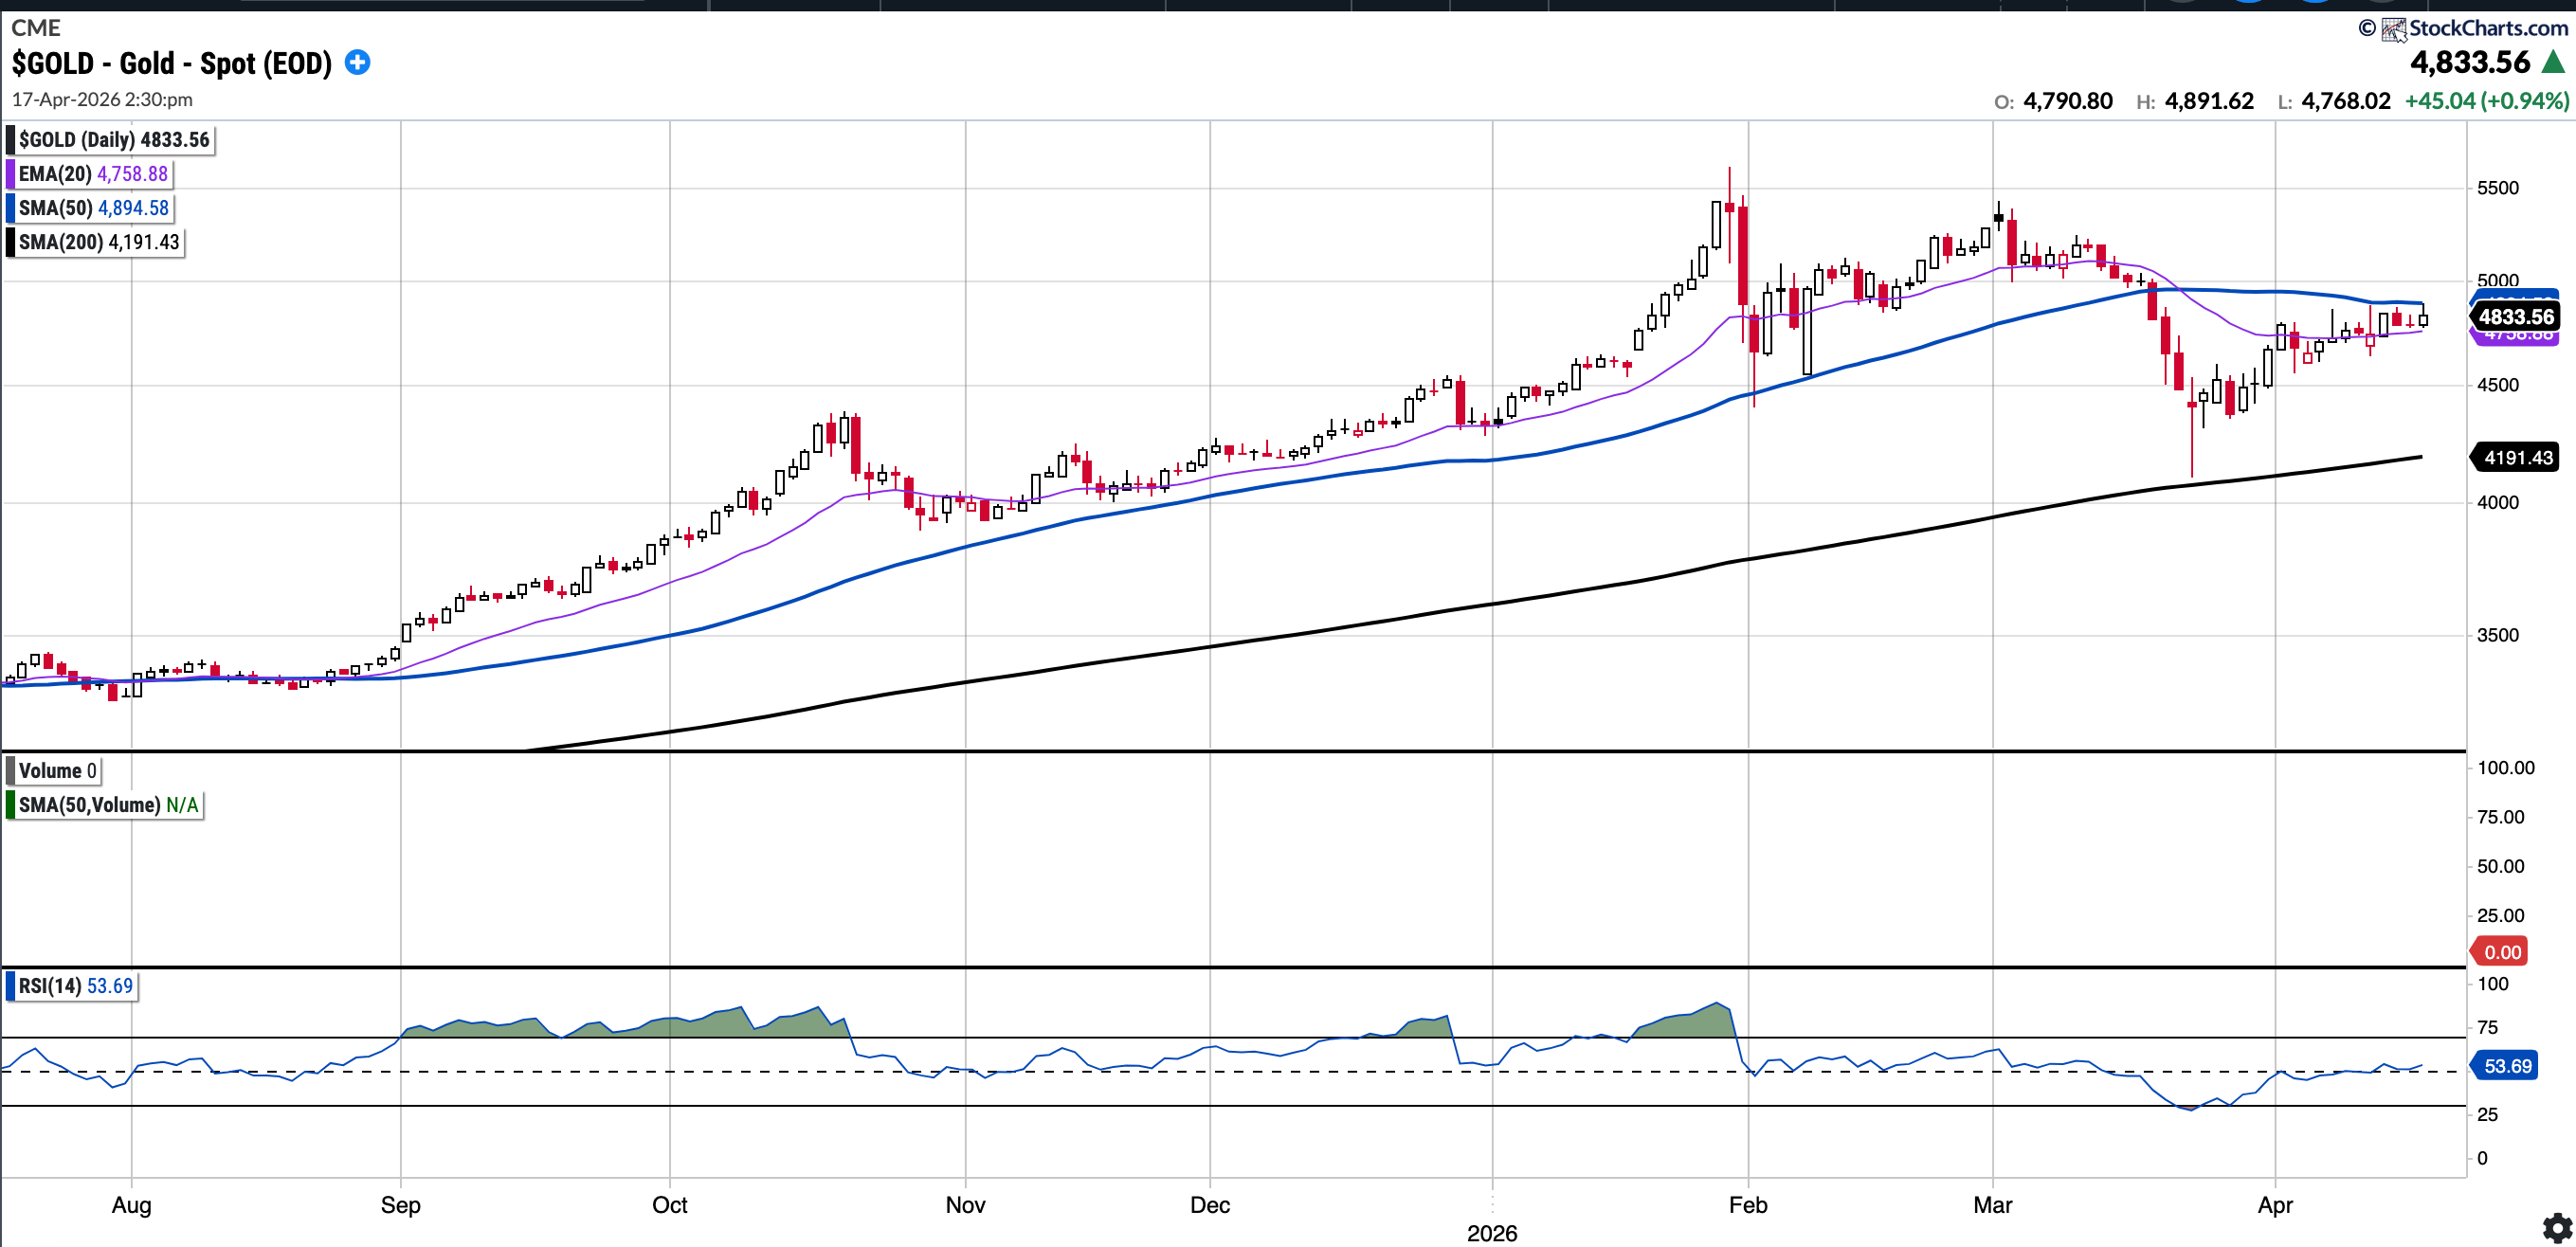
GOLD (Long Physical)
Currently trades at $4833, 1.25% below the 50SMA and 15.32% above the 200SMA
RSI 53.69
11.82% YTD
Gold remains in an uptrend, though we have started to consolidate below the overhead SMA 50, which is serving as a resistance level.
AMD
Currently trades at $278.39, 31.23% above the 50SMA and 37.51% above the 200SMA
RSI 80.2
+24.58% YTD
Last week about AMD I had written:
AMD continues to show good strength; however, since semis are very overbought right now, I would not be surprised to see some backfill and perhaps a test of the SMA 50 or even the SMA 200 again.
Instead of pulling back, in fact, AMD broke out to make new all-time highs! It remains overbought, but the strength in AMD and the CPU space is evident.
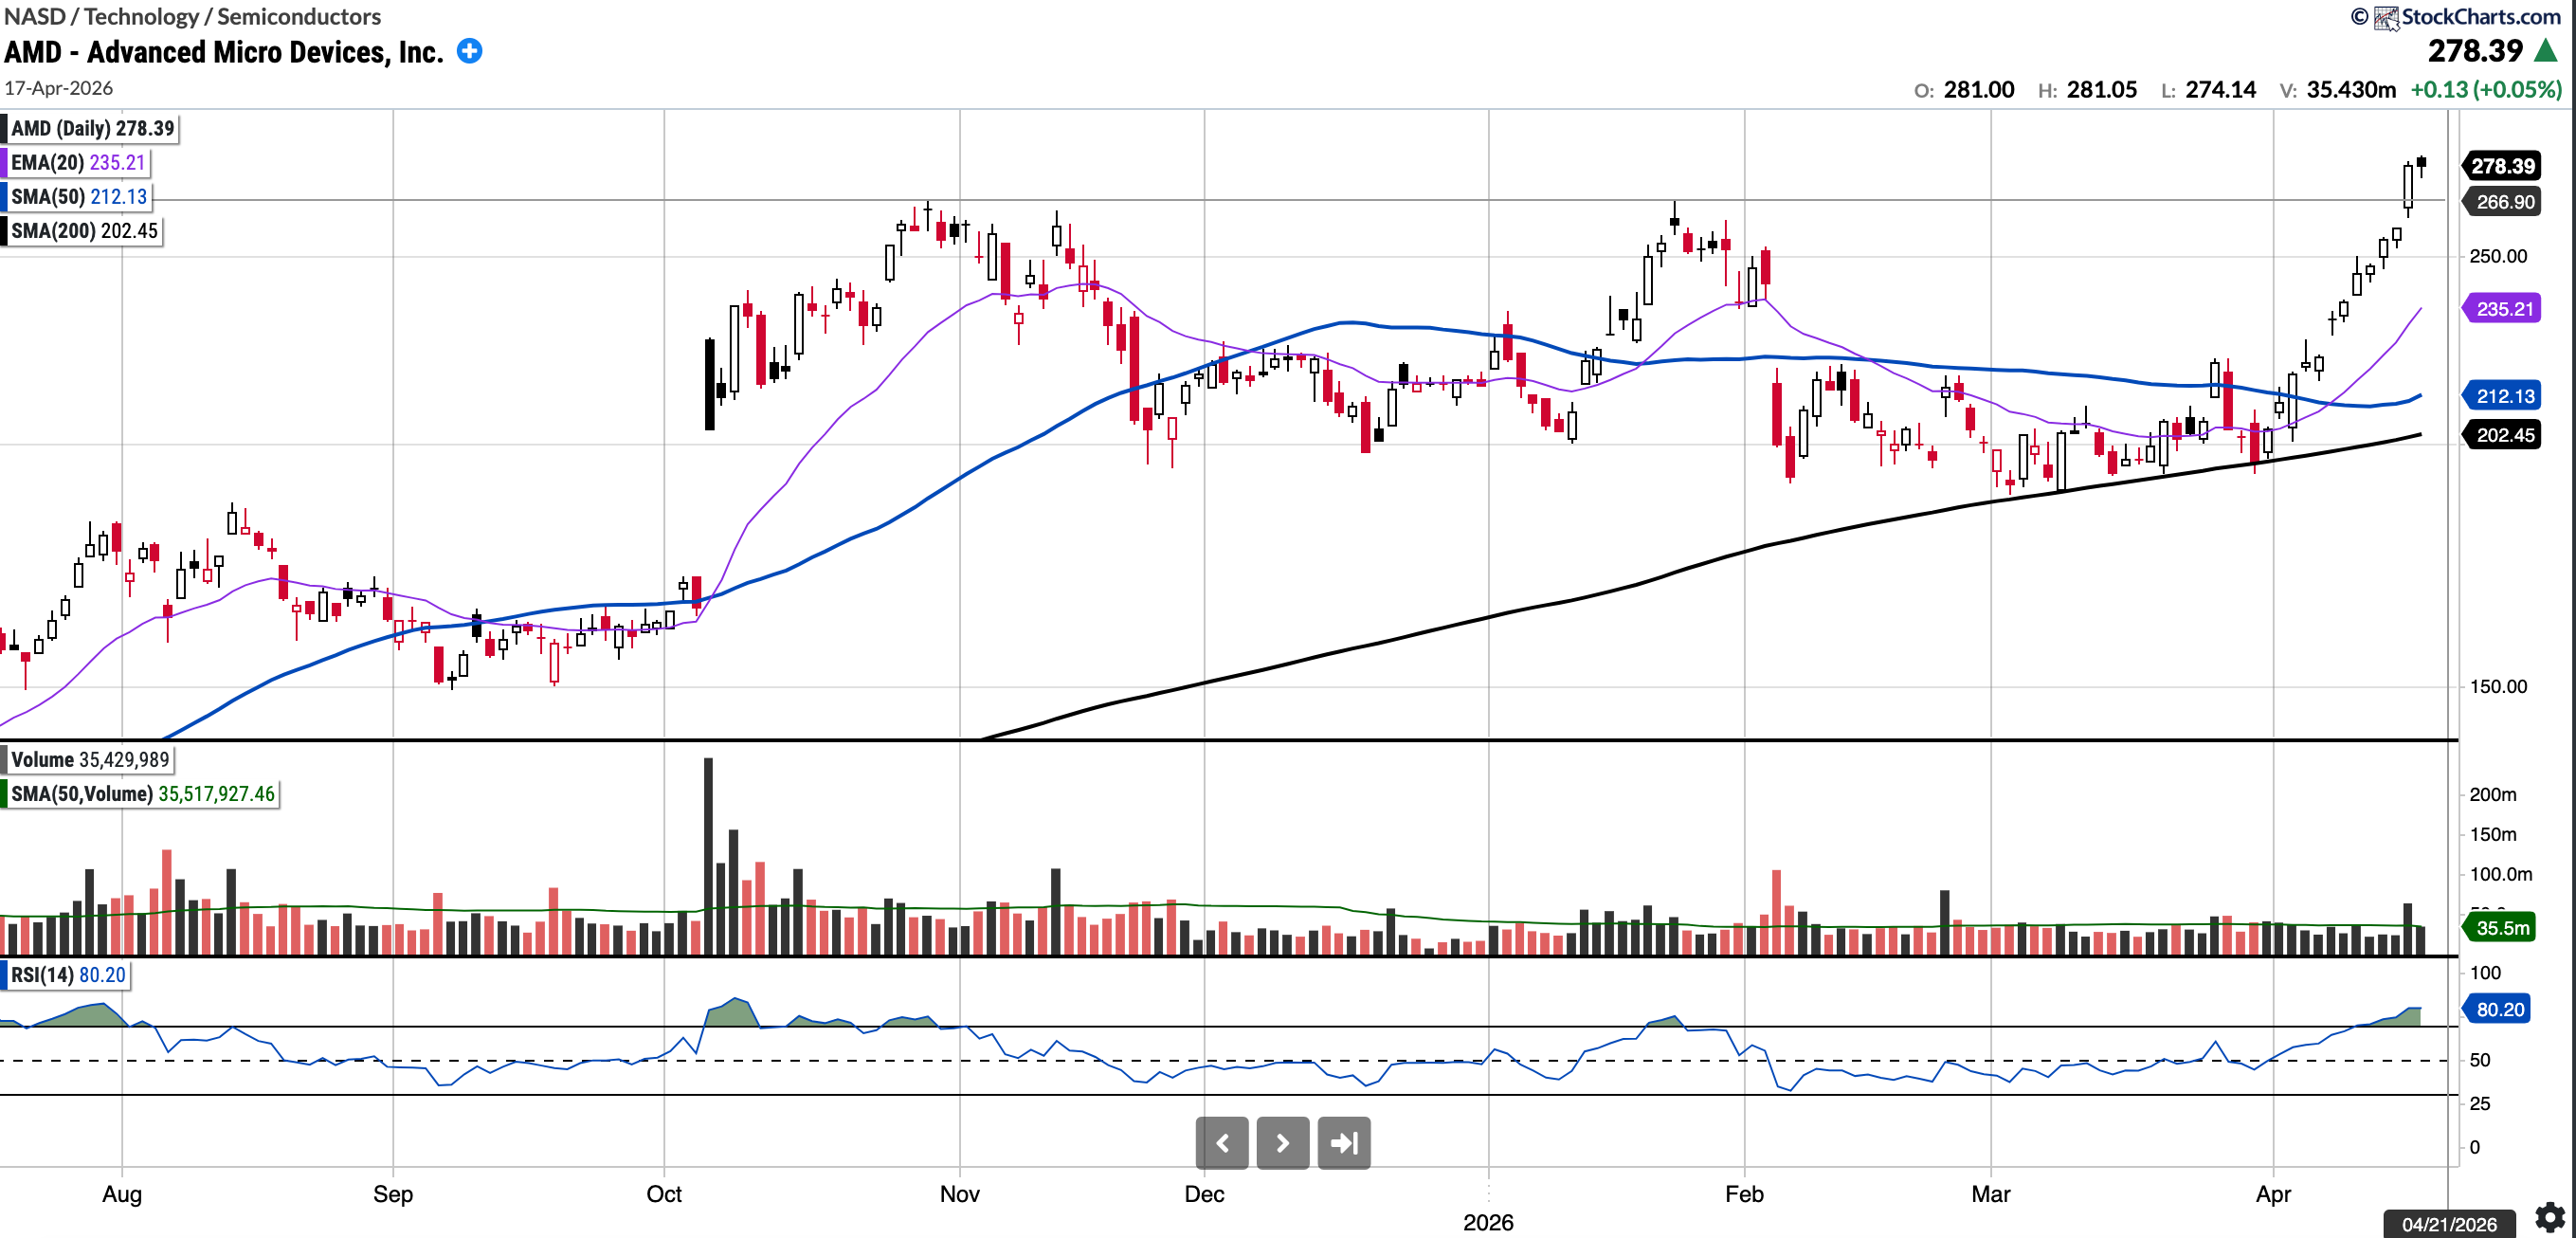
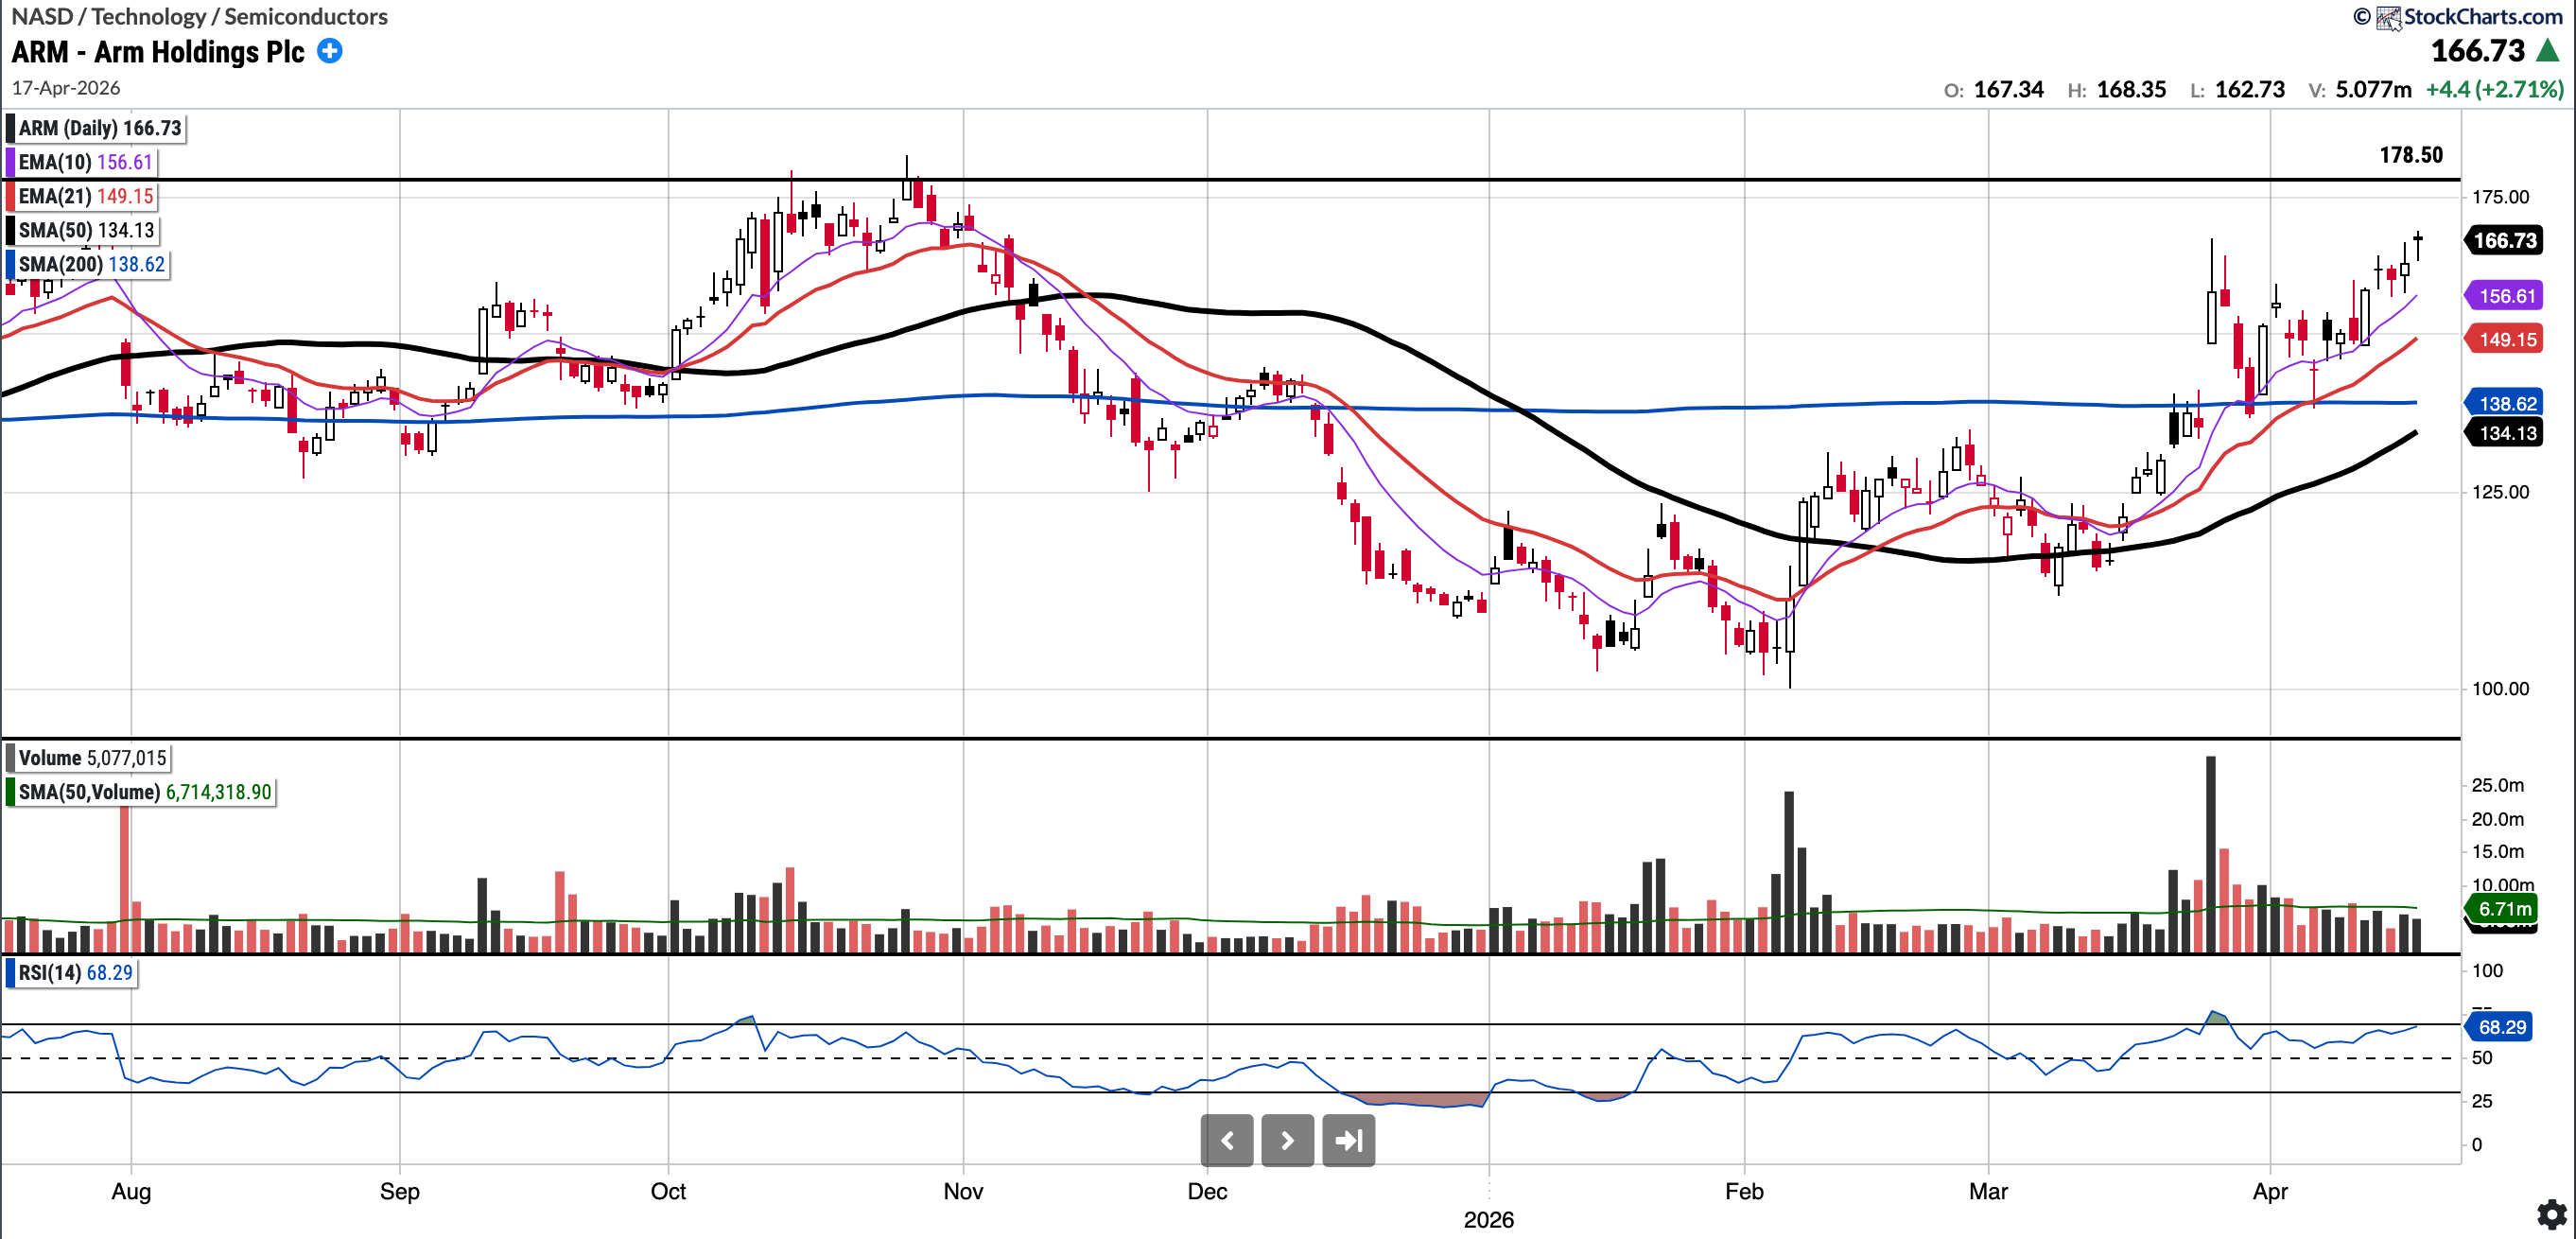
The ARM chart is also included below, which again has a very bullish structure. Though it is yet to break out to all time highs.
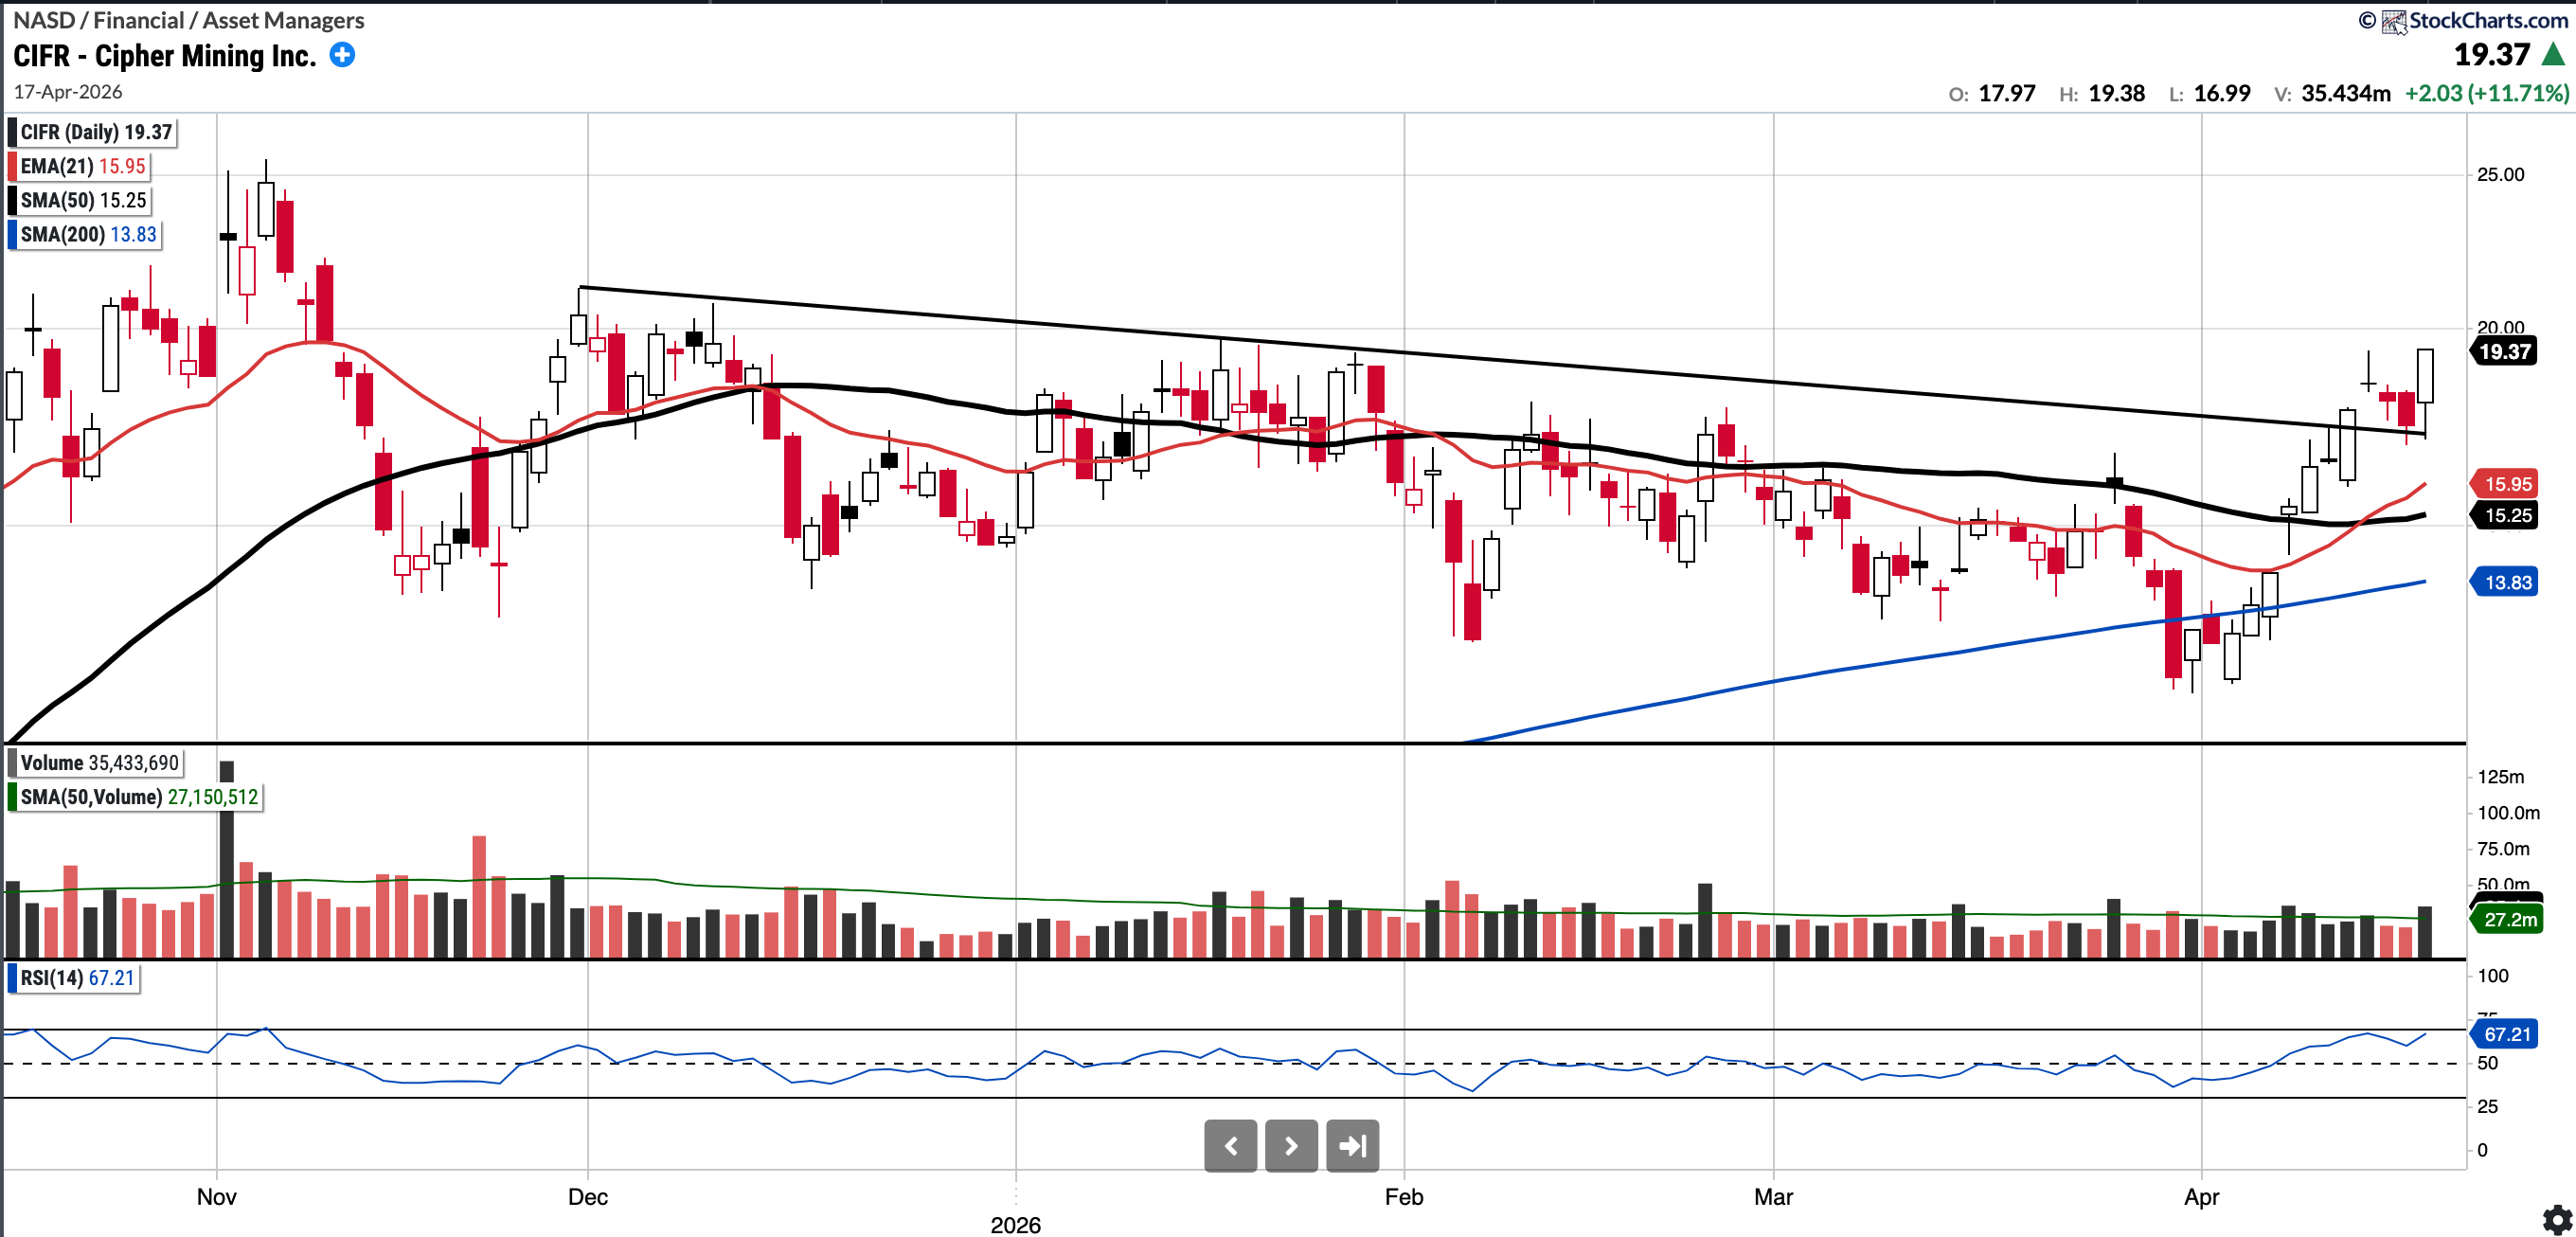
CIFR
Currently trades at $19.37, 27.05% above the 50SMA and 40.04% above the 200SMA
RSI 67.21
19.57% YTD
Last week about CIFR I had written:
CIFR chart is included below and it could be interesting either on a breakout above the trend-line or on pullback to find support at the moving averages.
CIFR ended up breaking out above the trend line on Monday and then flipped that to support. In hindsight, it gave at least three opportunities to buy: once on the breakout and then on the two retests. It remains on my watchlist as it is one of my favourite DC plays.
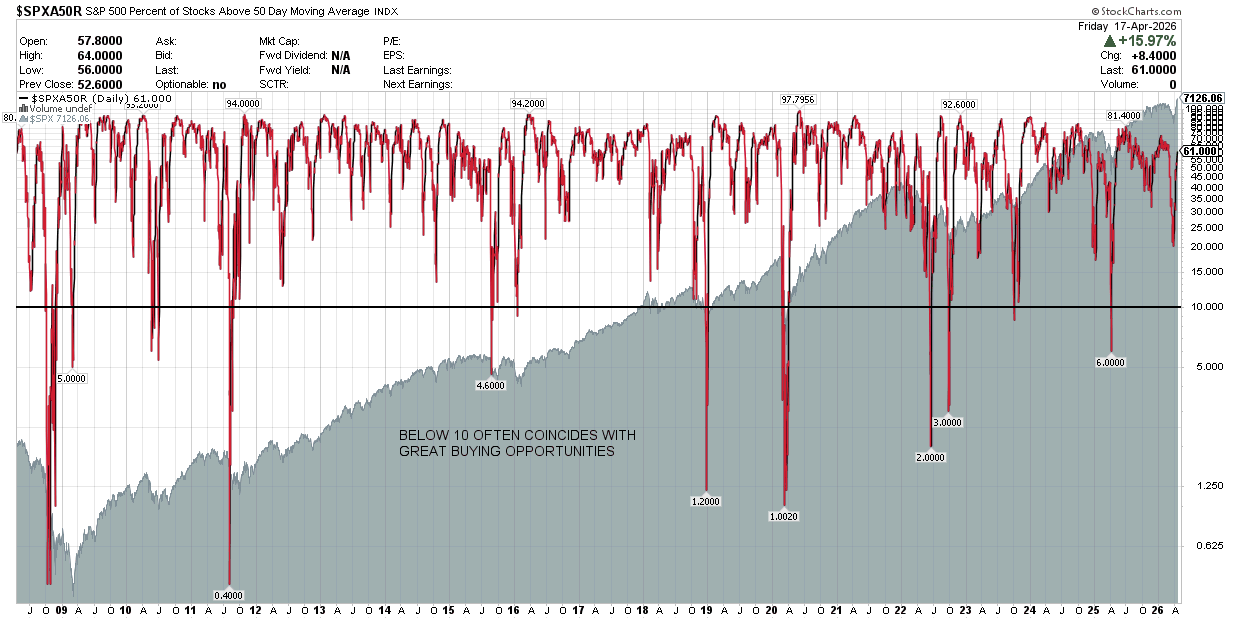
S&P 500 Percentage of Stocks Above the 50 Day Moving Average: Currently 61
Readings below 10 tend to be fantastic buying opportunities. We did get to 20 at the recent pico low on the SPX.
Notable portfolio changes in previous week (all updated live in subscriber channels):
