
Preview of the Week Ahead: W/C April 27, 2026
SPX Closes at Another All-Time High; Semis Most Overbought in History

Hope you all are having a good weekend. Below, we will be previewing the upcoming week’s events and providing a portfolio update as usual.
Format for what is covered in this weekly preview:
A Look at the Indices
Key Upcoming Economic Events
Upcoming Earnings Reports
Charts
Notable Portfolio Changes from the Previous Week
Current Portfolio Holdings
Position size, cost basis, and commentary on each holding regarding the intended holding period and any planned activity
Closing Thoughts
I recommend checking out the latest Monthly Portfolio and Performance Update below:

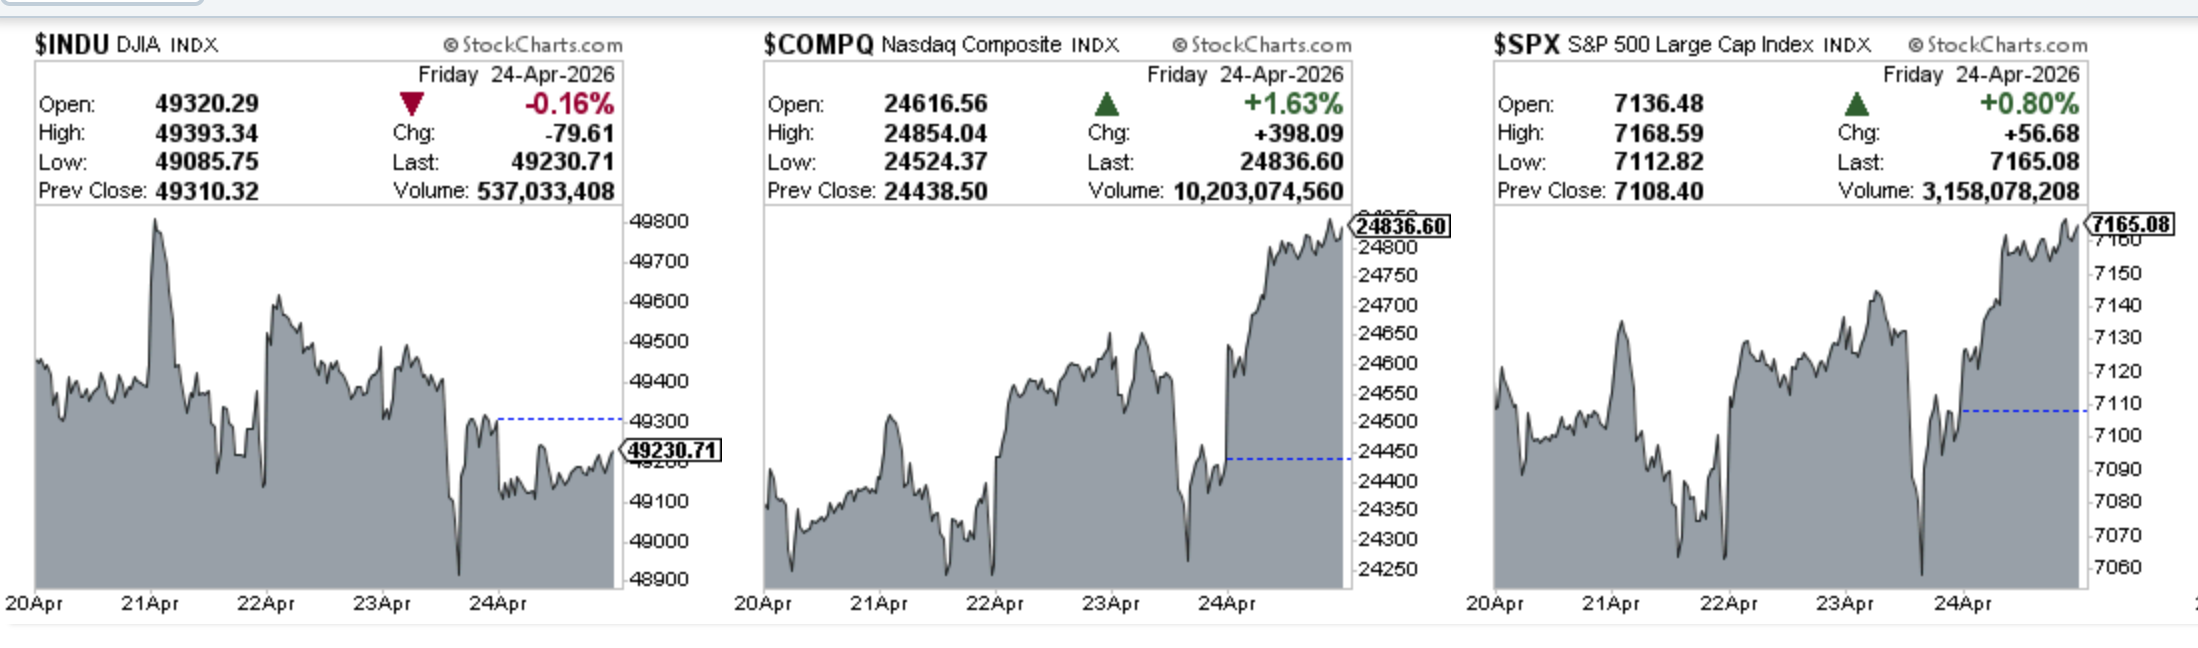
Indices
Dow Jones declined 0.37% in the last week
S&P 500 advanced 0.7% in the last week
Nasdaq Composite advanced 1.66% in the last week
IWM advanced 0.68% in the last week
Key upcoming economic events
Monday, April 27
Dallas Fed Manufacturing Index (9:30 AM ET)
Treasury Auctions
Tuesday, April 28
FOMC Meeting – Day 1
Consumer Confidence Index (10:00 AM ET)
Housing Vacancies & Homeownership (10:00 AM ET)
Wednesday, April 29
Durable Goods Orders (8:30 AM ET):
FOMC Interest Rate Decision (2:00 PM ET): The headline event.
Fed Press Conference (2:30 PM ET)
Earnings: Microsoft, Alphabet, Meta, and Amazon all report after the market close.
Thursday, April 30
Q1 2026 GDP - Advance Estimate (8:30 AM ET)
PCE Price Index - March (8:30 AM ET)
Employment Cost Index - Q1 (8:30 AM ET)
Weekly Jobless Claims (8:30 AM ET)
Friday, May 1
ISM Manufacturing PMI (10:00 AM ET)
Market Holiday Note: U.S. markets are open though many global exchanges (Europe, UK, China) will be closed for Labor Day/May Day, which may result in lower liquidity during the morning session
Upcoming Earnings
Below is the infographic by Earnings Whispers highlighting the schedule for this week:

Charts
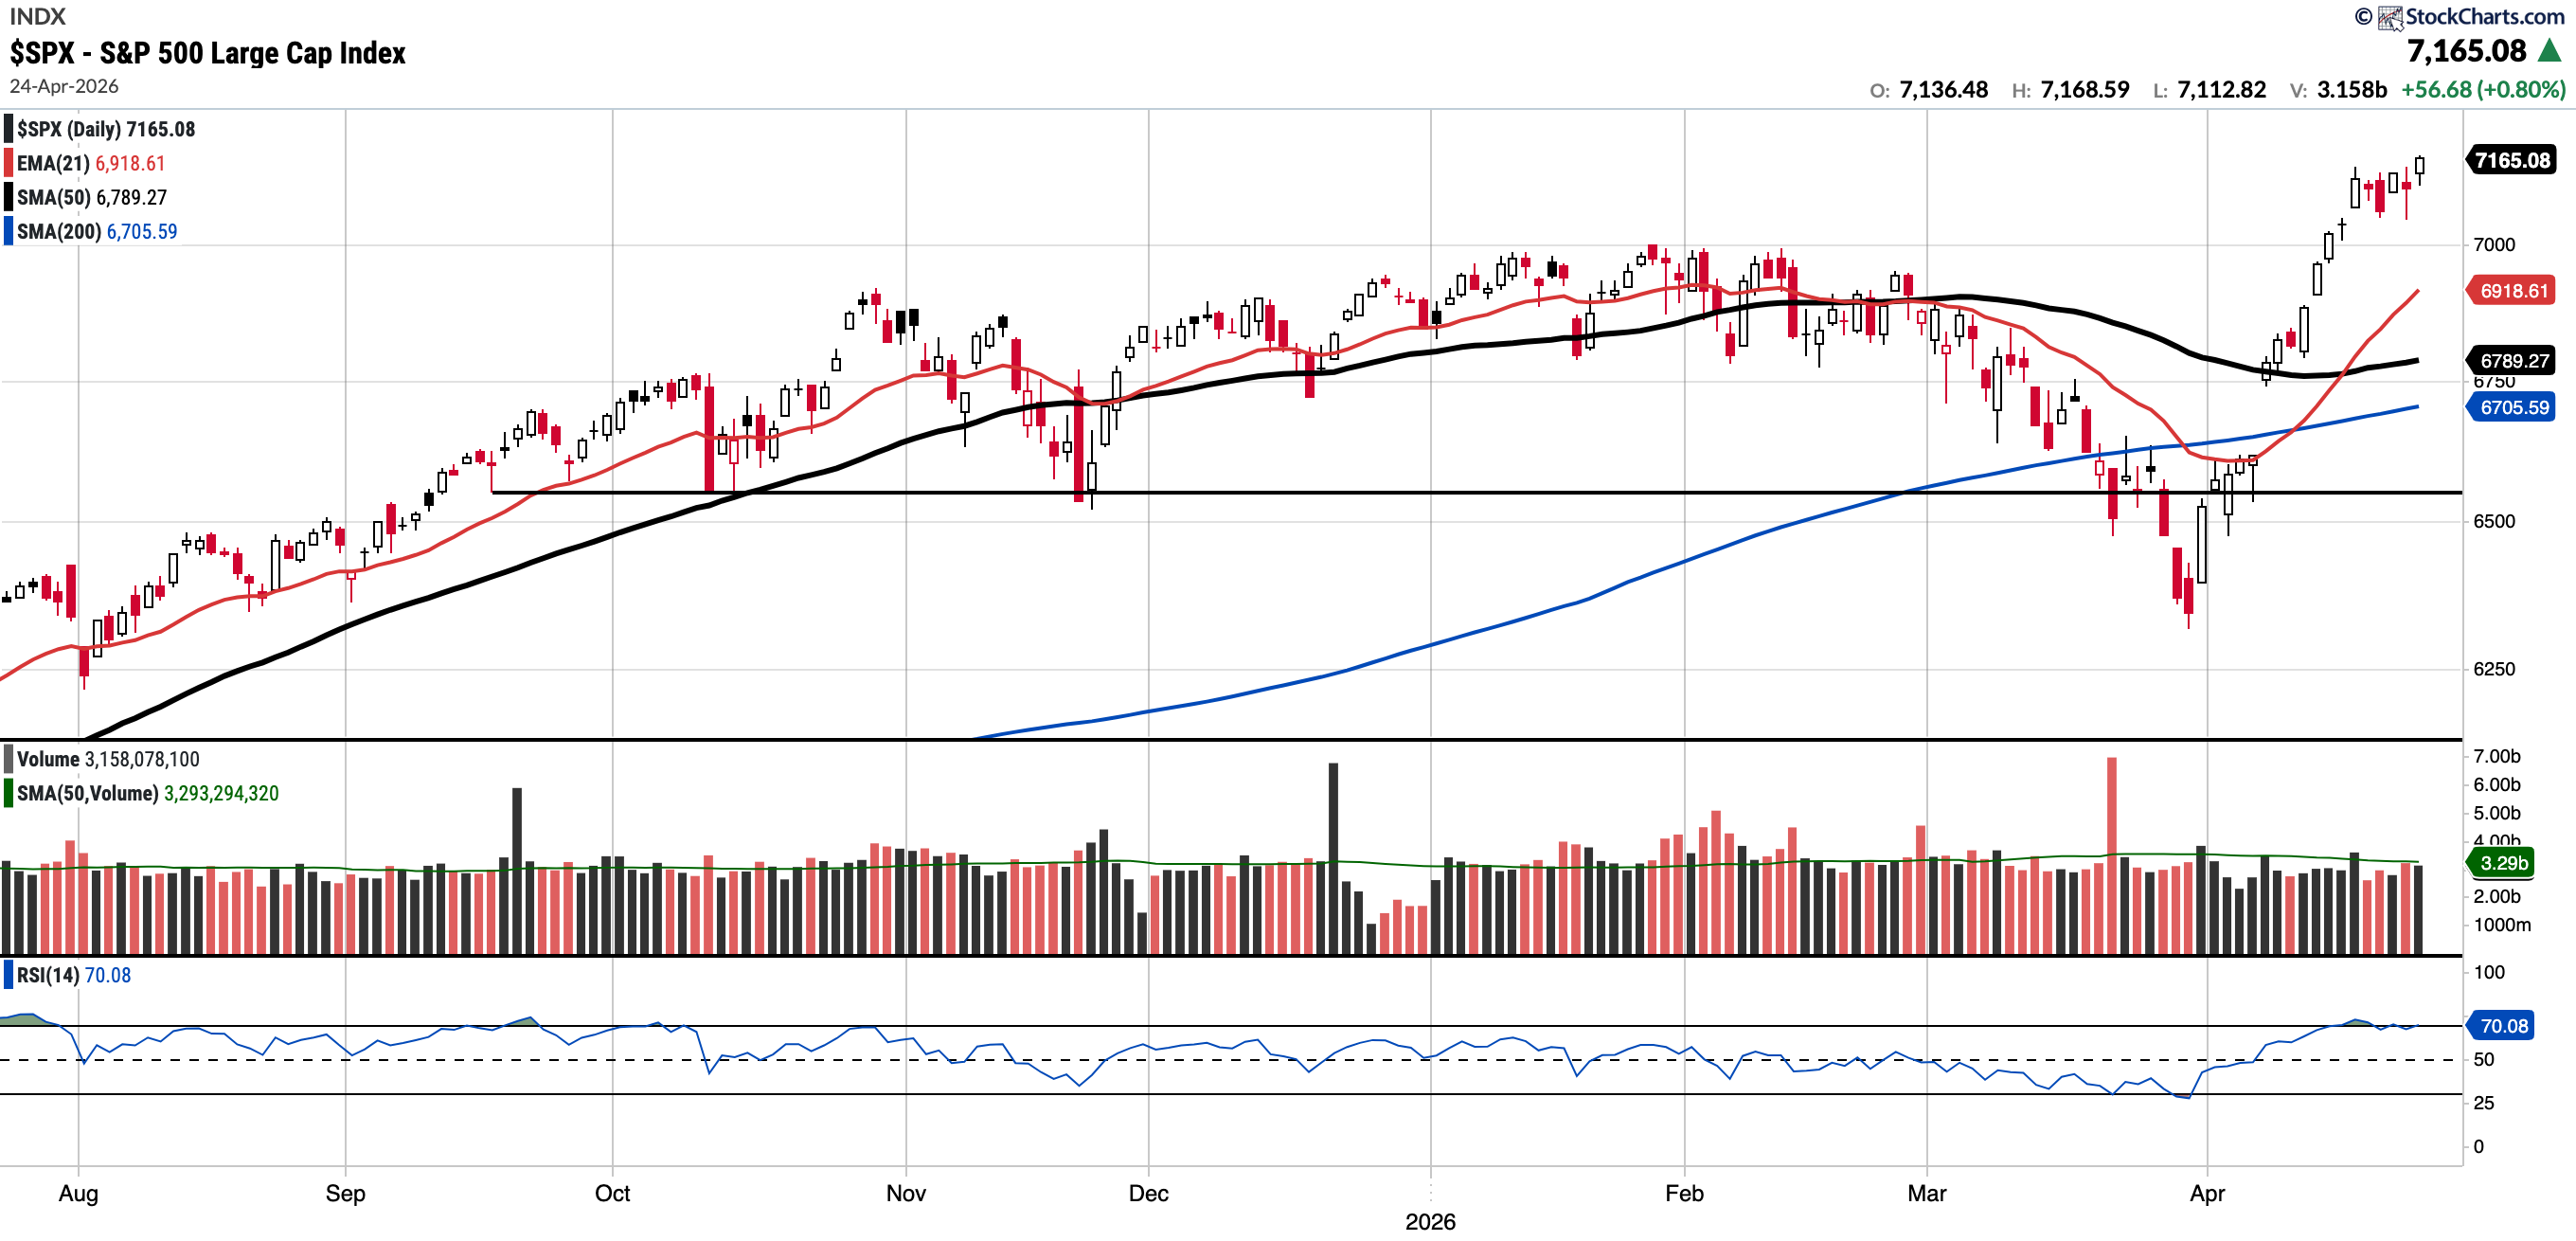
SPX
Currently trades at 7,165.08, 5.54% above the 50SMA and 6.85% above the 200SMA.
RSI 70.08
4.47% YTD
Distribution days in the last week: 2
The SPX reached an all-time high close, continuing the remarkable V-shaped recovery from the March 30 lows.
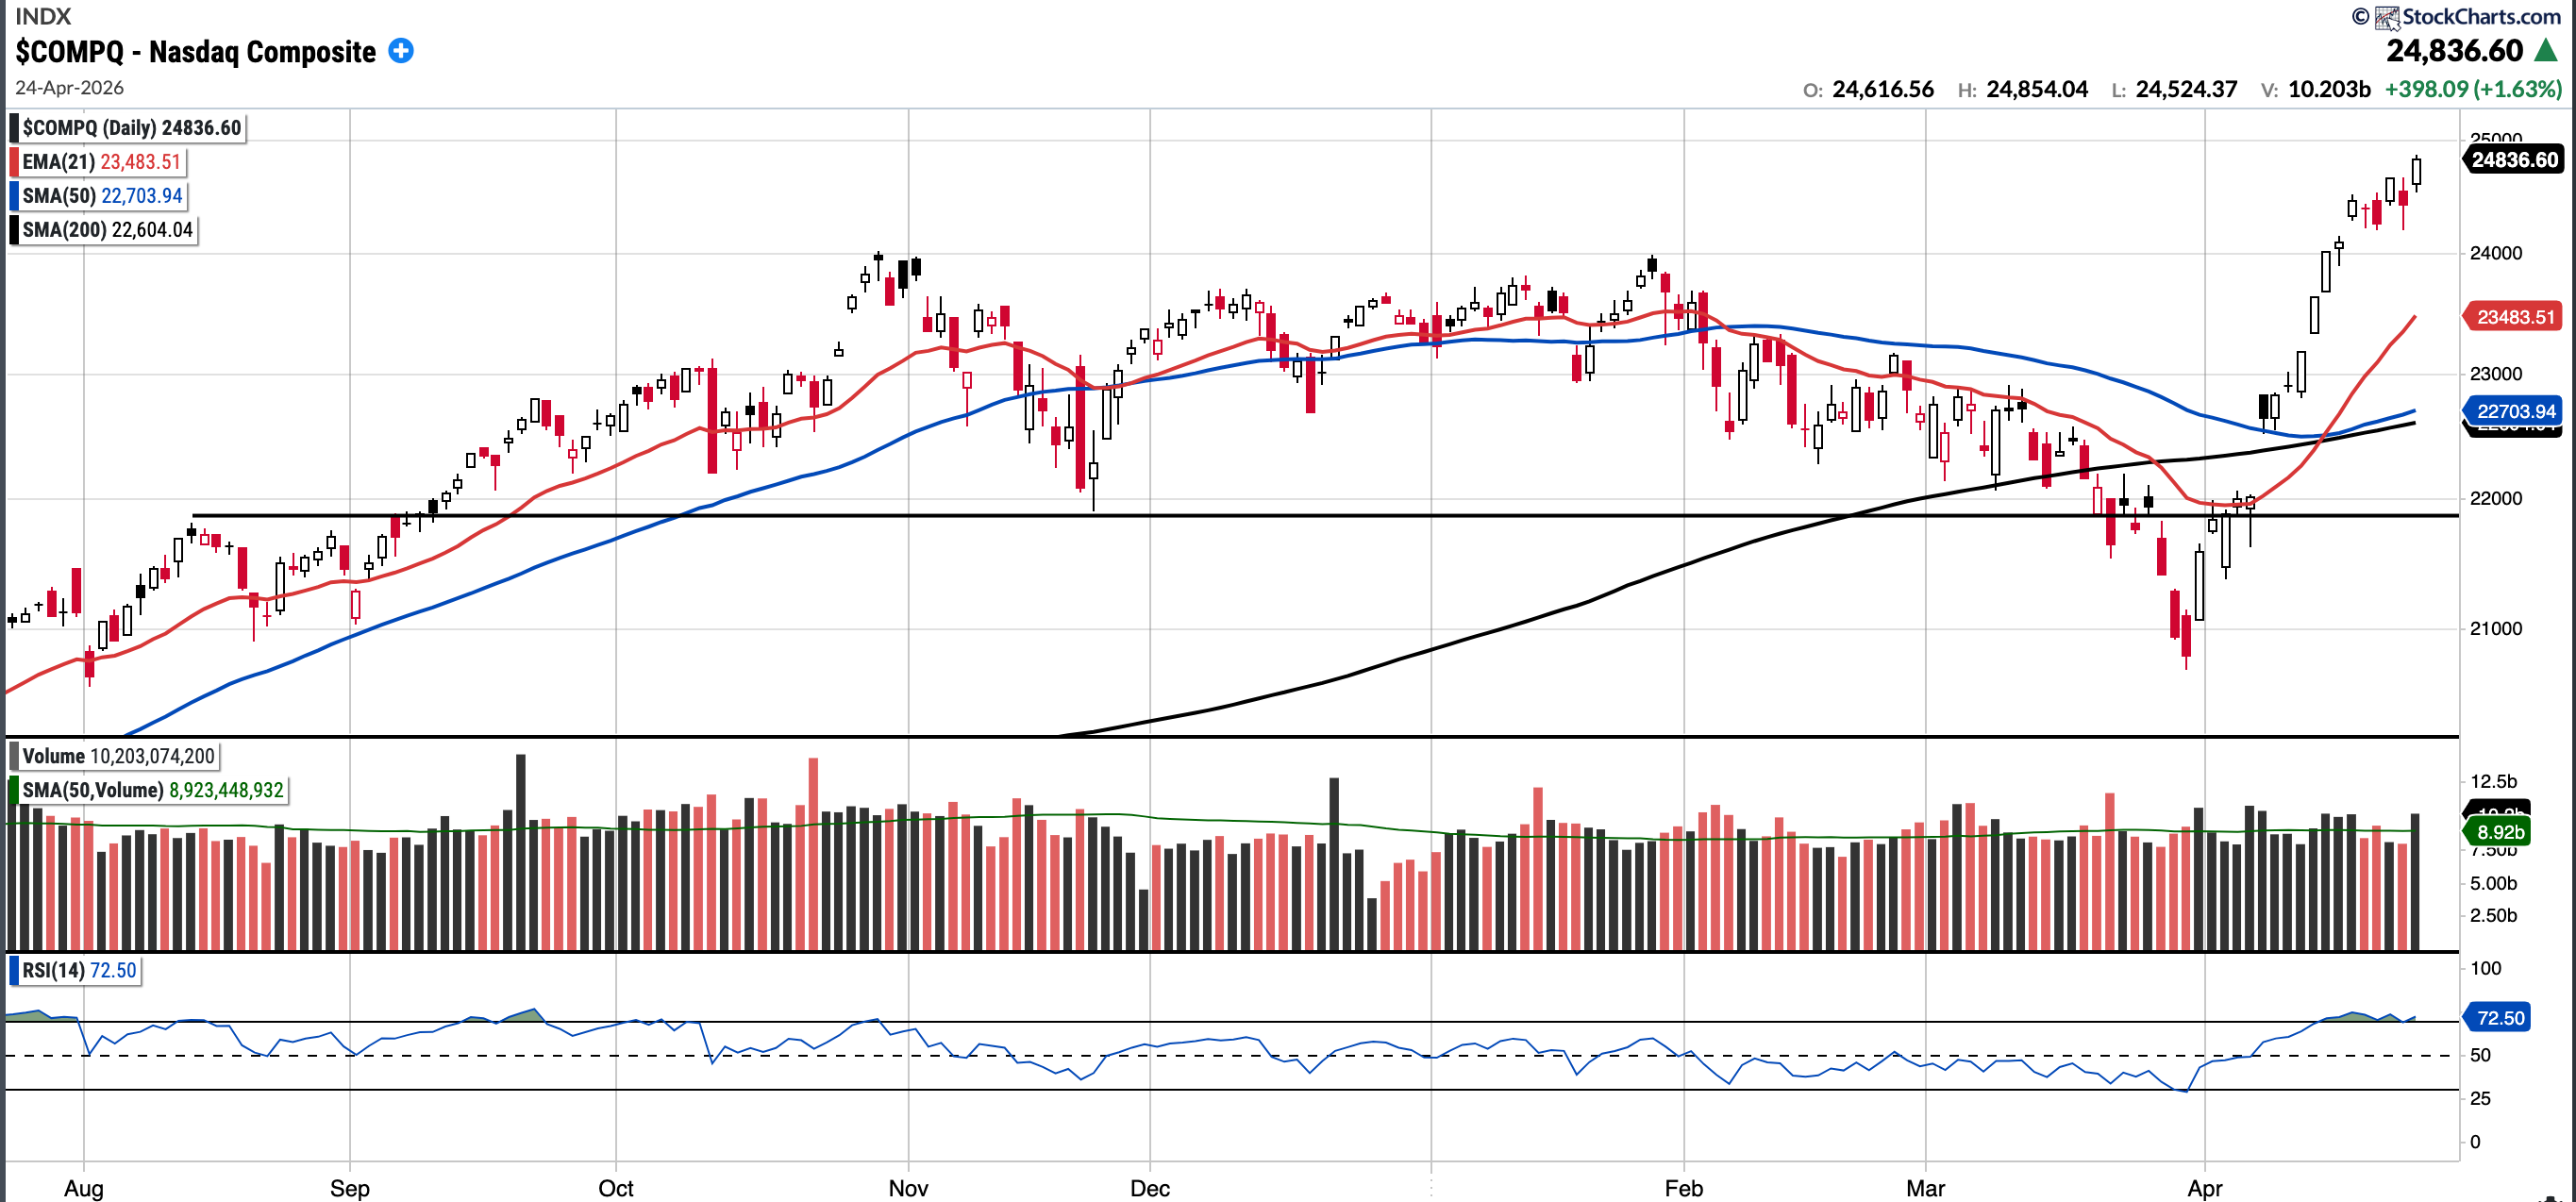
COMPQ
Currently trades at 24,836.6, 9.39% above the 50SMA and 9.88% above the 200SMA.
RSI 72.5
6.89% YTD
Distribution days in the last week: 1
The Nasdaq Composite finally snapped its streak of 13 consecutive weeks starting with two red days. However, like the SPX, it ended the week with an all-time high close. It remains quite extended, currently trading 9.39% above its 50-day SMA.
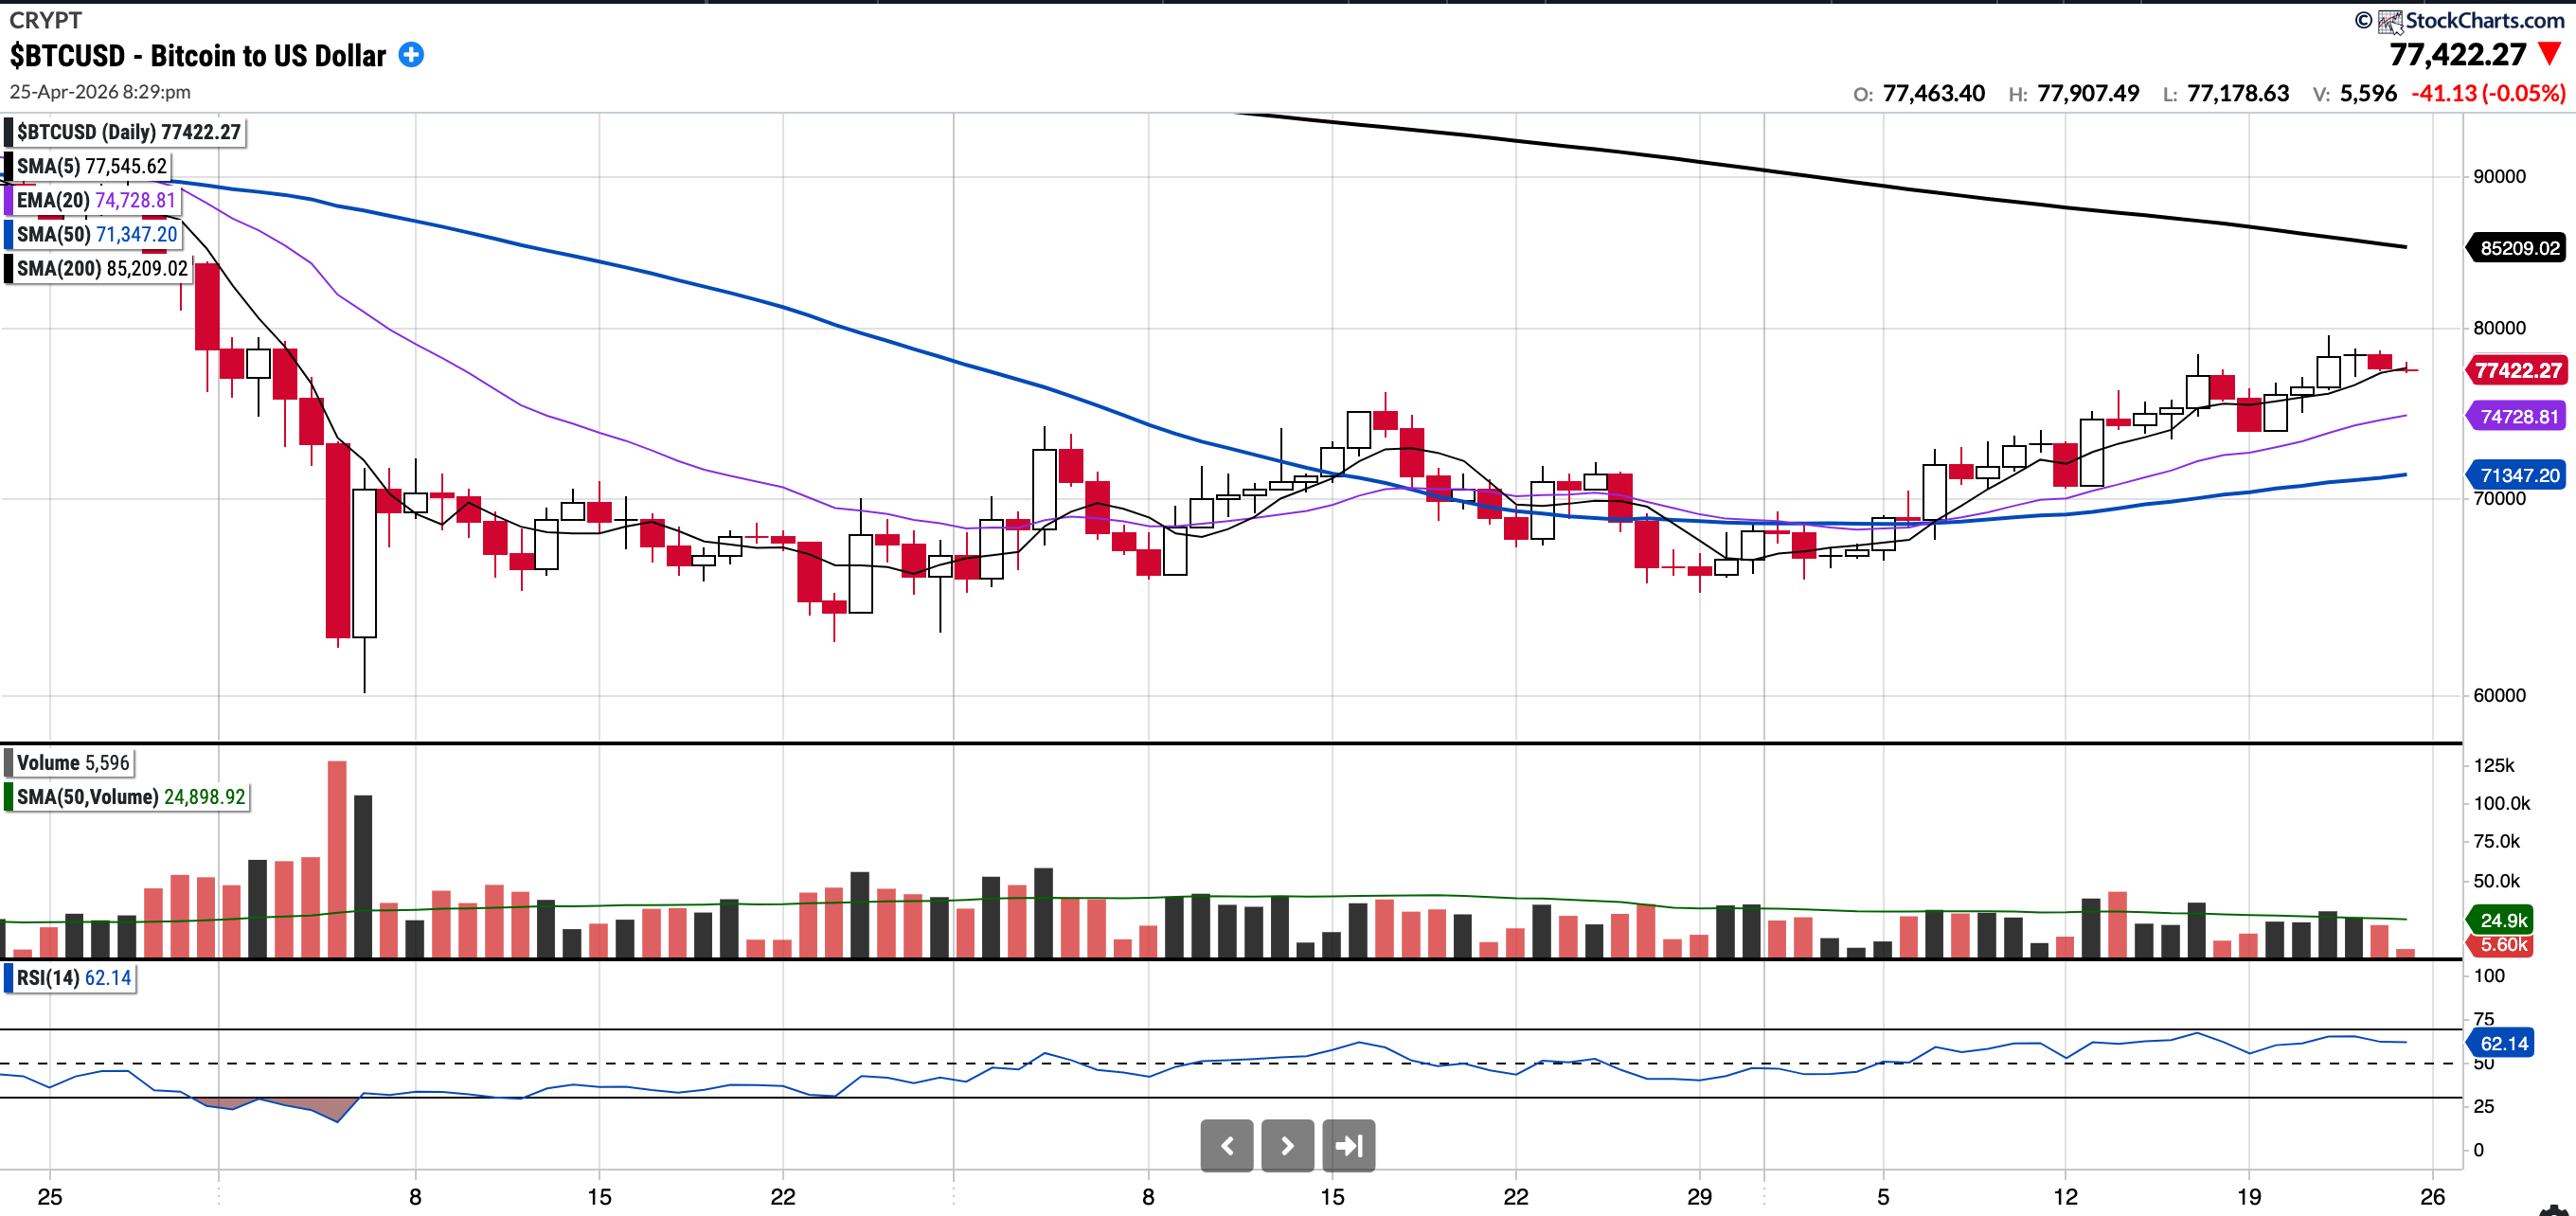
BTC (currently Long)
Currently trades at $77,422.27 8.51% above the 50SMA and 9% below the 200SMA.
RSI 62.14
-12.7% YTD.
Since testing the 200-week moving average on Thursday, February 5th, Bitcoin has traded primarily within the $63,000–$70,000 range.
However, we broke out of that range and traded as high as $79,900 this week. As of Saturday at 21:40 BST, BTC is trading above all near-term moving averages and remains above the $74,000 level, which I previously noted as a key area. Bulls want to see that level flipped into firm support now.
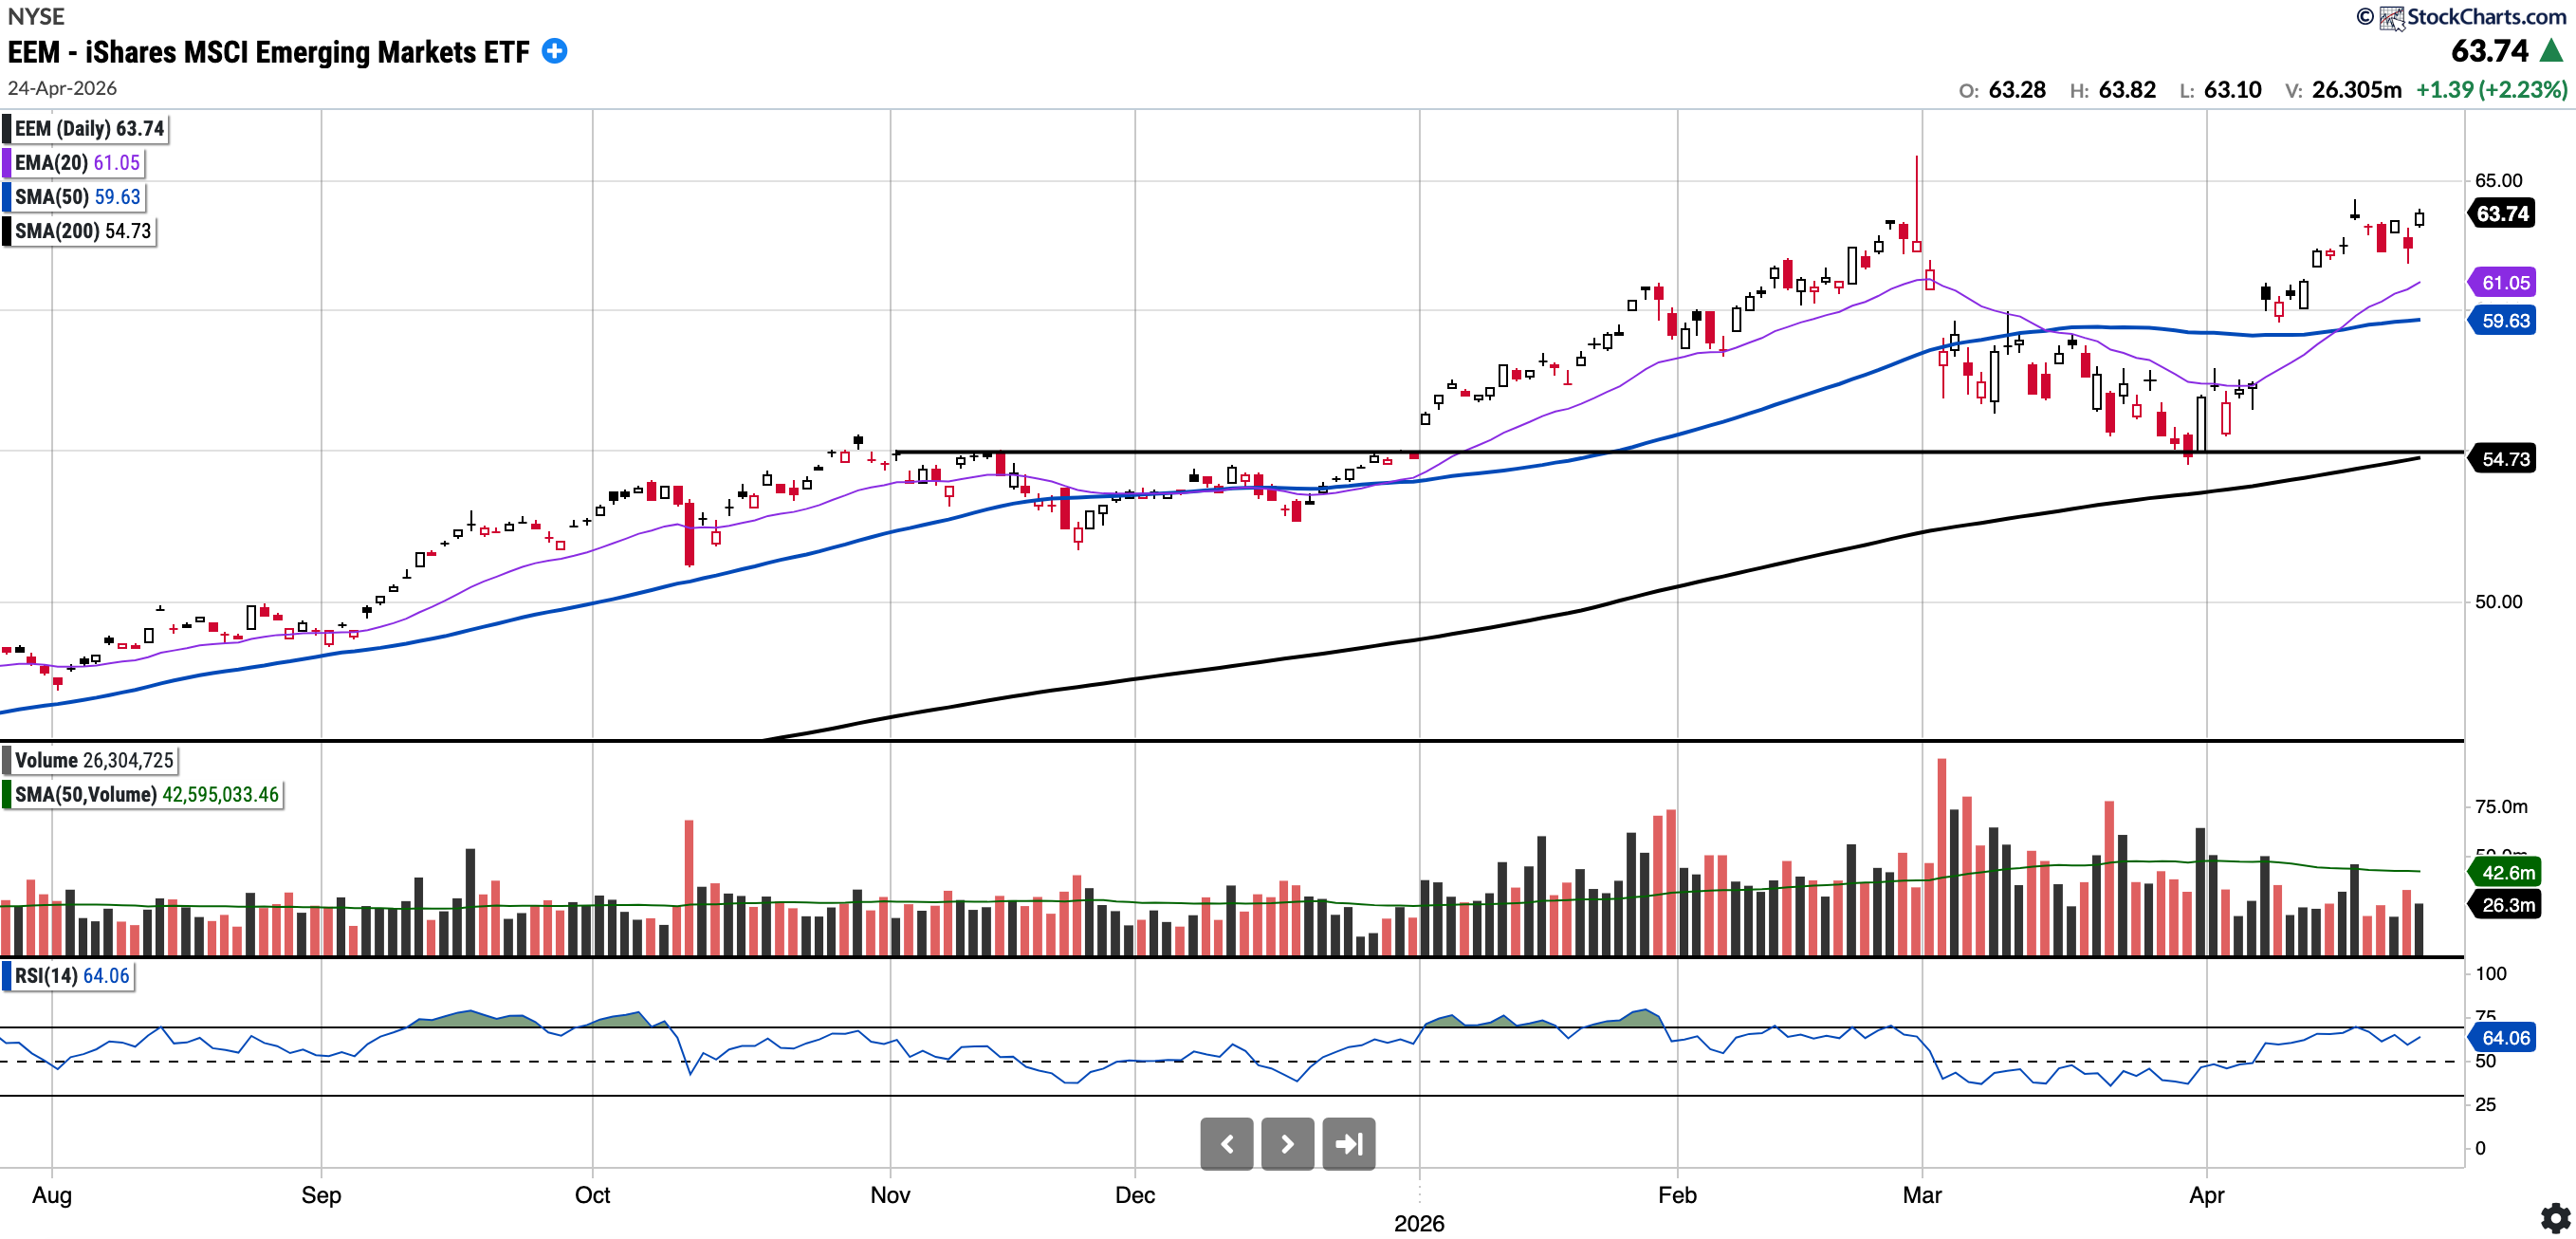
EEM
Currently trades at $63.74, 6.9% above the 50SMA and 16.46% above the 200SMA
RSI 64.06
+13.34% YTD
EEM remains in a strong uptrend and continues to outperform U.S. indices comfortably year-to-date by close to 900 bps.
The levels to watch for pullback buys are the SMA at 59.63 and then $55.00 (horizontal support). I do not expect it to trade as low as $55 again unless there are significant disturbances in the Middle East.
I believe EEM could be setting up for multi-year outperformance; hence, I continue to watch it closely.
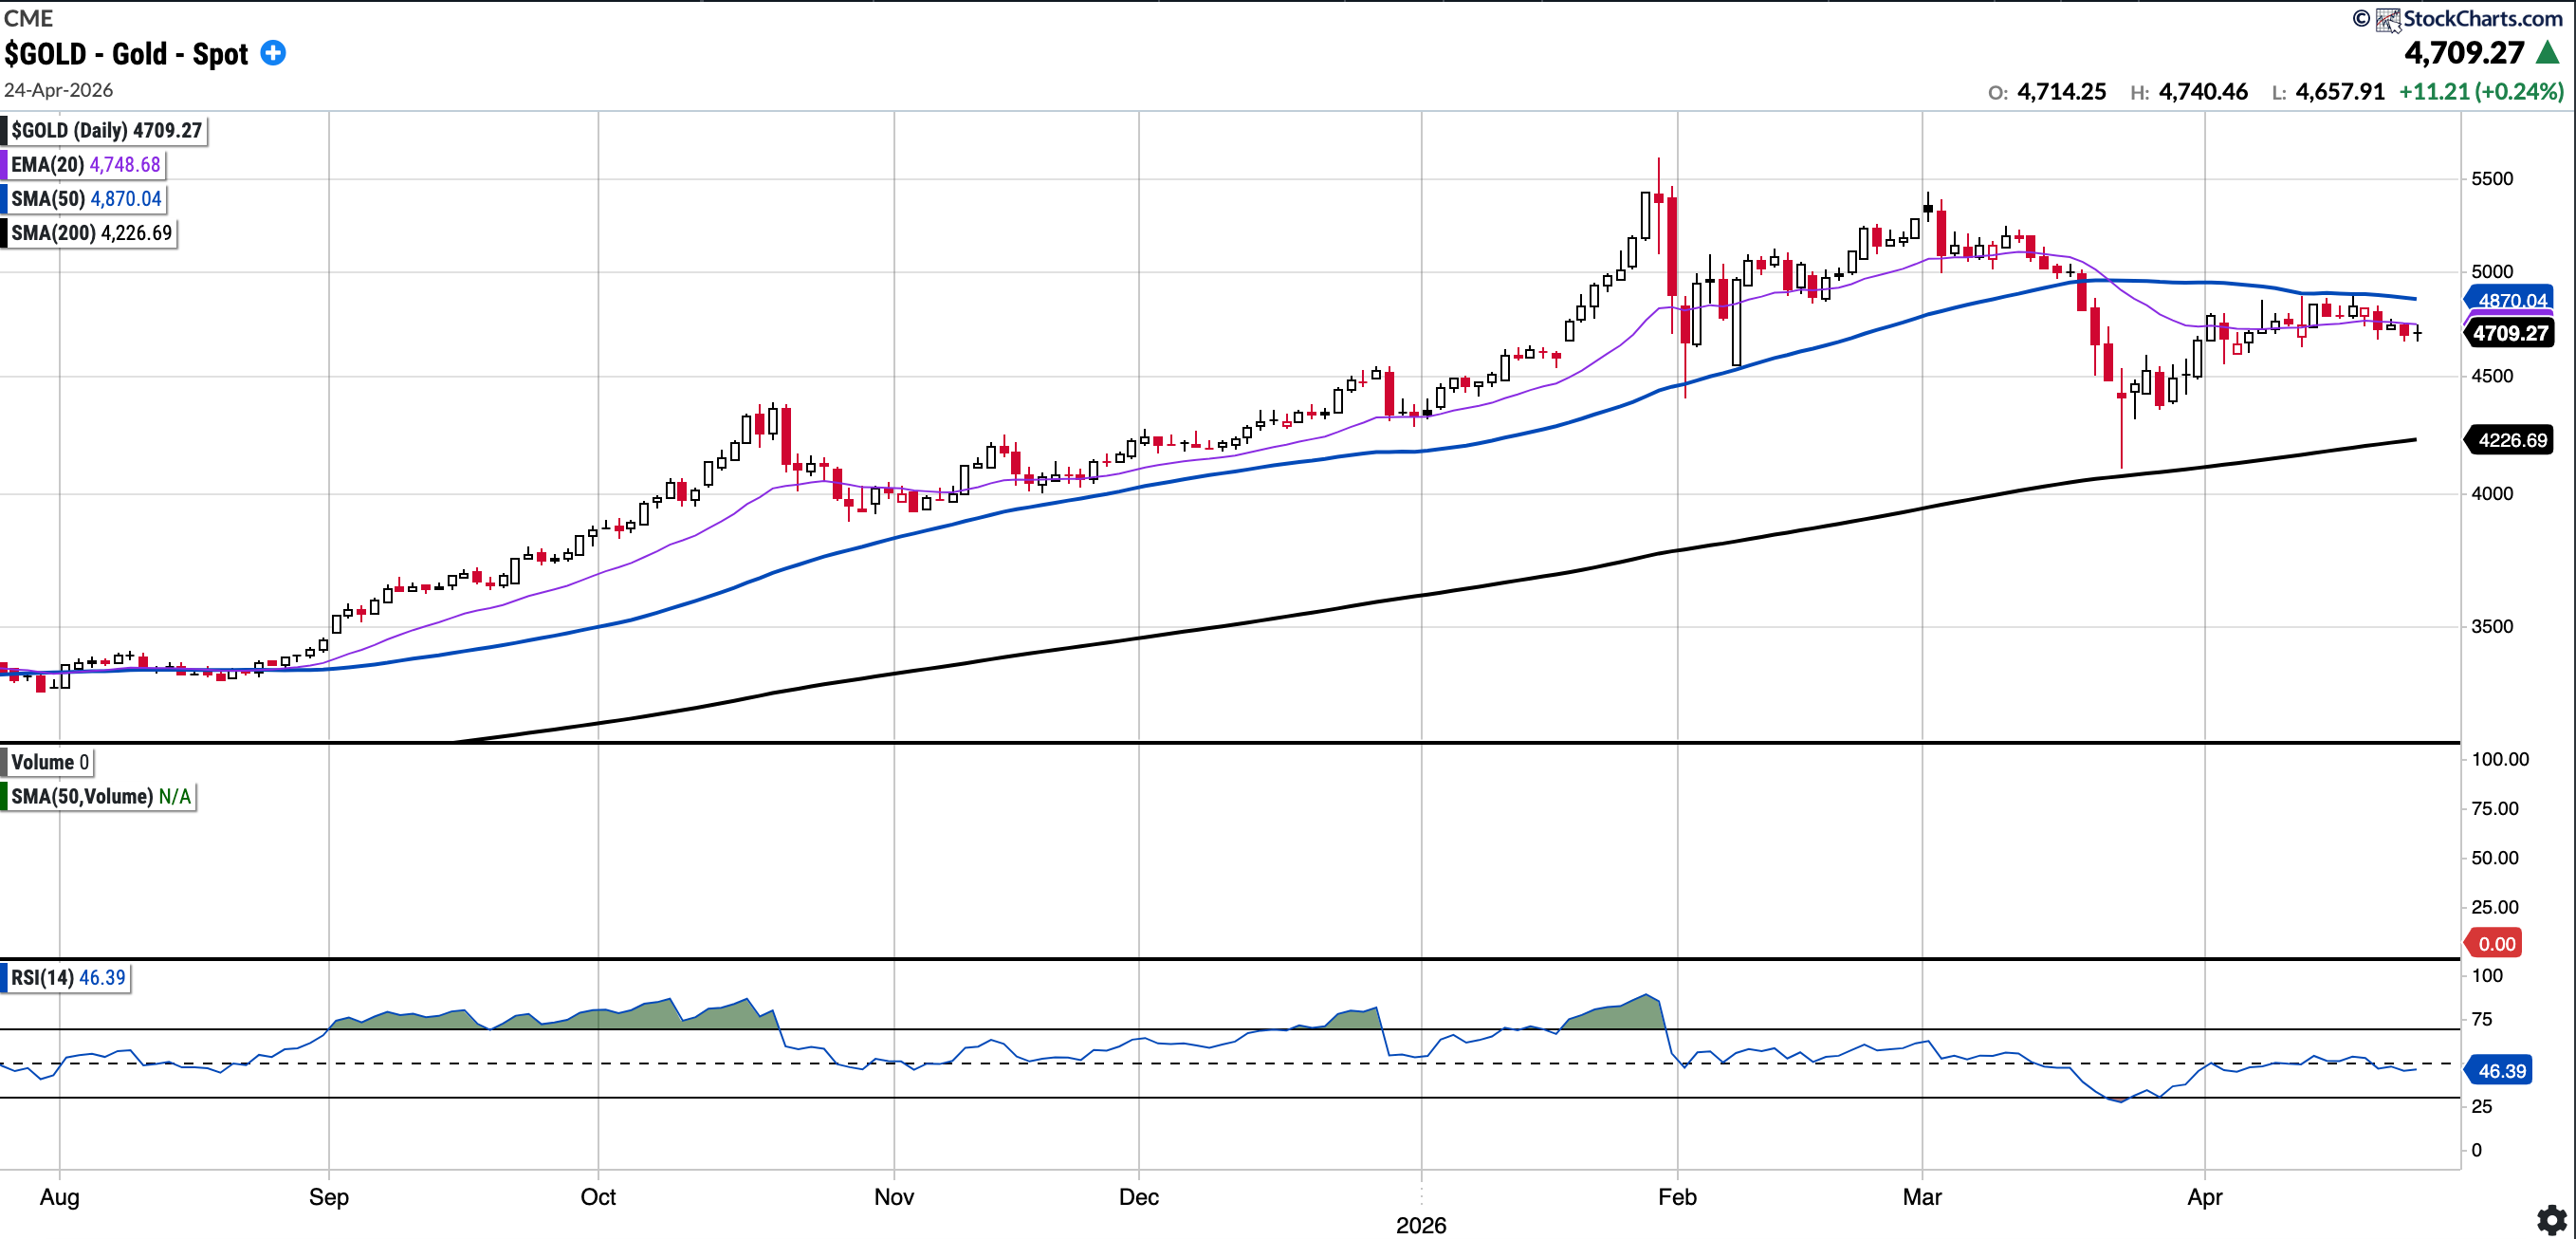
GOLD (Long Physical)
Currently trades at $4709.27, 3.3% below the 50SMA and 11.42% above the 200SMA
RSI 46.39
8.95% YTD
Gold remains in an uptrend, though it has started to consolidate below the overhead SMA 50, which is serving as a strong resistance level.
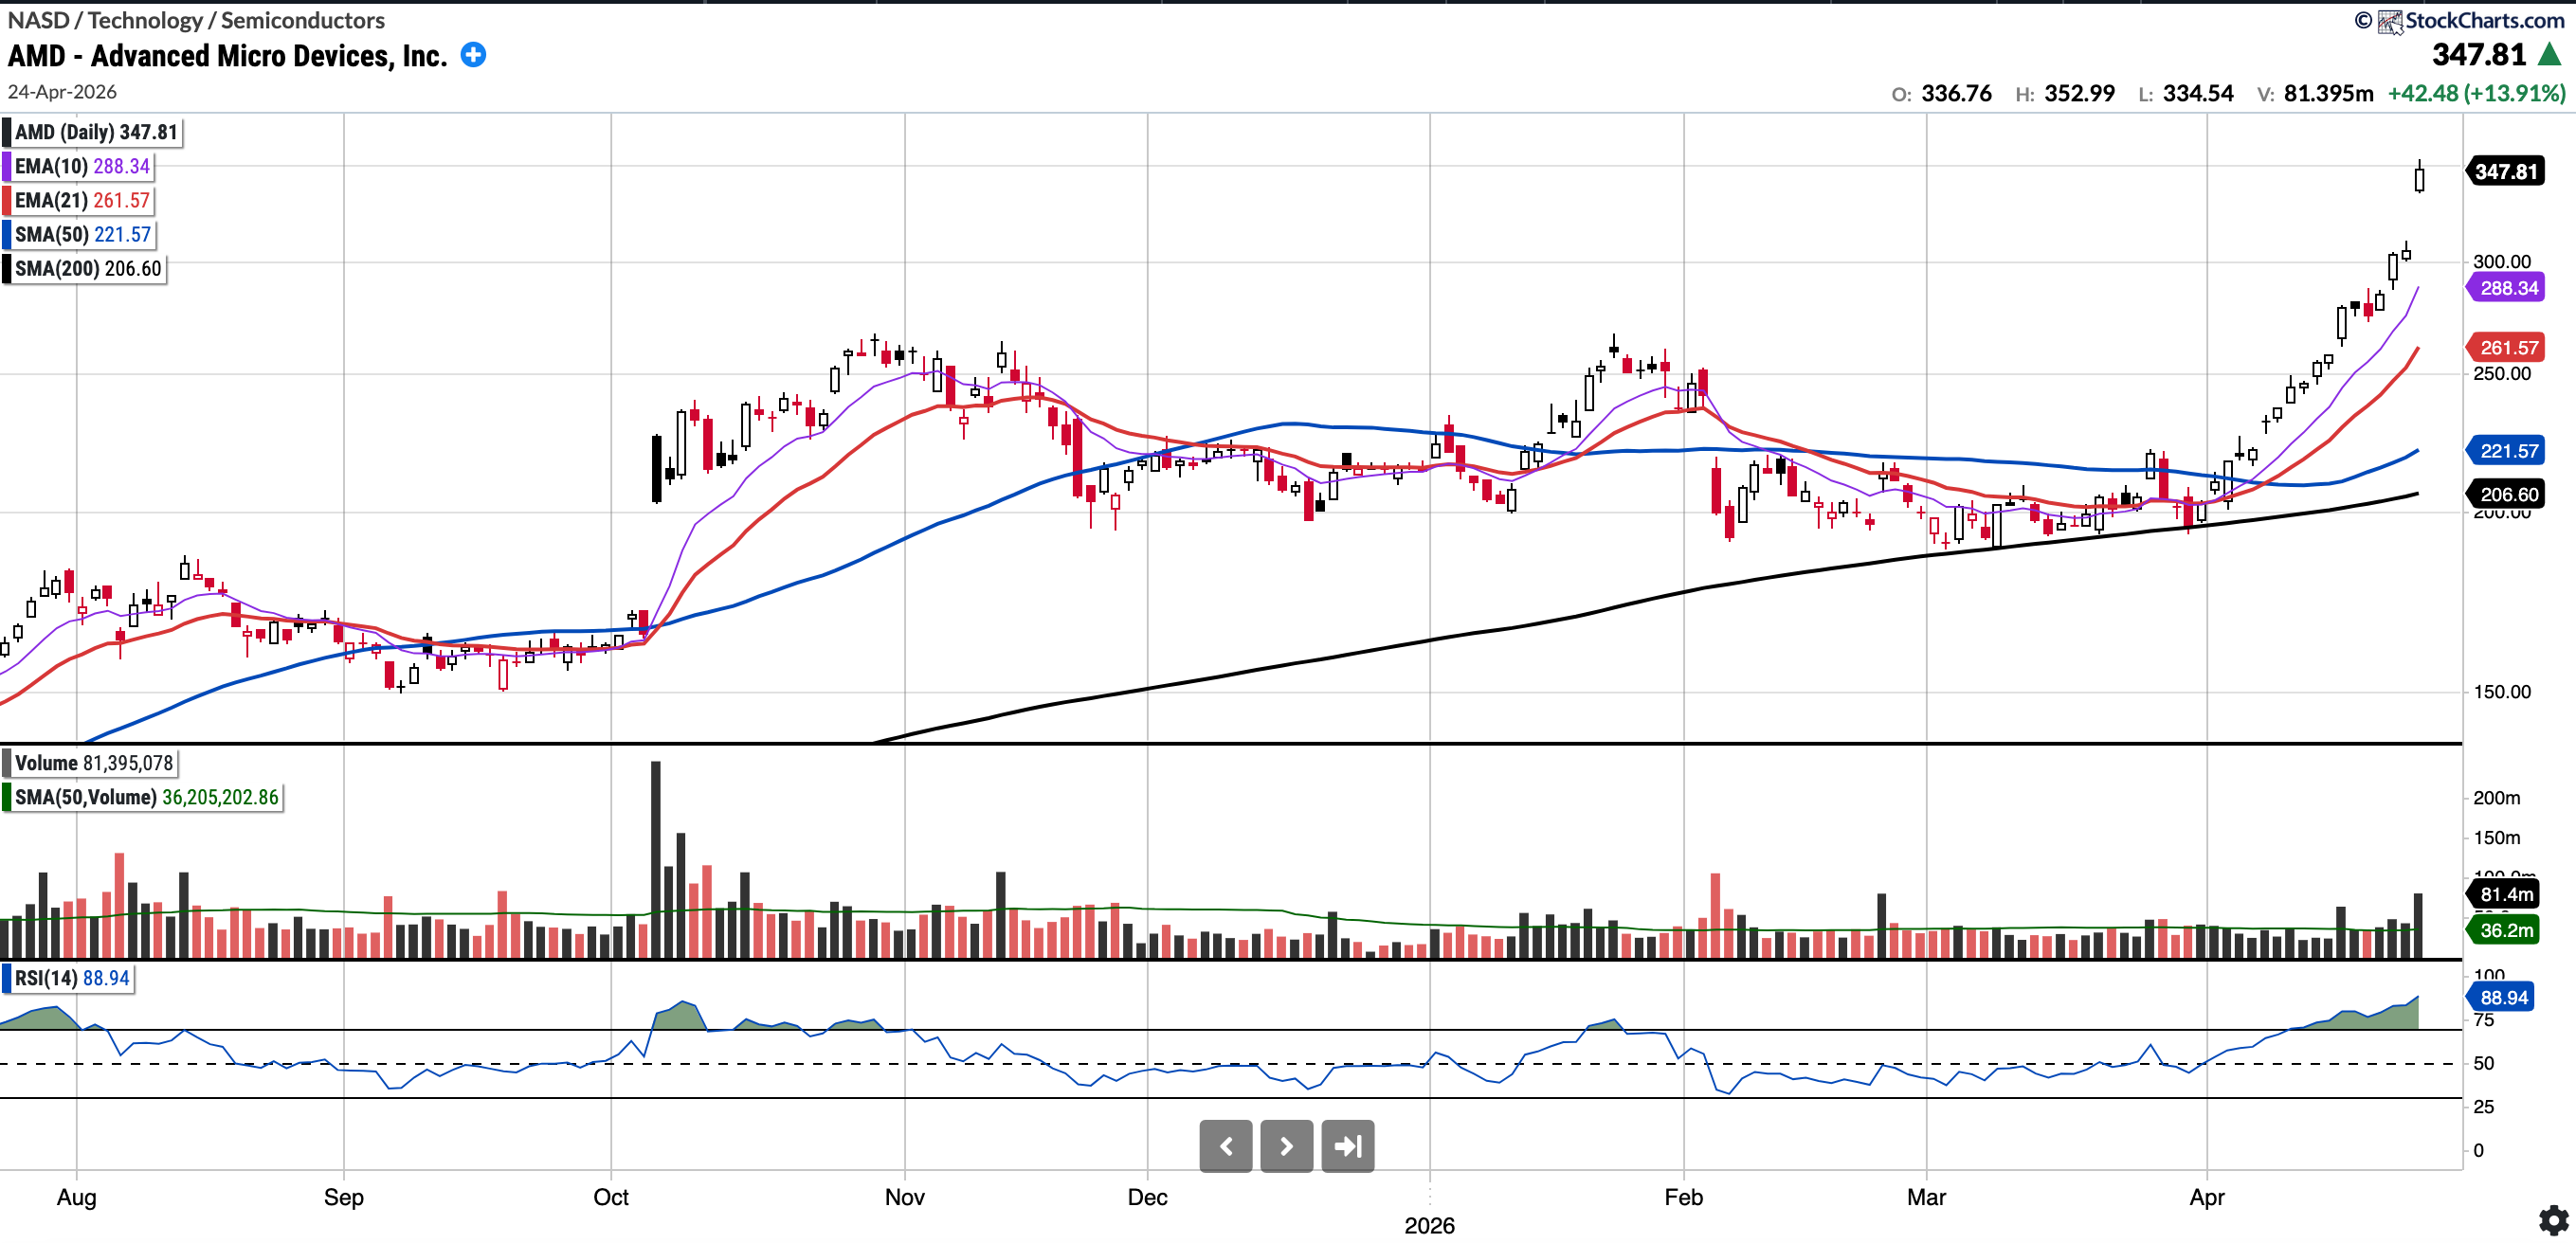
AMD
Currently trades at $347.81, 56.97% above the 50SMA and 68.35% above the 200SMA
RSI 88.94
+55.64% YTD
Last week about AMD I had written:
It remains overbought, but the strength in AMD and the CPU space is evident.
Instead of pulling back or resting, AMD continued to rally, gaining 24% on the week, a truly historic move!
On a side note, it is now trading at its highest valuation multiples in history across all metrics. This, combined with the parabolic short setup, has piqued shorts interest. A gap-up and fade may be the initial sign that AMD is due for a consolidation phase.
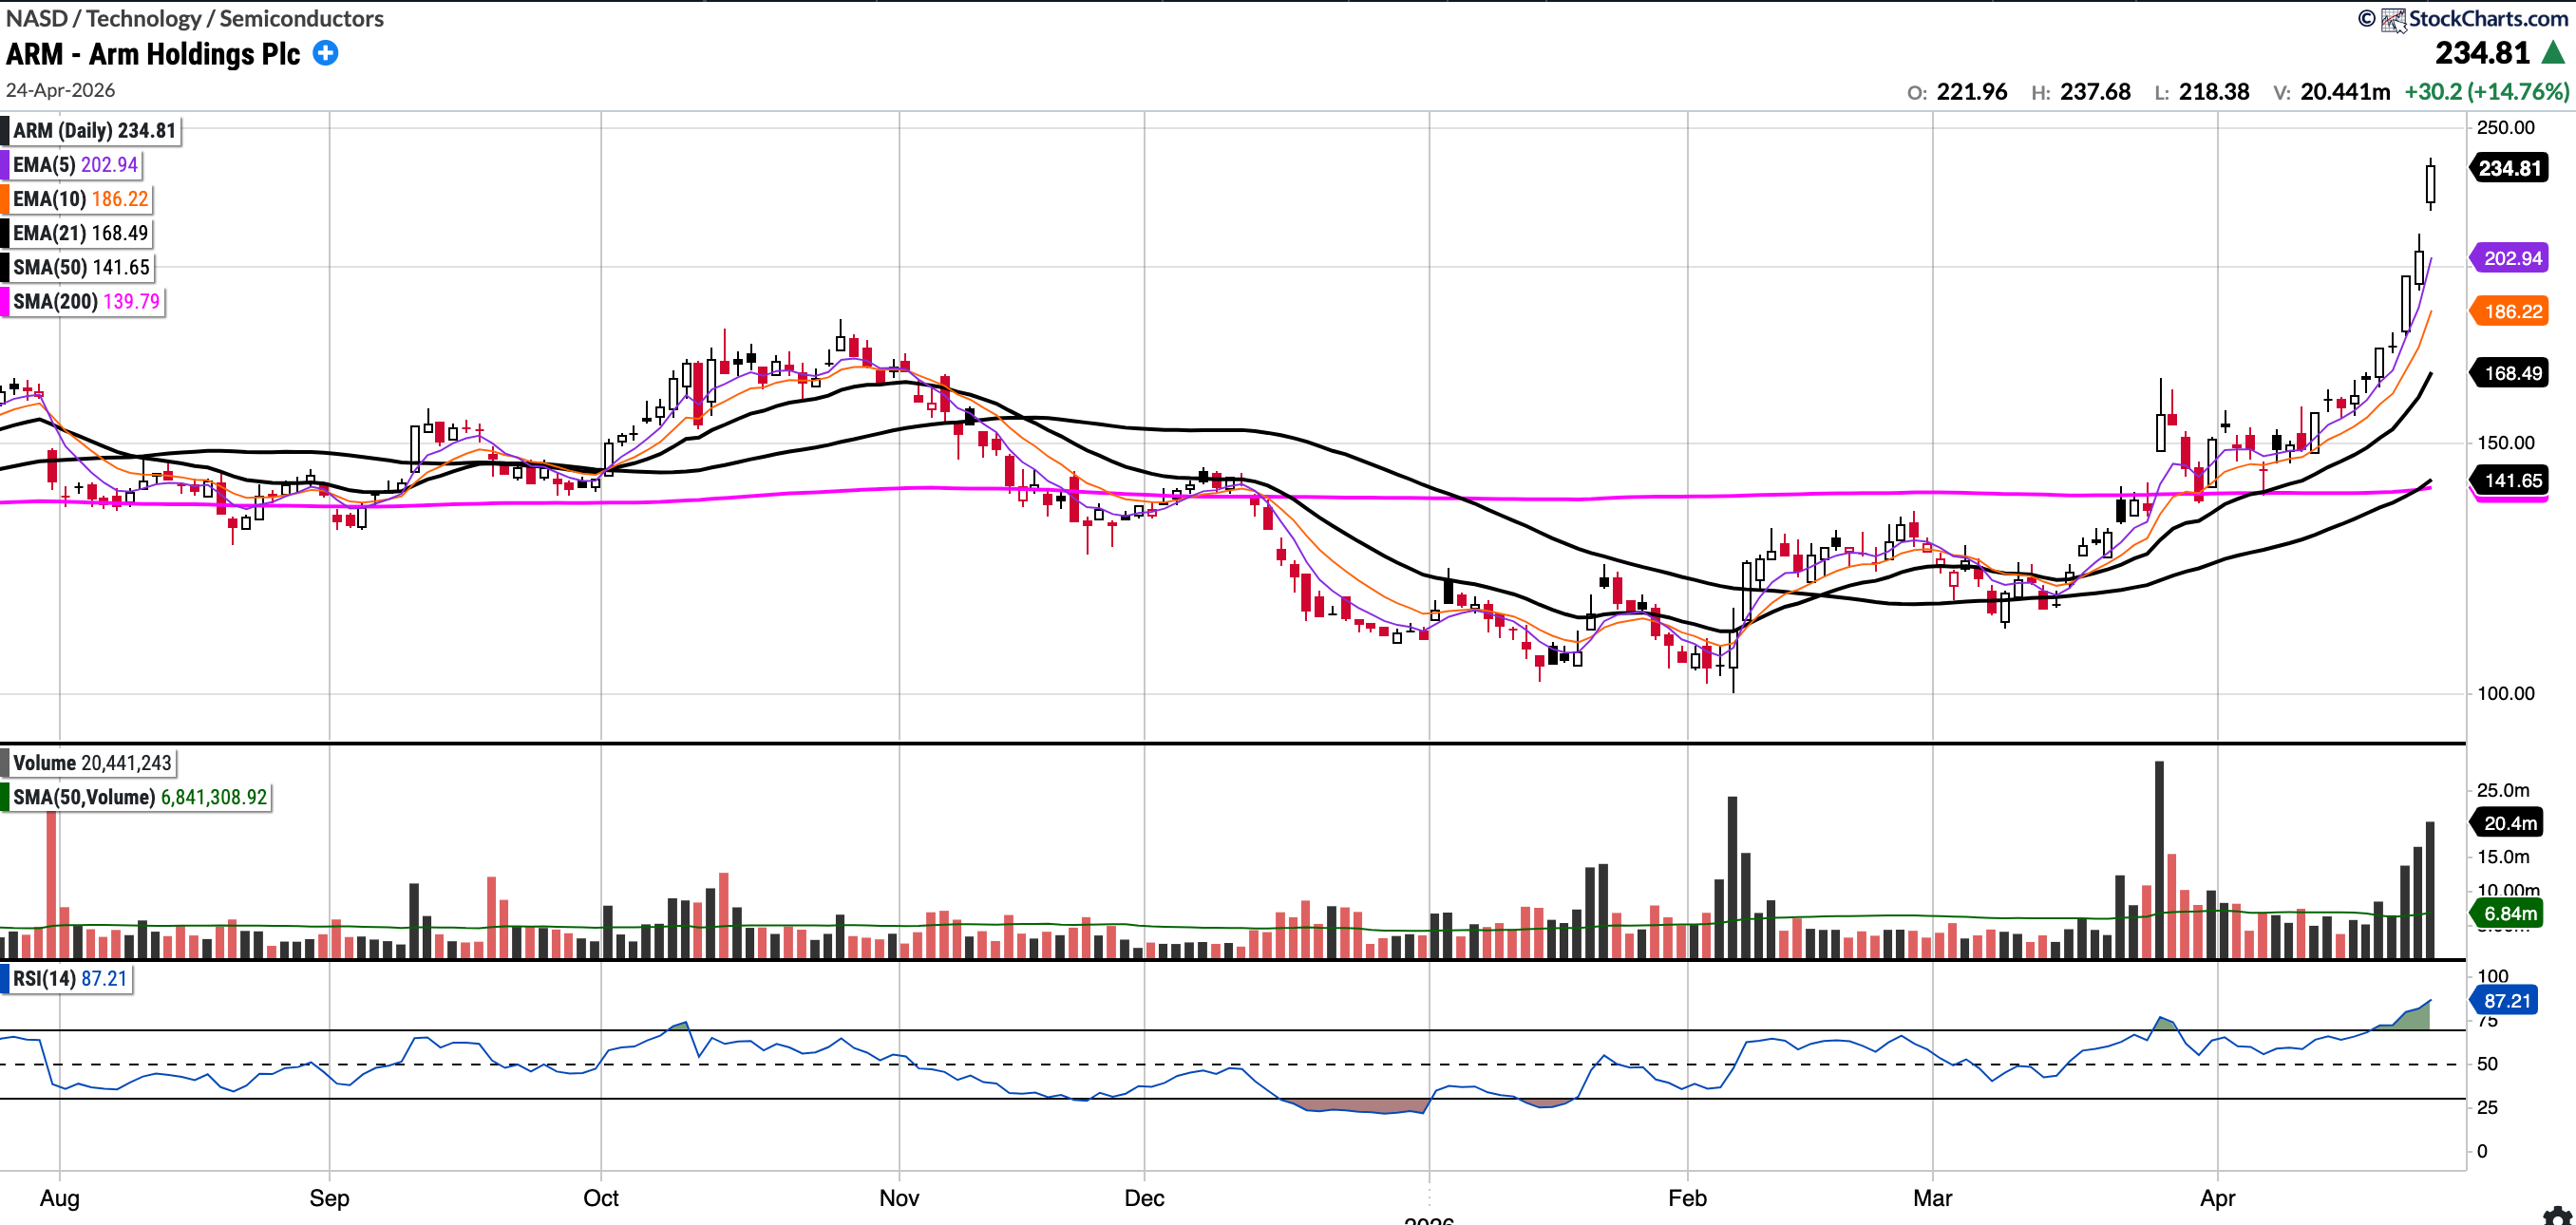
Since I mentioned ARM last week, I have included the updated chart below to complete the circle. Regarding last week’s setup, I noted that it ‘has a very bullish structure, though it is yet to break out to all-time highs’.
Well it ended up breaking out and was up >40% on the week. This was one we caught thankfully!
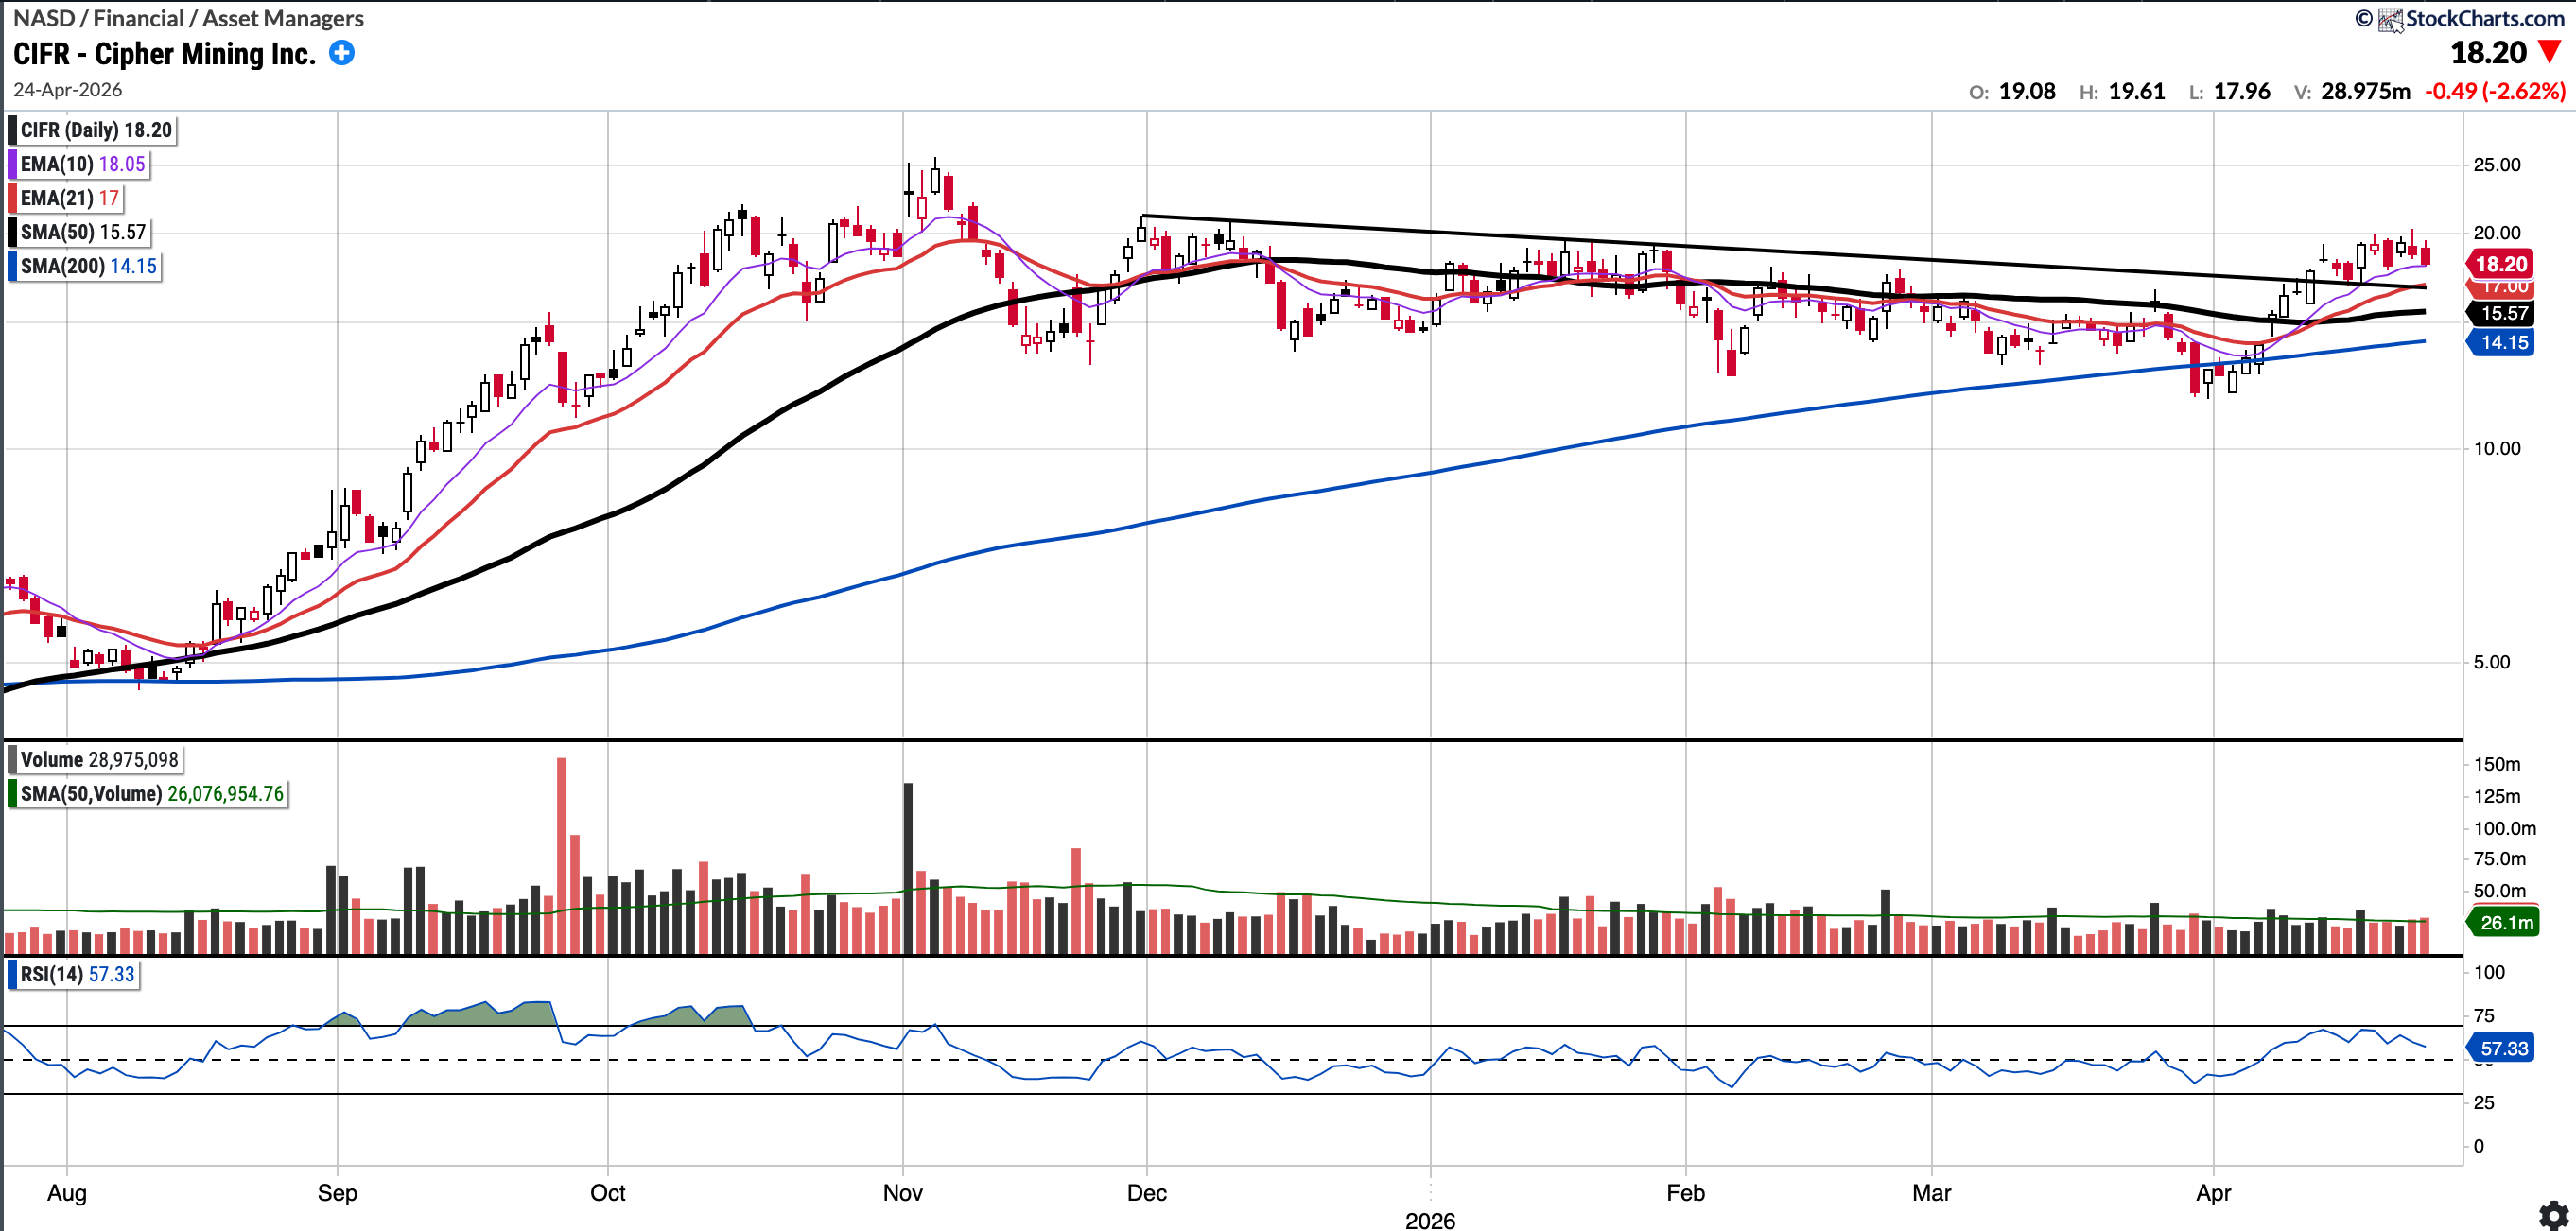
CIFR
Currently trades at $18.2, 16.91% above the 50SMA and 28.62% above the 200SMA
RSI 57.33
12.35% YTD
CIFR broke out above the descending trend-line last week; although it finished the week in the red, it successfully held the 10-day EMA as support. I’m looking for a low-volume pullback to the trend-line, which currently coincides with the 21EMA, where I may initiate a long position.
It remains on my watchlist as one of my favourite data centre plays.
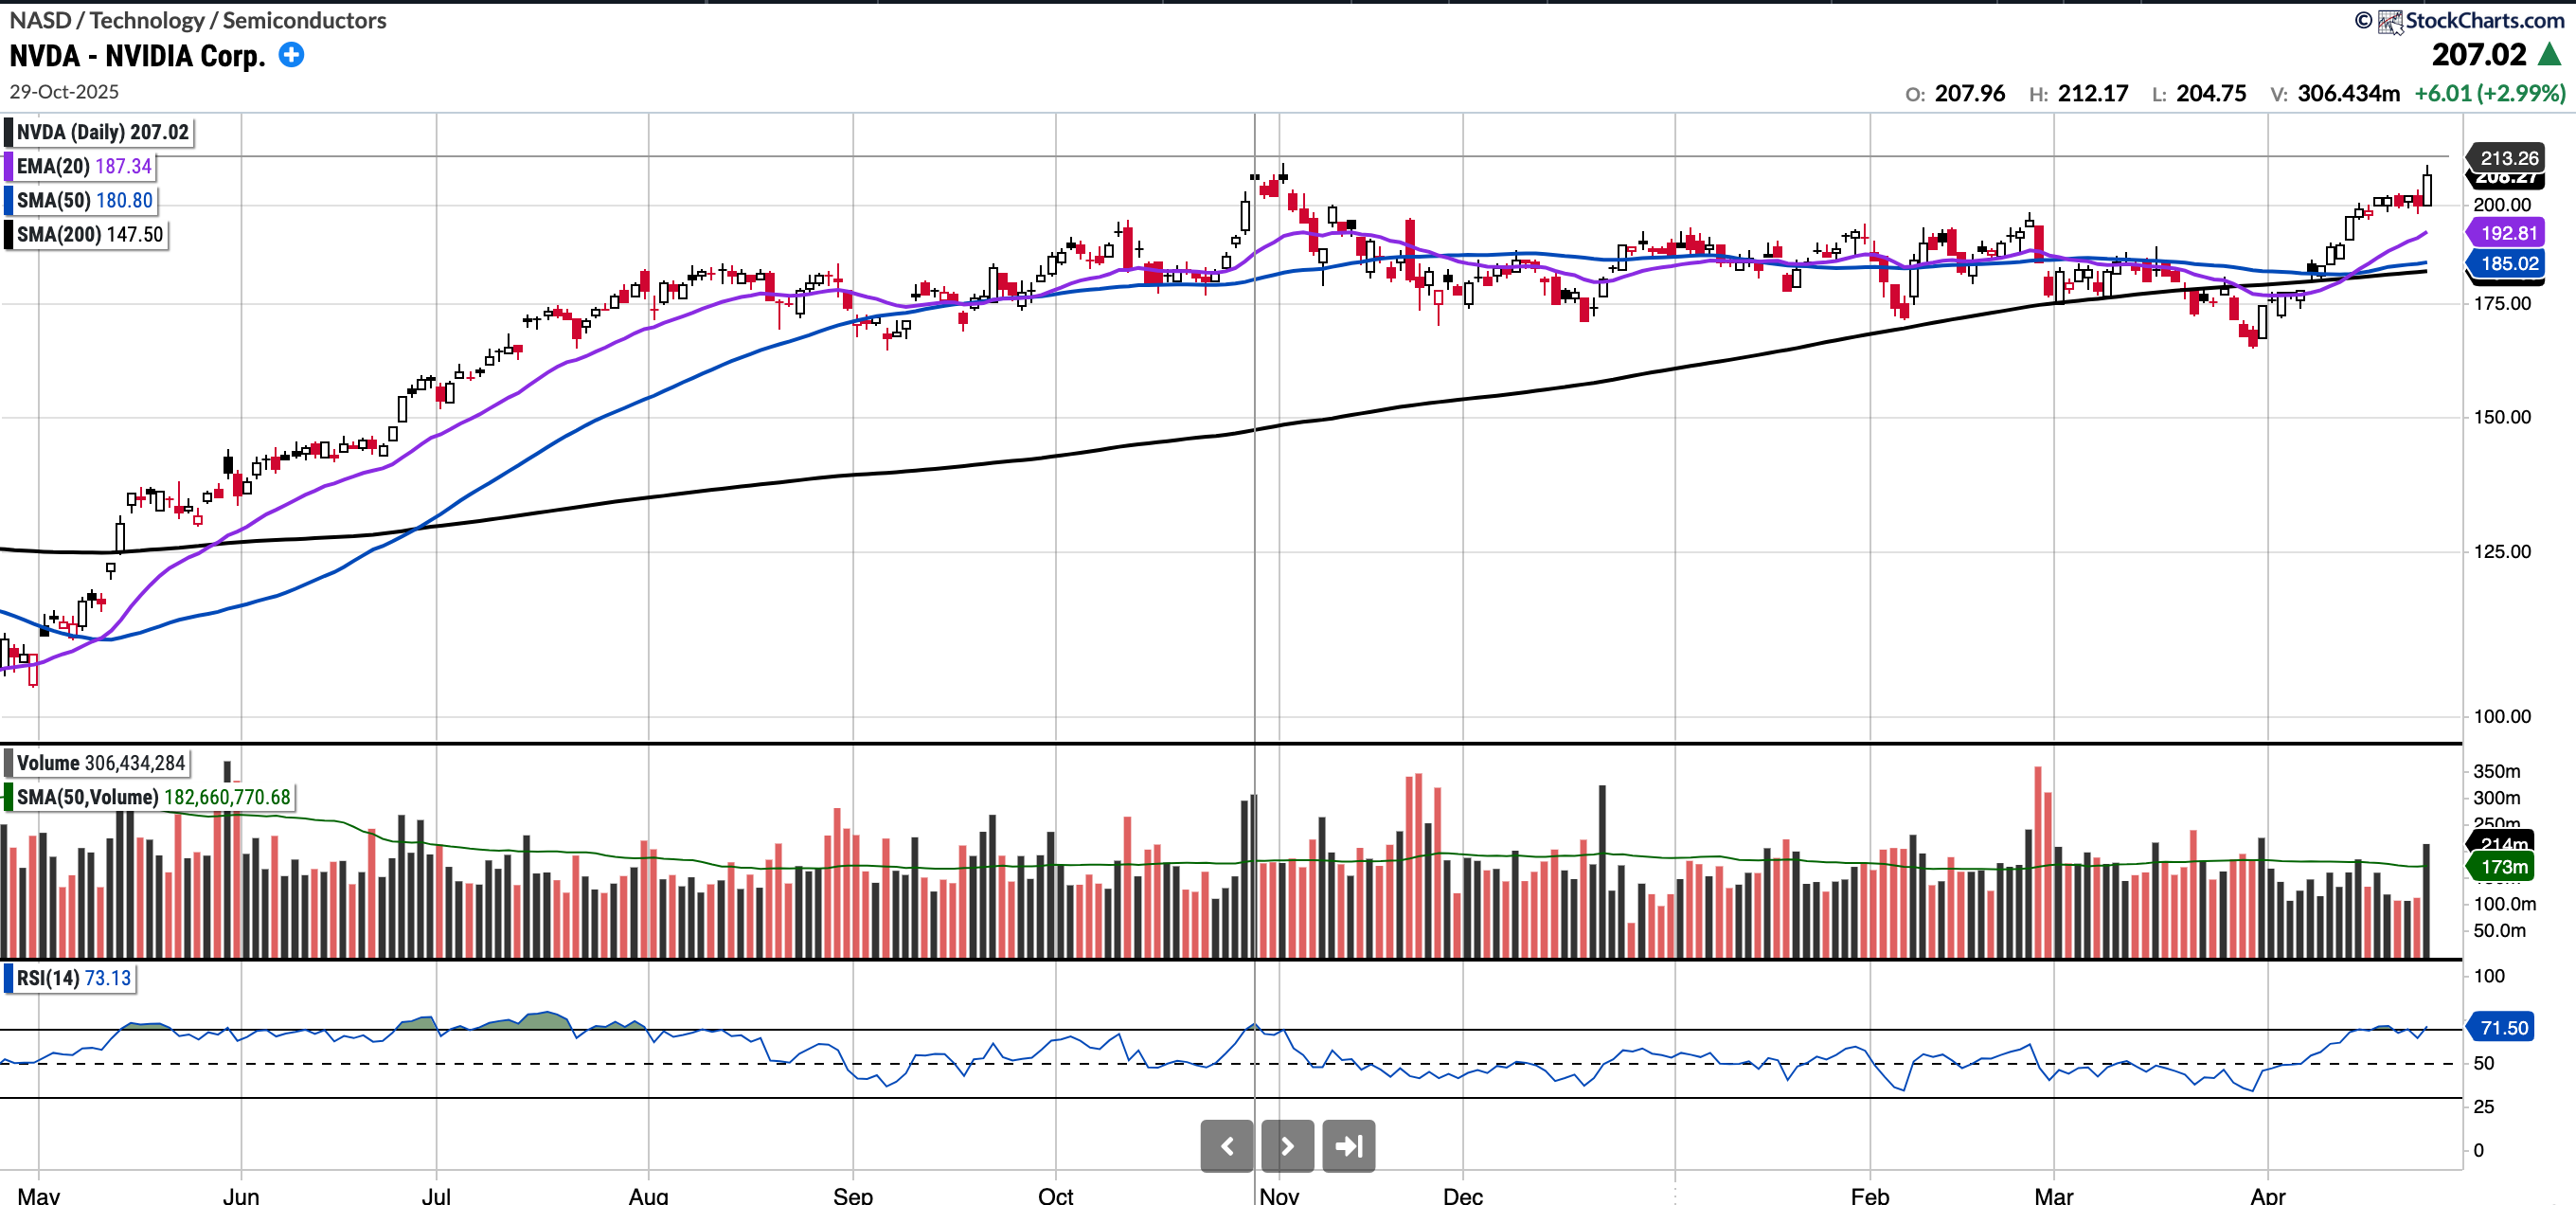
NVDA
Currently trades at $208.27, 12.57% above the 50SMA and 13.91% above the 200SMA
RSI 57.33
10.29% YTD
NVDA posted an all-time high close, though it has yet to surpass the intraday all-time high of $212.19 reached in late October. This breakout has been more than six months in the making. The measured move from the previous base is approximately 28 points, which could project NVDA toward $240 per share.
I have featured several other trading ideas in this post also if interested:
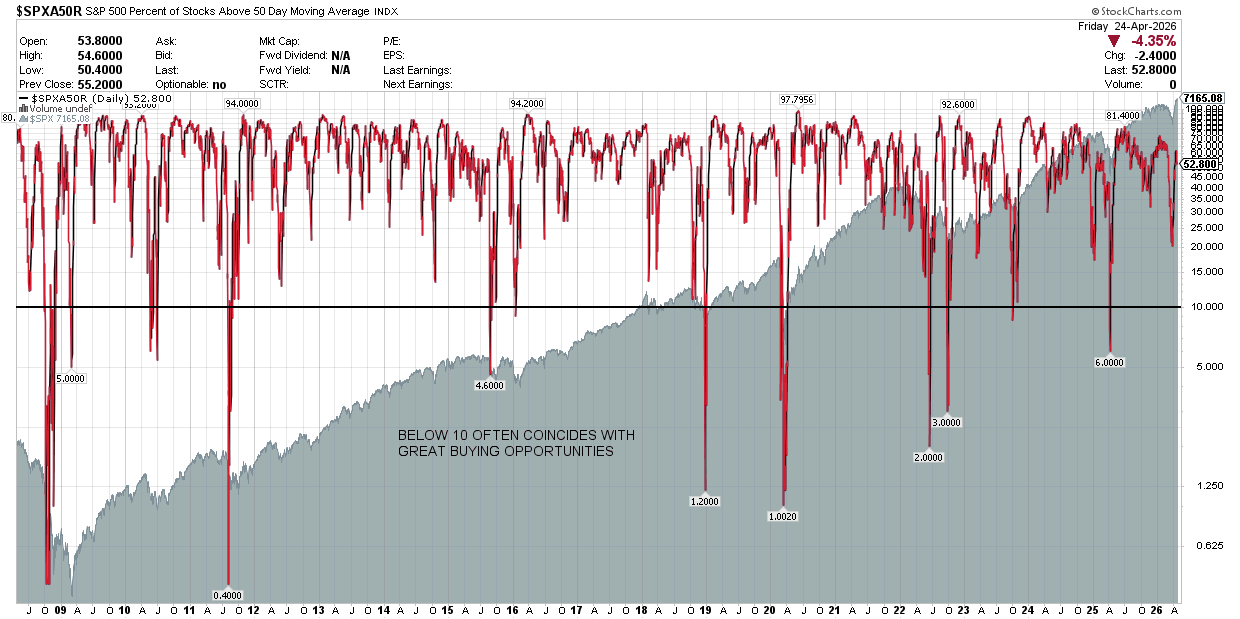
S&P 500 Percentage of Stocks Above the 50 Day Moving Average: Currently 52
Readings below 10 tend to be fantastic buying opportunities. We did get to 20 at the recent pico low on the SPX.
You will note that whilst the SPX closed at the highs, breadth is deteriorating.
Notable portfolio changes in previous week (all updated live in subscriber channels):
