

Hope you all are having a good weekend. Below, we will be previewing the upcoming week’s events and providing a portfolio update as usual.
Format for what is covered in this weekly preview:
A Look at the Indices
Key Upcoming Economic Events
Upcoming Earnings
Charts
Current Portfolio Holdings:
Sizing | Cost Basis | Timeframe | Planned Moves
Closing Thoughts (Scroll here for my full Market Commentary)
I recommend checking out the most recent Monthly Portfolio and Performance Update below:

Indices
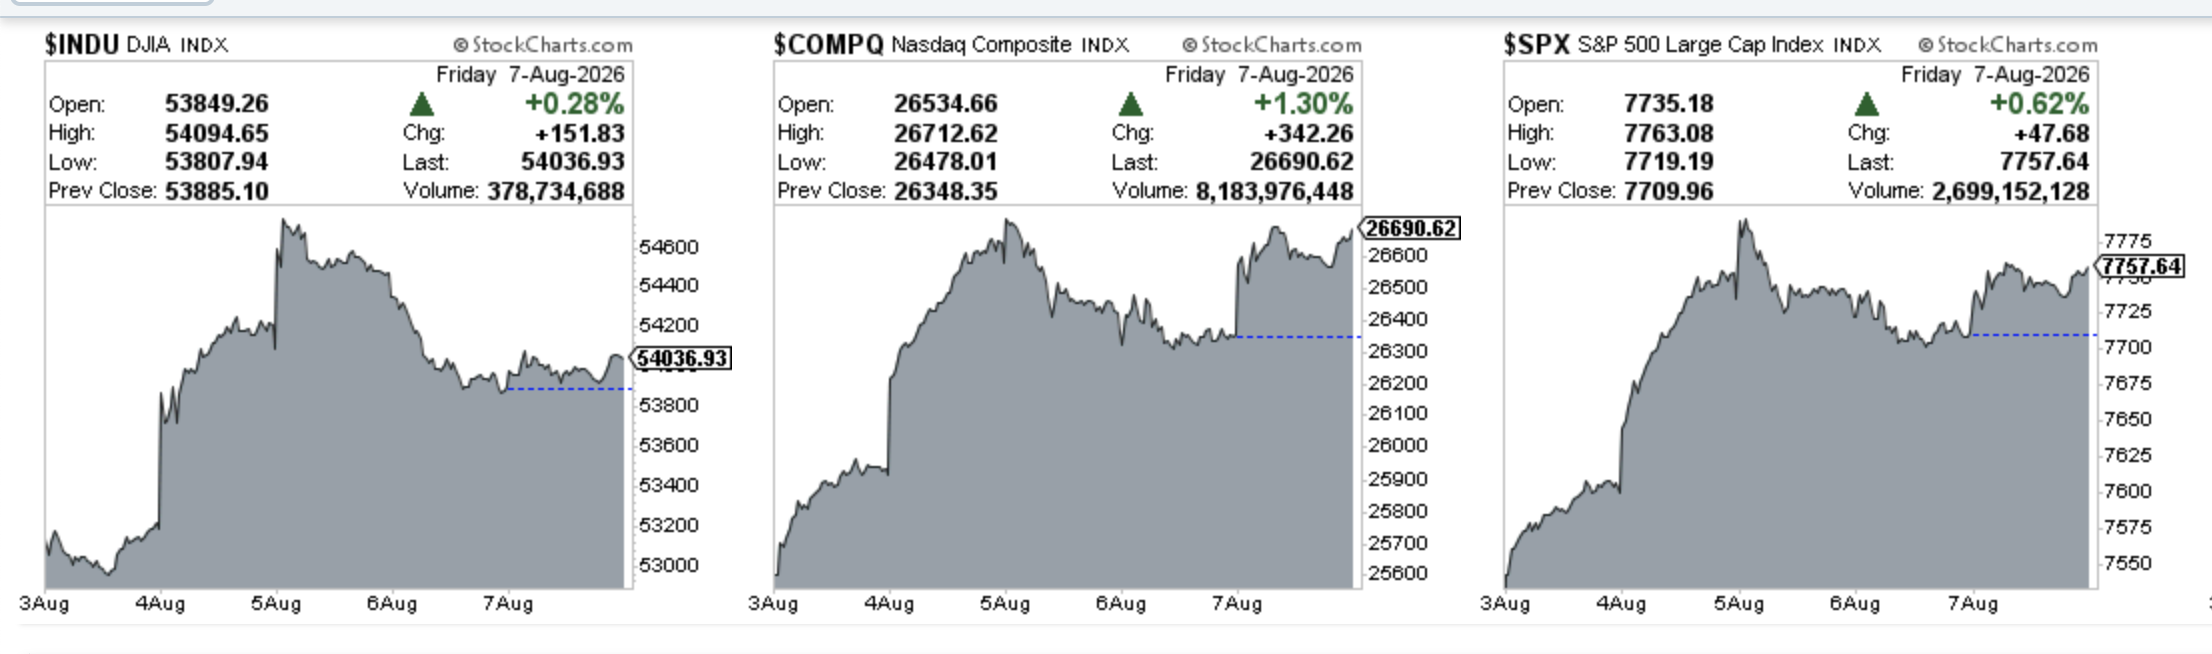
Dow Jones advanced 1.78% in the last week
S&P 500 advanced 3.00% in the last week
Nasdaq Composite advanced 4.73% in the last week
IWM advanced 3.01% in the last week
Key upcoming economic events
Monday, August 10
NY Fed 1-Year Inflation Expectations (July)
Tuesday, August 11
NFIB Small Business Optimism Index (July)
Wednesday, August 12
Consumer Price Index (July)
Real Earnings (July)
EIA Crude Oil Inventories
Monthly U.S. Budget Statement (July)
Thursday, August 13
Producer Price Index (July)
Initial Jobless Claims
Friday, August 14
Retail Sales (July)
Import and Export Prices (July)
Industrial Production (July)
University of Michigan Consumer Sentiment (Prelim August)
Business Inventories (June)
Upcoming Earnings
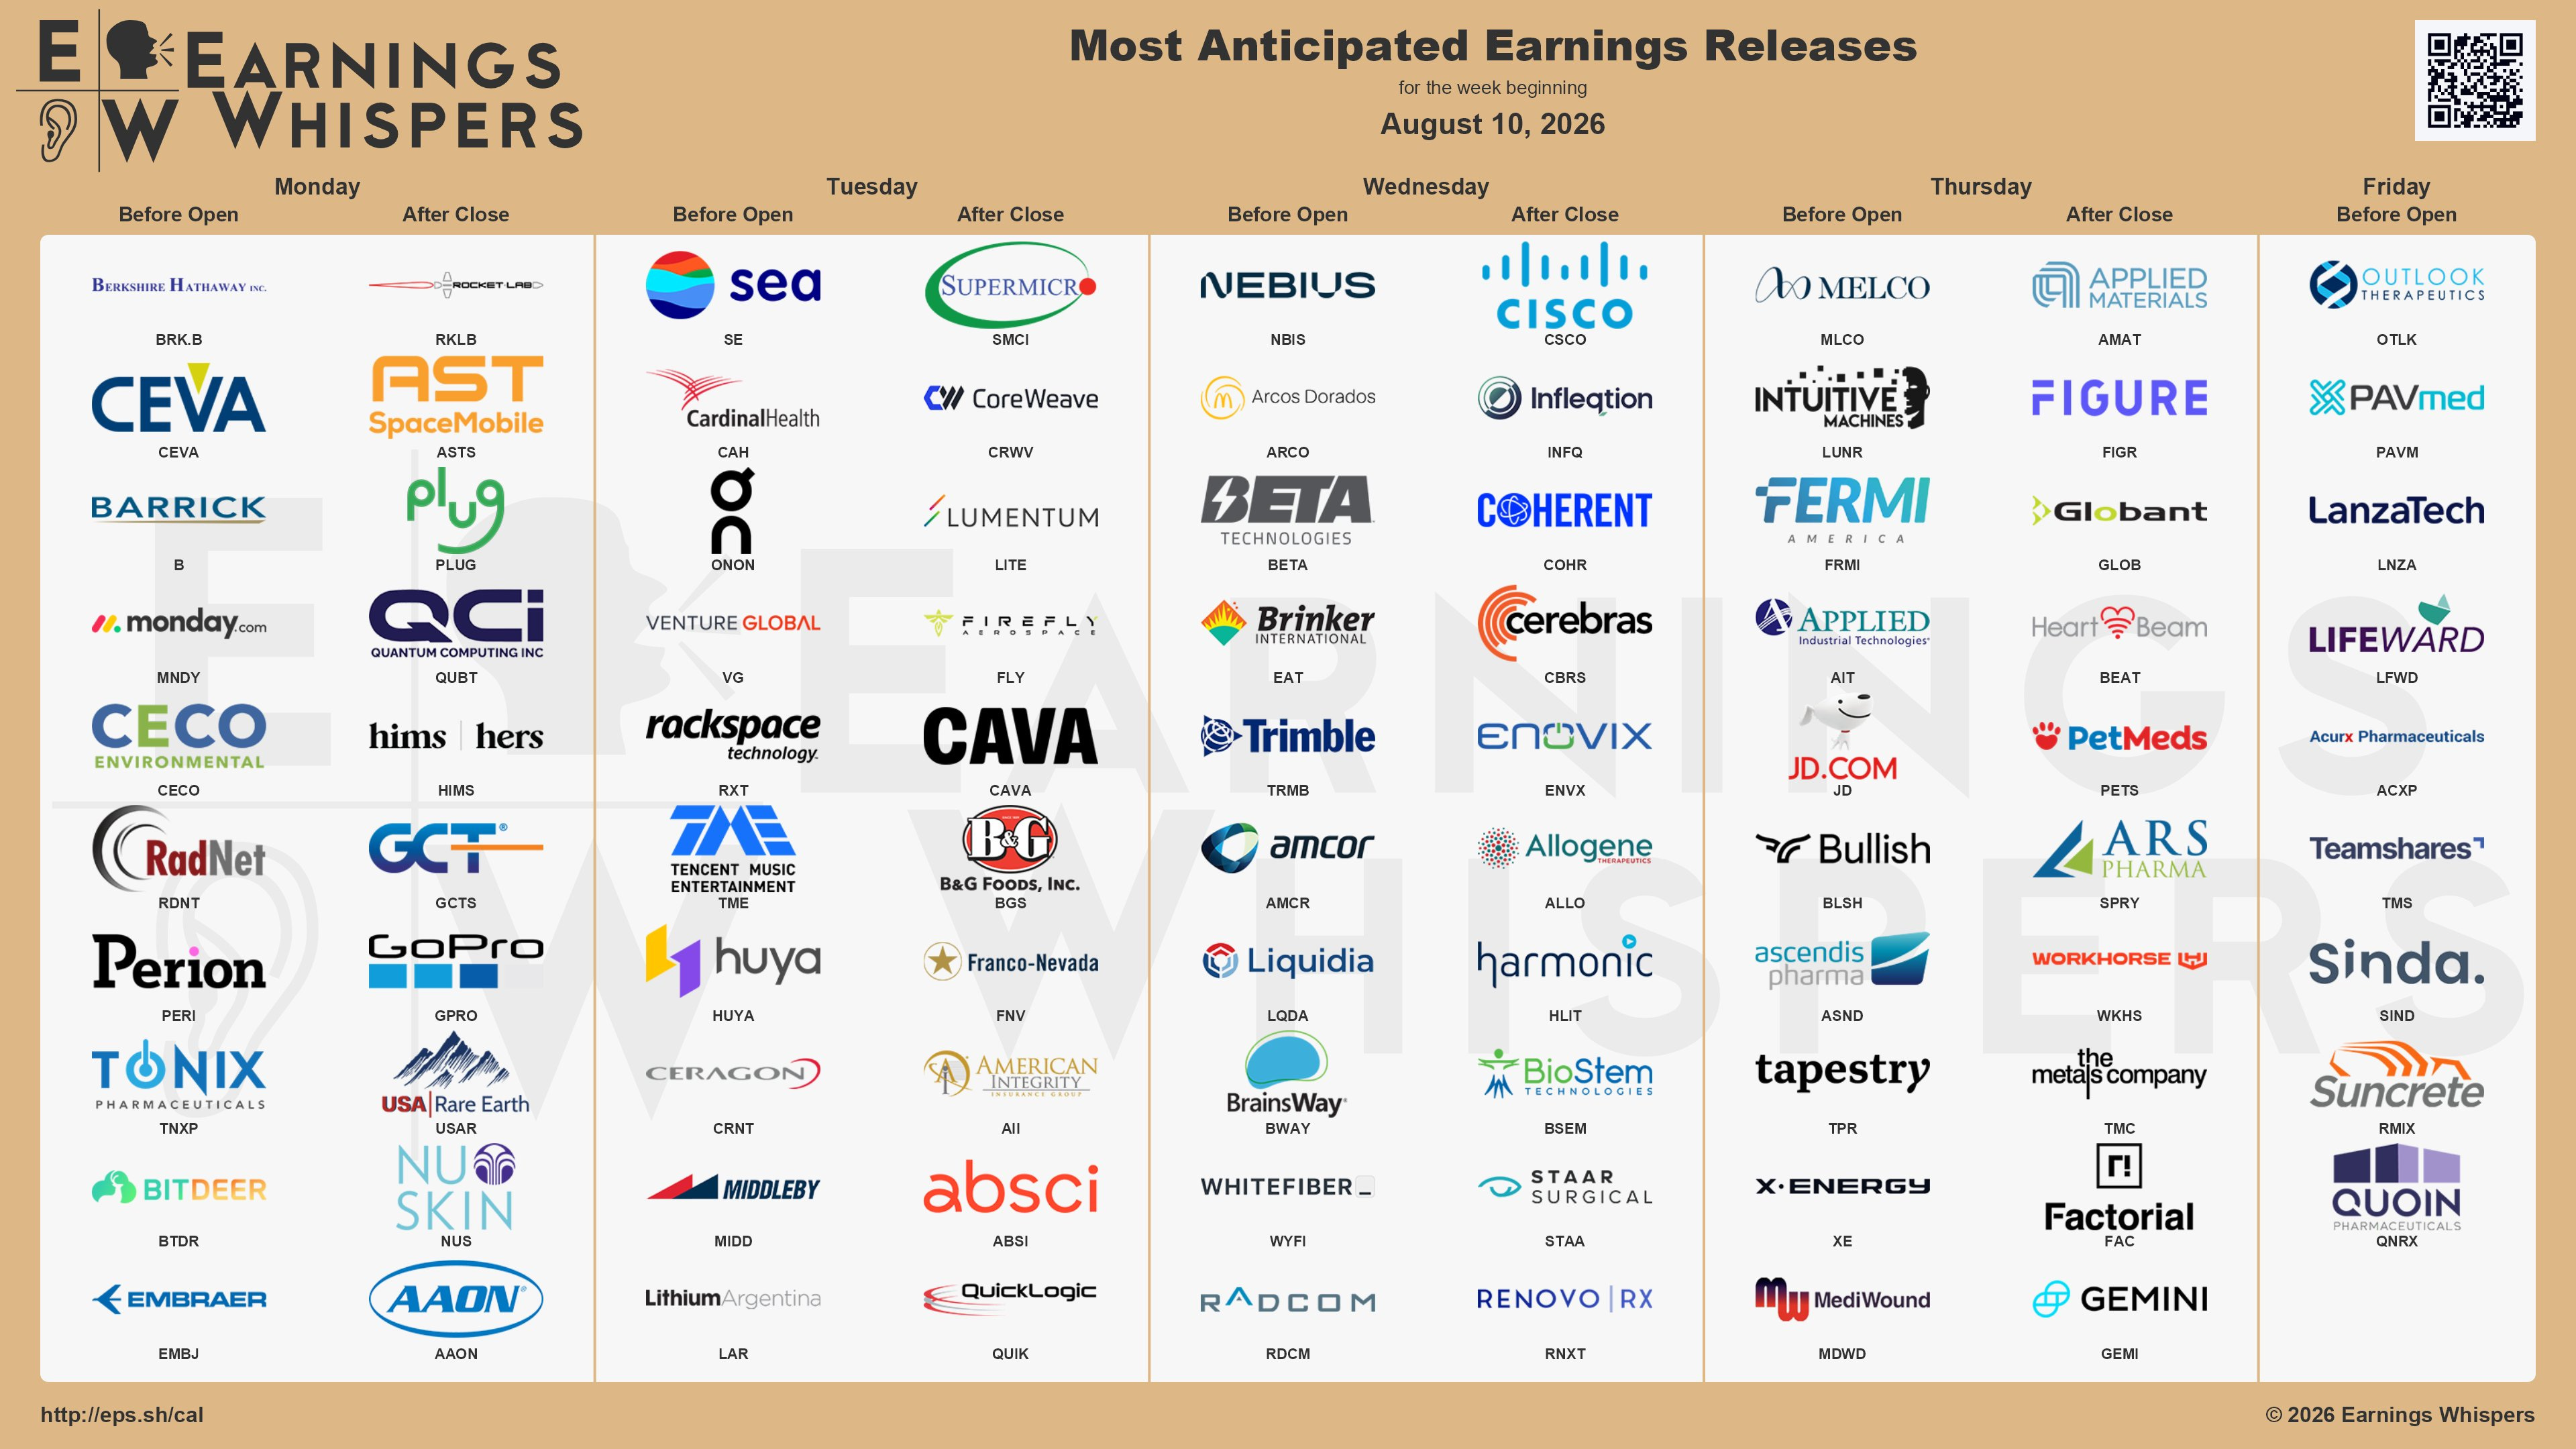
Below is the infographic by Earnings Whispers highlighting the schedule for this week:
Charts
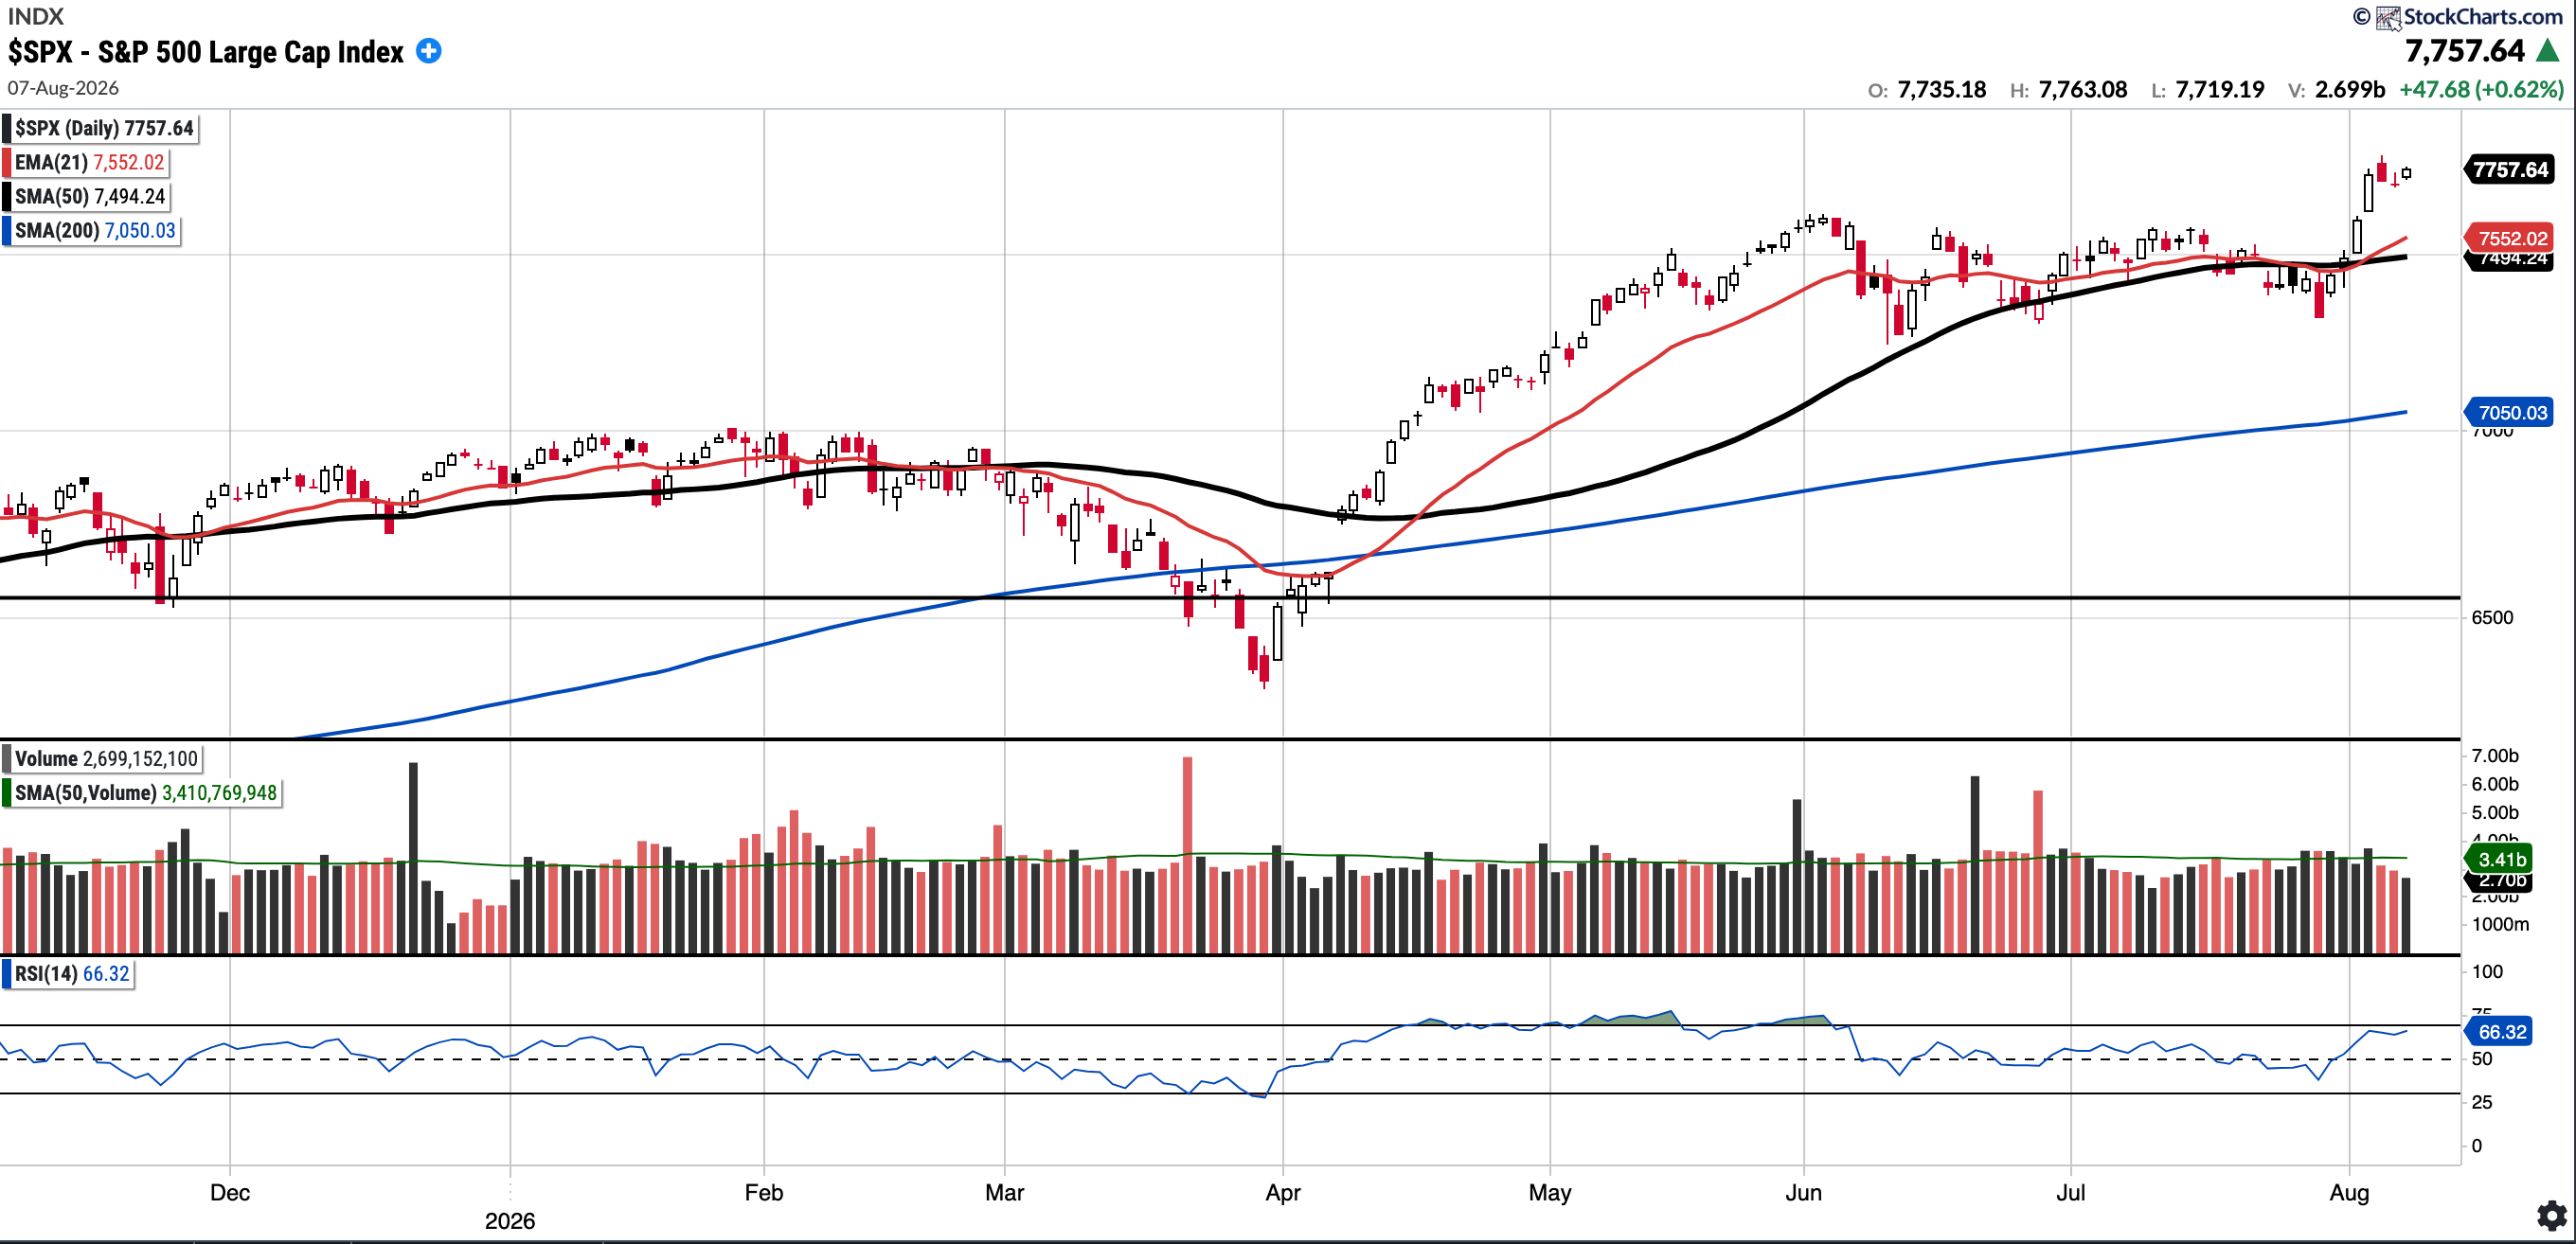
SPX
Currently trades at 7,757.64, 3.51% above the 50SMA and 10.04% above the 200SMA.
RSI 66.32
13.11% YTD
Distribution days in the last week: 0
The S&P 500 closed the week comfortably above all key moving averages.
COMPQ
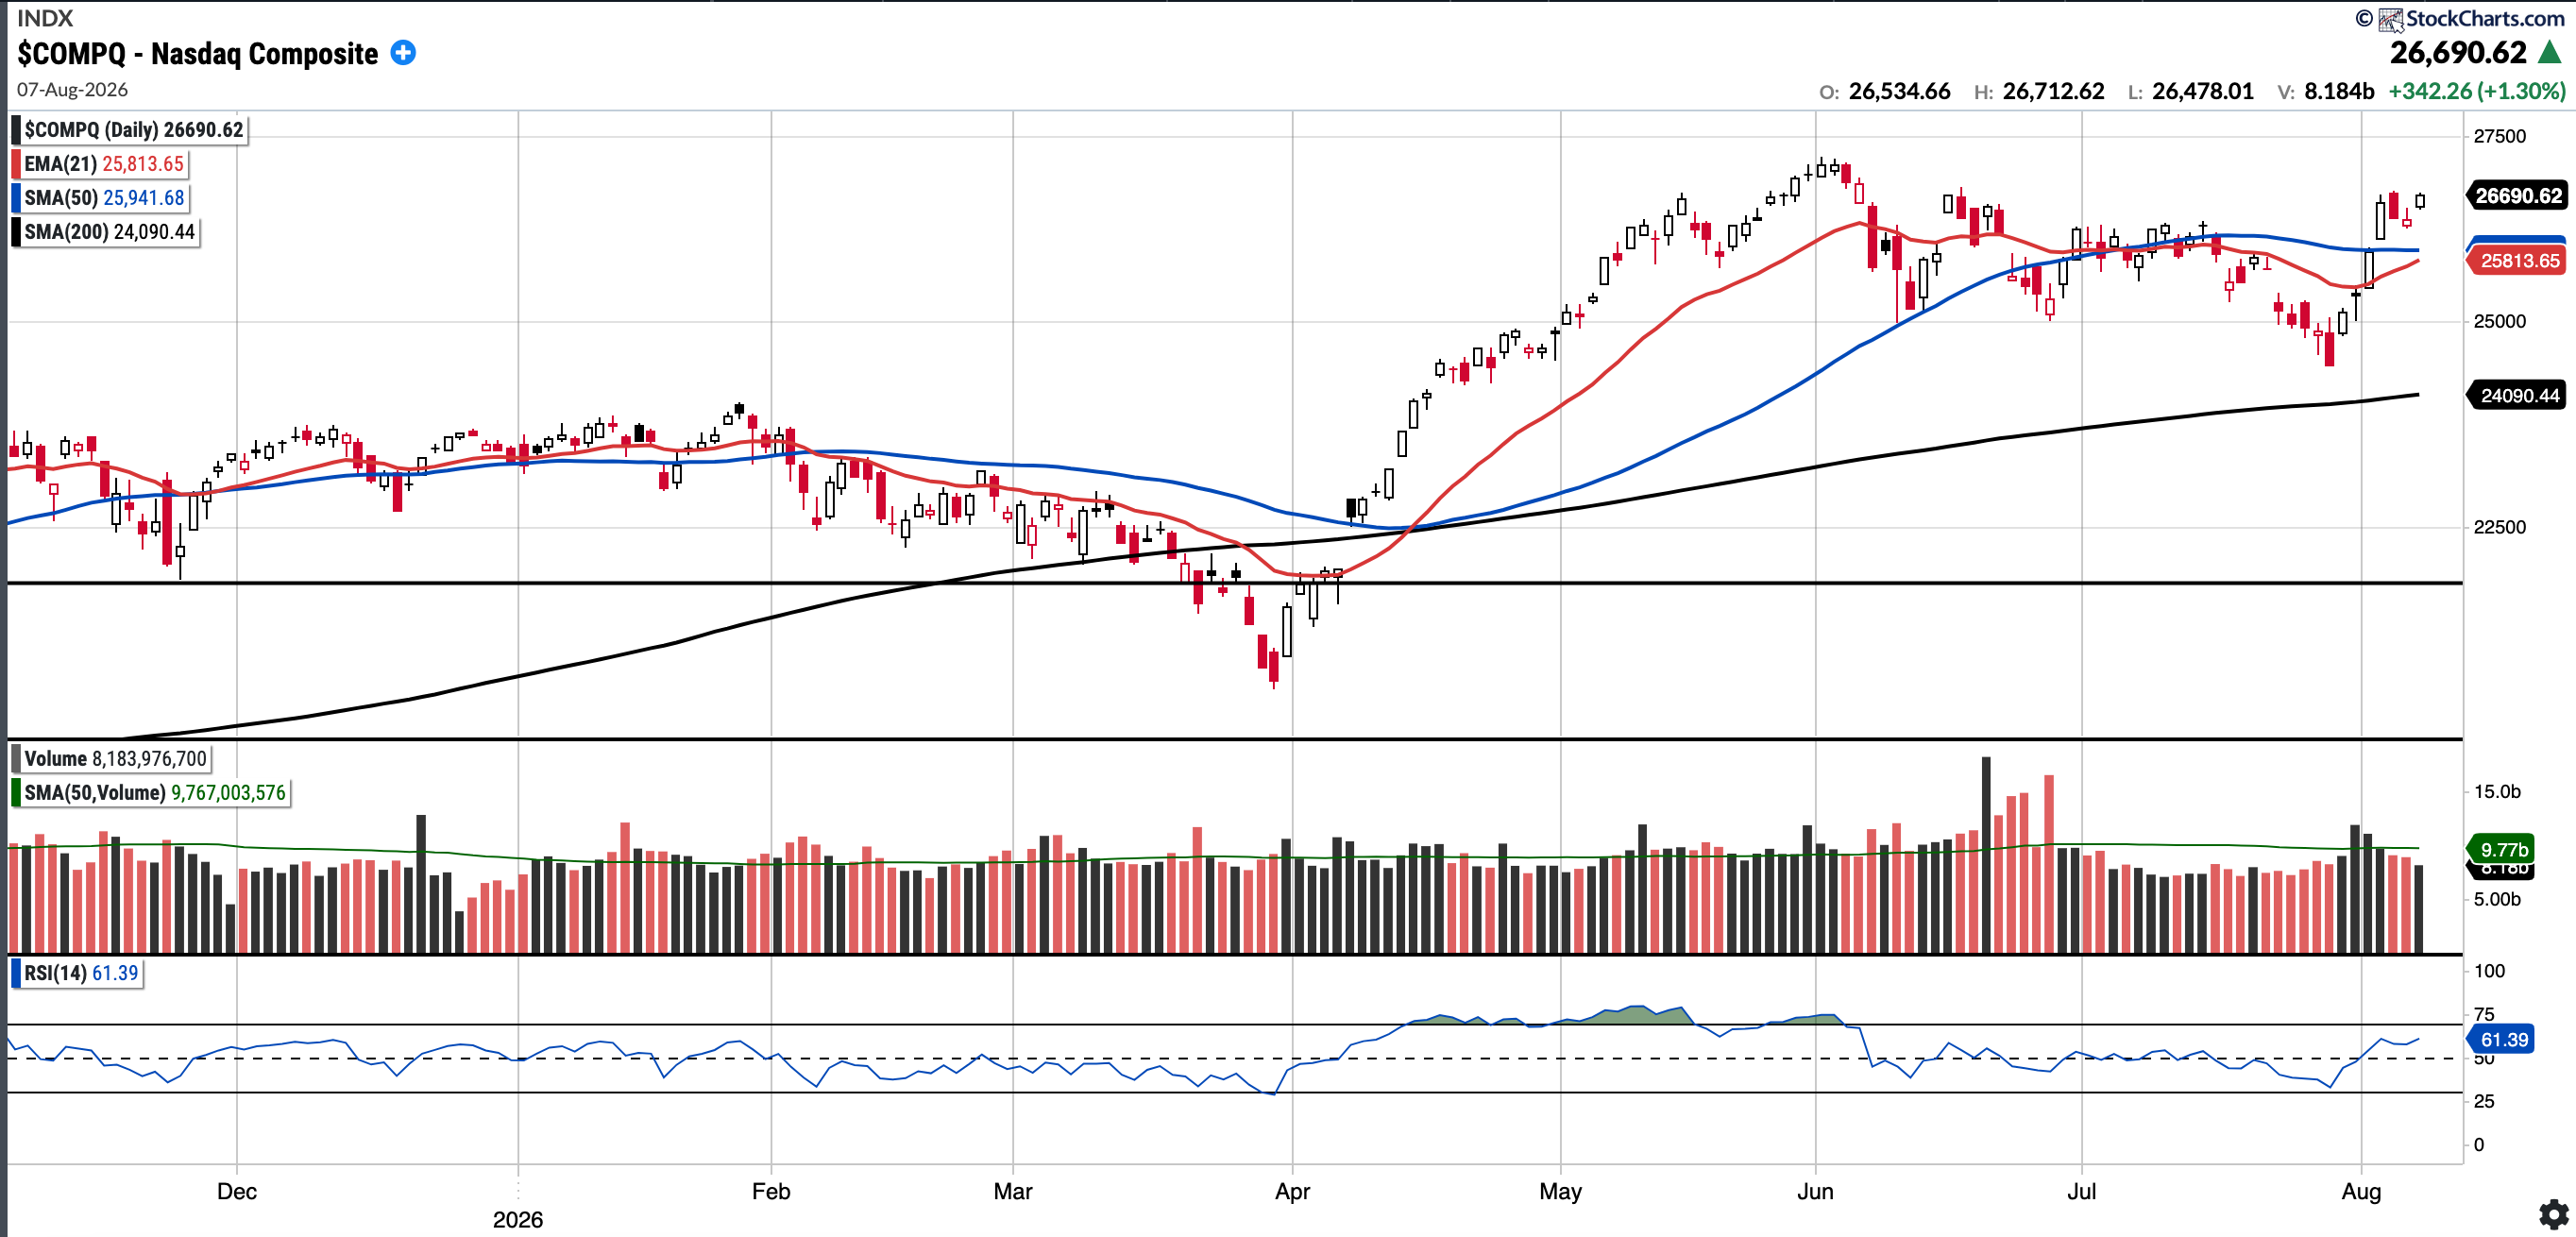
Currently trades at 26,690.62, 2.89% abovethe 50SMA and 10.79% above the 200SMA.
RSI 61.39
14.87% YTD
Distribution days in the last week: 0
The Nasdaq Composite closed above all key moving averages for the first time in several weeks.
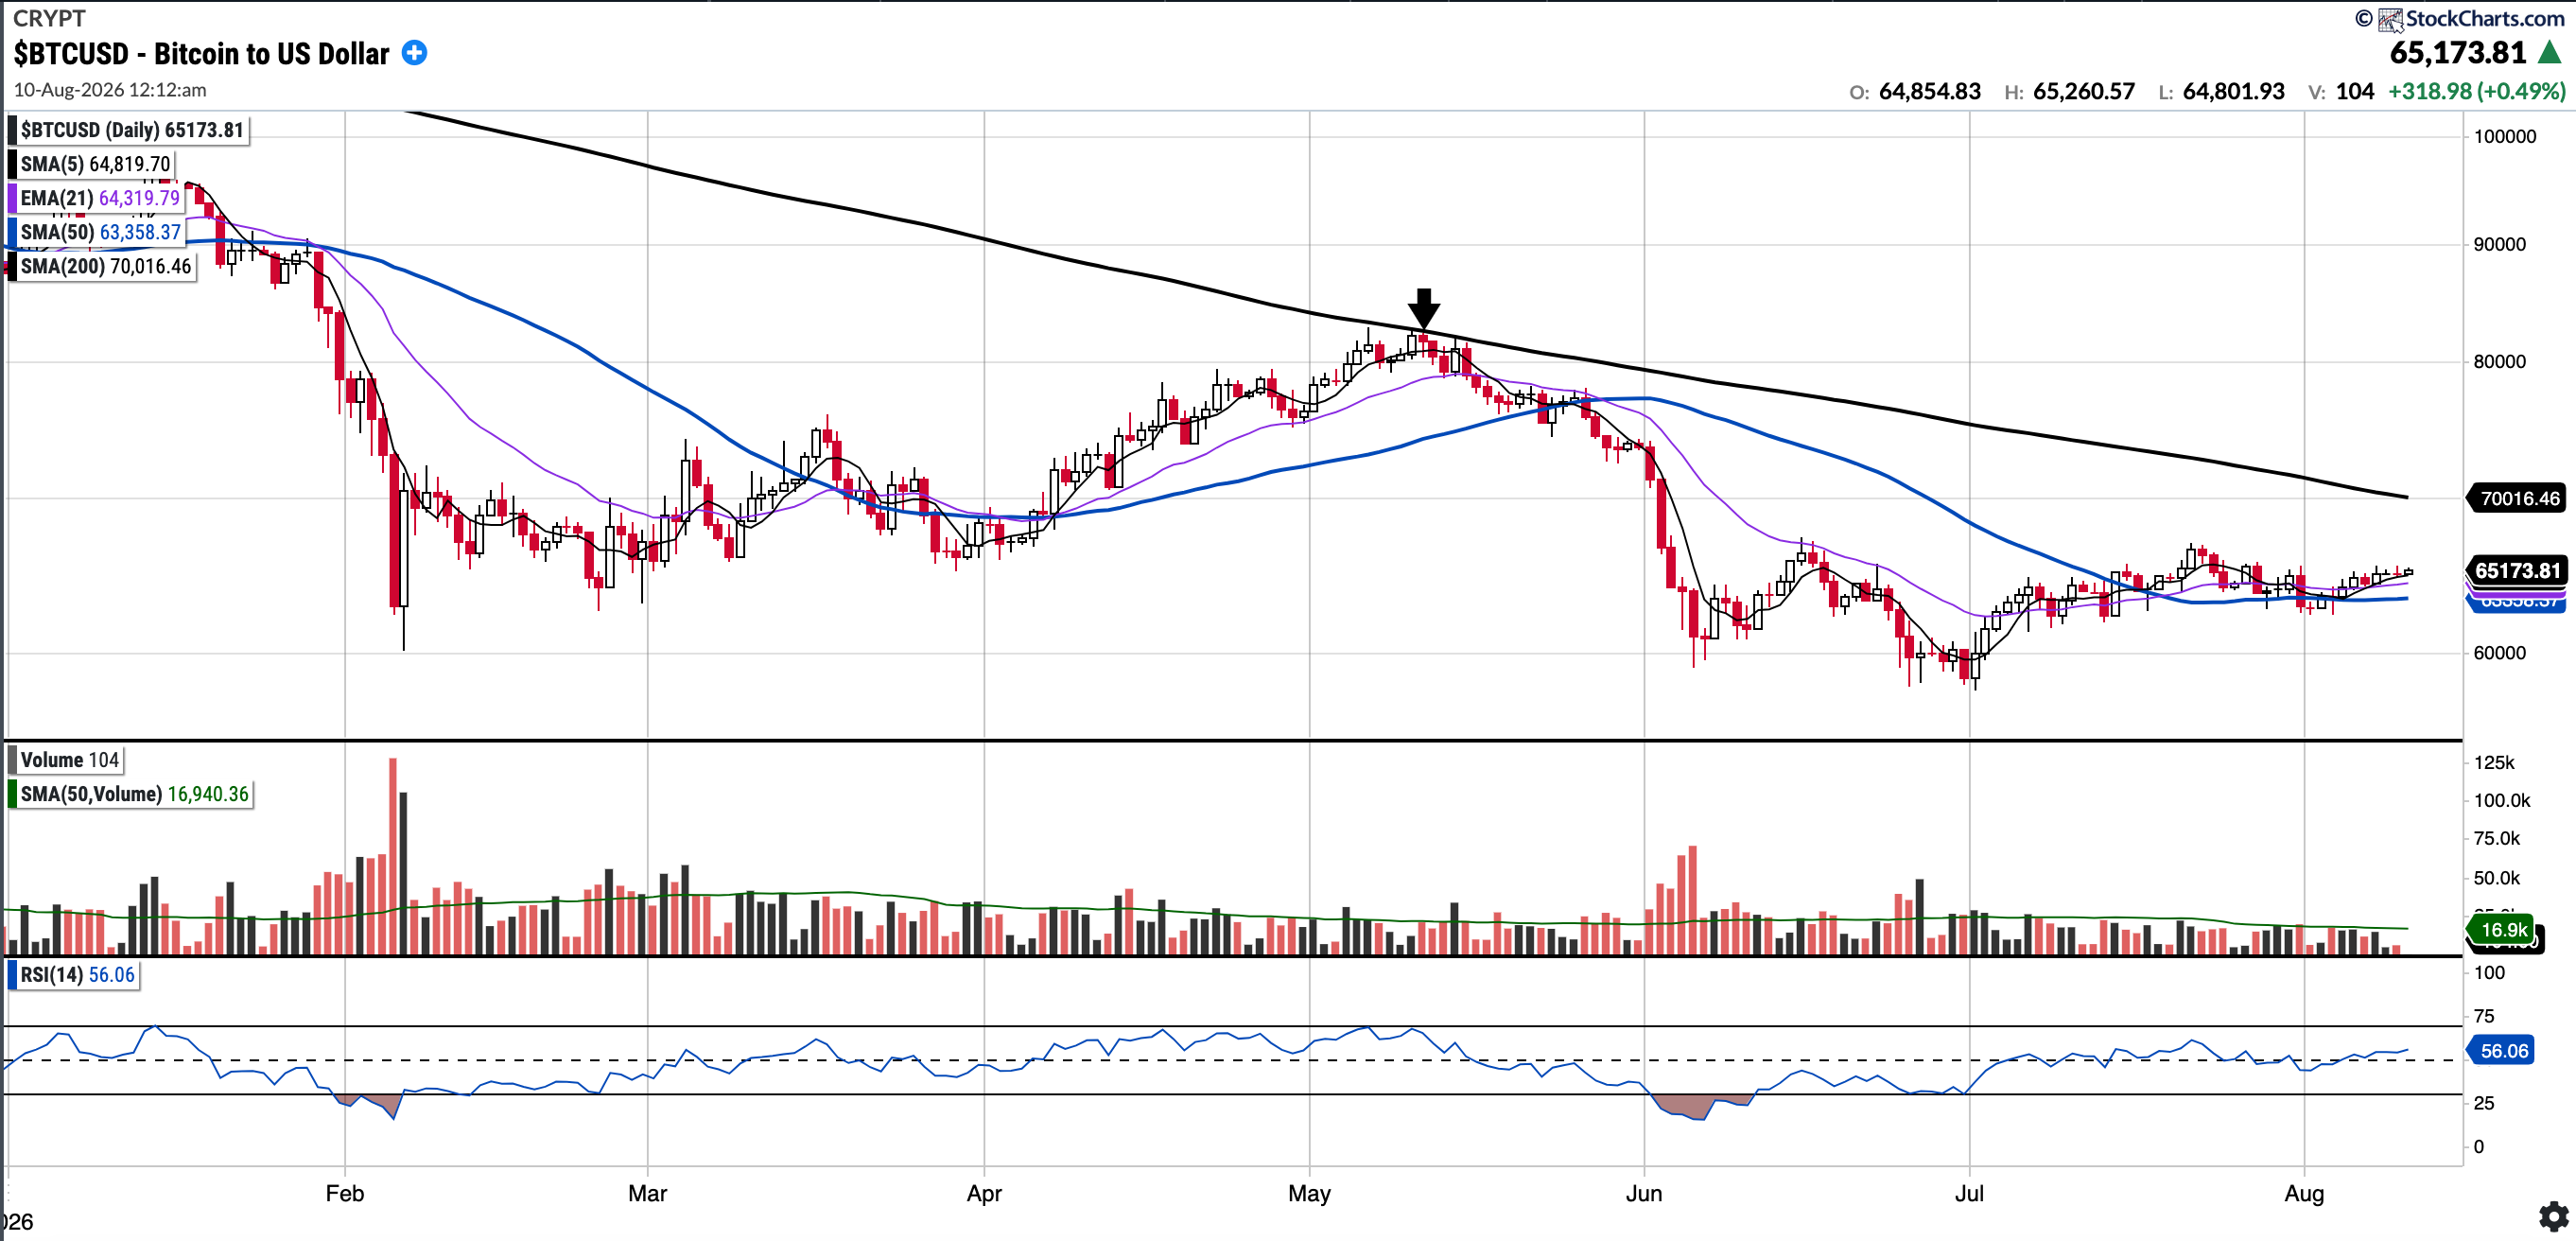
BTC (currently Long)
Currently trades at $65,173.81, 2.85% above the 50SMA and 6.93% below the 200SMA.
RSI 56.06
-26.5% YTD.
The U.S. Senate Banking Committee advanced the Digital Asset Market Clarity Act to the full Senate in a bipartisan 15–9 vote a few weeks ago. Whilst there had been some regulatory, a procedural vote is now scheduled for mid-September. This delay has likely reduced the bill’s chances of becoming law in 2026.
As of Monday, August 10th at 01:16 BST, BTC is trading at 65,173. From a technical perspective, it is above the shorter-term moving averages but remains below the 200 SMA. Bulls will want to see a reclaim of the 200 SMA in the coming weeks, given that it has served as strong resistance.
EEM
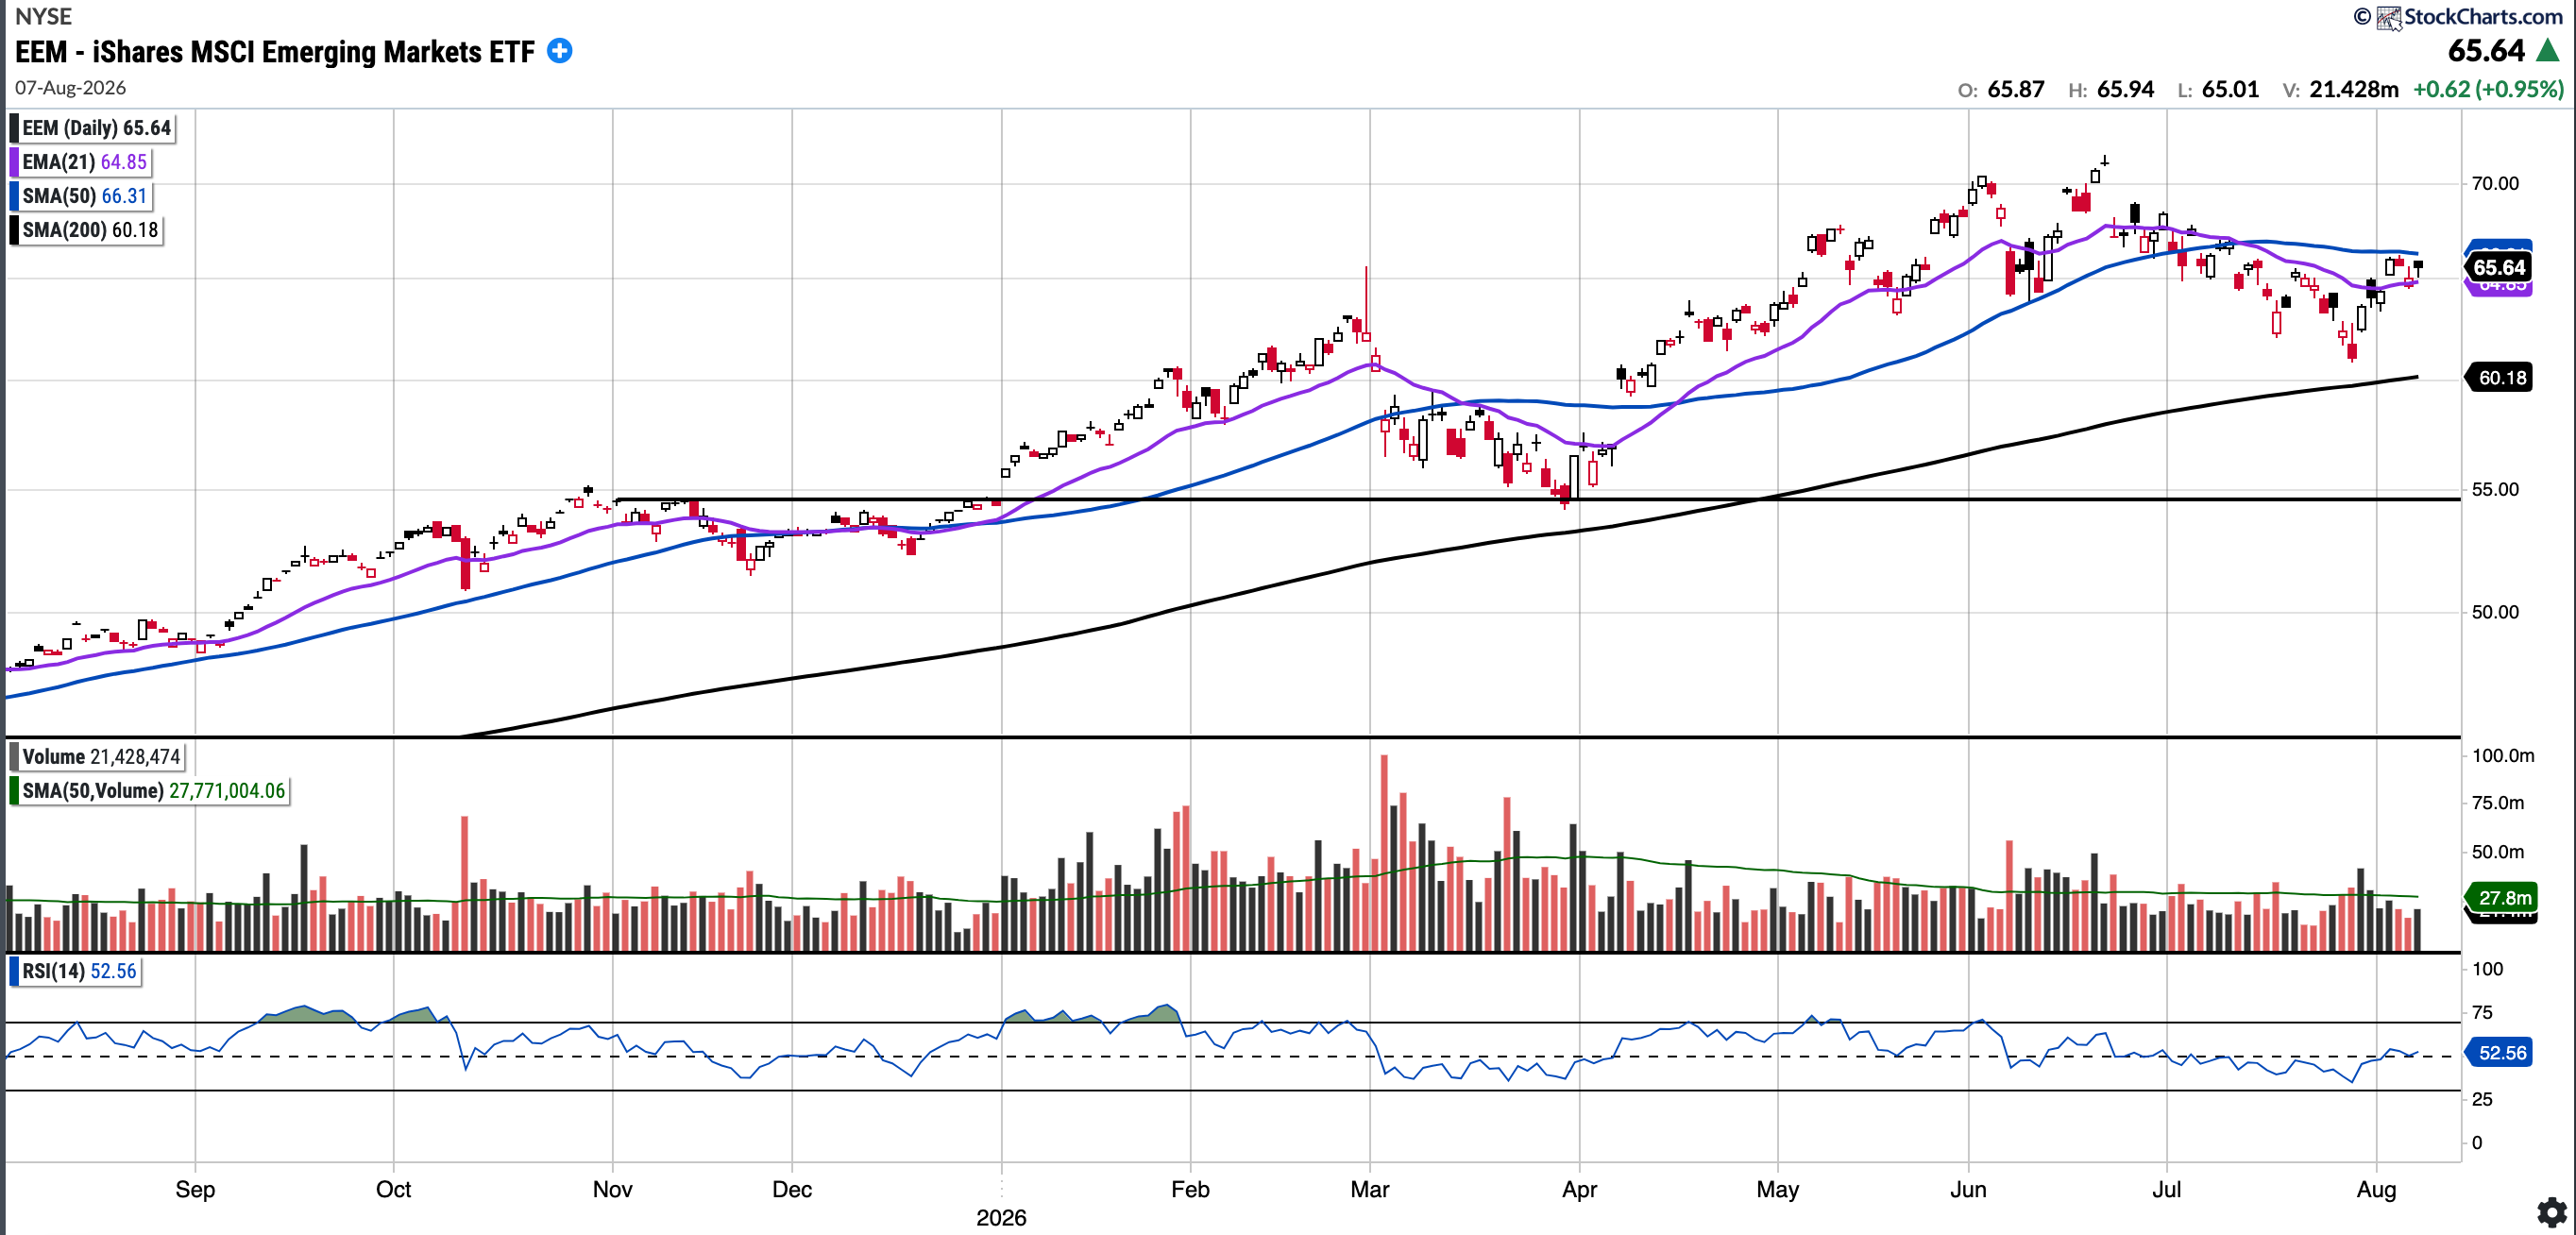
Currently trades at $65.64, 1.00% below the 50SMA and 9.08% above the 200SMA
RSI 52.56
+17.32% YTD
EEM remains in an uptrend and whilst it continues to outperform the SPX YTD the gap has narrowed to around 400bps
For the third consecutive week, EEM closed comfortably below its 50-day moving average. This is likely due to the fact that TSMC, Samsung, and SK Hynix, which make up around 30% of the ETF, have been consolidating.
GOLD (Long Physical)
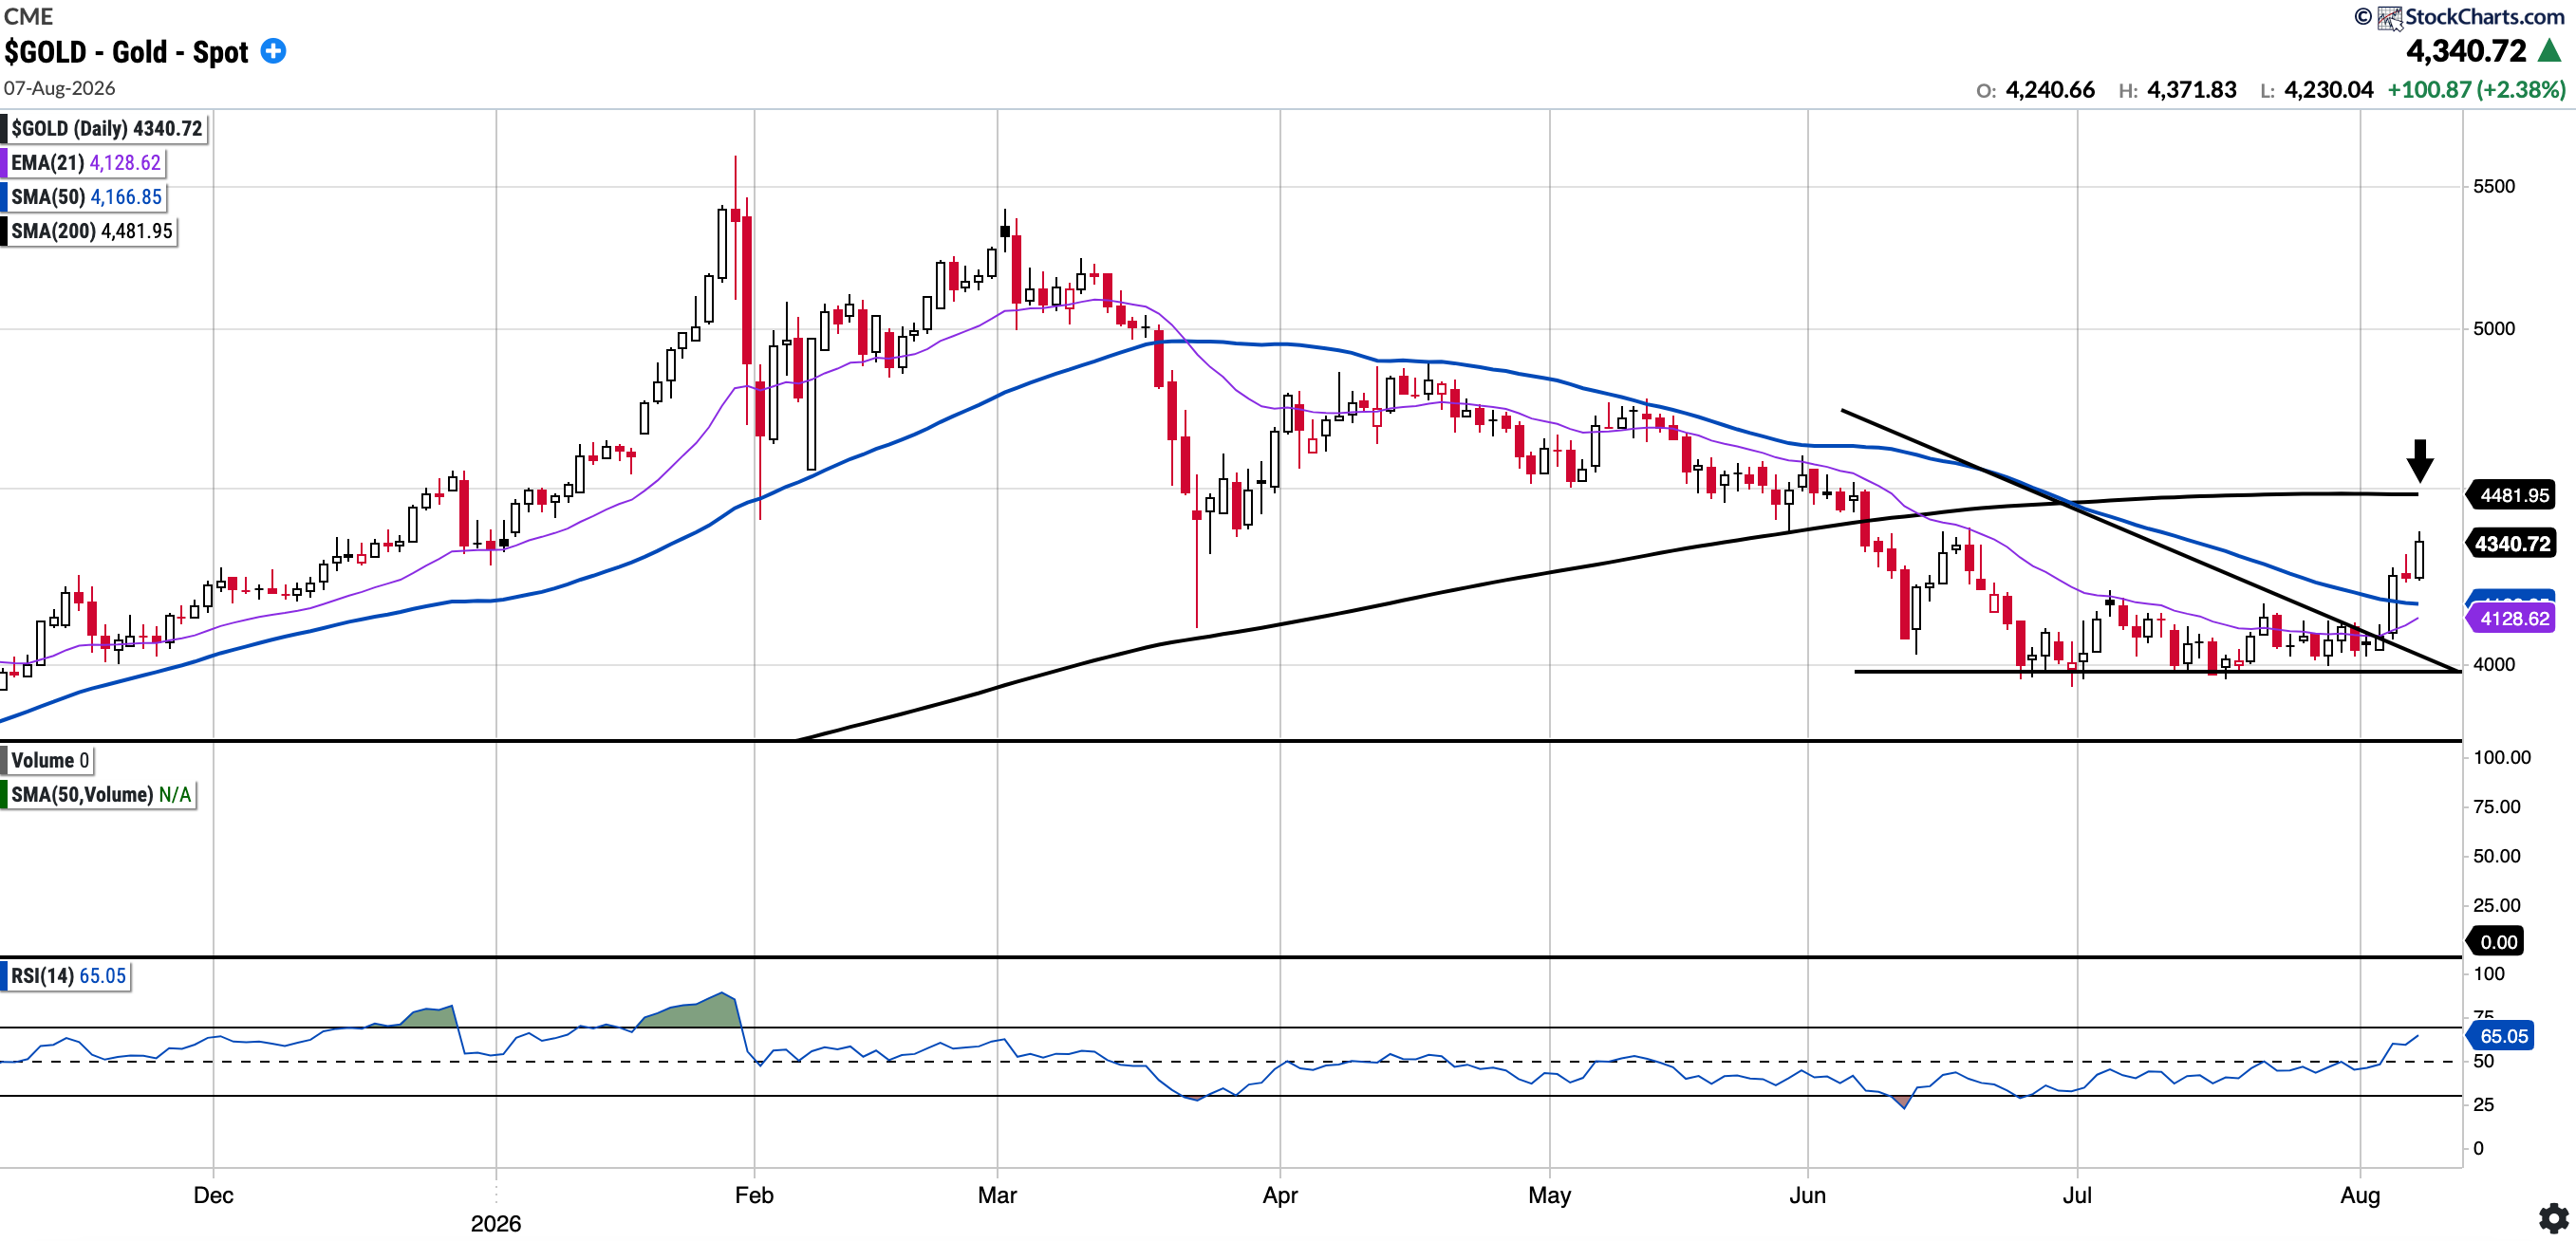
Currently trades at $4,340.72, 4.17% below the 50SMA and 3.15% below the 200SMA
RSI 65.05
+0.42% YTD
In early June, Gold lost its 200-day moving average for the first time since its bull run began in late 2023 which is notable and it has not been able to come close to reclaiming it.
The 21-day moving average has persistently been a resistance point for Gold; however, it was reclaimed this week as Gold broke out of a falling wedge pattern. Bulls will want to see the 200-day moving average reclaimed next.
SOXX
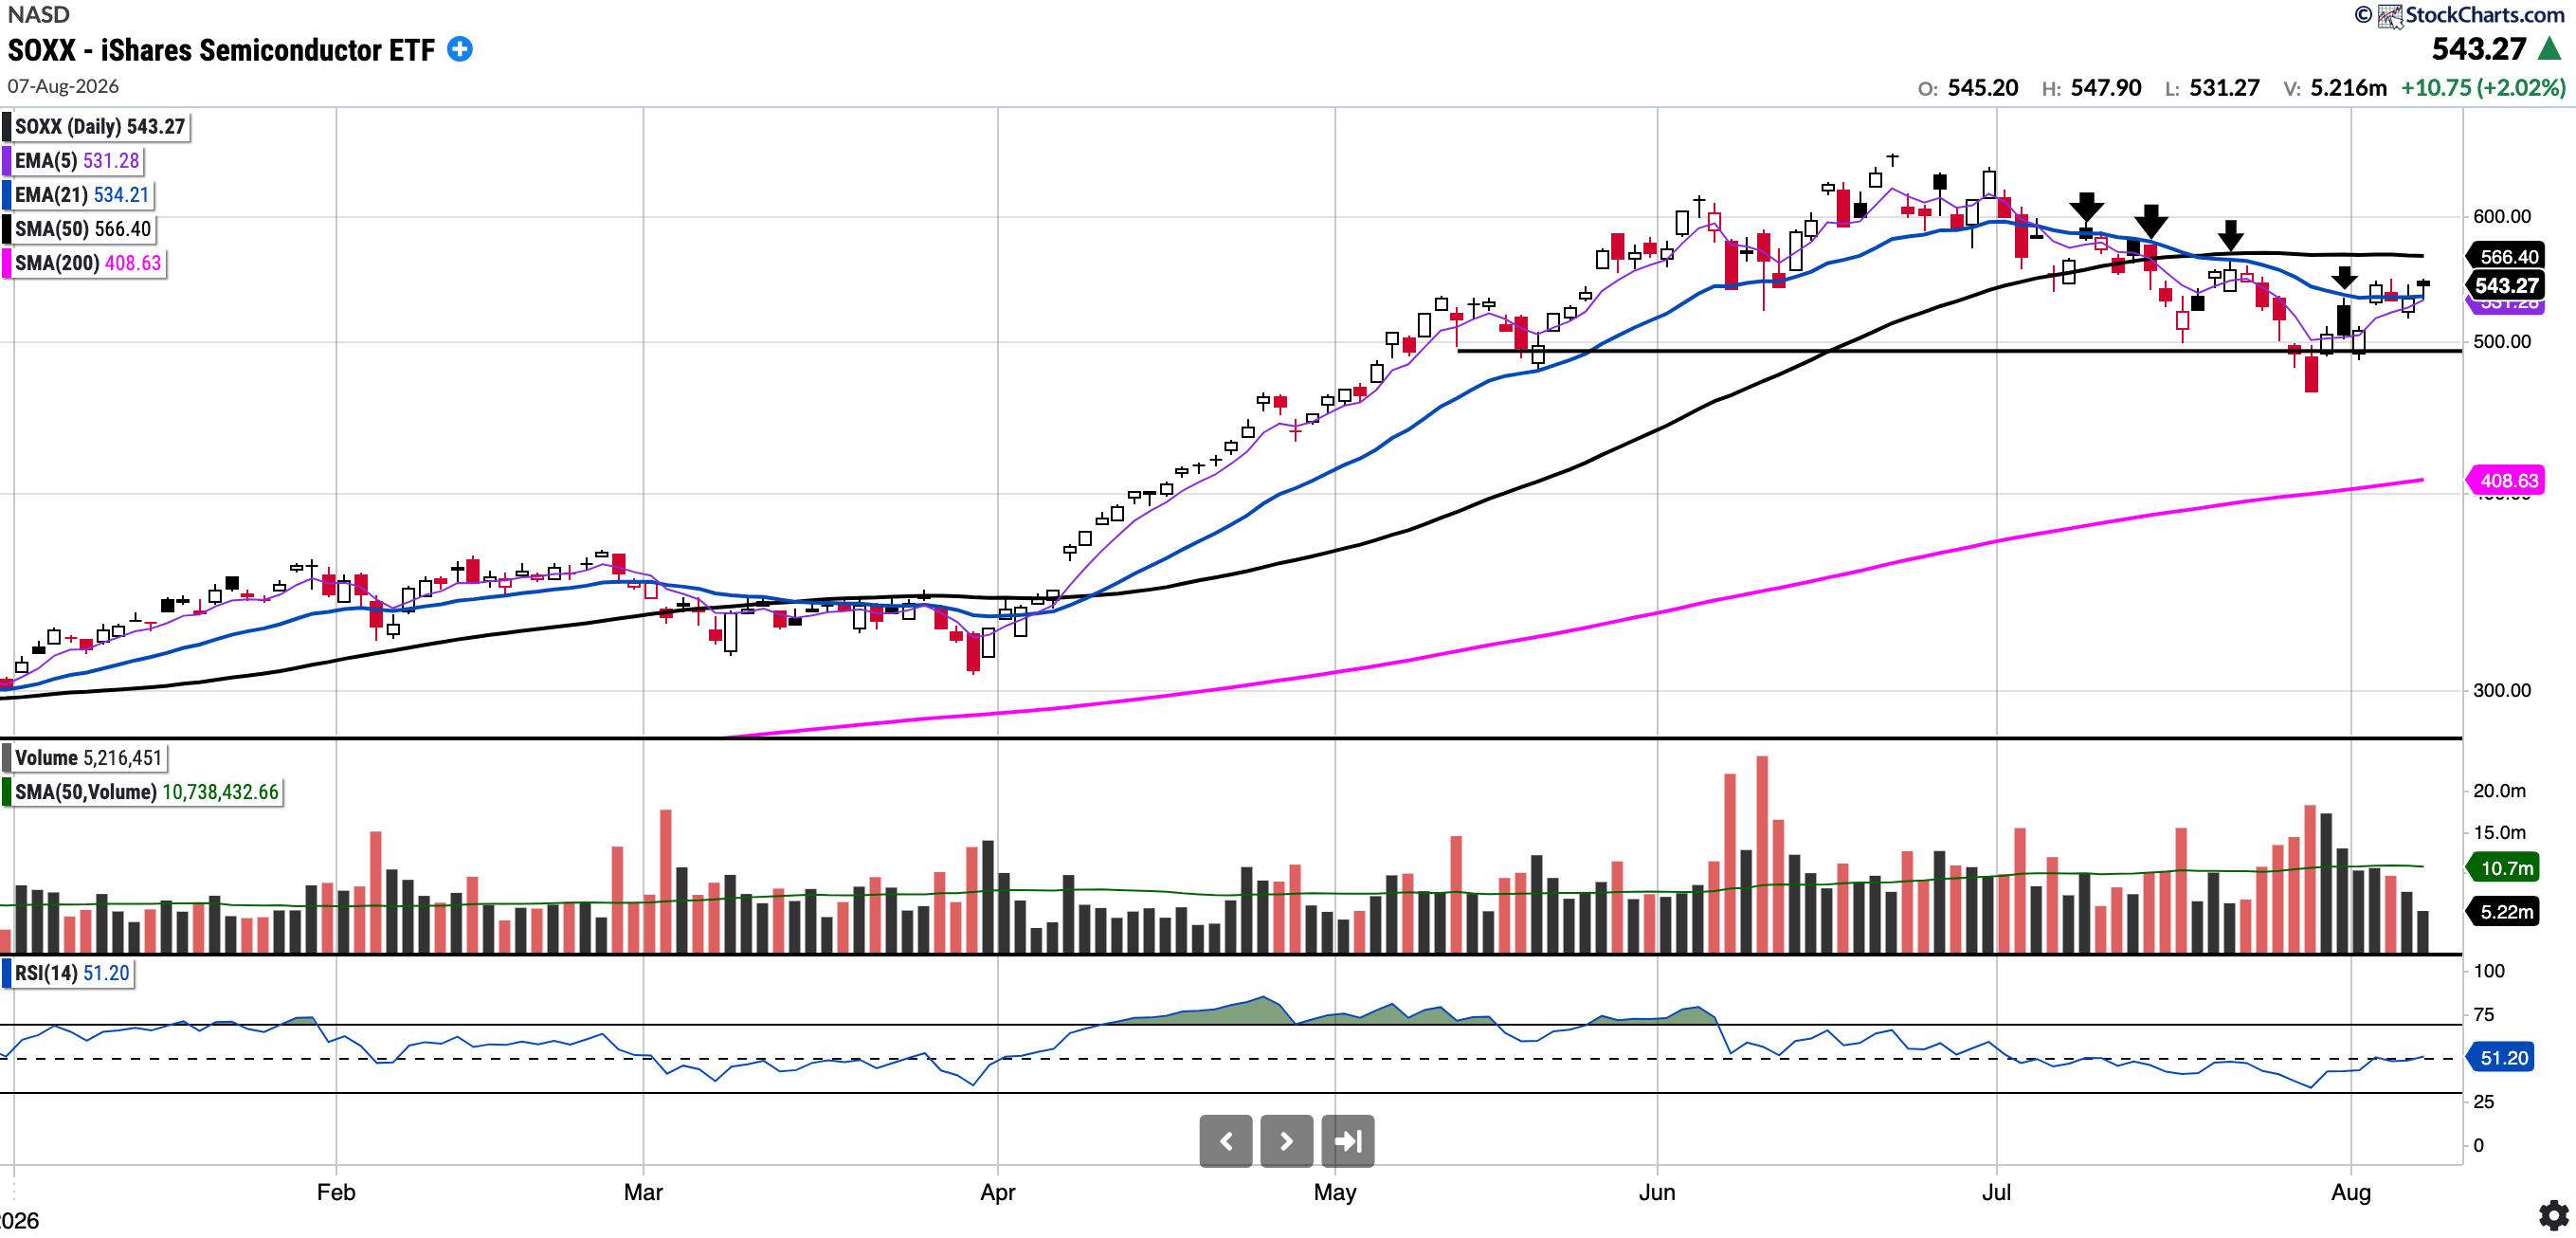
Currently trades at $543.27, 4.08% below the 50SMA and 32.95% above the 200SMA
RSI 51.2
73.38% YTD
On July 6th, SOXX printed a bearish 5/21 EMA cross, signalling a near-term momentum shift, and has been trending downward since.
However, this week SOXX traded strongly, and while it remains below the 50-day, it did close above the 21-day EMA, which had served as resistance. Bulls will want to see a 5/21 cross to the upside to confirm momentum.
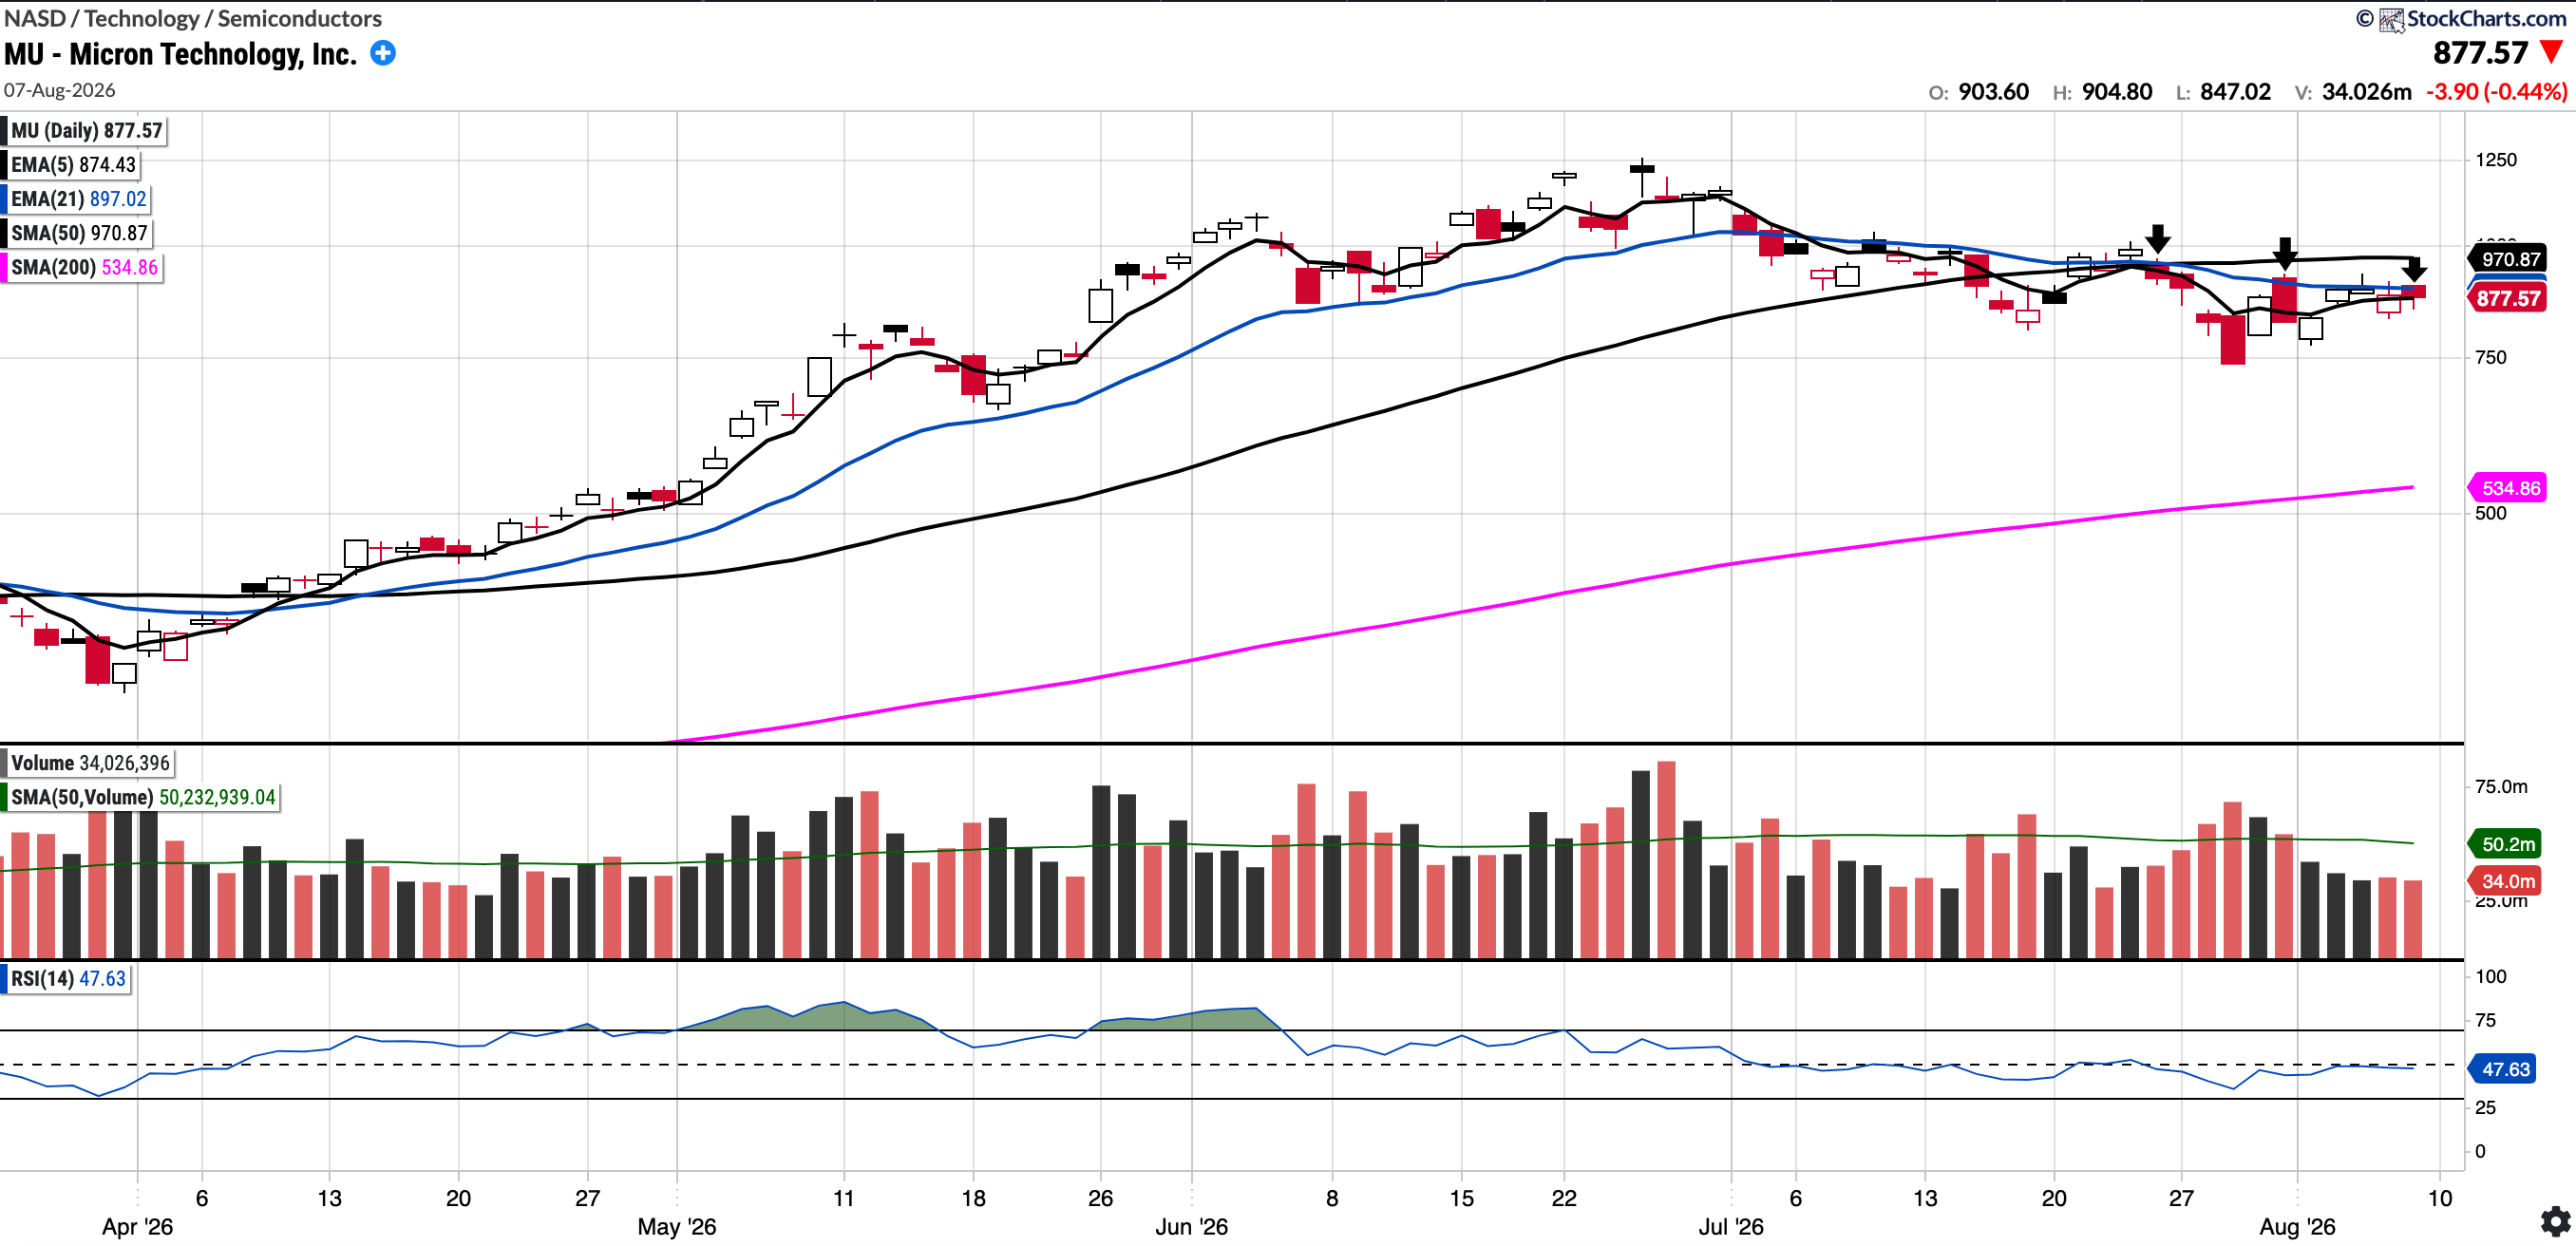
MU
Currently trades at $877.57, 9.61% below the 50SMA and 64.07% above the 200SMA
RSI 47.14
178.38% YTD
Whilst MU traded up this week, it once again found resistance at the 21-day moving average and closed below the 50-day for the fourth consecutive week. Bulls will want to see a reclaim of the 21-day moving average and a decisive weekly close back above the 50-day, sooner rather than later.
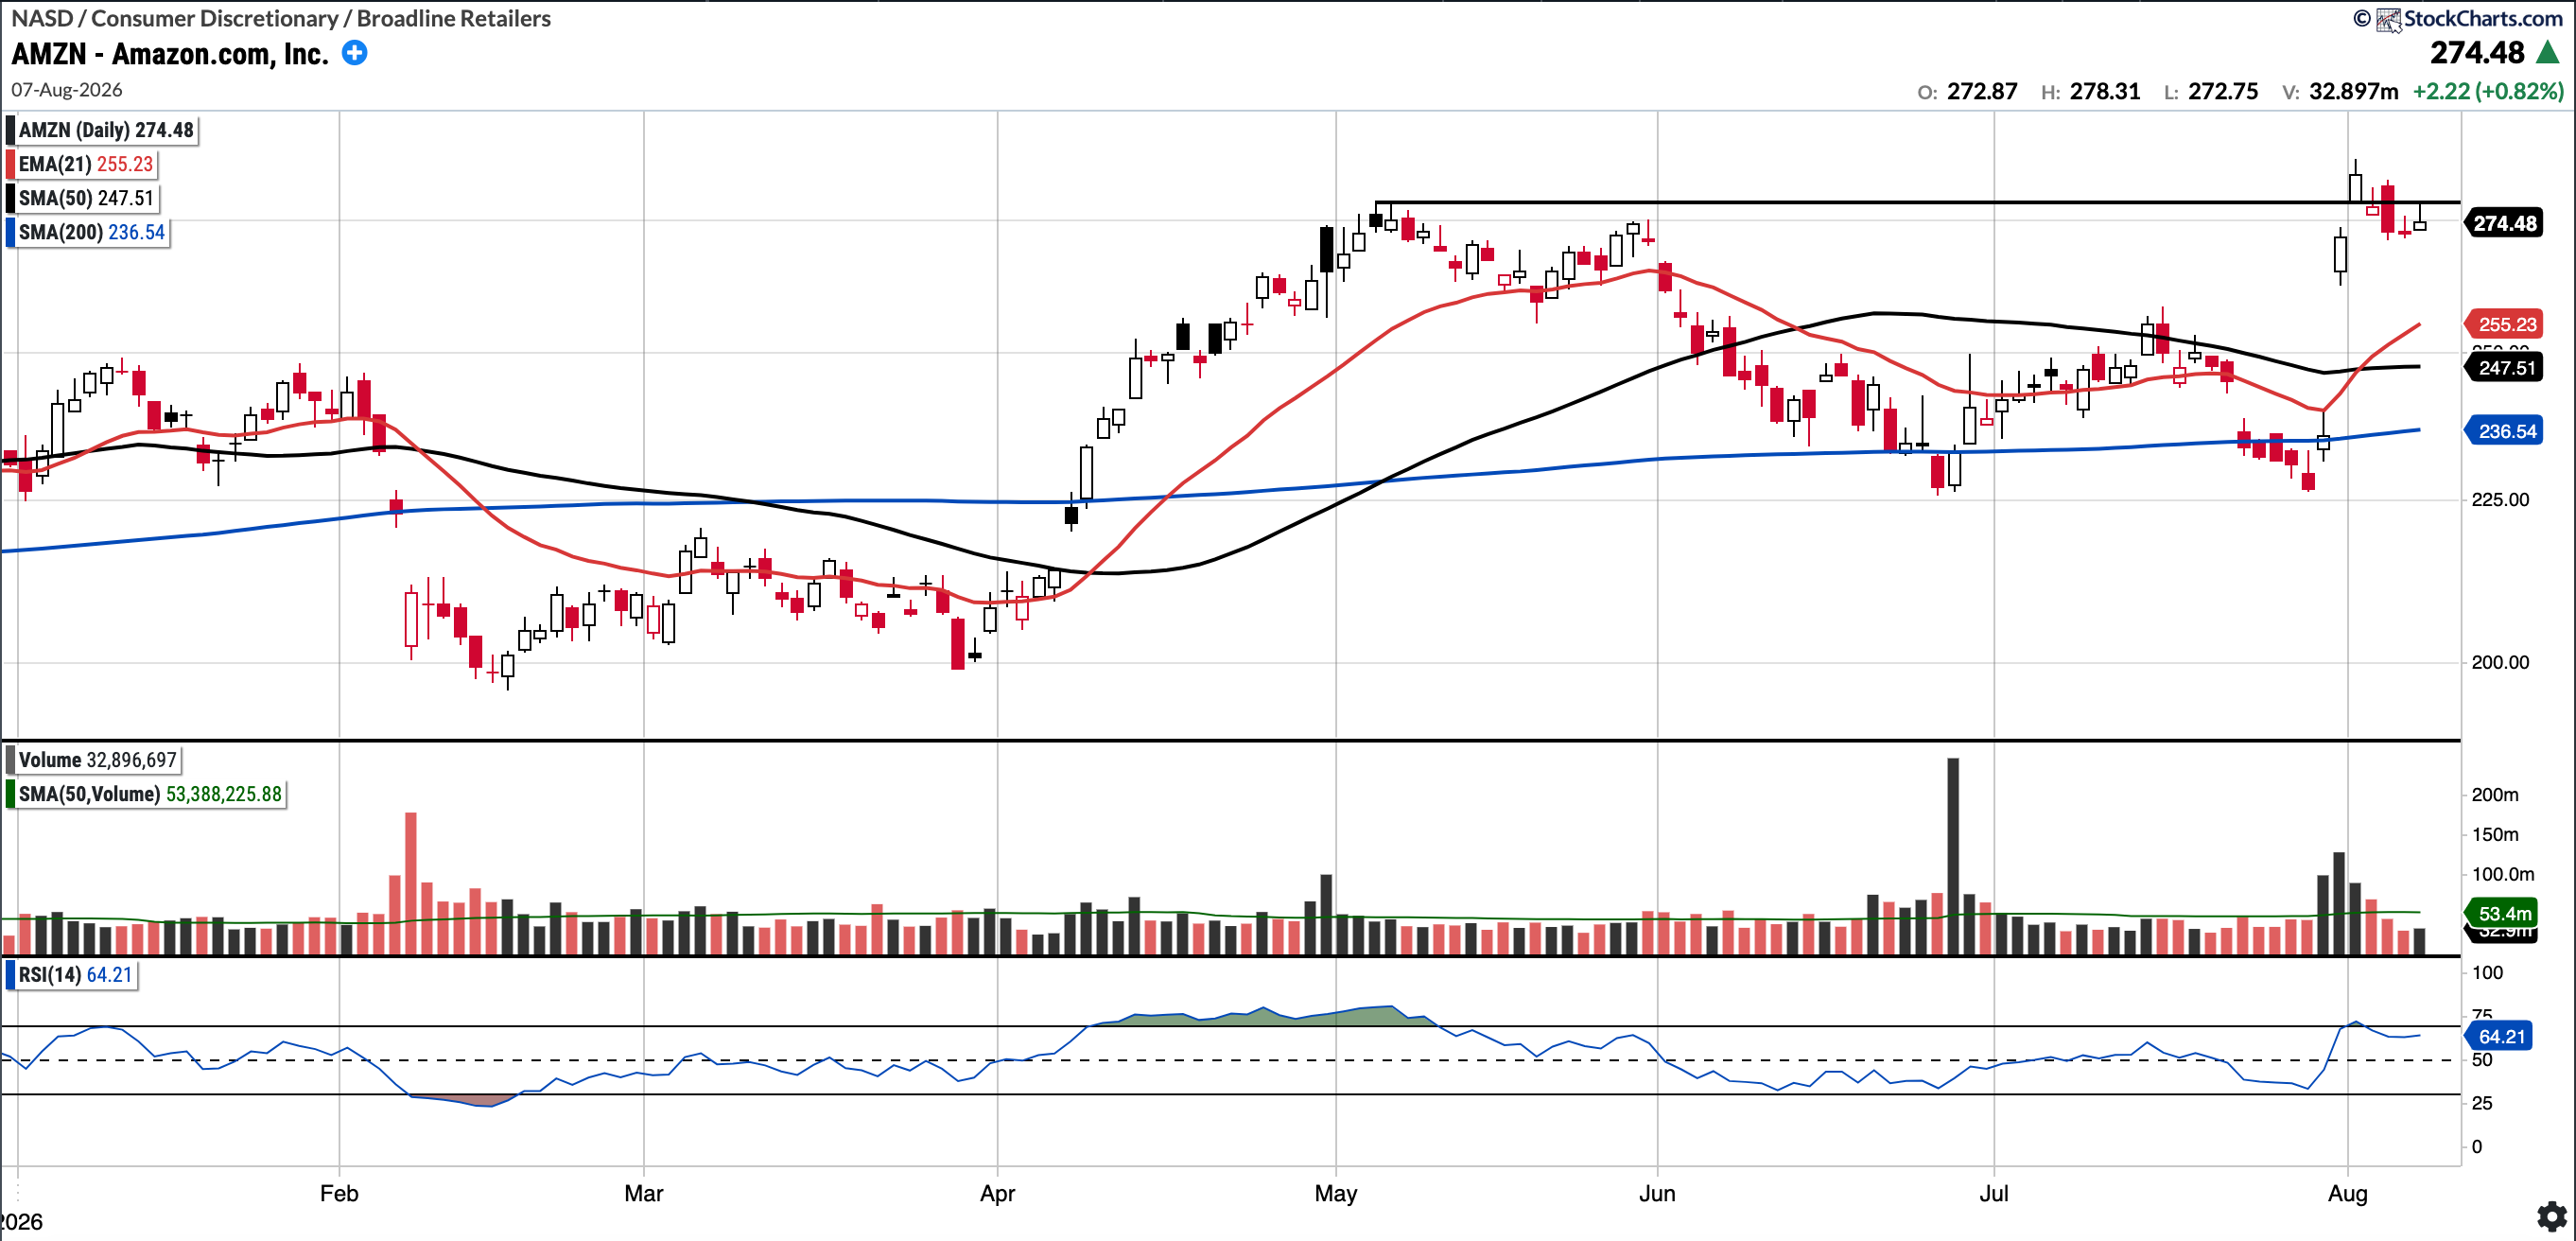
AMZN (Currently Long)
Currently trades at $274.48, 10.9% above the 50SMA and 16.04% above the 200SMA
RSI 64.21
21.18% YTD
Amazon stock has been mostly range-bound for the last year. However, after a strong earnings print on July 30, the stock rallied and set a new high last week. This week, Bezos’s bulk selling is weighing on the stock, and it has retraced to just below the prior ATH. Once the selling is digested, bulls will want to see the stock rally to new highs.
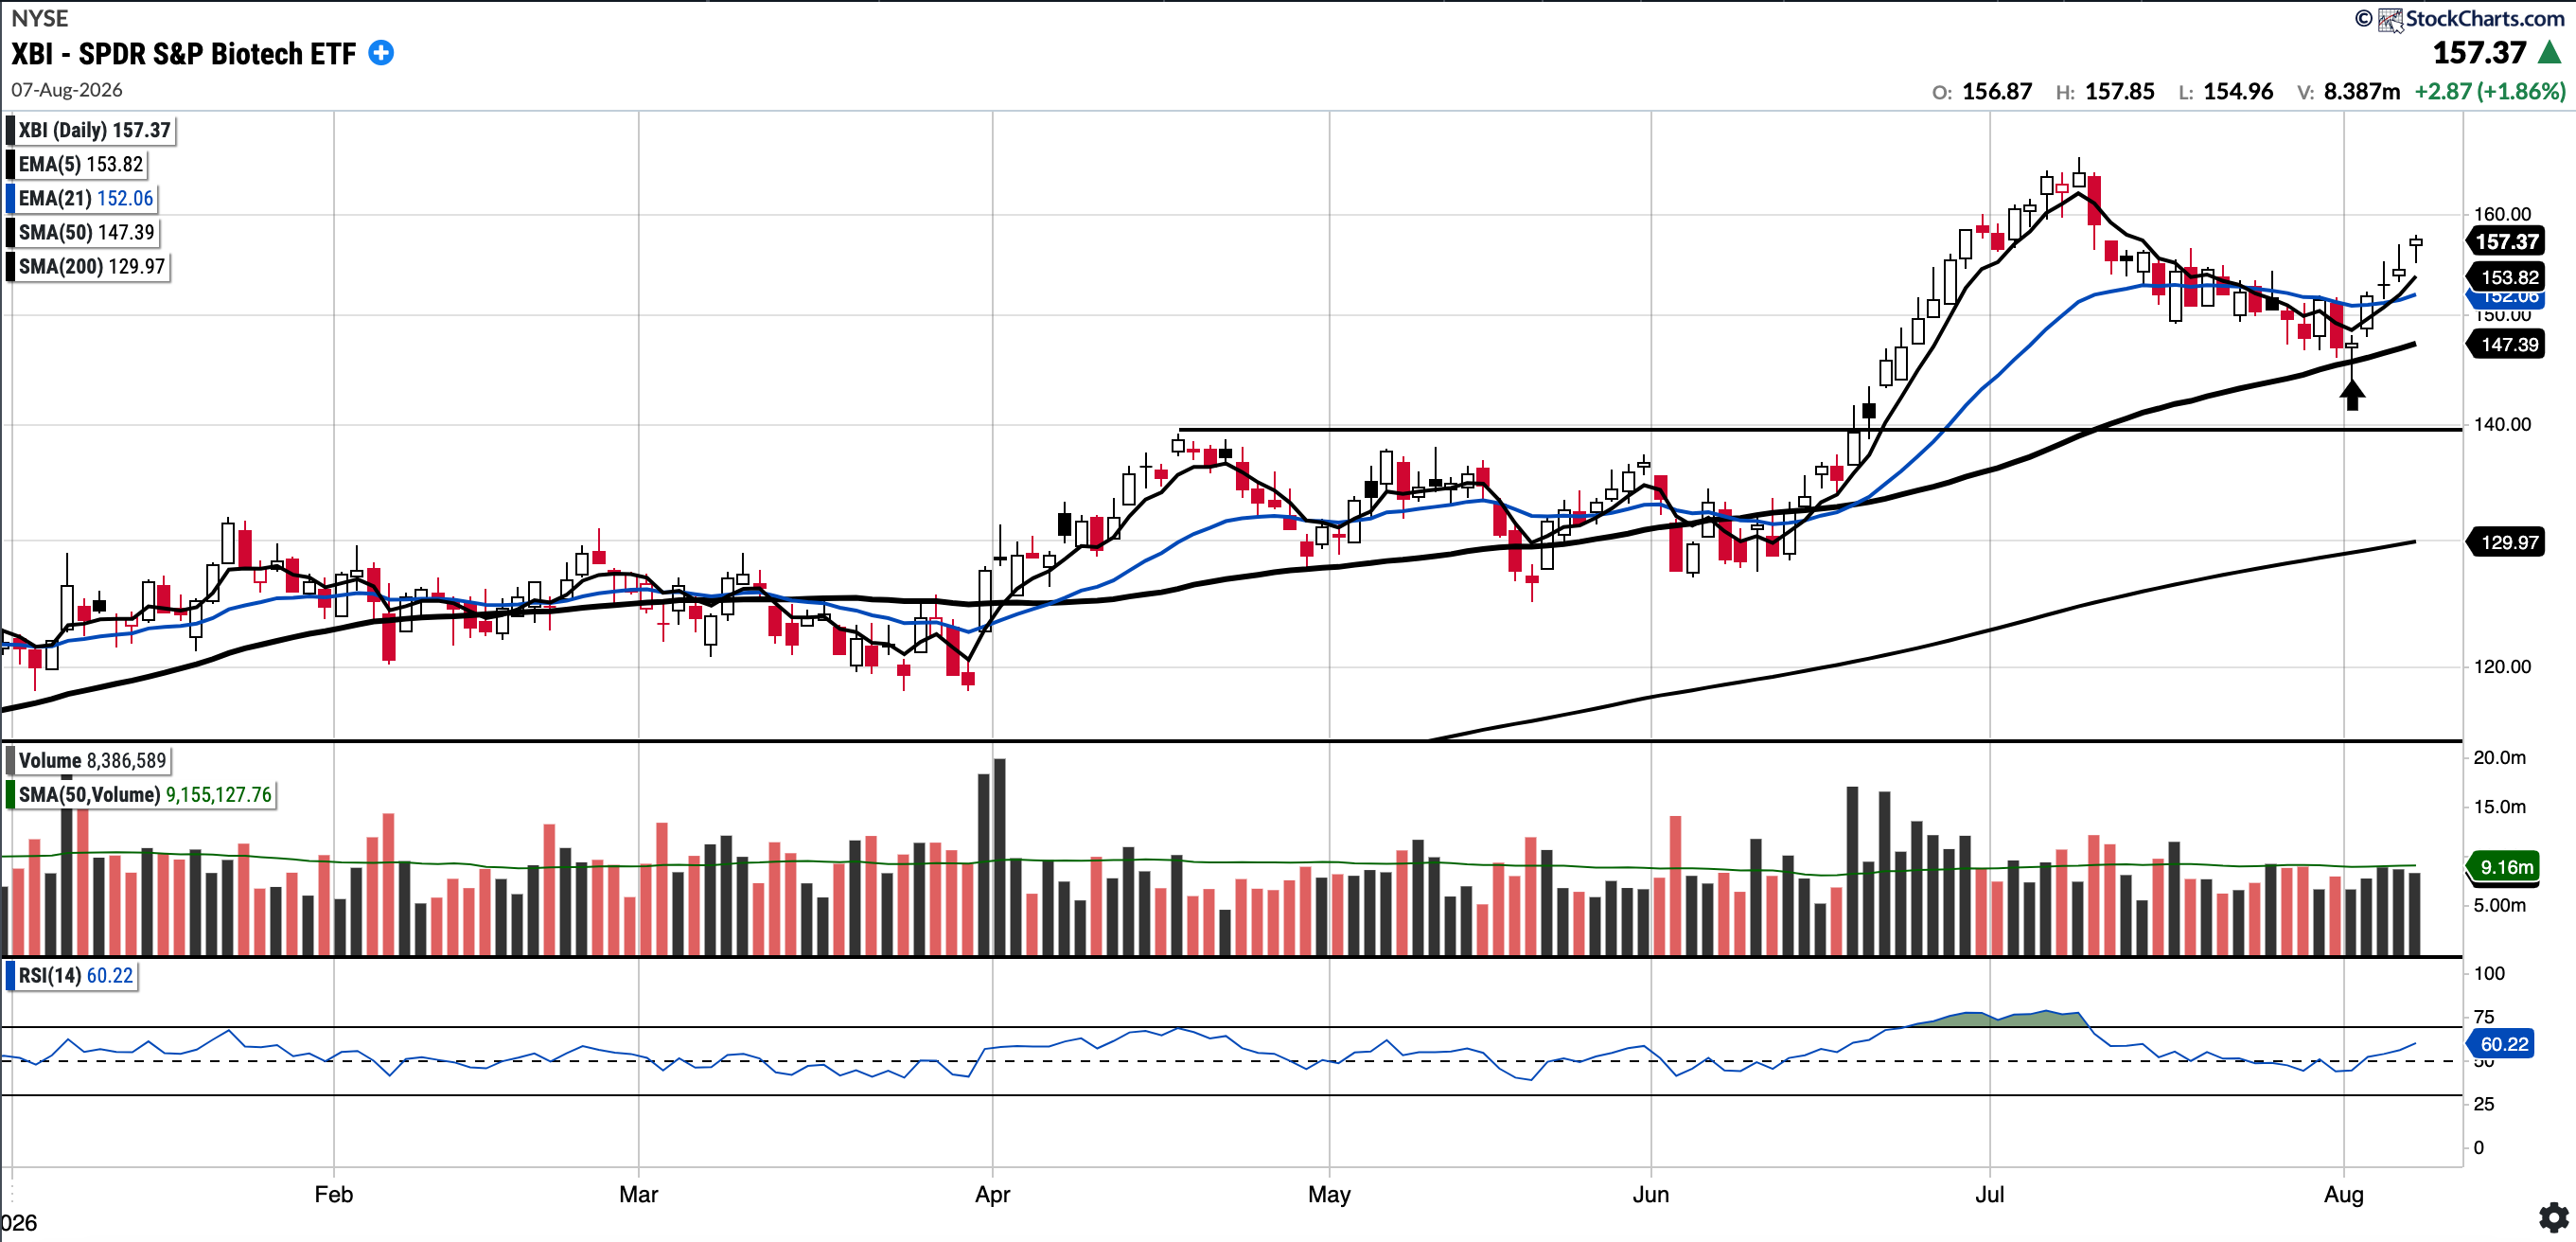
XBI
Currently trades at $157.37, 6.77% above the 50SMA and 21.08% above the 200SMA
RSI 48.6
29.63% YTD
The XBI (S&P Biotech ETF) had been particularly overbought in late June and early July, but it gave a good opportunity on the 50-day SMA retest last week.
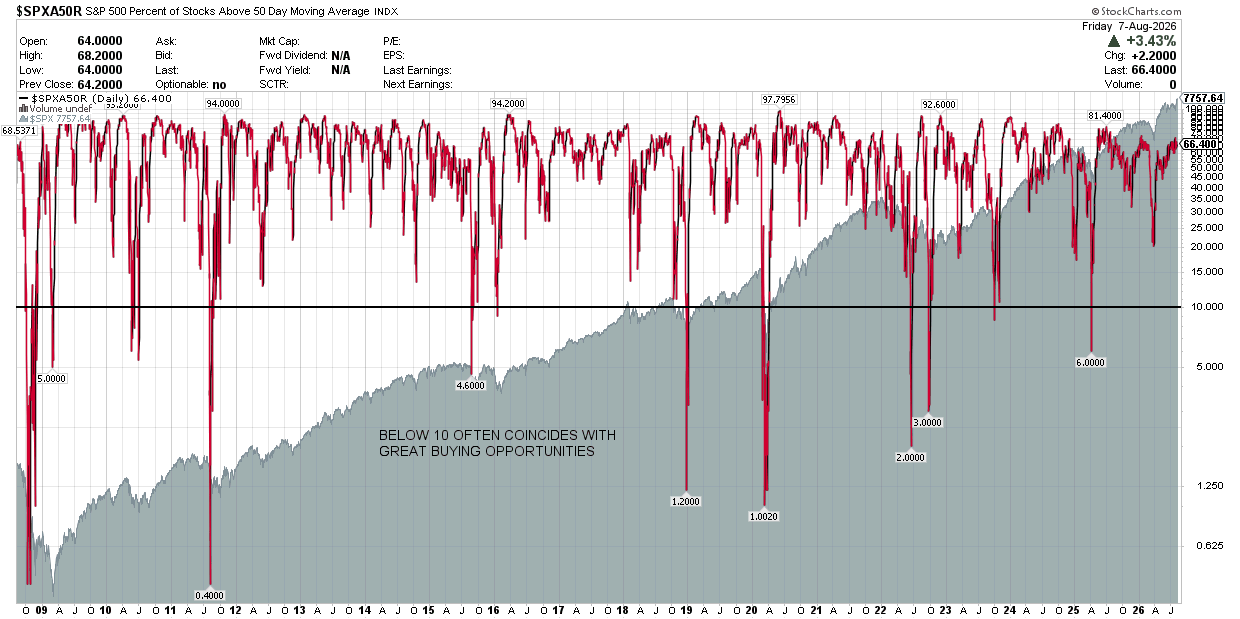
S&P 500 Percentage of Stocks Above the 50 Day Moving Average: Currently 66.4%
Breadth increased slightly this week, with the percentage of stocks above the 50-day moving average now at 66.4%.
Notable portfolio changes in previous week (all updated live in subscriber channels):
