

Hope you all are having a good weekend. Below, we will be previewing the upcoming week’s events and providing a portfolio update as usual.
Format for what is covered in this weekly preview:
A Look at the Indices
Key Upcoming Economic Events
Upcoming Earnings
Charts
Current Portfolio Holdings:
Sizing | Cost Basis | Timeframe | Planned Moves
Closing Thoughts (Scroll to here for my Market Commentary)
I recommend checking out the most recent Monthly Portfolio and Performance Update below:

Indices
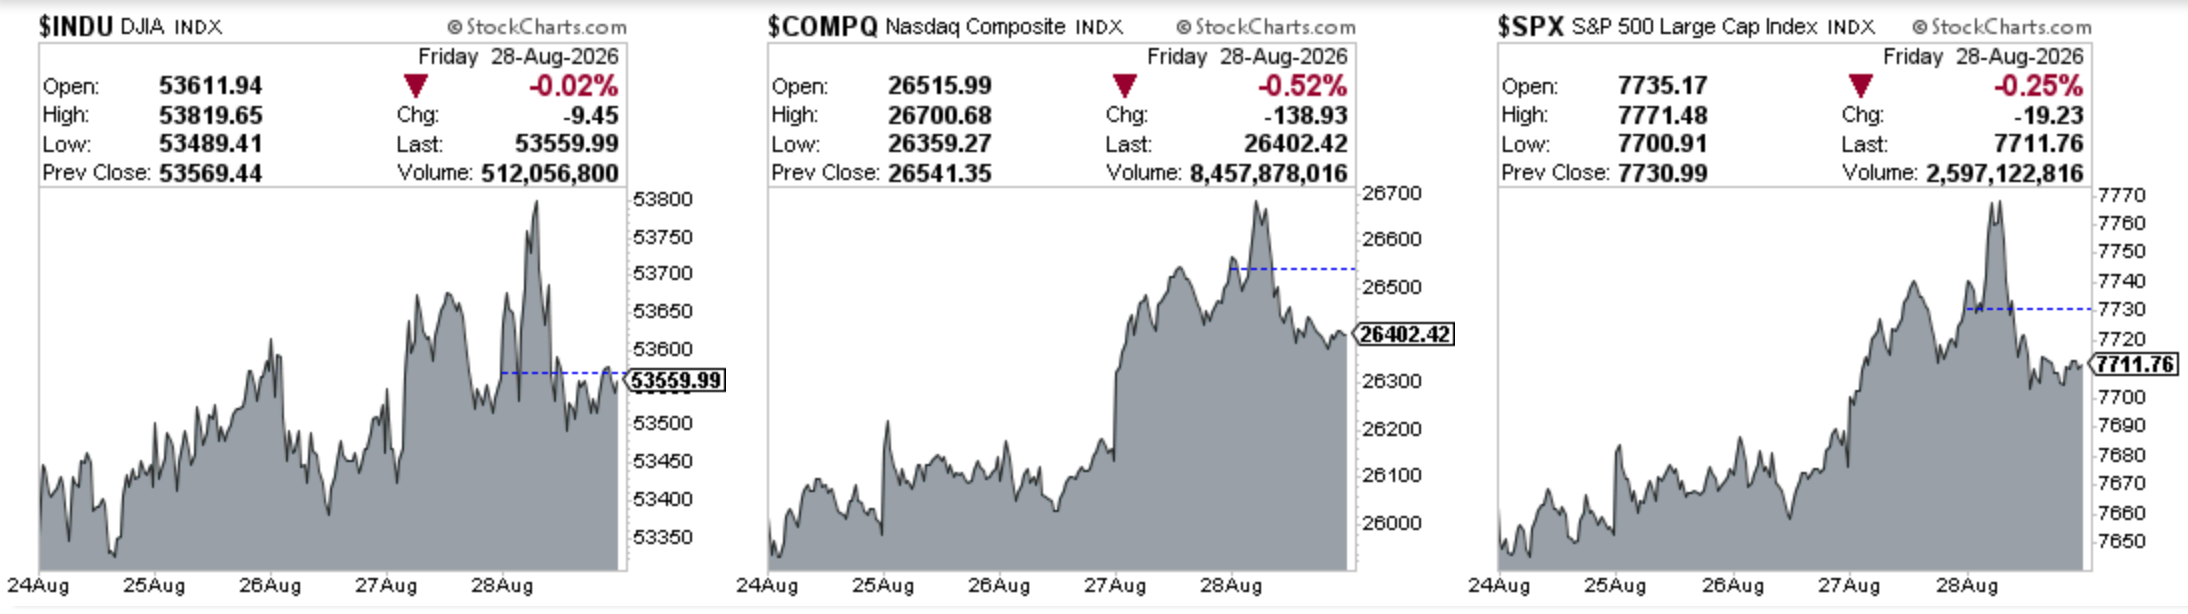
Dow Jones Industrial Average advanced +0.53% in the last week
S&P 500 advanced 0.49% in the last week
Nasdaq Composite advanced +0.85% in the last week
IWM declined 1.4% in the last week
Key upcoming economic events
Monday, August 31
Chicago PMI (August)
Dallas Fed Manufacturing Survey (August)
Tuesday, September 1
S&P Global Final Manufacturing PMI
ISM Manufacturing PMI (August)
JOLTS Job Openings (July)
Construction Spending M/M (July)
Wednesday, September 2
ADP National Employment Report (August)
Federal Reserve Beige Book
Thursday, September 3
Initial Weekly Jobless Claims
U.S. Trade Balance
Revised Q2 Nonfarm Business Productivity
S&P Global Services PMI
ISM Services PMI
Friday, September 4
August Jobs Report (Nonfarm Payrolls / Employment Situation) 8:30AM ET
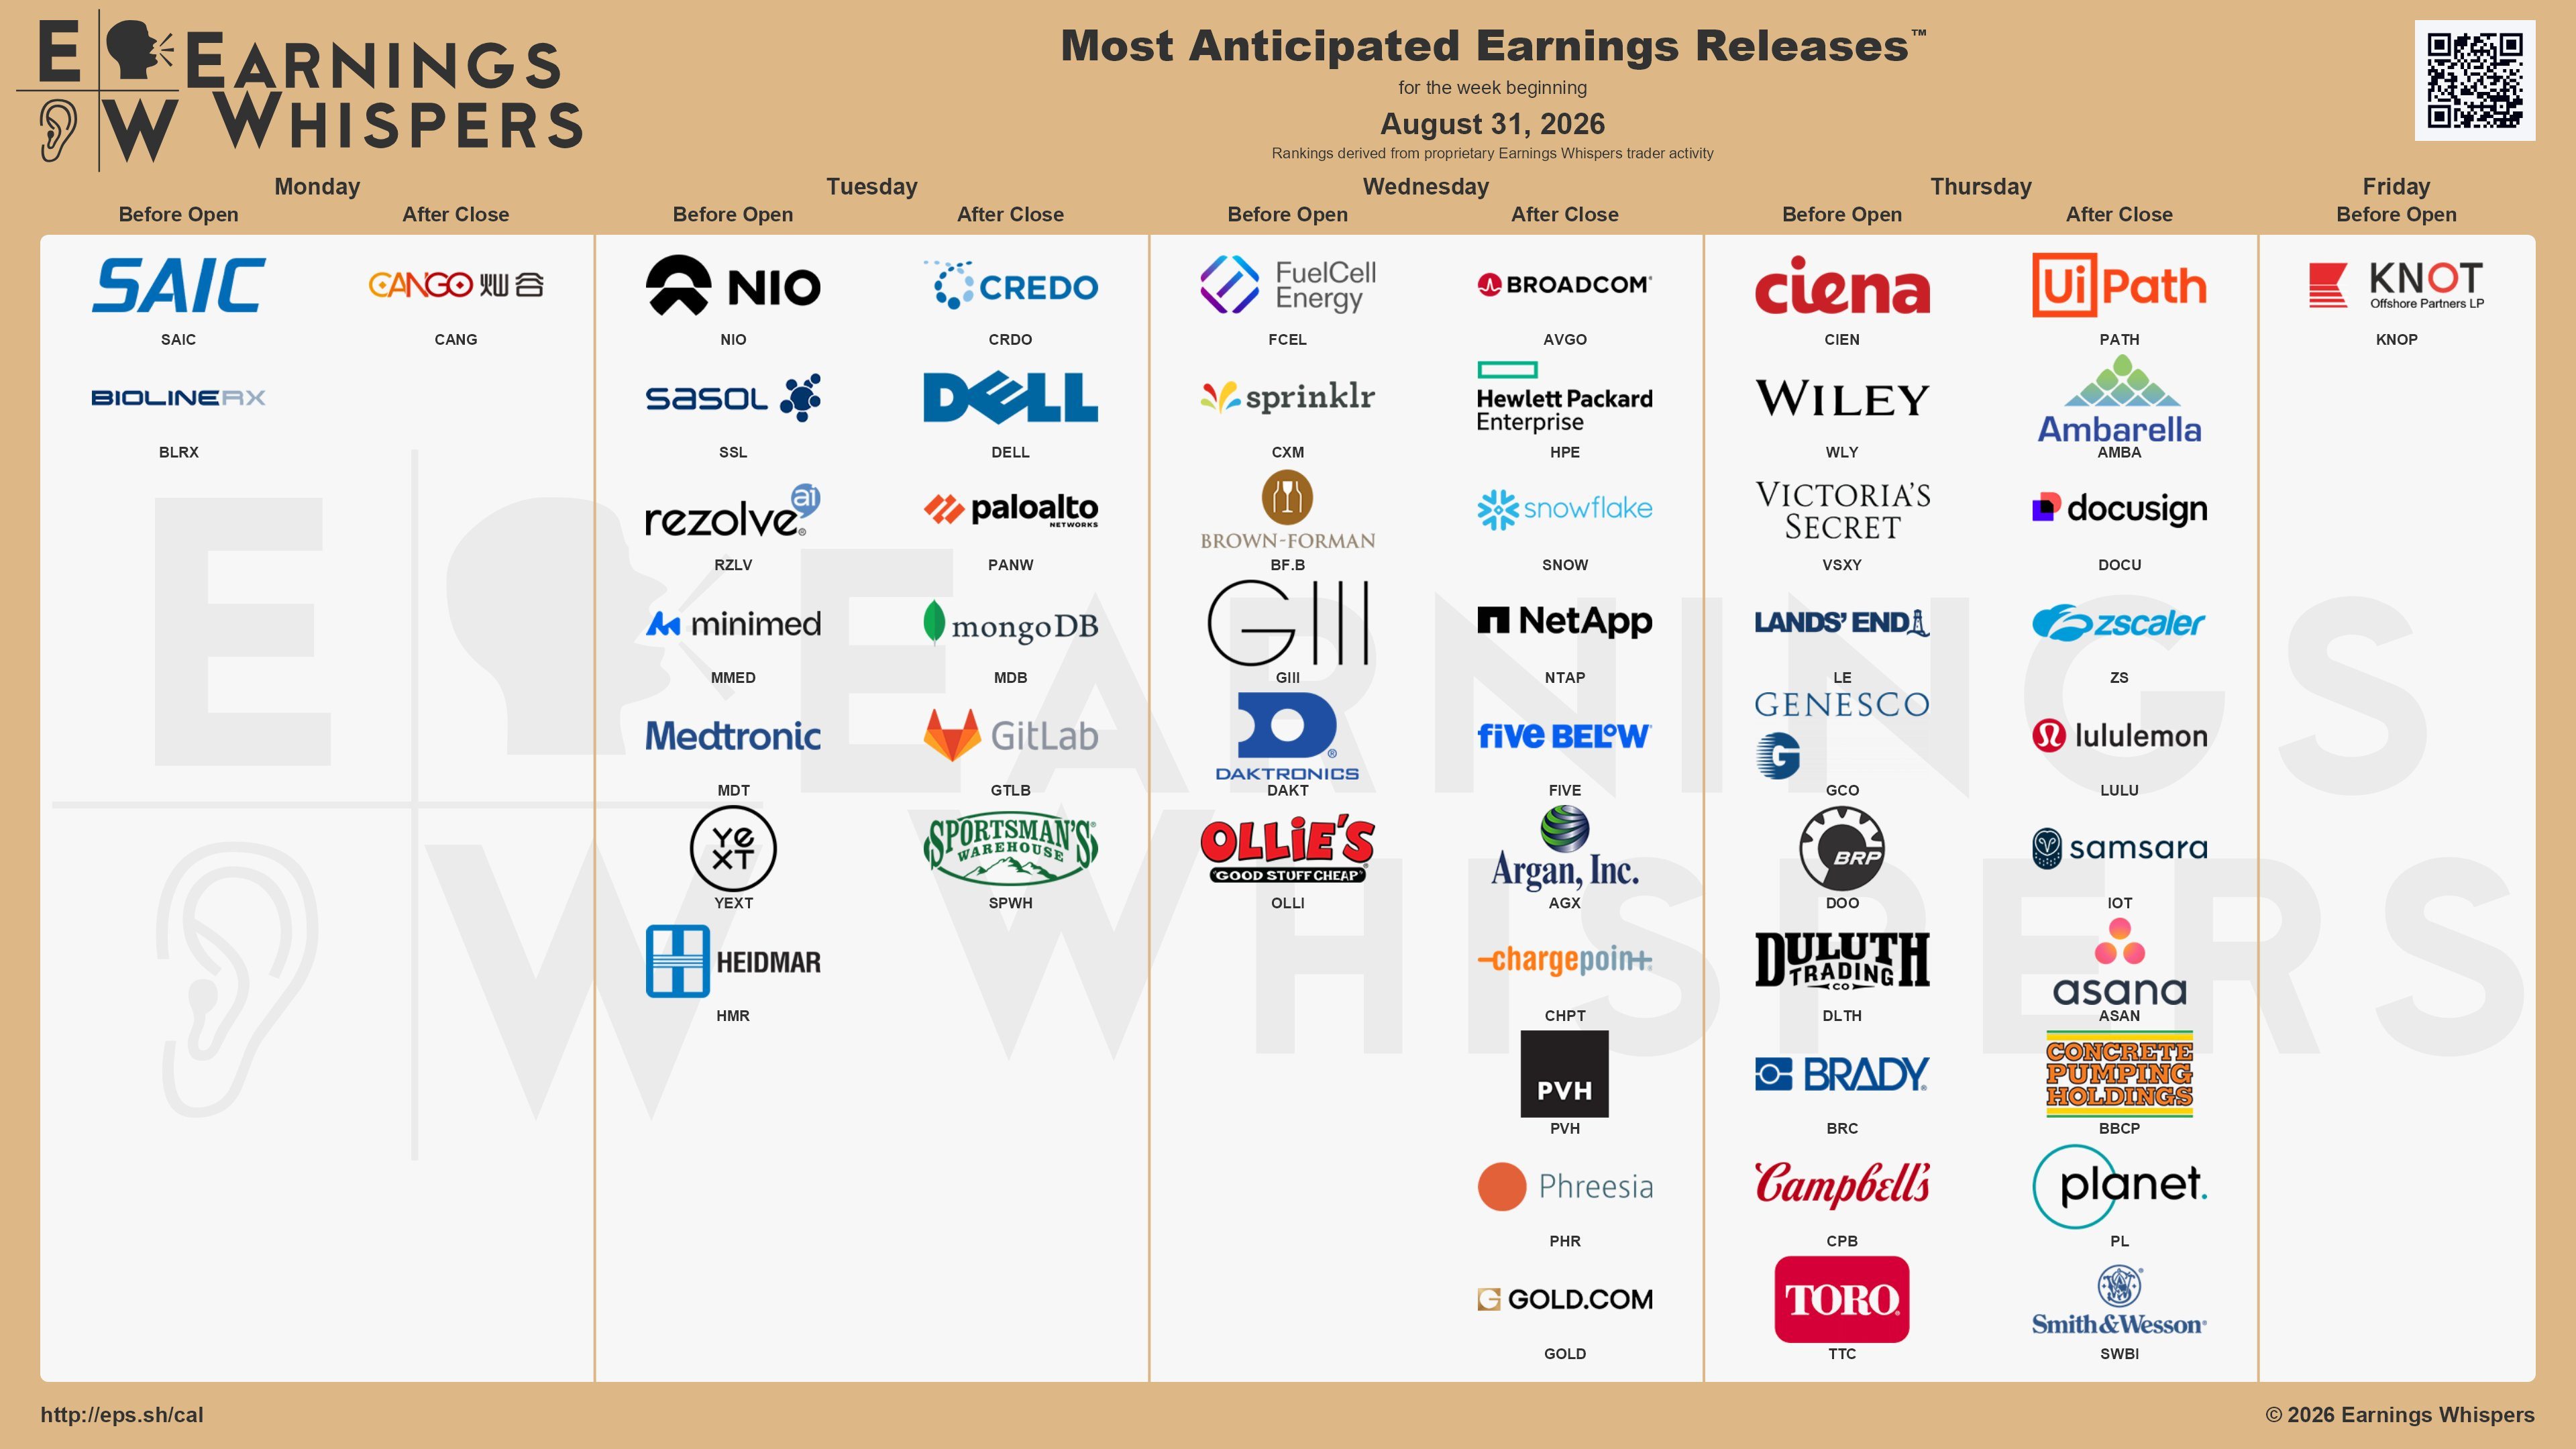
Upcoming Earnings
Below is the infographic by Earnings Whispers highlighting the schedule for this week:
Charts
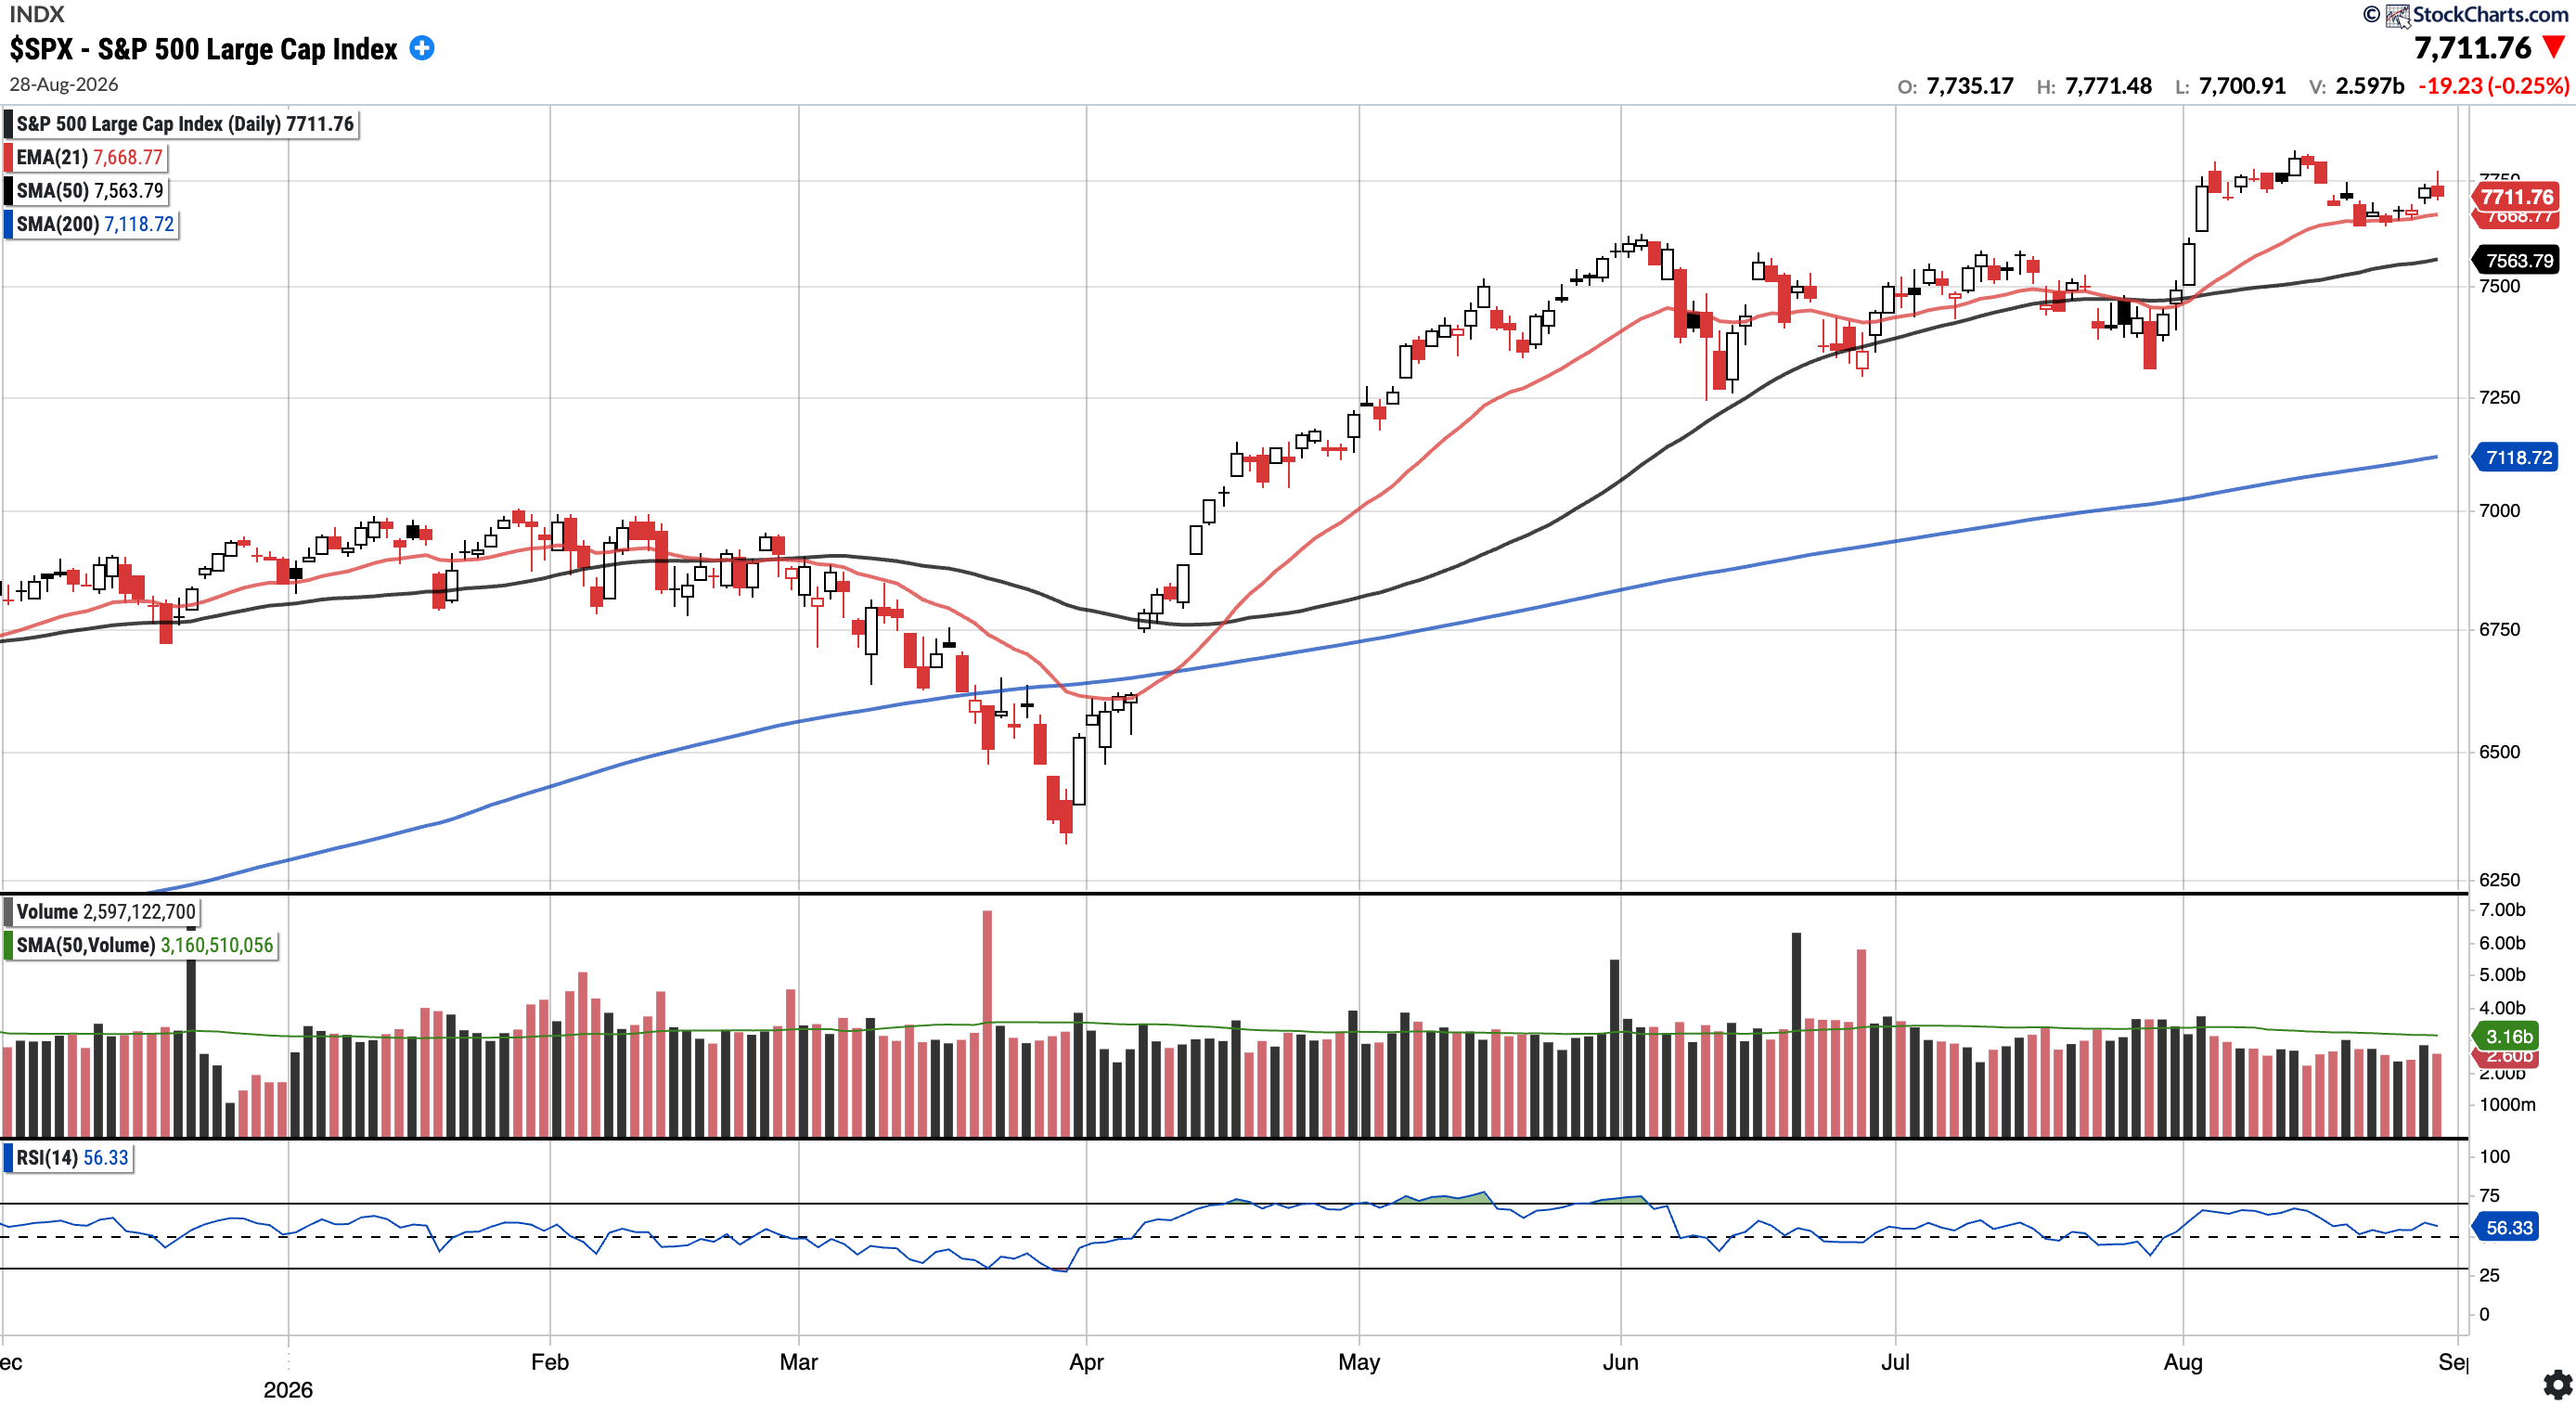
SPX
Currently trades at $7,711.76, 1.77% above the 50SMA and 8.15% above the 200SMA.
RSI 56.33
12.65% YTD
Distribution days in the last week: 0
The S&P 500 continues to trade above key moving averages as it held above the 21-EMA this week. RSI in the mid-50s indicates that we are not over-extended, but there is constructive momentum. Price sits 1.34% off of ATH amidst rising bond yields.
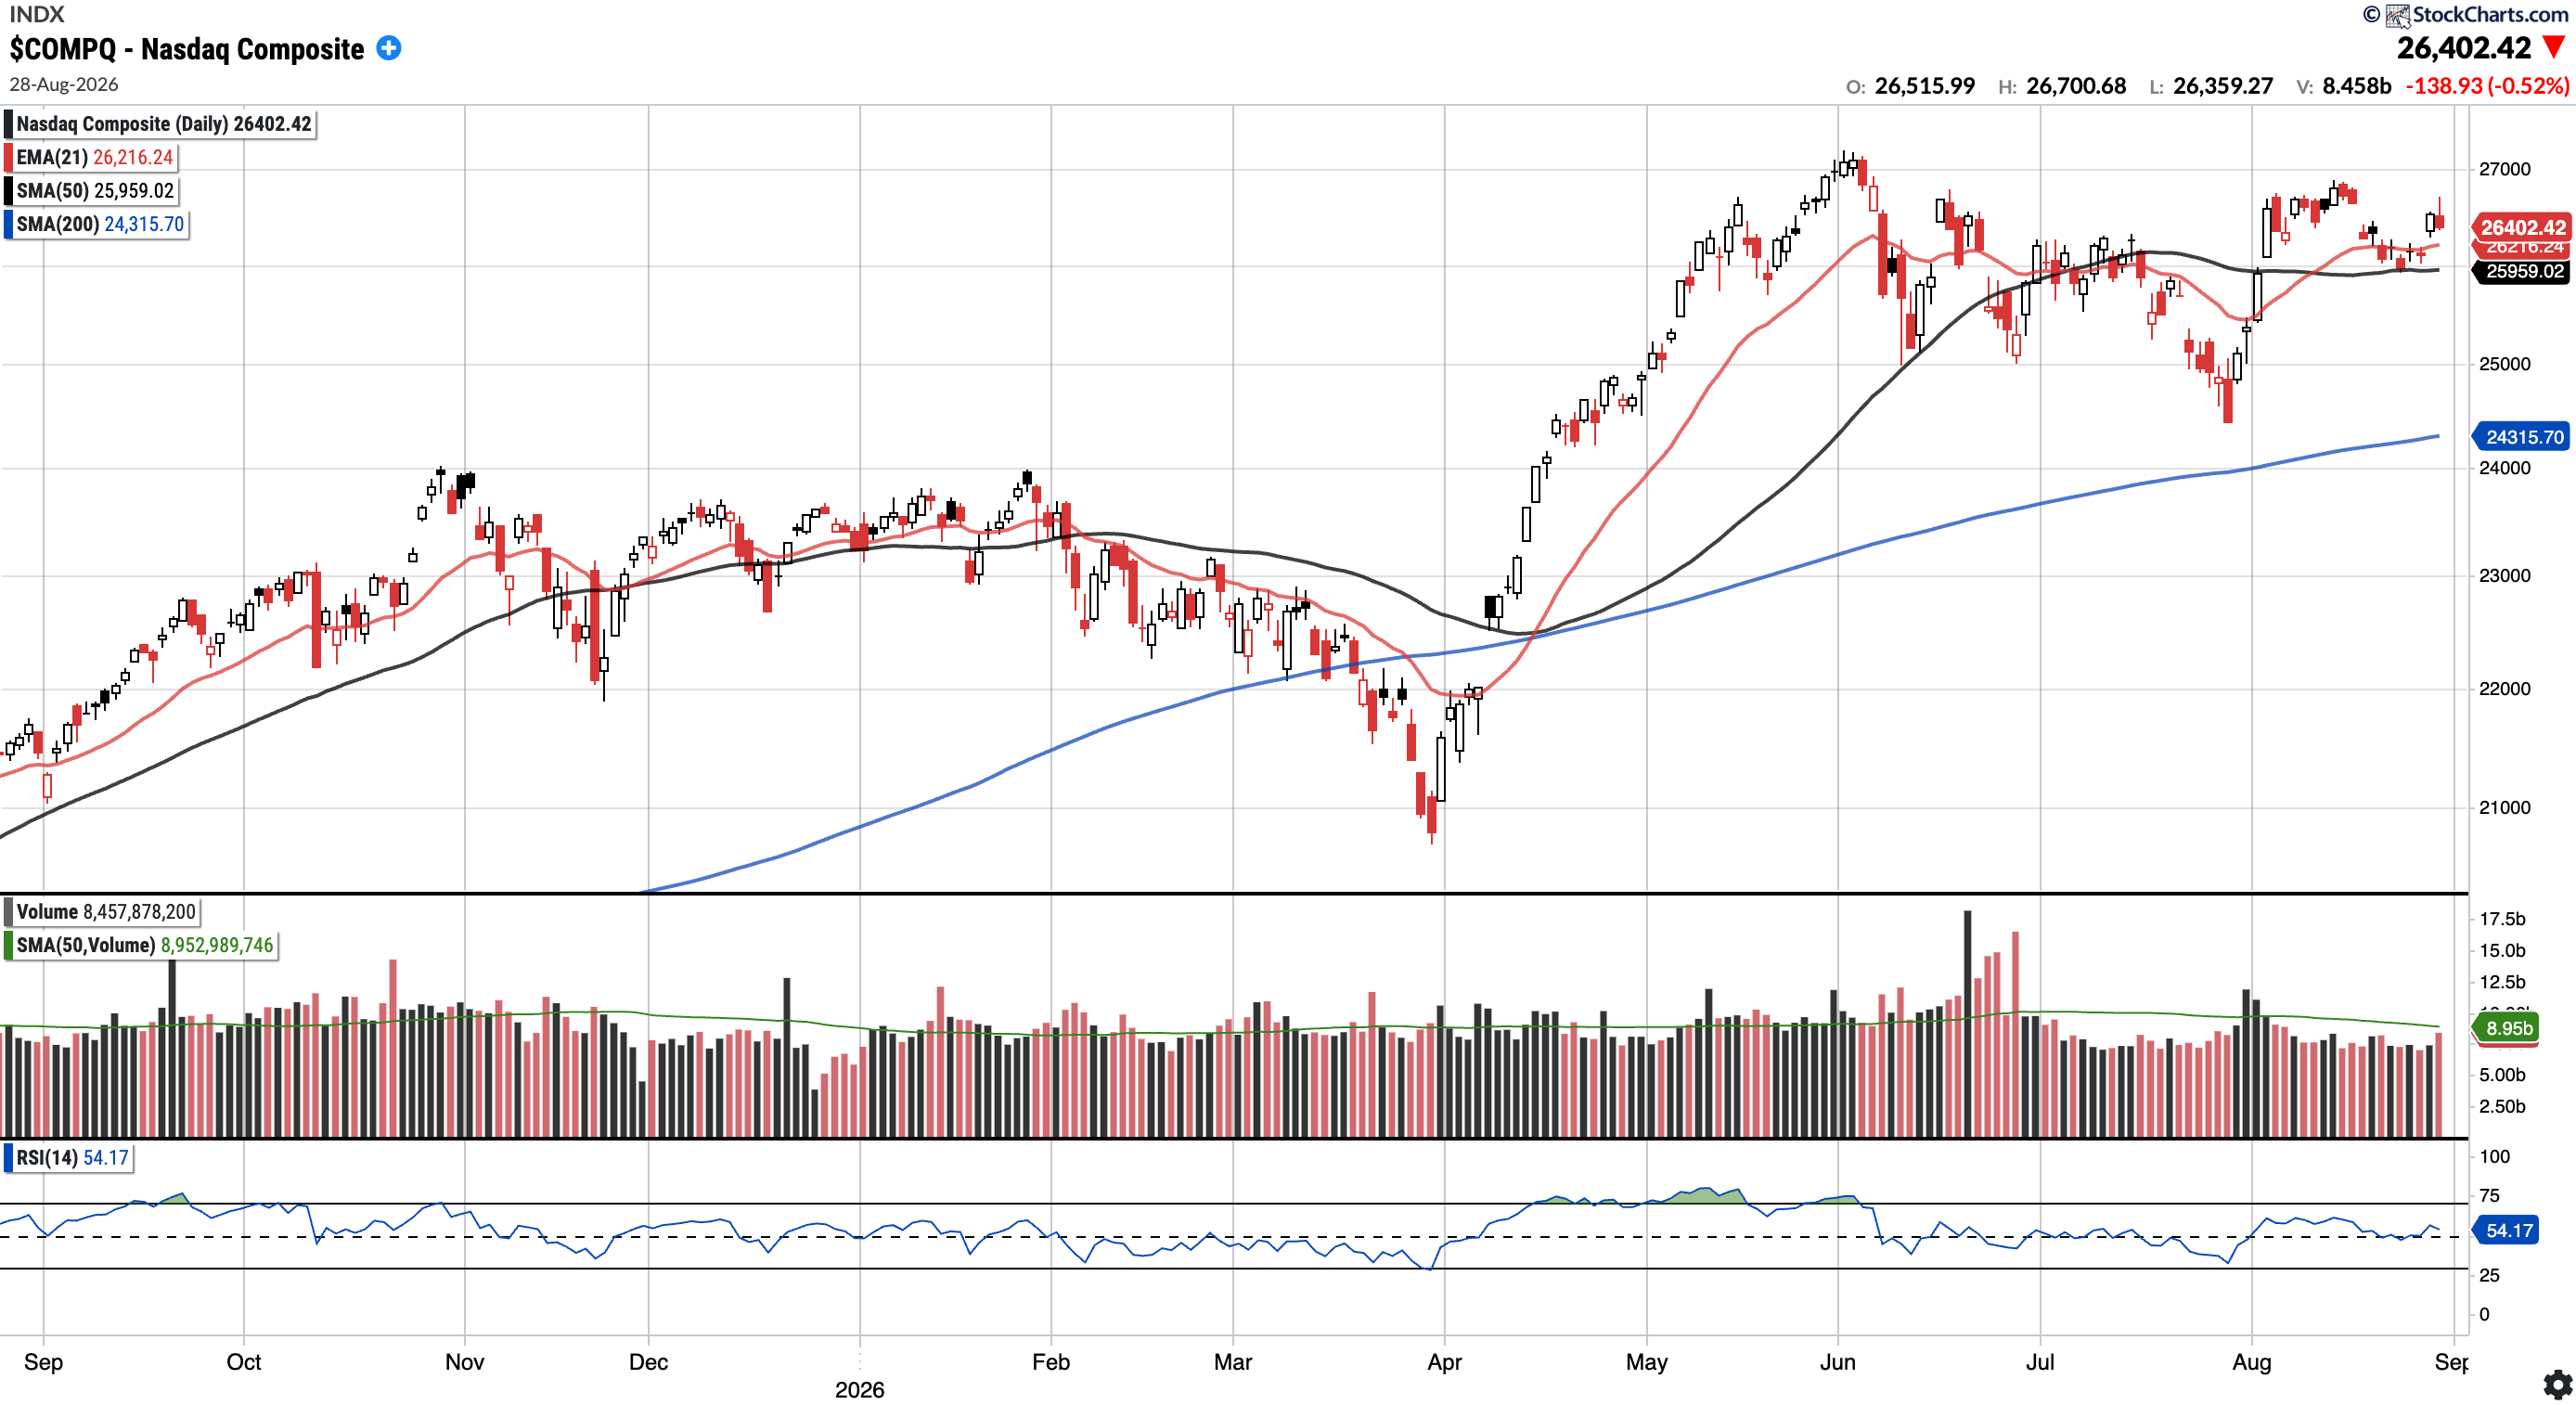
COMPQ
Currently trades at $26,402.42, 1.71% above the 50SMA and 8.58% above the 200SMA.
RSI 54.17
13.60% YTD
Distribution days in the last week: 1
The Nasdaq also remains above key moving averages despite a pullback to the 50 SMA. Price recovered nicely and closed above the 21 EMA for the end of the week.
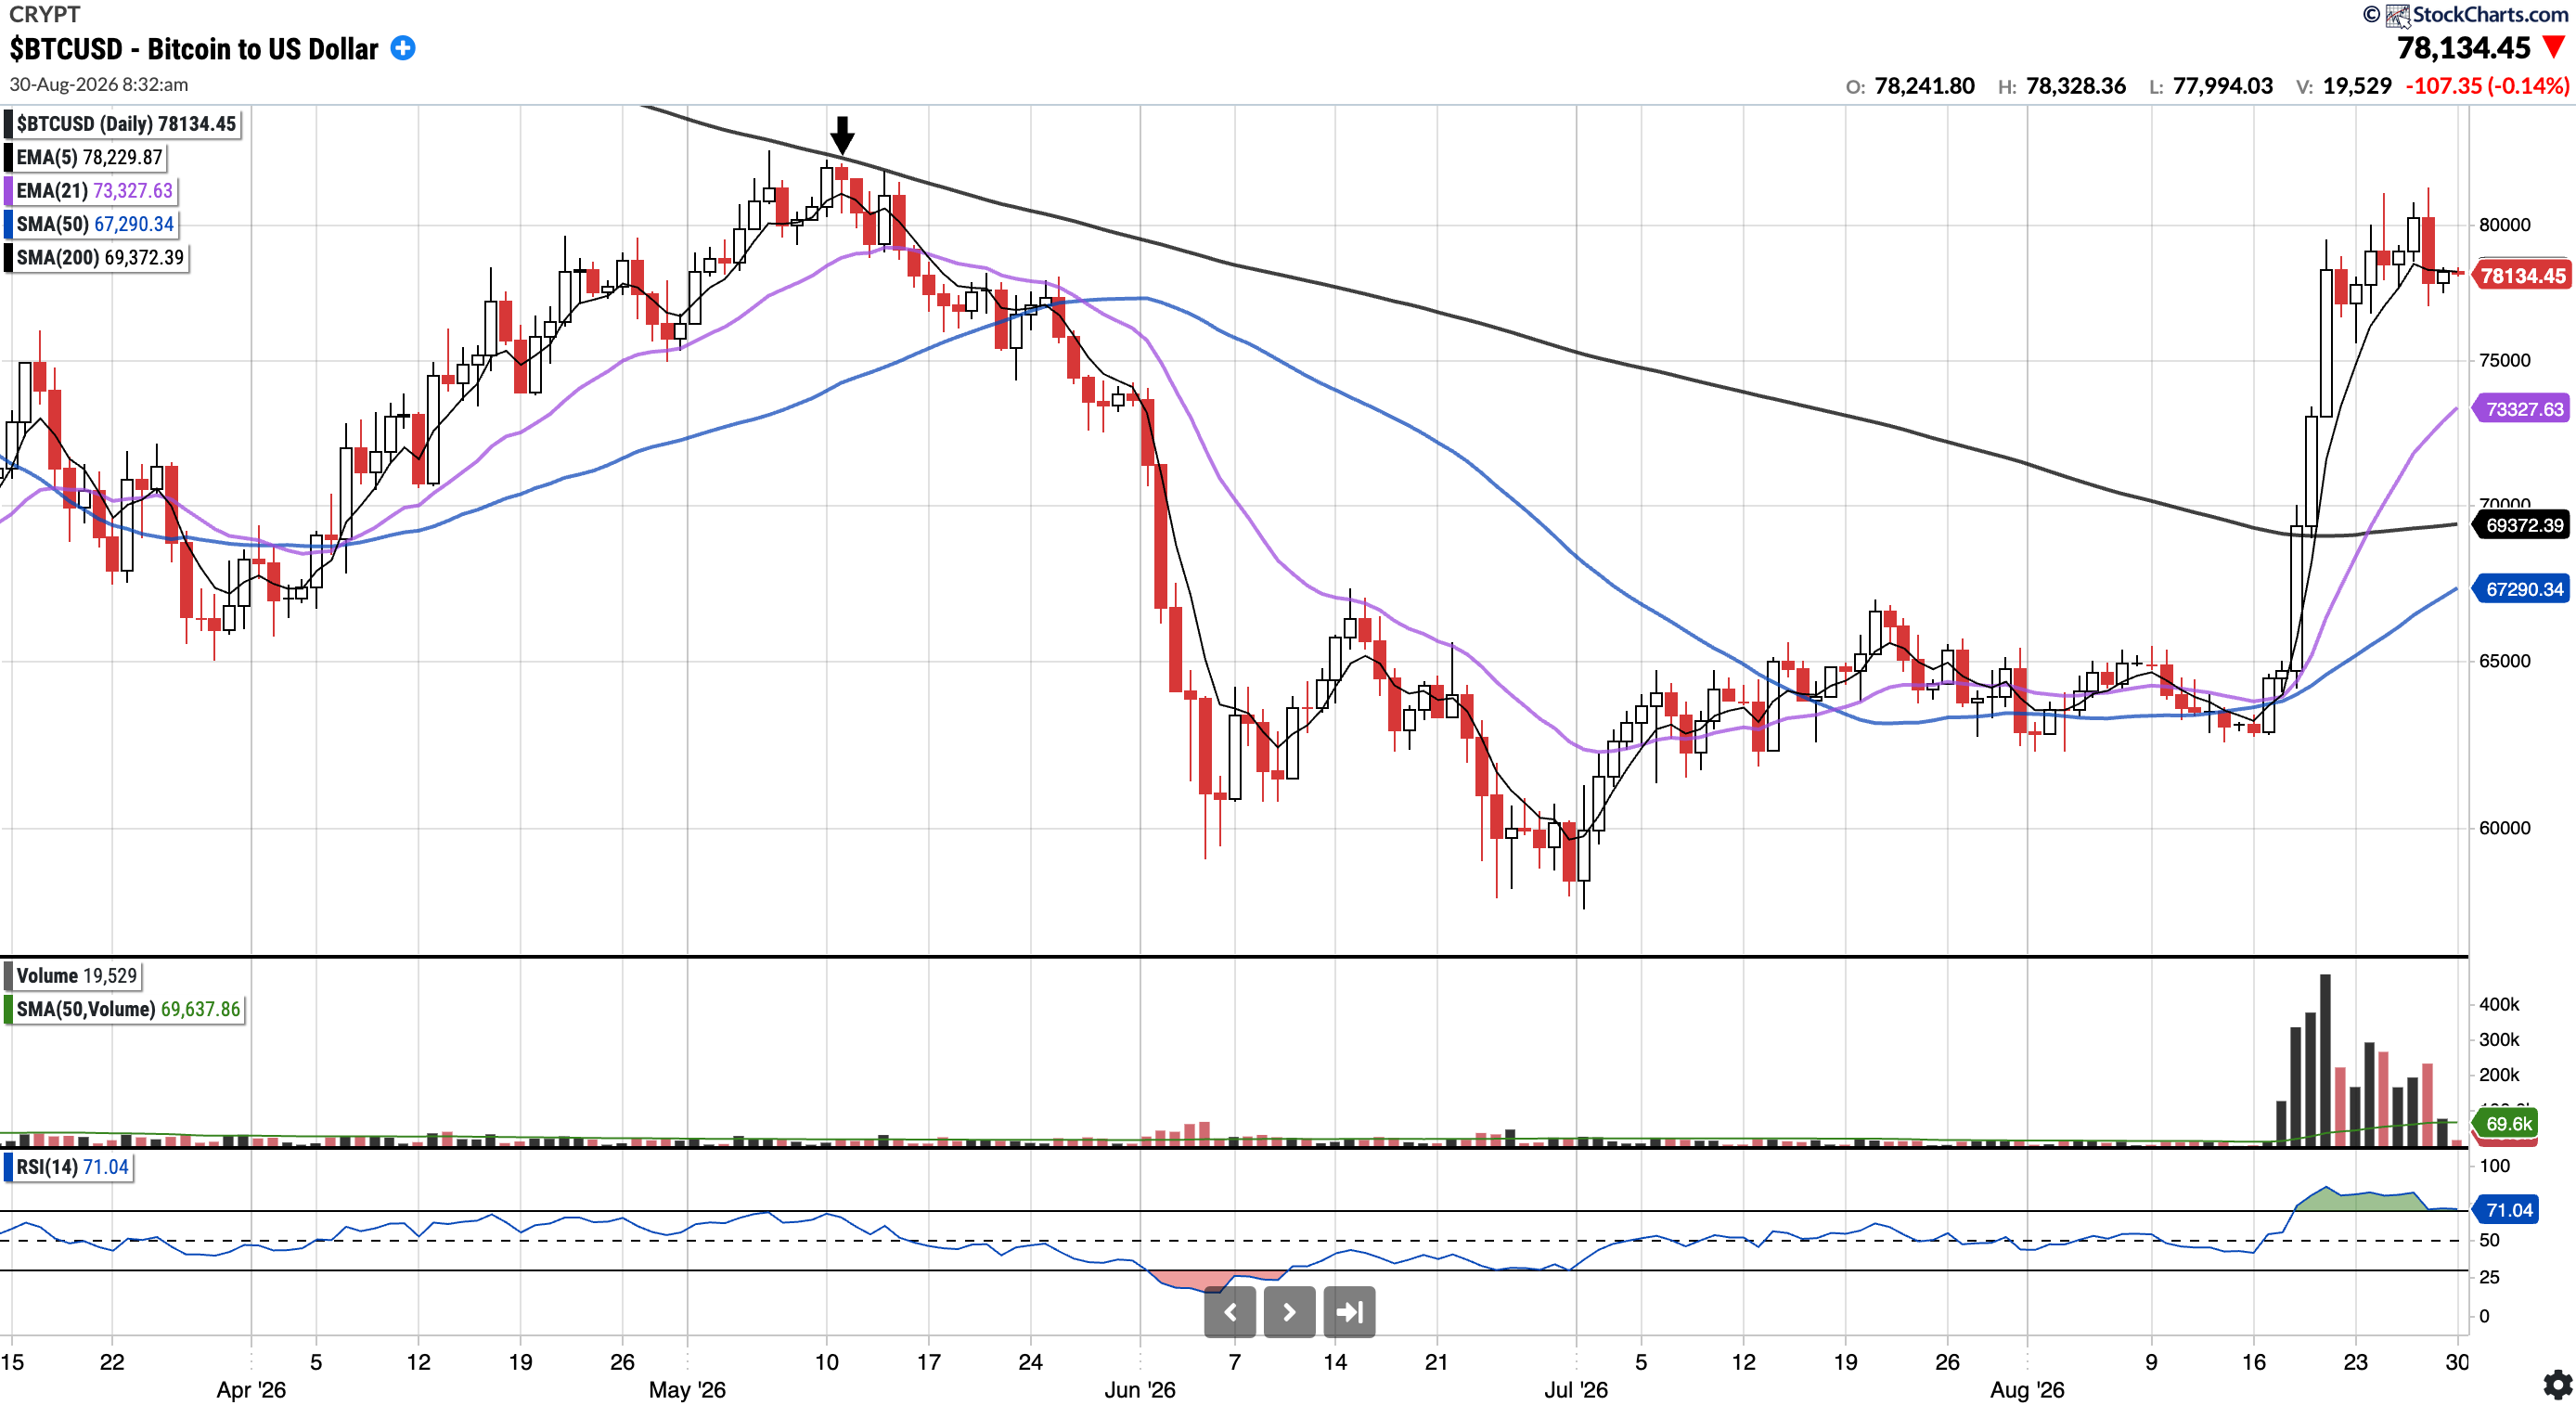
BTC (currently Long)
Currently trades at $78,134.45, 16.12% above the 50SMA and 12.63% above the 200SMA.
RSI 71.04
-9.95% YTD
After last week’s rally, BTC is consolidating as expected into a potential bull flag. Volume remains elevated, and so does RSI at 71.04. Price remains above and extended from all key moving averages.
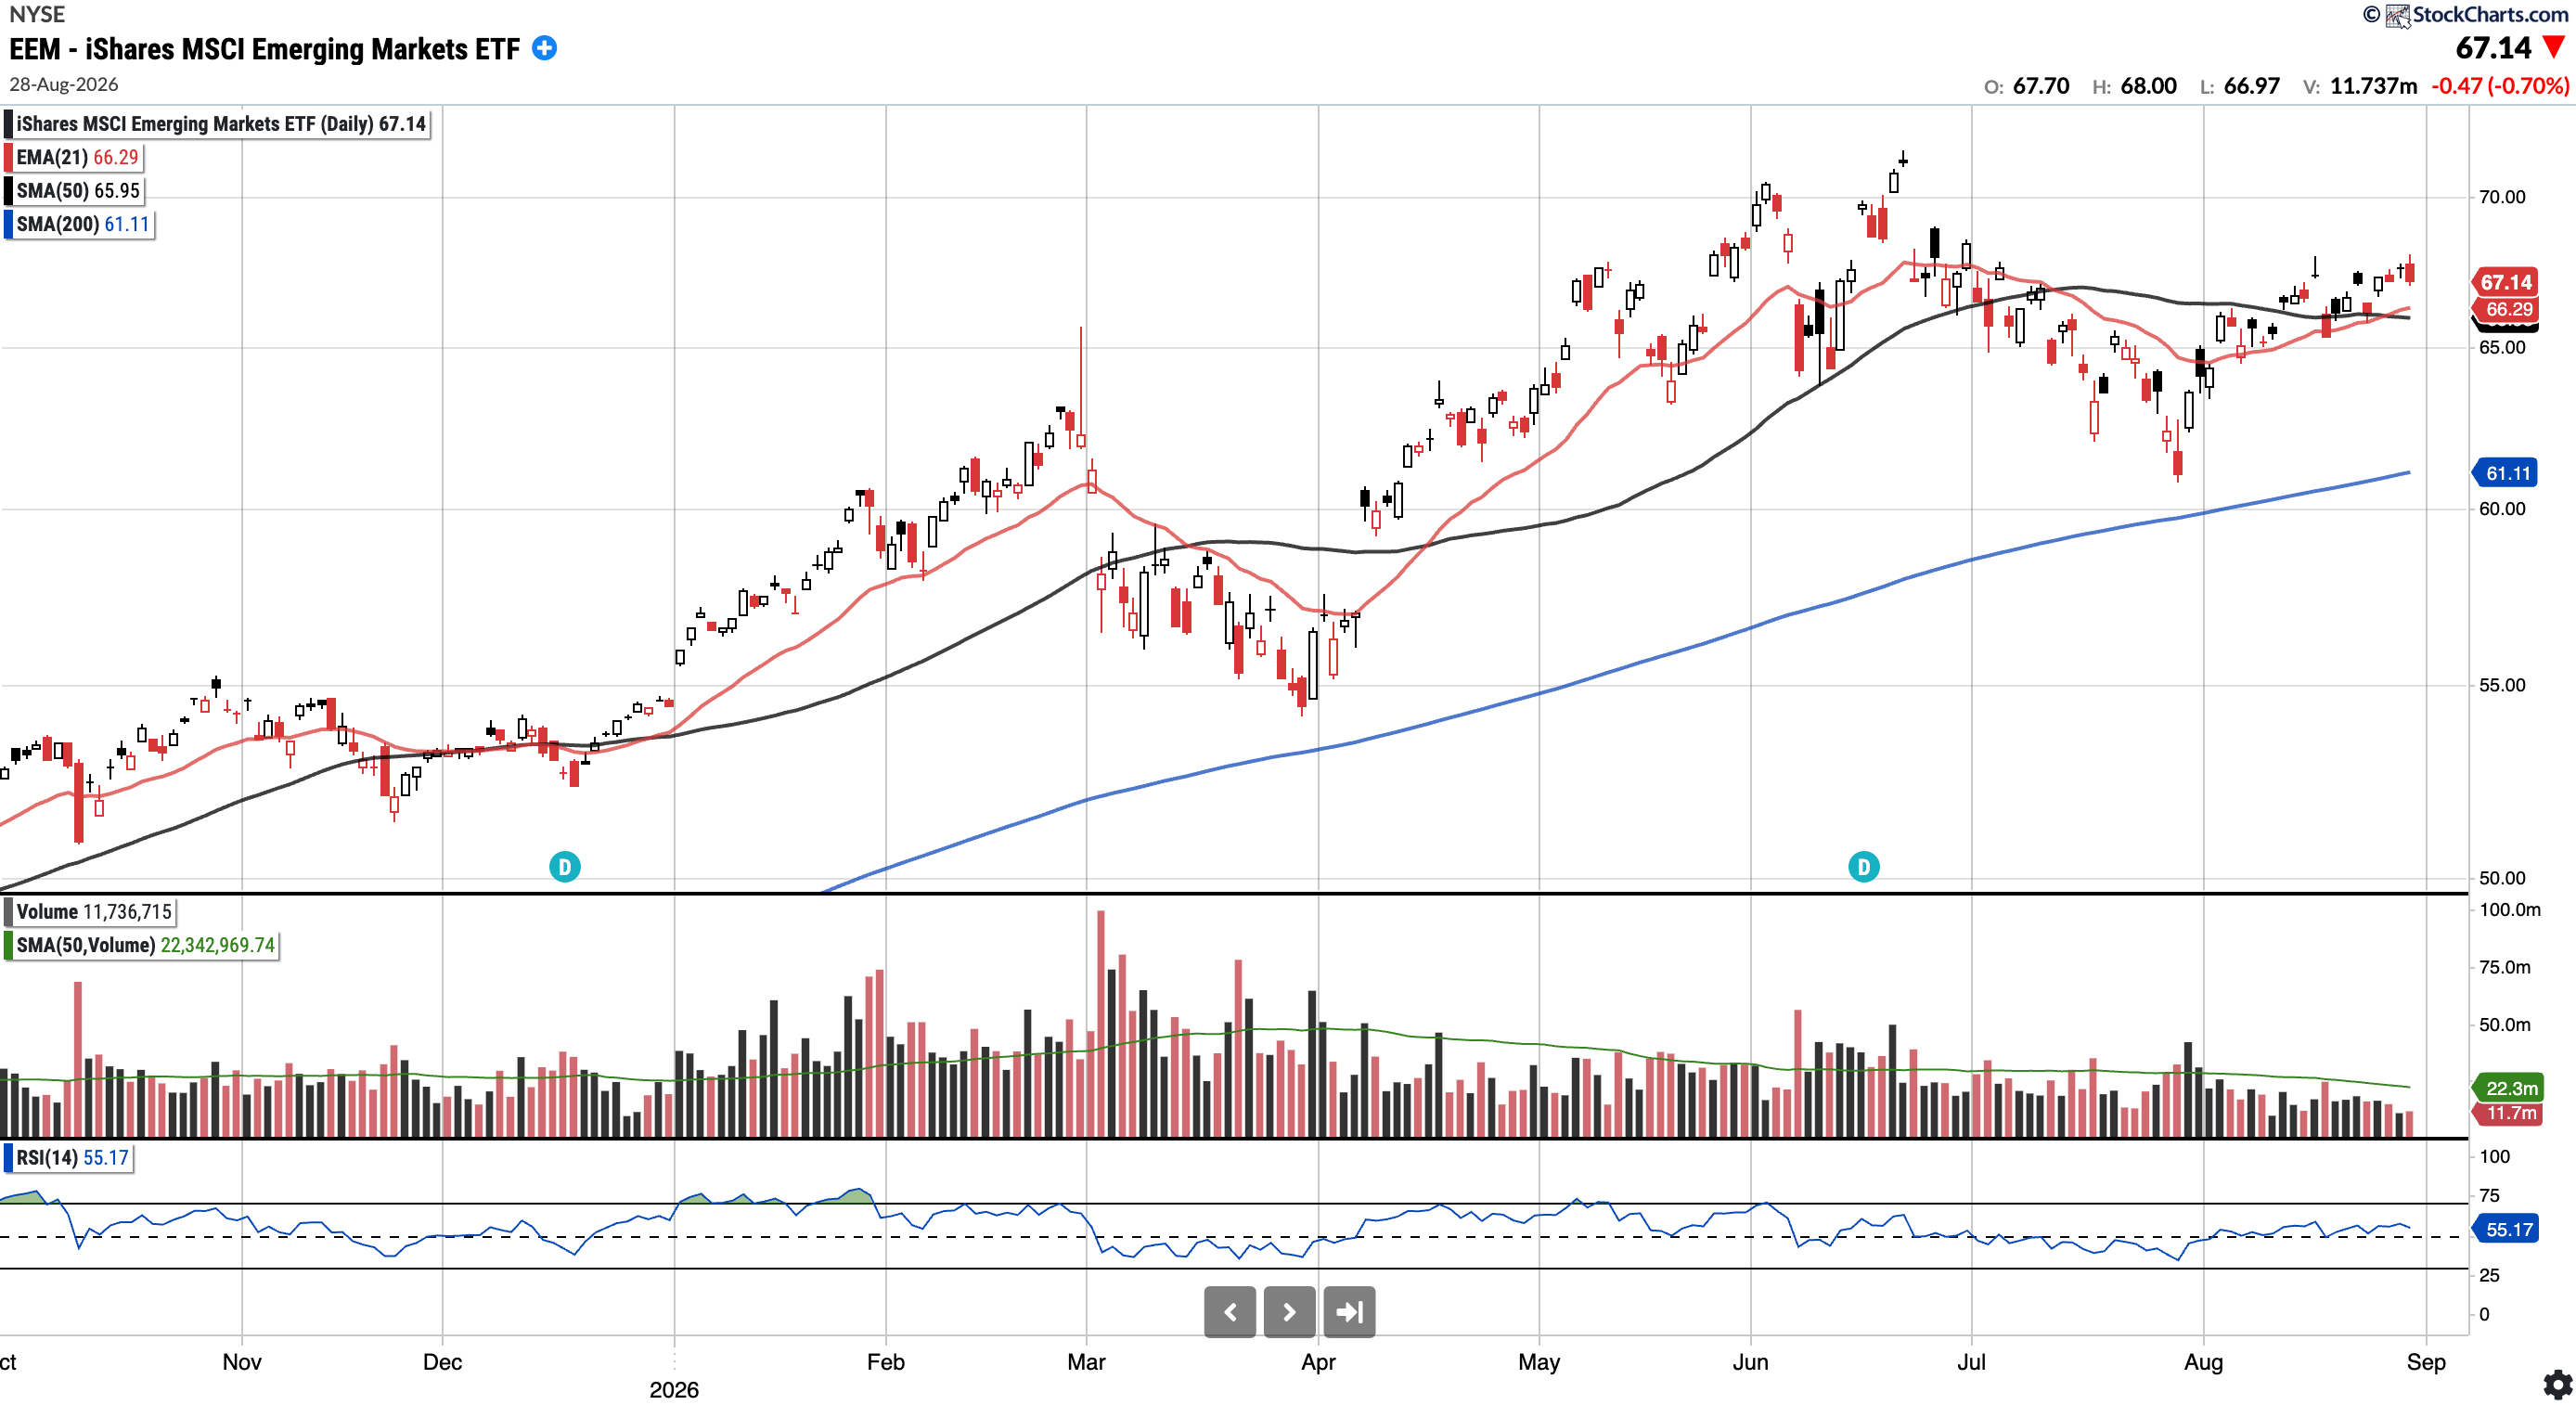
EEM
Currently trades at $67.14, 1.80% above the 50SMA and 9.87% above the 200SMA.
RSI 55.17
22.34% YTD
EEM remains in an uptrend, closing above all key moving averages. Price held the 21EMA as support on Monday before pushing higher. The 21EMA has now crossed above the 50SMA, a constructive signal for trend continuation.
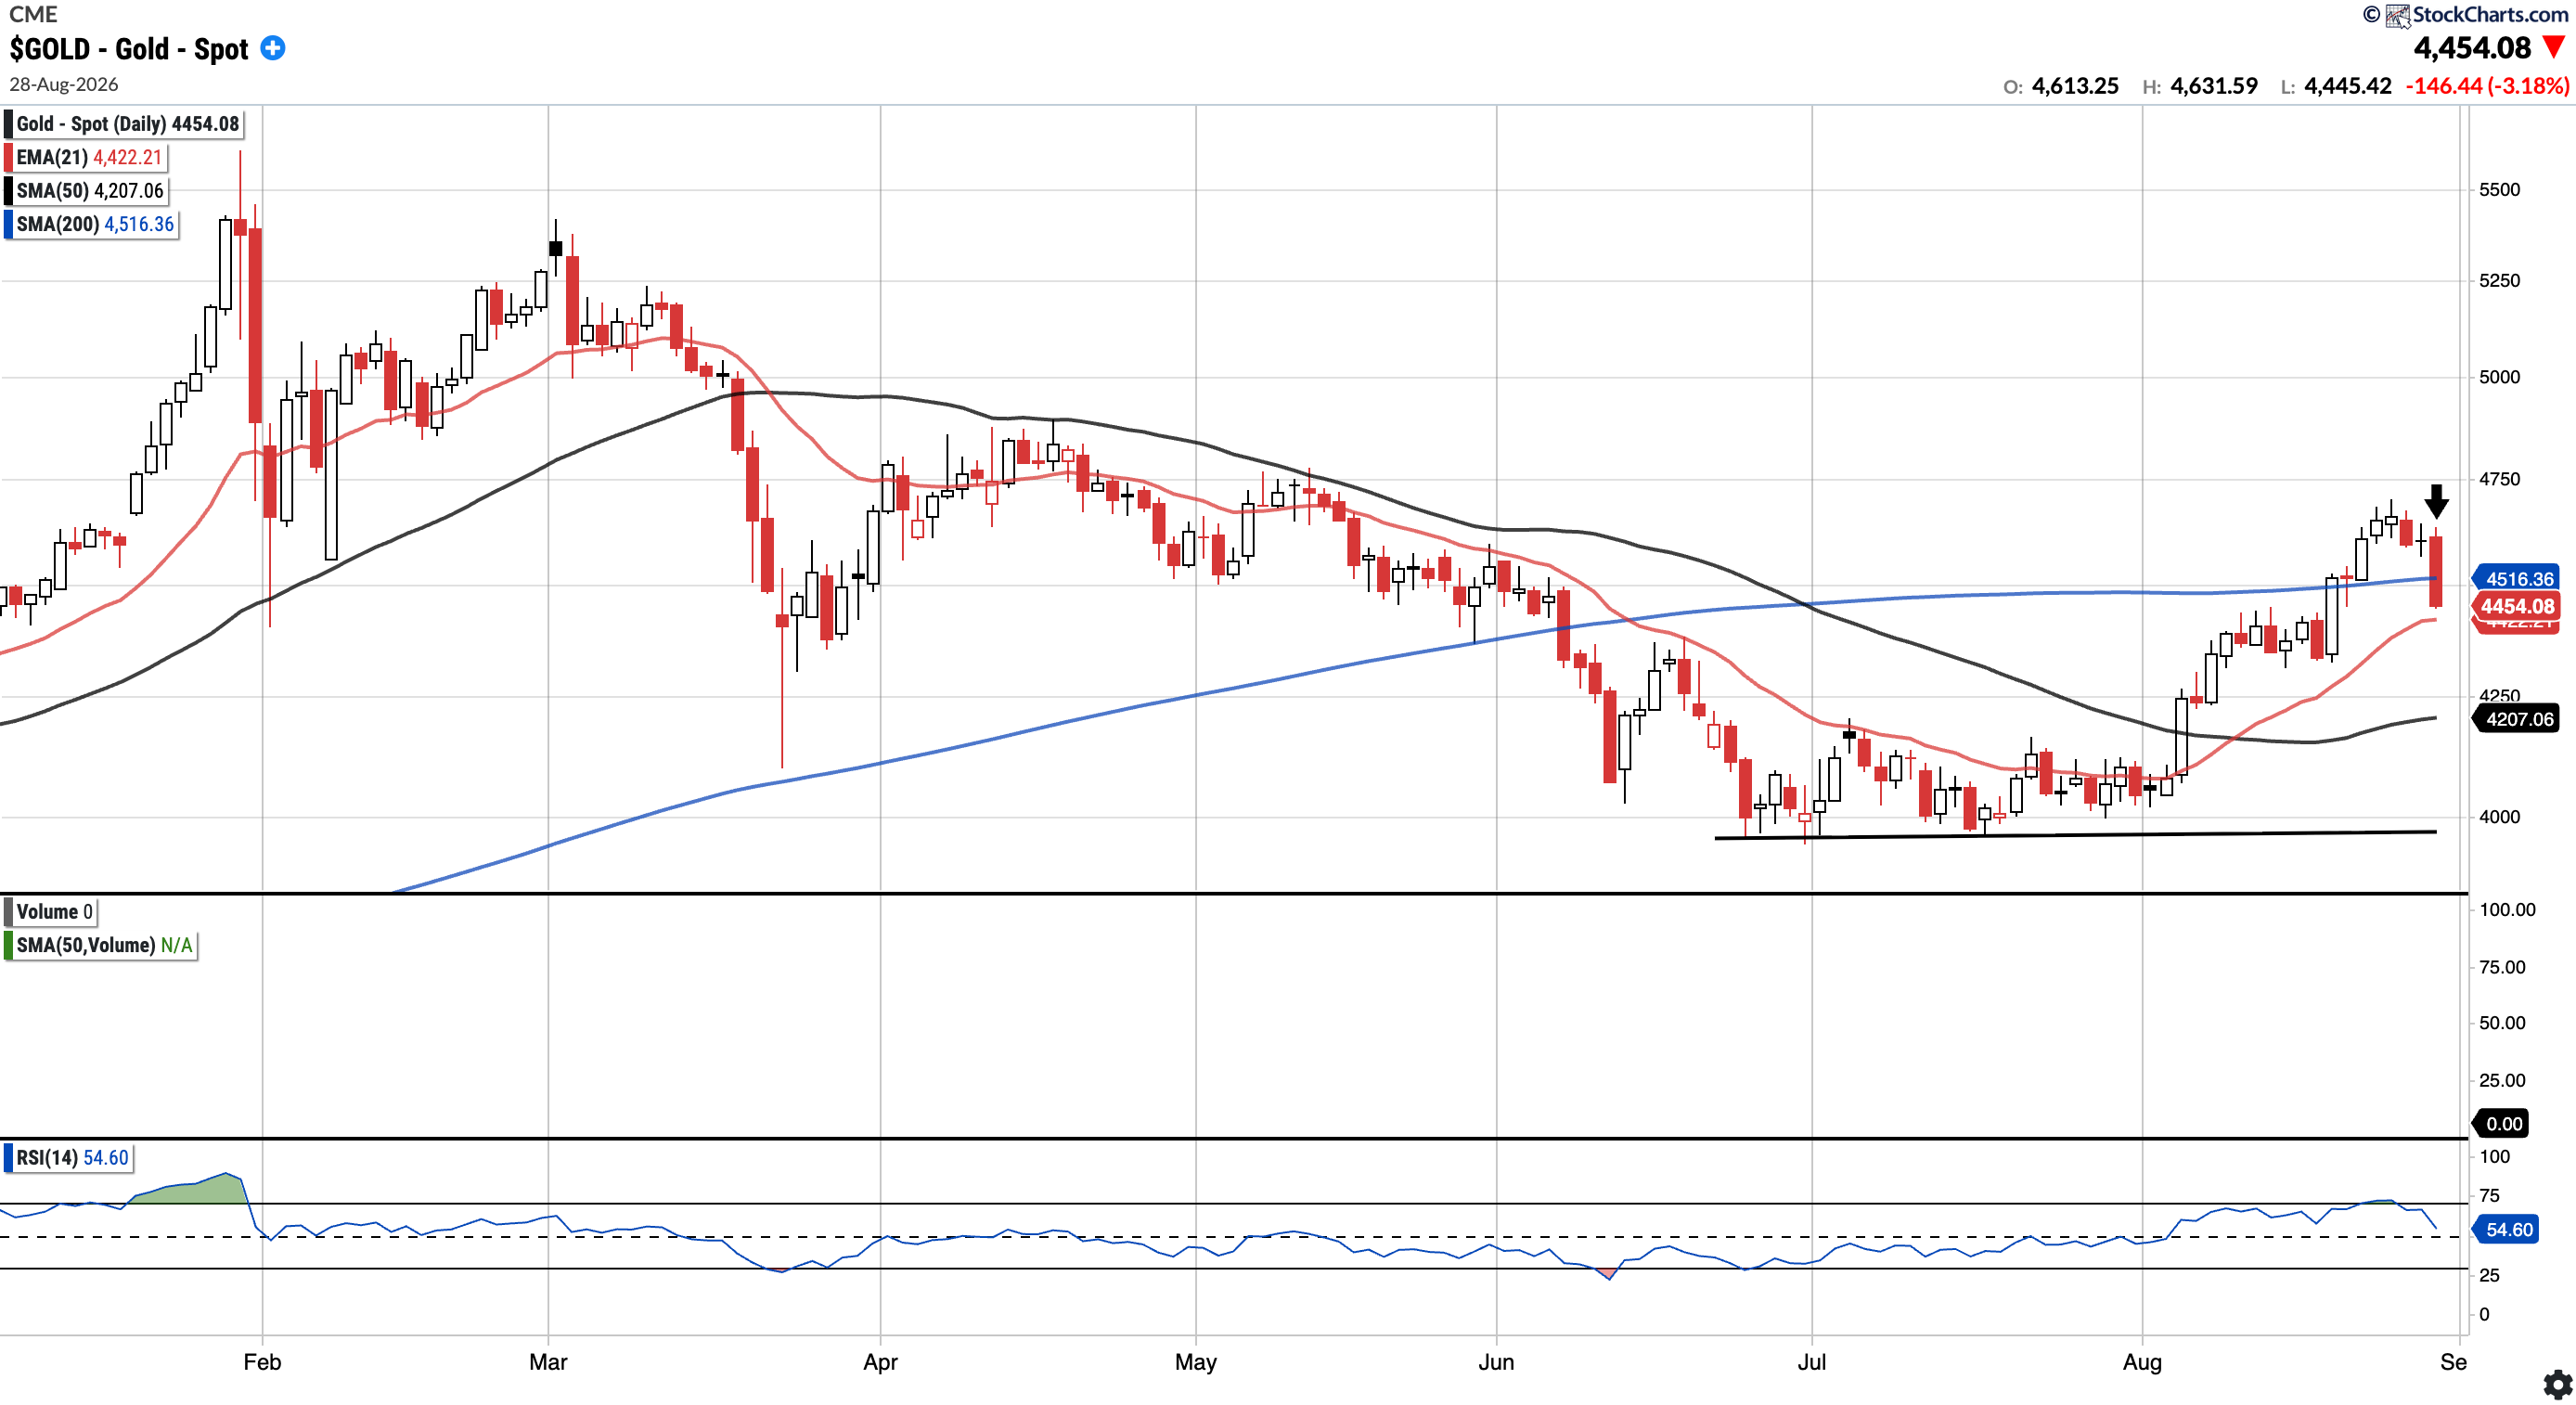
GOLD (Long Physical)
Currently trades at $4,454.08, 5.87% above the 50SMA and 1.38% below the 200SMA.
RSI 54.60
3.17% YTD
Gold has bounced well from its recent lows, reclaiming the 200-day for a few days; however, on Friday, it did violate the 200-day. A timely reclaim of the 200 SMA is what bulls will be looking for. To the downside, the next near-term support to watch is the 21 EMA at $4,422.21.
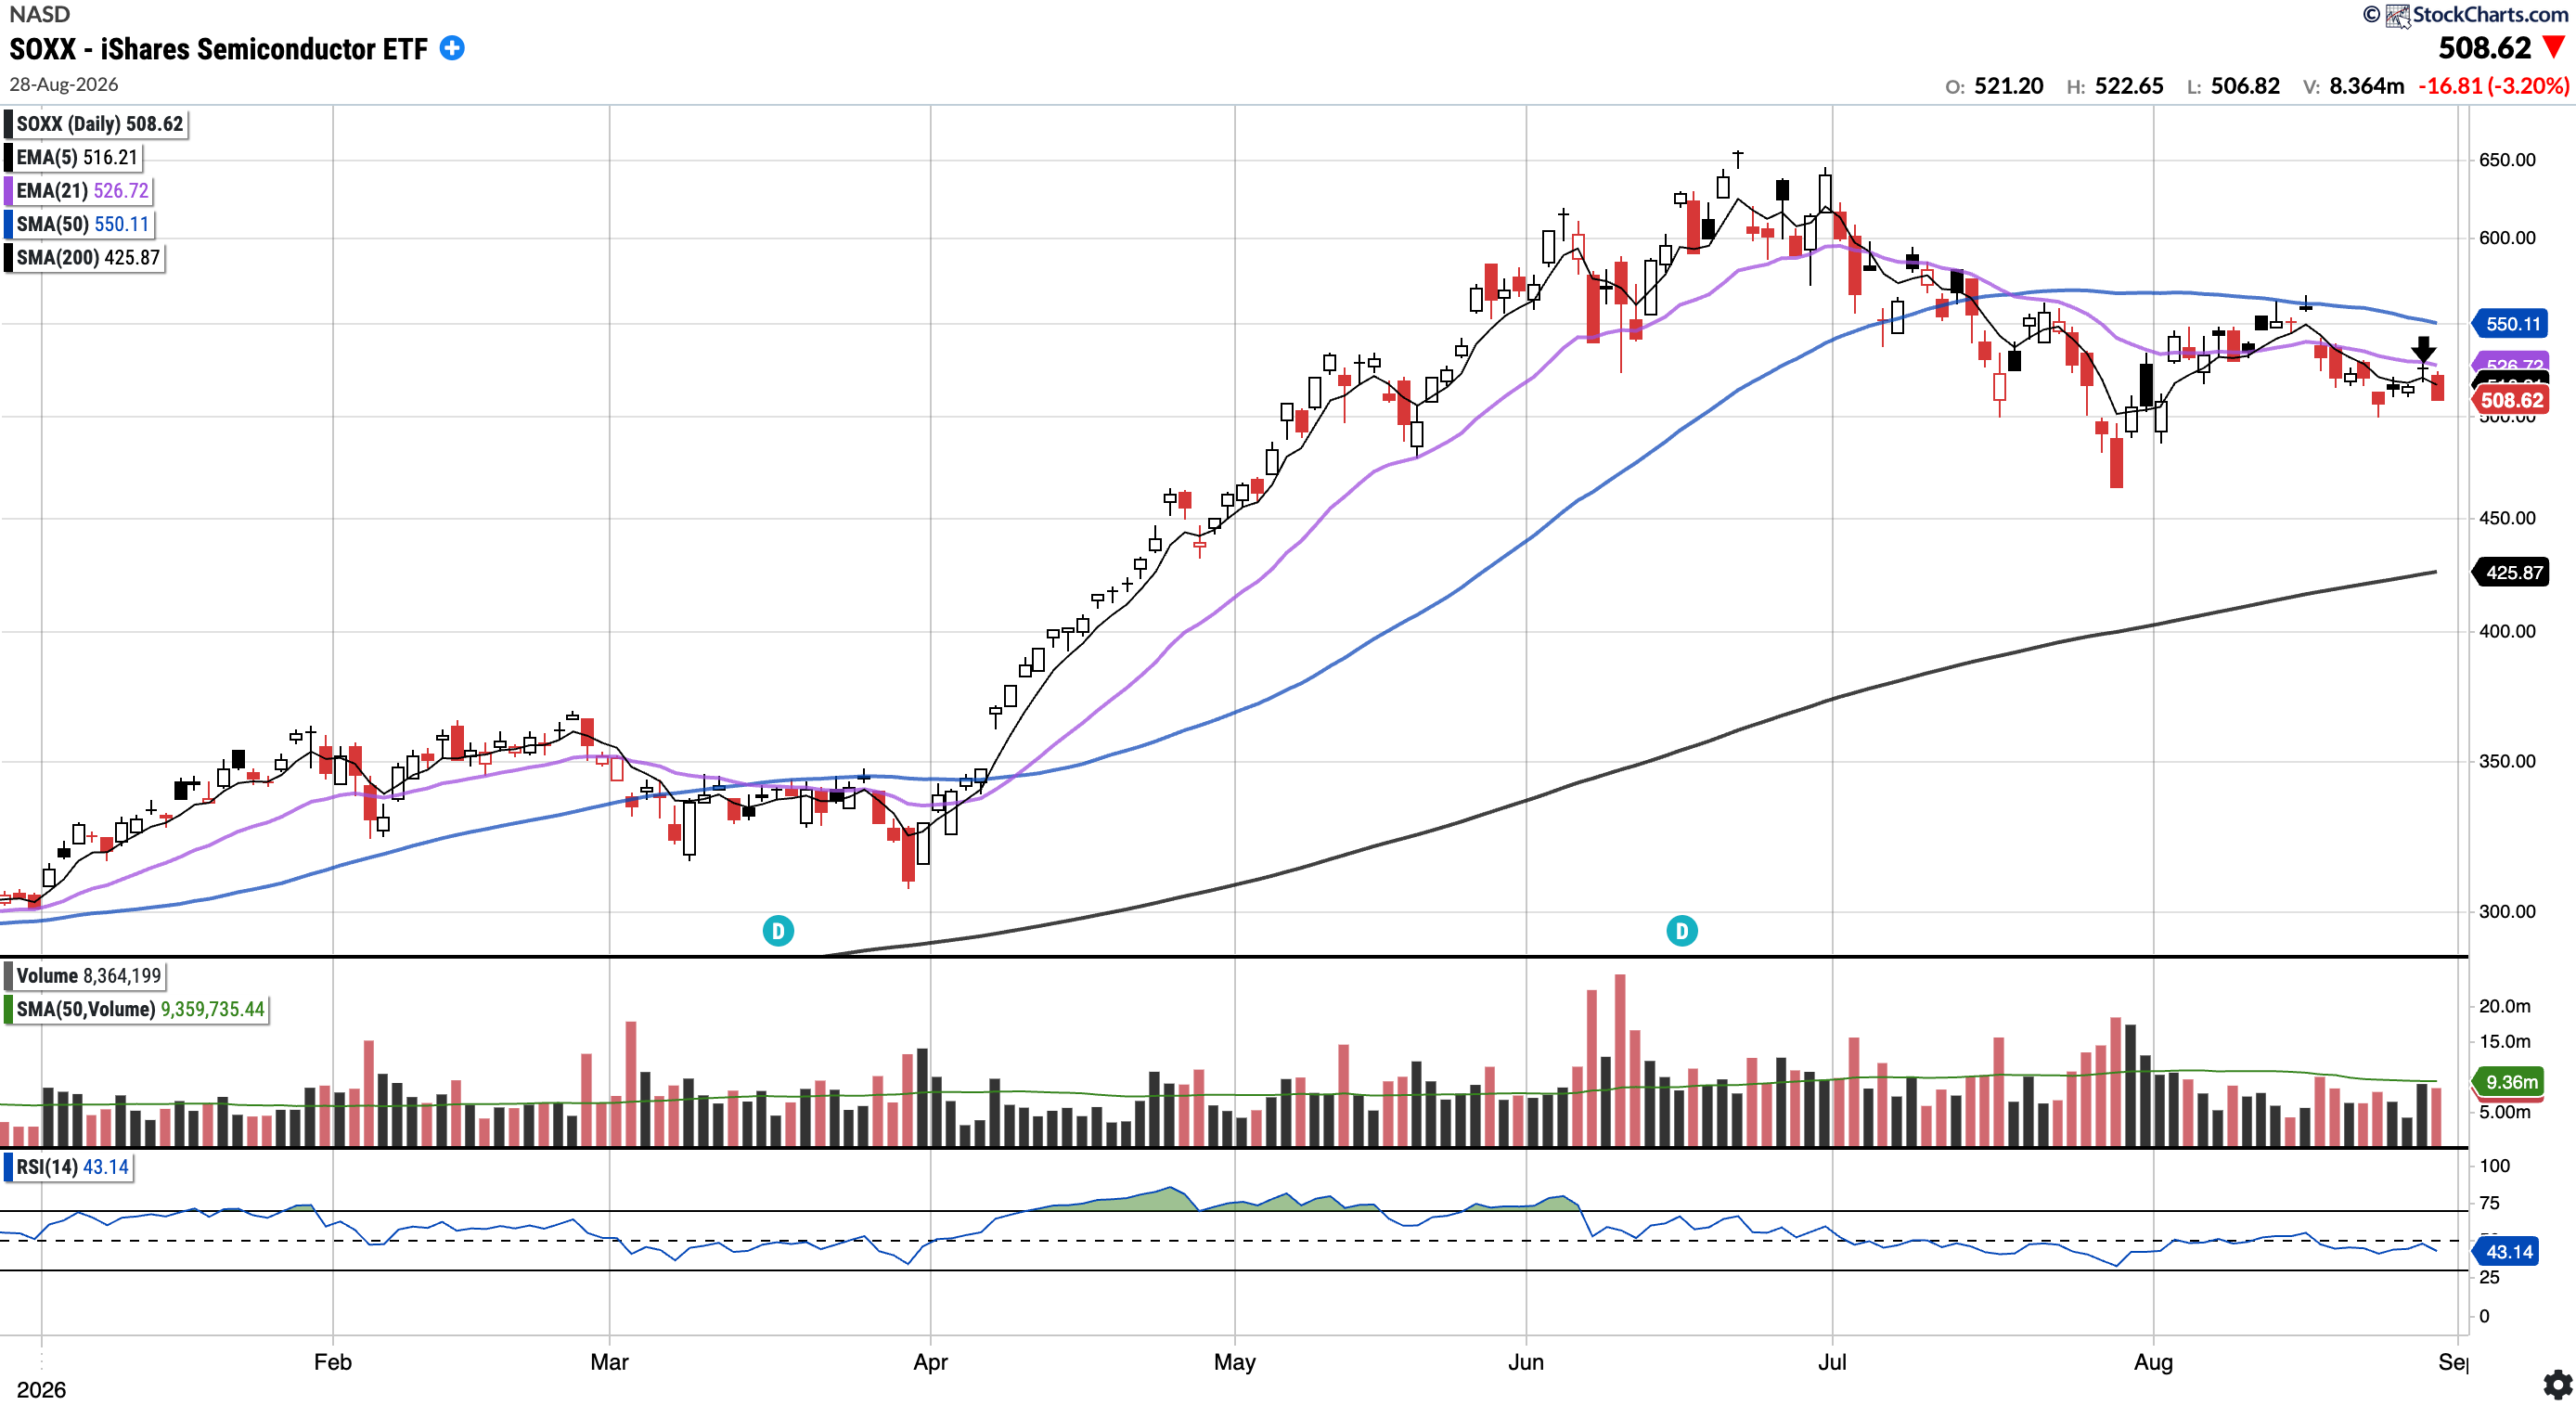
SOXX
Currently trades at $508.62, 7.54% below the 50SMA and 19.43% above the 200SMA.
RSI 43.14
66.80% YTD
SOXX remains below its 50-day SMA despite an attempt to breakout. It was rejected at the 21EMA (see arrow) despite positive earnings from NVDA. Bulls will want to see the 50SMA reclaimed to restore longer-term momentum.
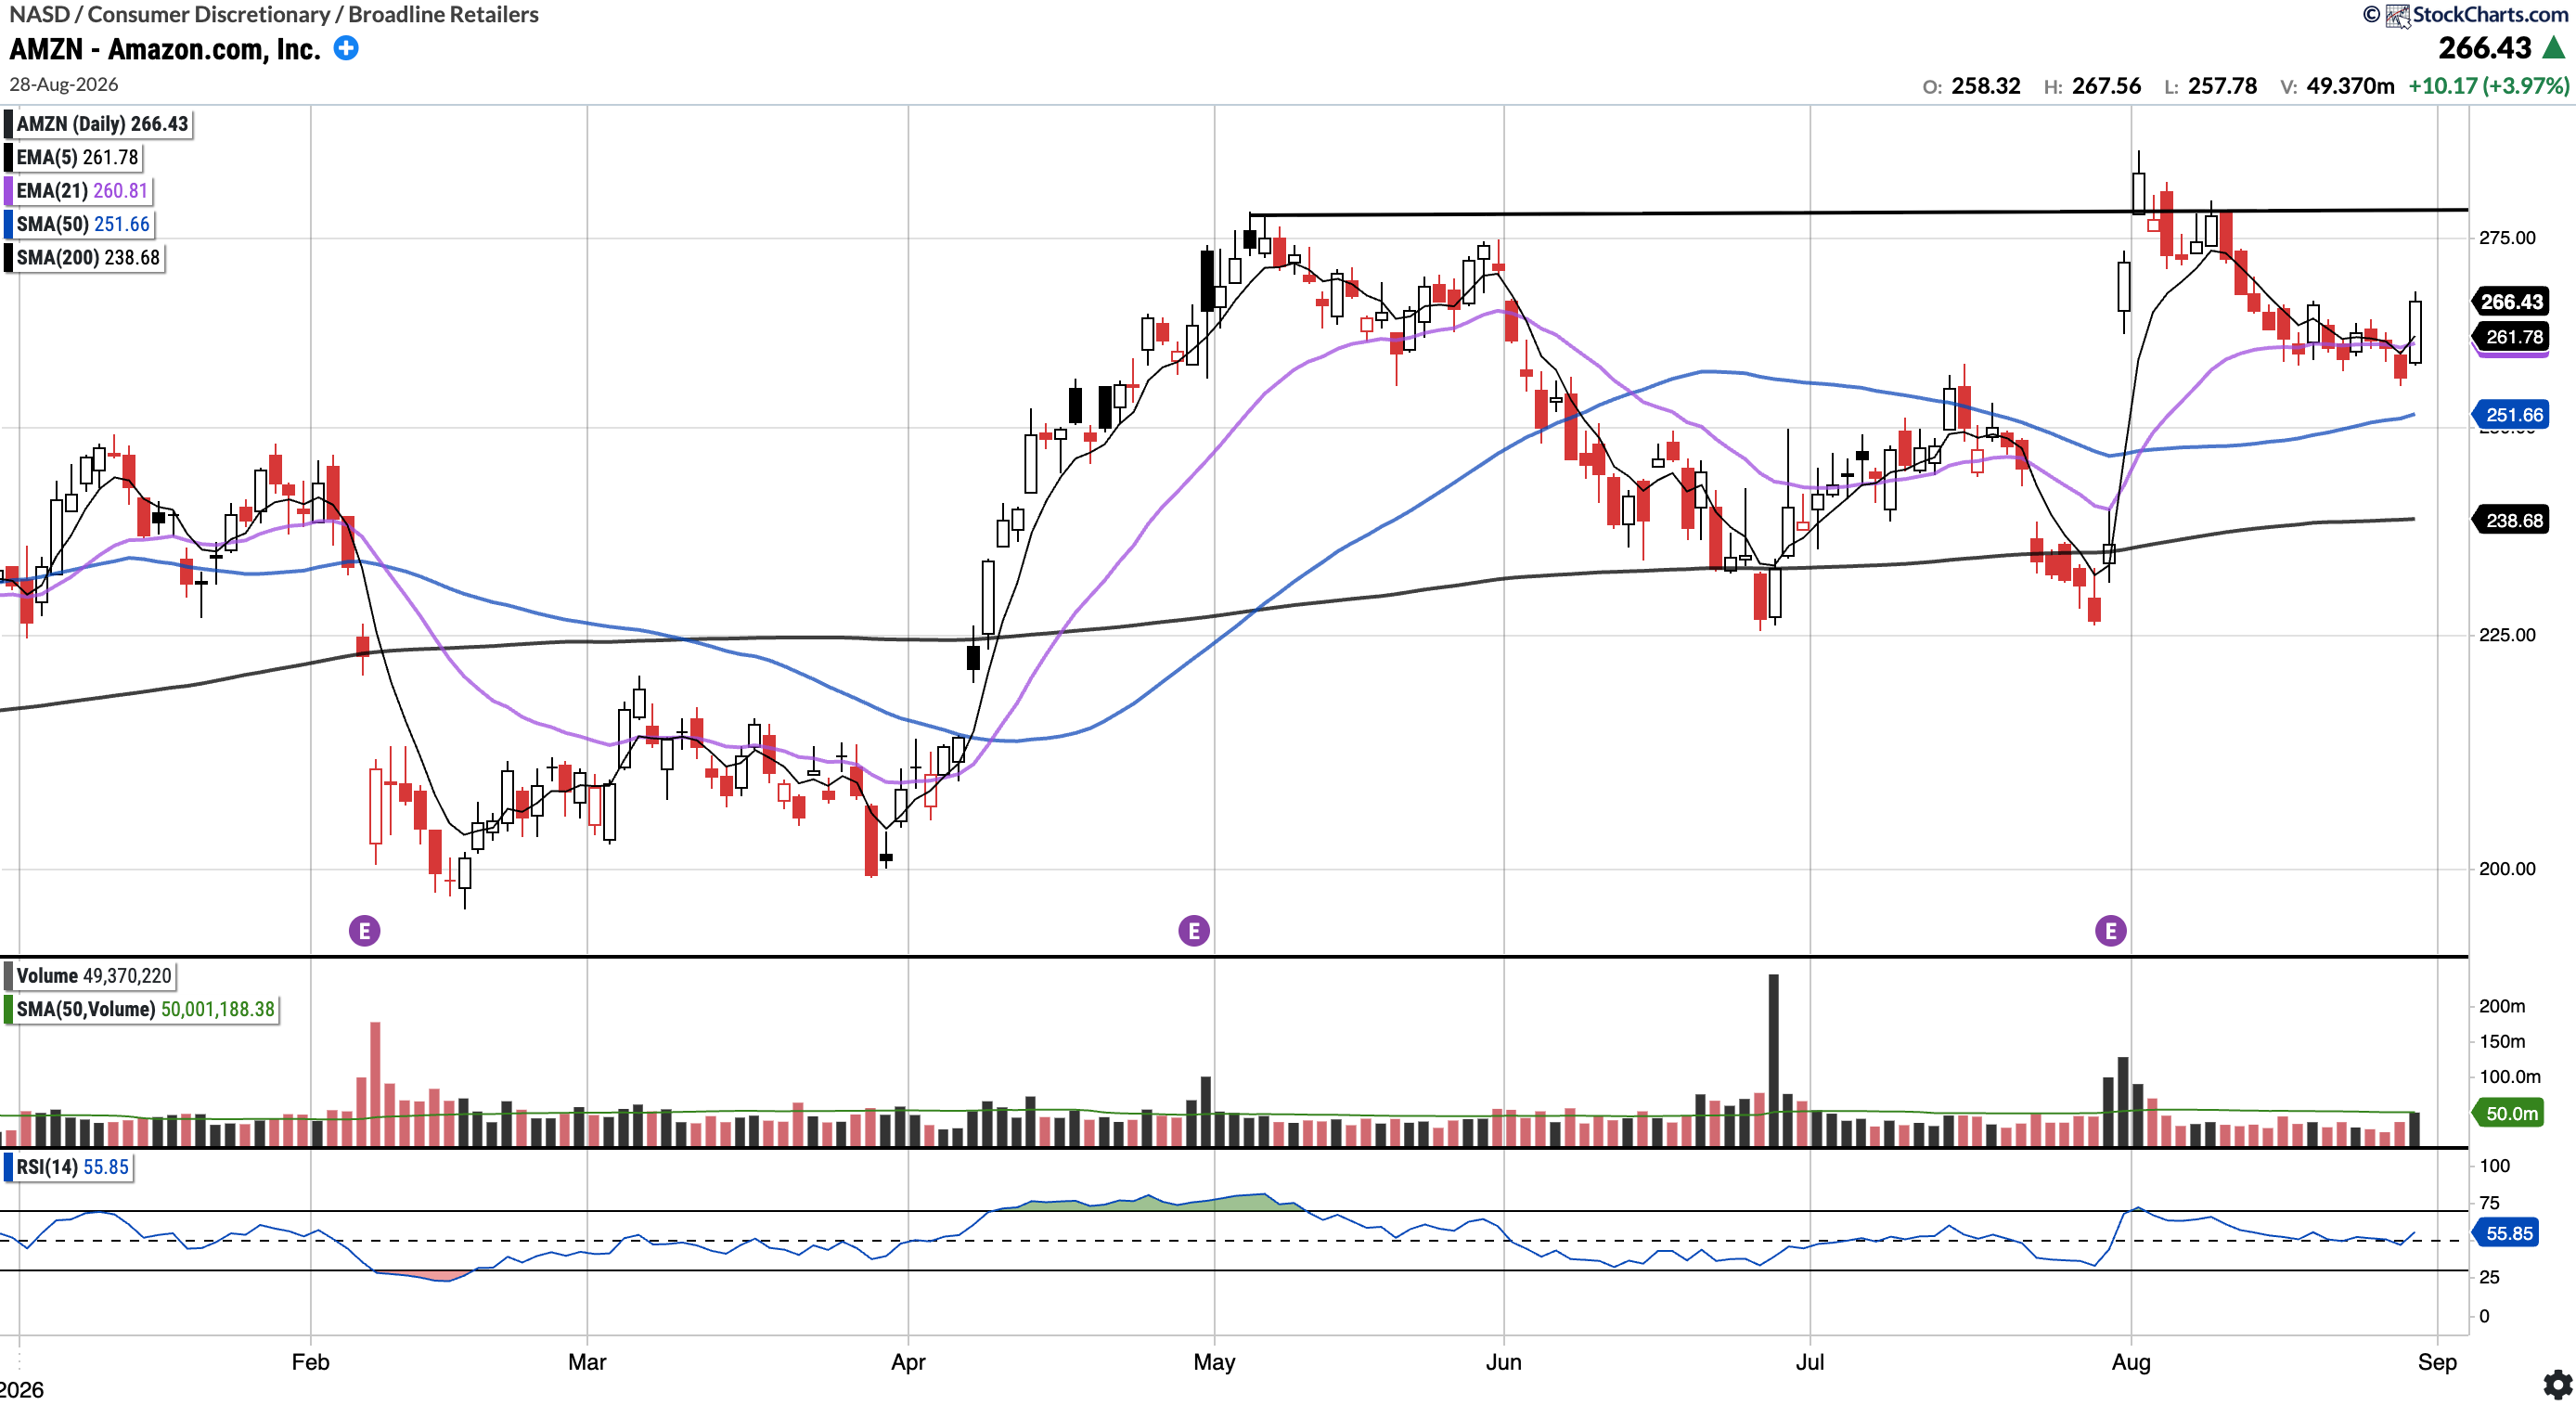
AMZN (Currently Long)
Currently trades at $266.43, 5.87% above the 50SMA and 11.63% above the 200SMA.
RSI 55.85
15.43% YTD
AMZN pulled back to test the 21 day where it consolidated and then closed out the week above all key moving averages after a sharp bounce off of the 21-EMA. Bulls will want to see a breakout above the horizontal resistance near ATH, at ~$278.50.
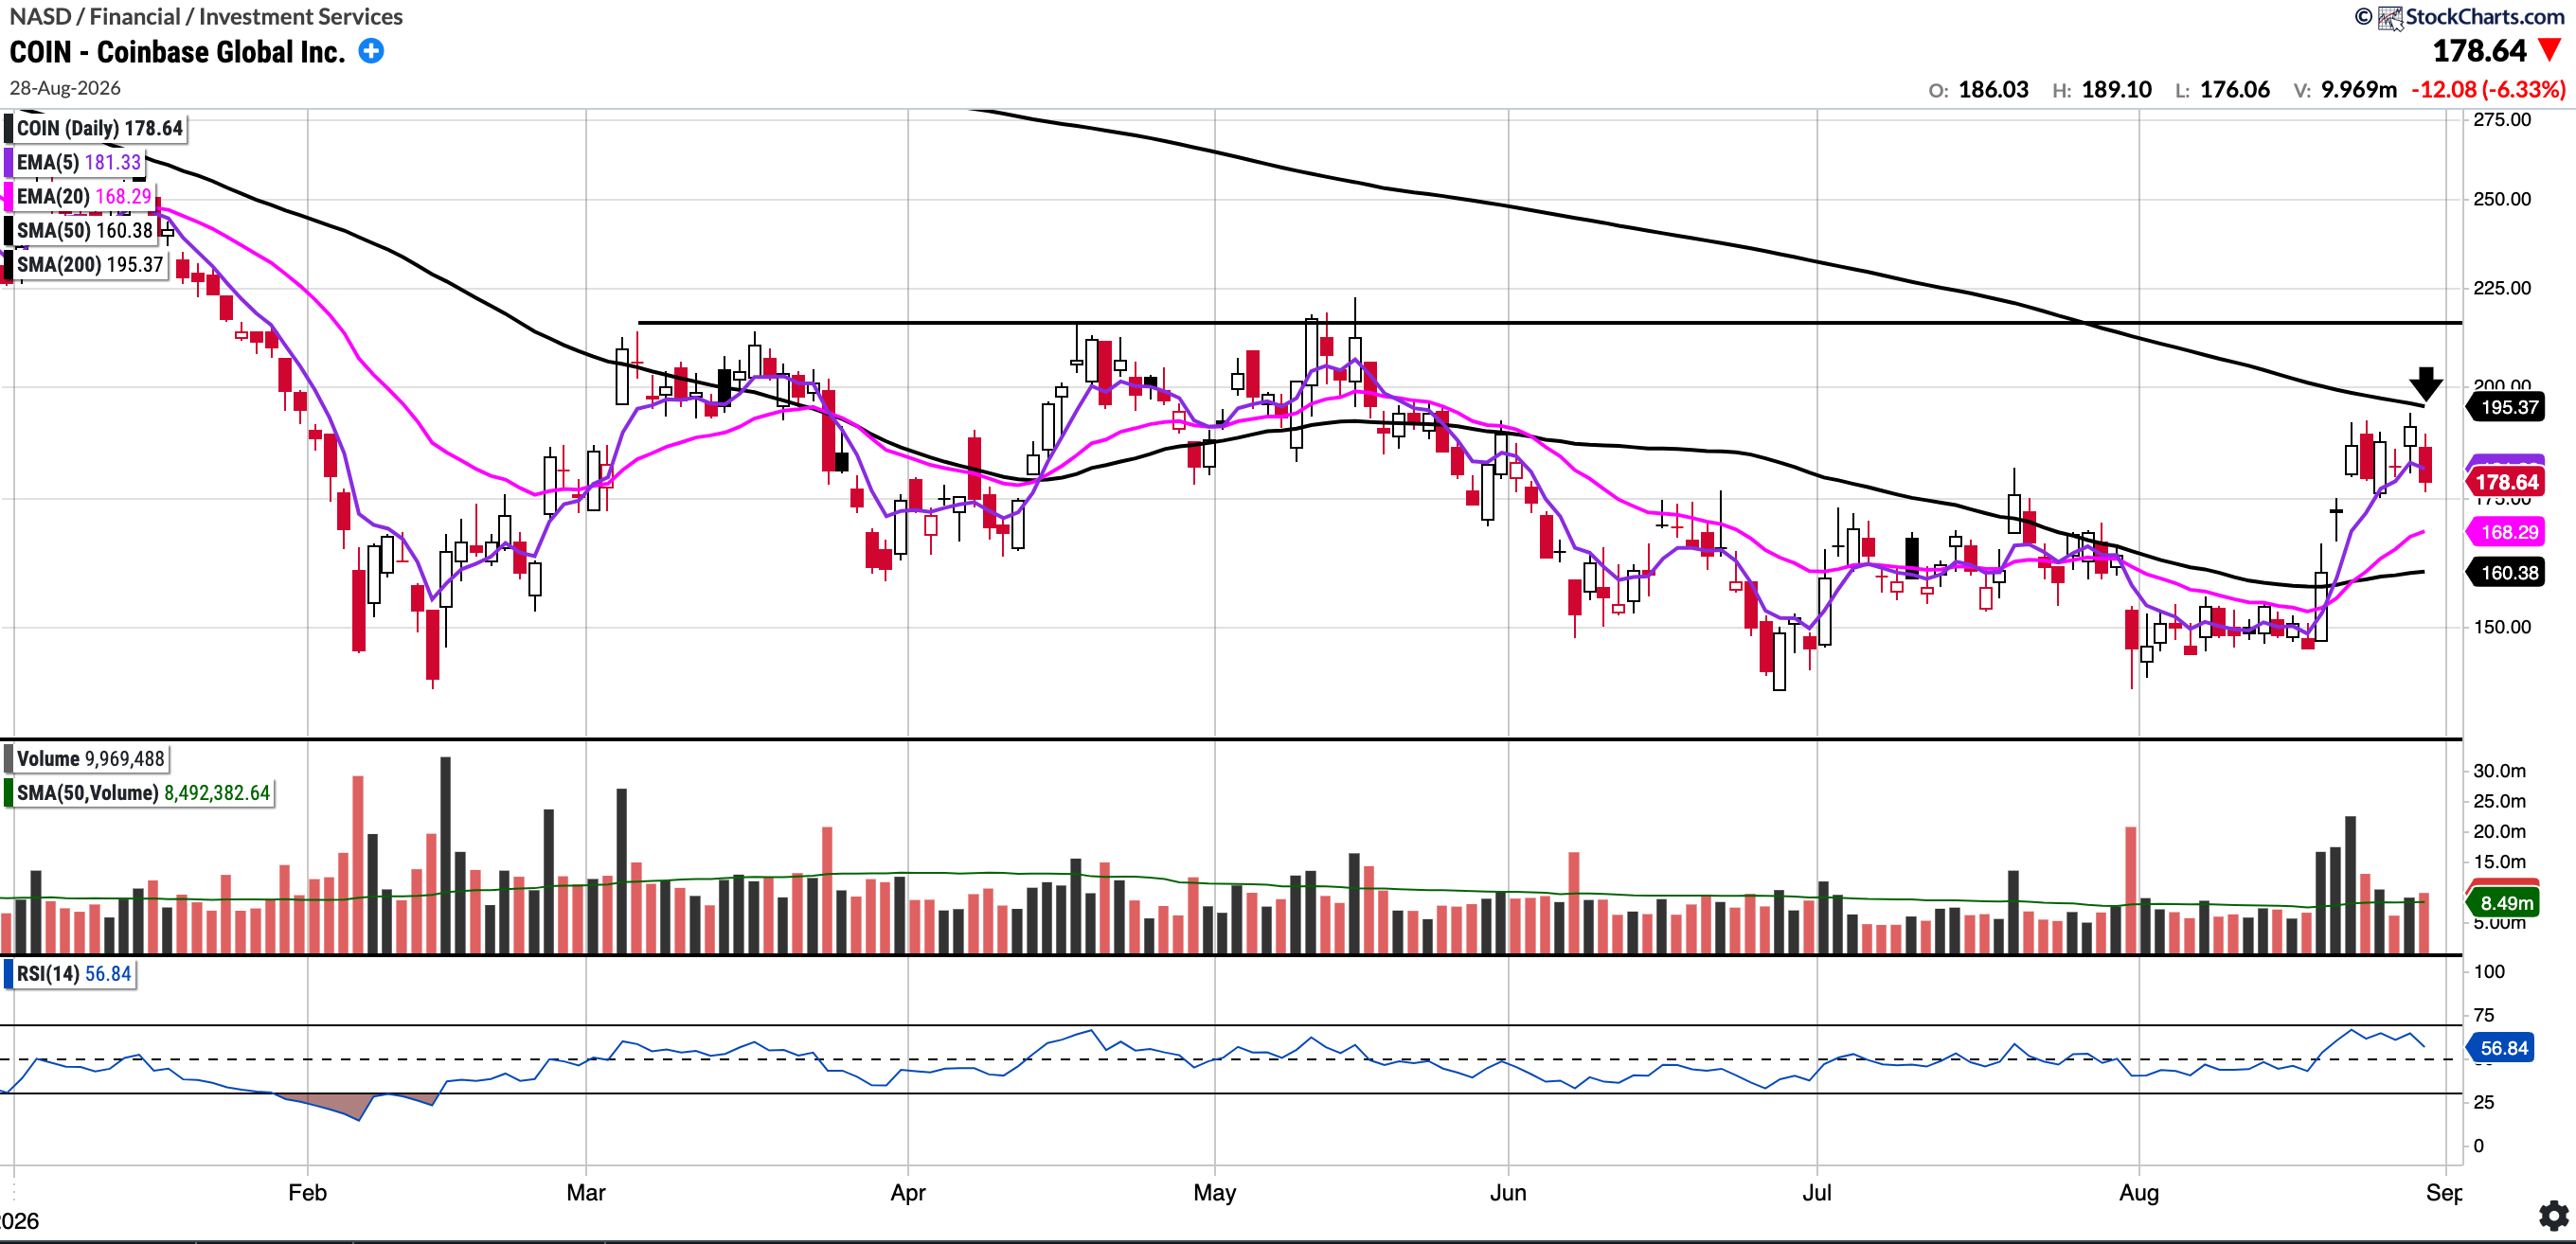
COIN (Currently Long)
Currently trades at $178.64, 11.39% above the 50SMA and 8.56% below the 200SMA.
RSI 56.84
-21.0% YTD
COIN has rallied meaningfully from the recent lows; however, it remains below its 200 SMA, the resistance level flagged last week. Bulls will want to see that level reclaimed, and above that, the 213/214 resistance is the next area of interest (see chart). One strategy is to trim some into the resistance if you feel it is unlikely to be flipped.
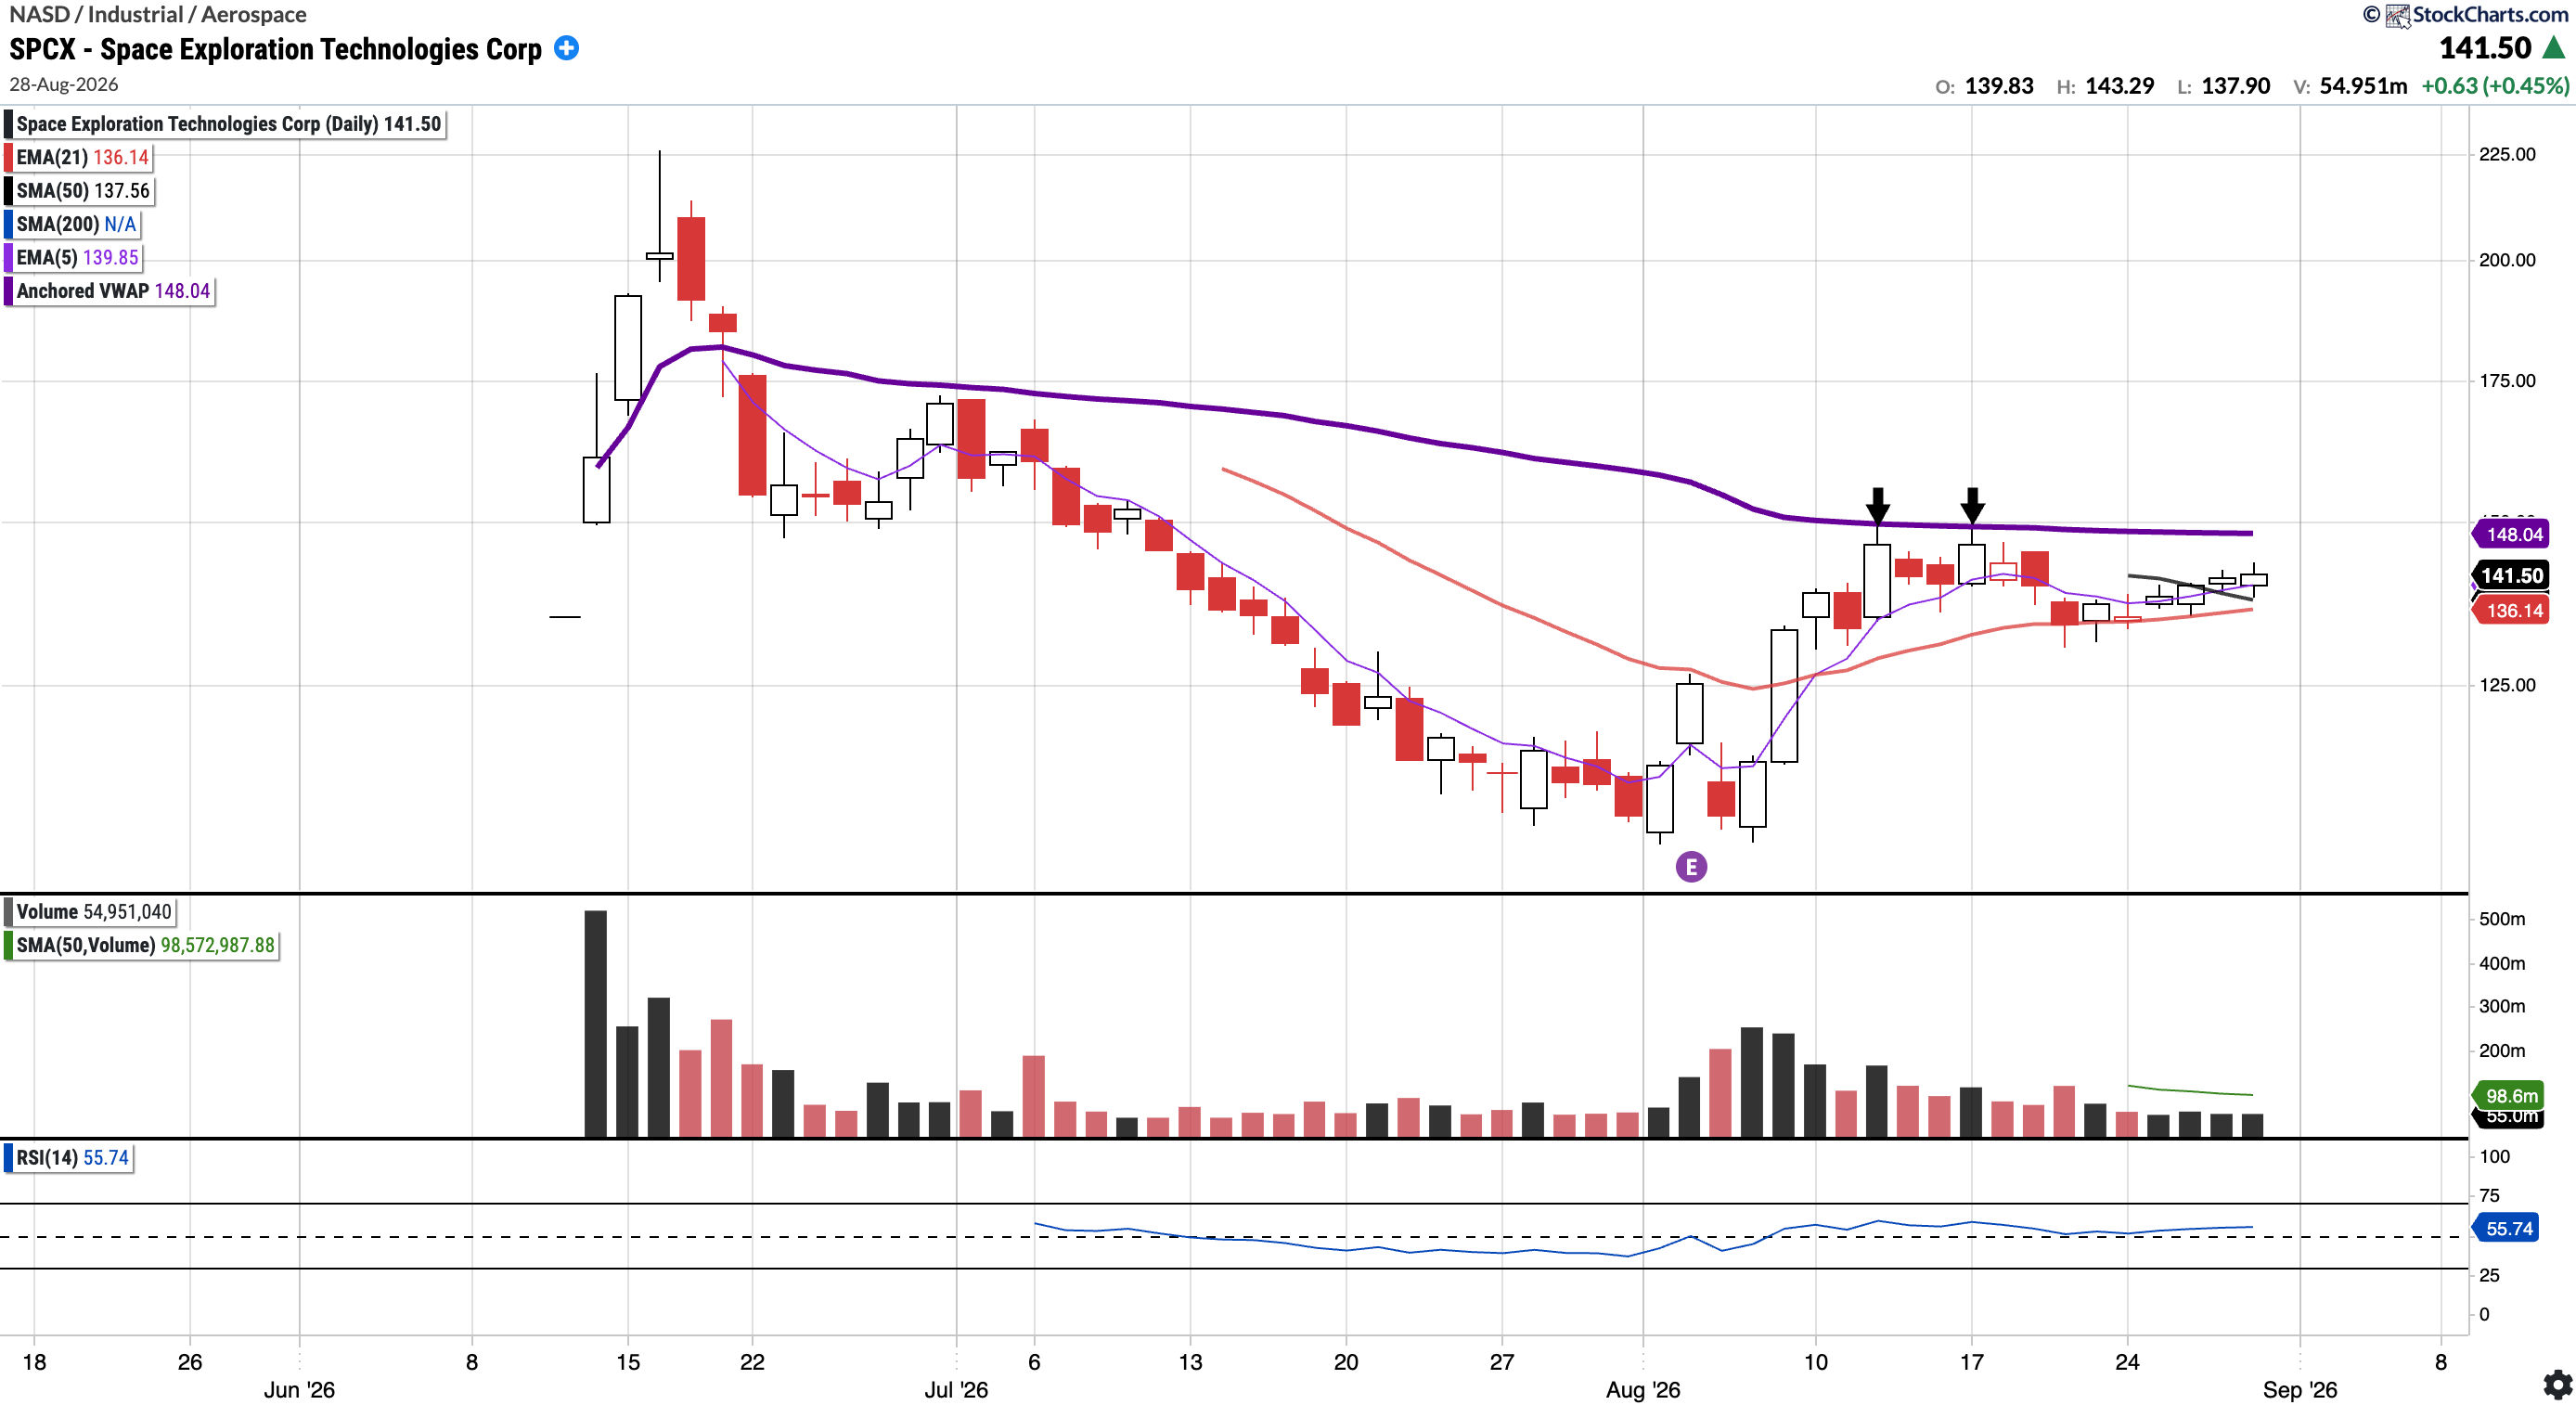
SPCX
Currently trades at $141.50, 2.86% above the 50SMA. 200SMA isn’t available yet given the limited trading history since its June 12 IPO.
RSI 55.74
-5.67% YTD
SpaceX has started to show some strength of late, and a reclaim of the anchored VWAP from its June 12 IPO date would be strong evidence that buyers are back in control. Price did try to break above the anchored VWAP twice but failed (see arrows). The IPO AVWAP is a level one could look to play risk against.
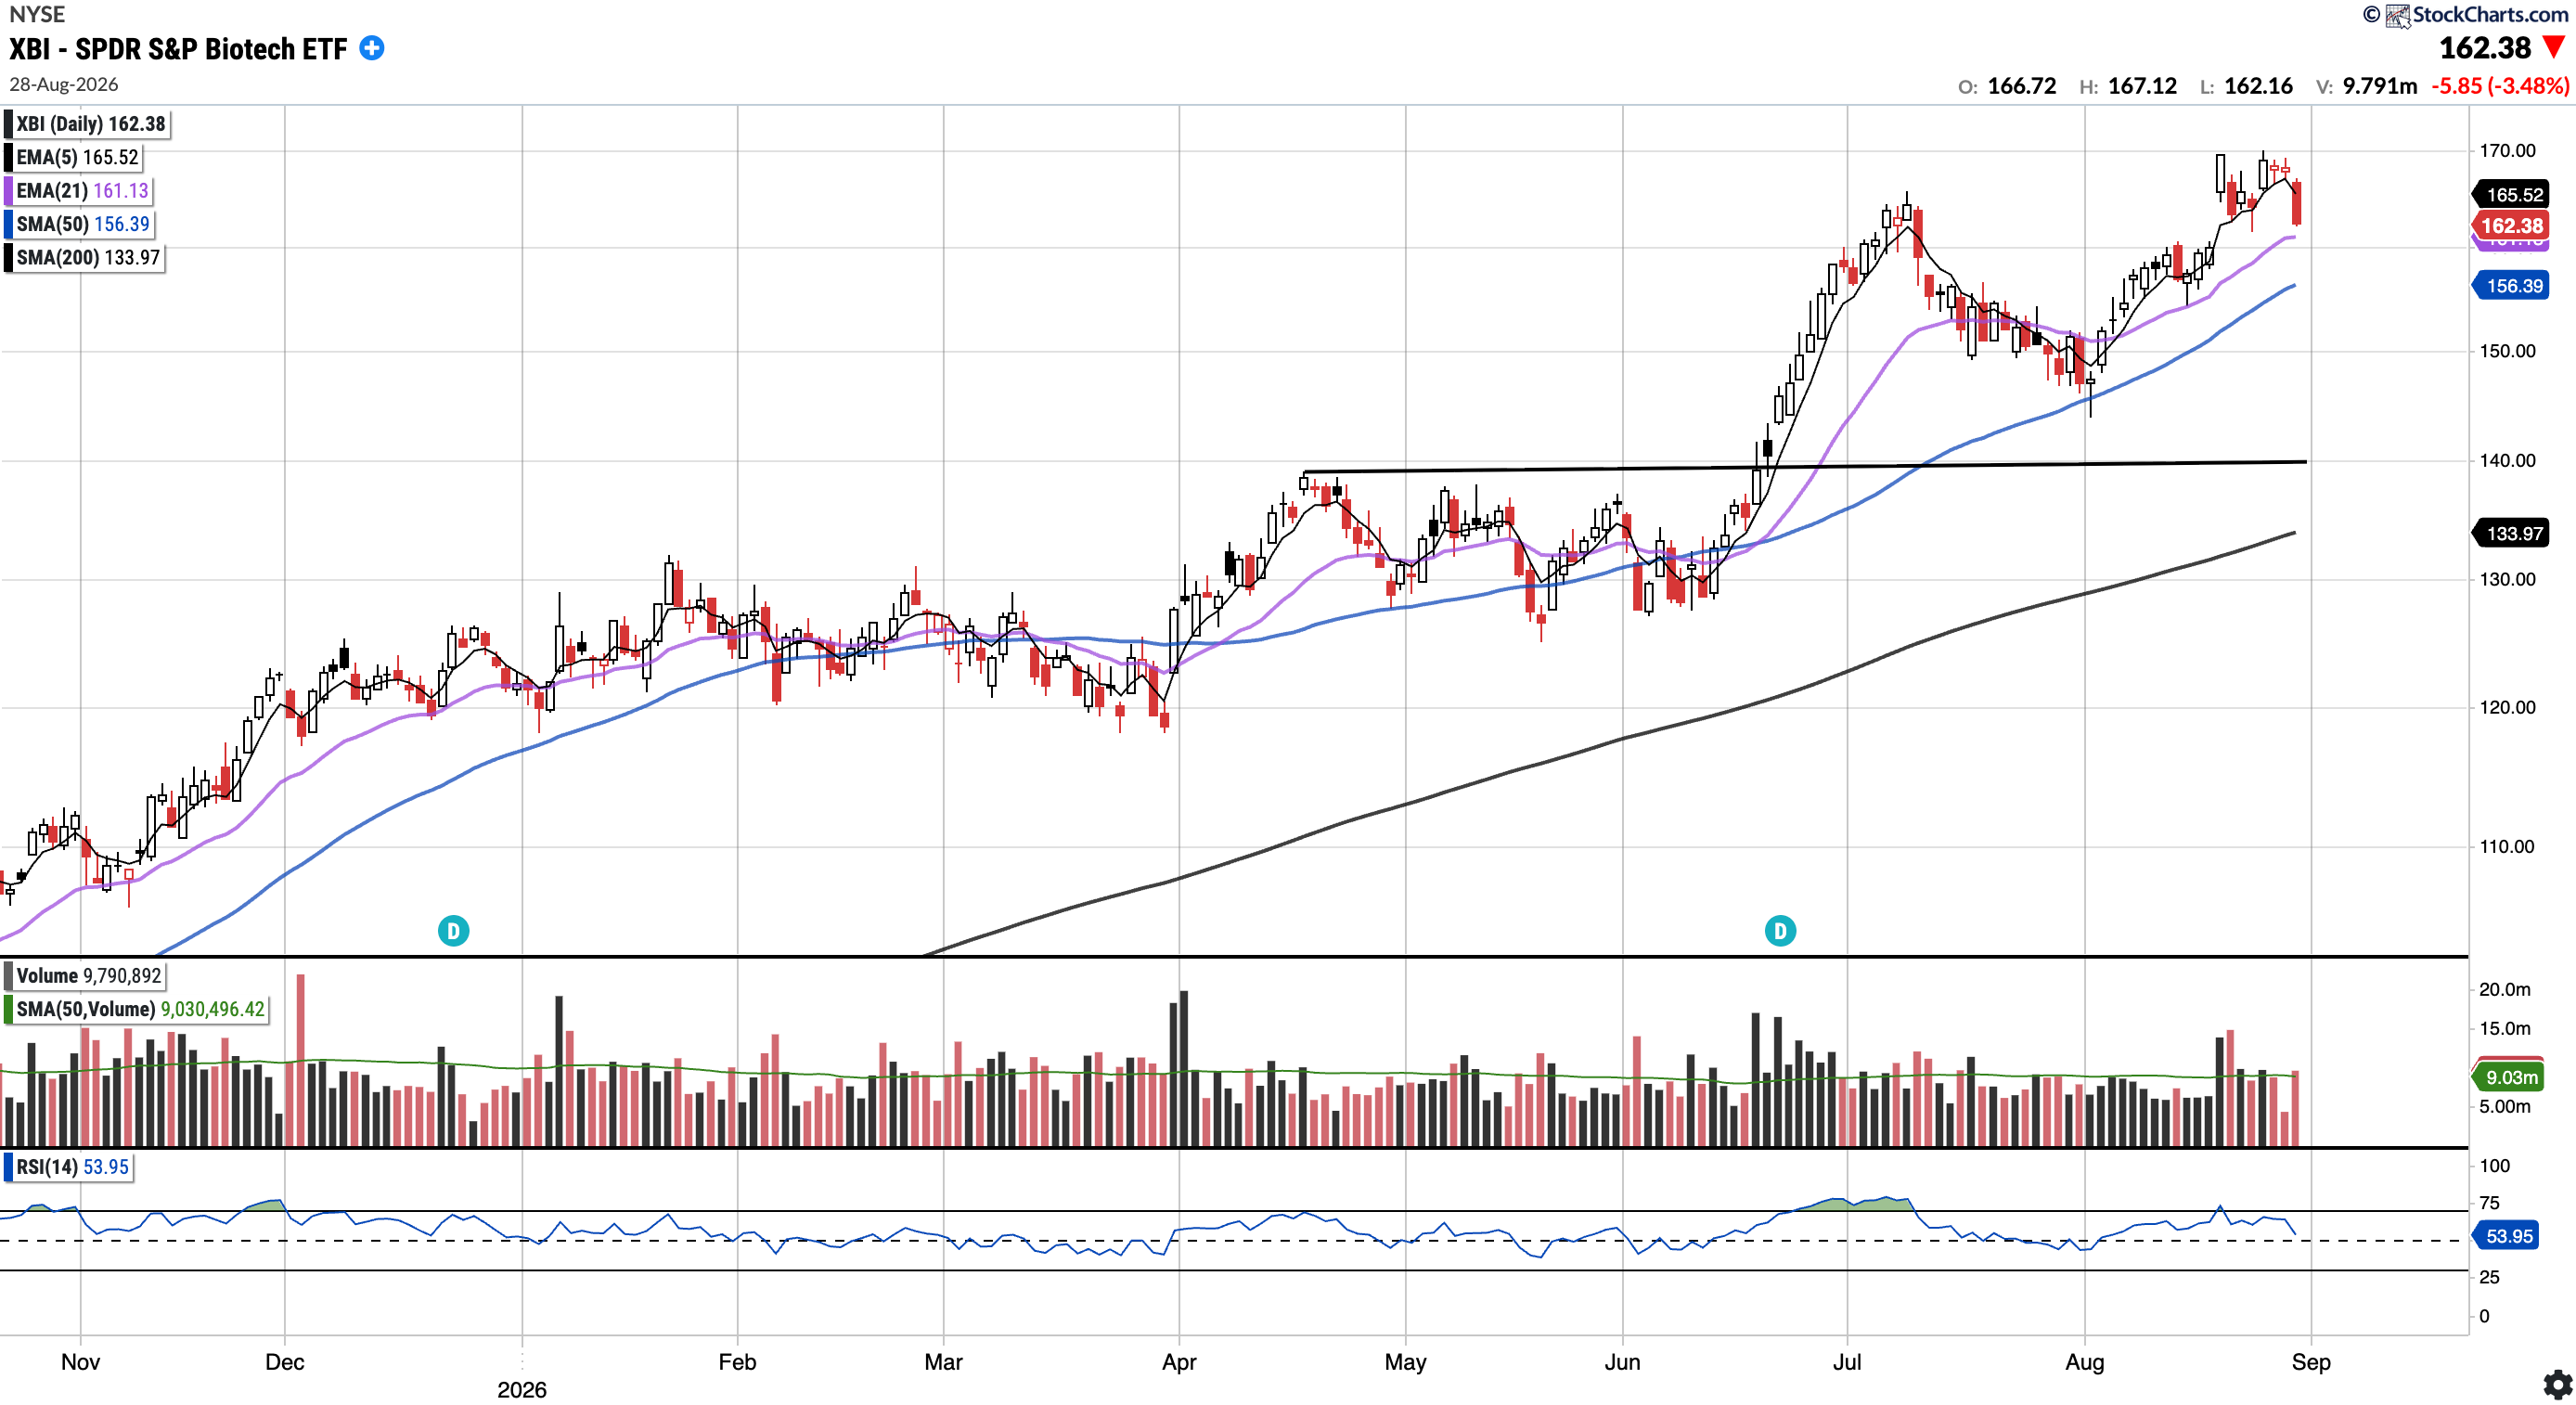
XBI
Currently trades at $162.38, 3.83% above the 50SMA and 21.21% above the 200SMA.
RSI 53.95
33.17% YTD
XBI saw a pullback below the 5EMA after a rally to all time highs the previous week. The next support to the downside is 21EMA at $161.13. Holding that level will be crucial to see a continuation of this uptrend.
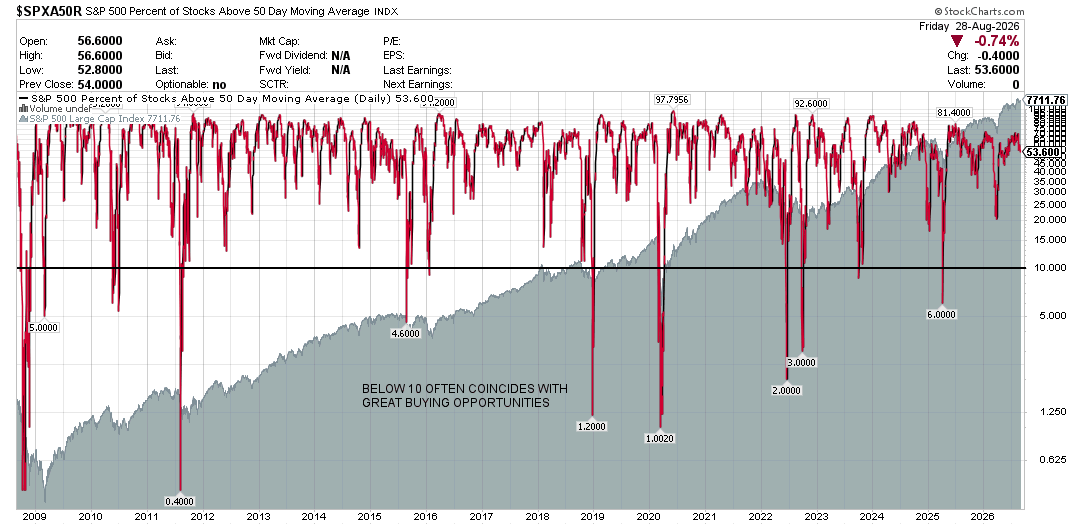
S&P 500 Percentage of Stocks Above the 50 Day Moving Average: Currently 53.6%
Breadth decreased slightly this week, with the percentage of stocks above the 50-day moving average now at 53.6% compared to 58.0% last week.
Notable portfolio changes in previous week (all updated live in subscriber channels):
