

Hope you all are having a good weekend. Below, we will be previewing the upcoming week’s events and providing a portfolio update as usual.
Format for what is covered in this weekly preview:
A Look at the Indices
Key Upcoming Economic Events
Upcoming Earnings
Charts
Current Portfolio Holdings:
Sizing | Cost Basis | Timeframe | Planned Moves
Closing Thoughts (Scroll to here for my Market Commentary)
I recommend checking out the most recent Monthly Portfolio and Performance Update below:

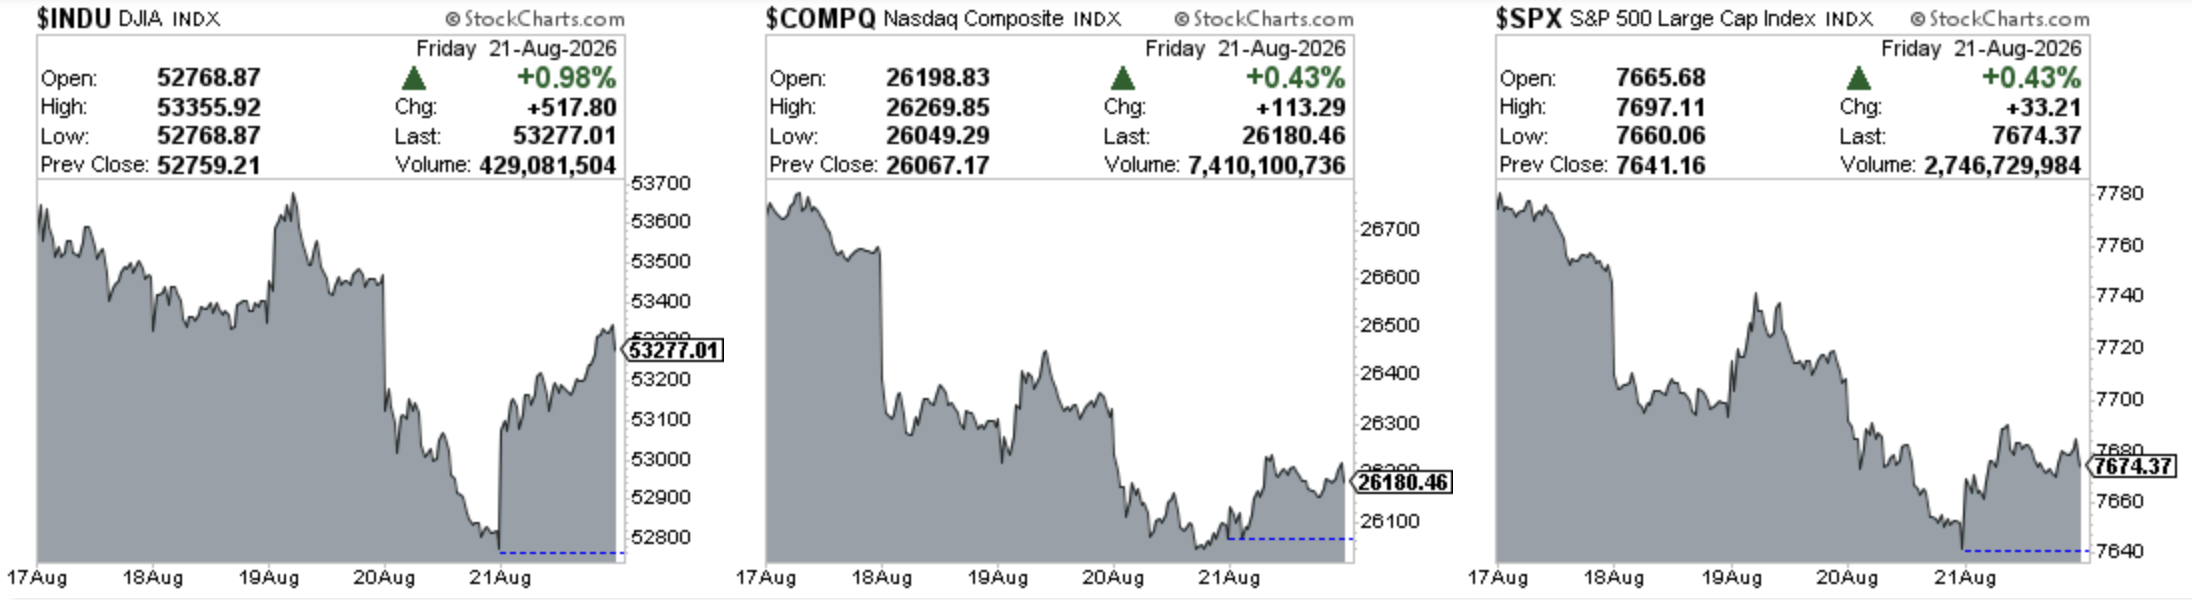
Indices
Dow Jones Industrial Average declined 0.85% in the last week
S&P 500 declined 1.43% in the last week
Nasdaq Composite declined 2.05% in the last week
IWM declined 1.68% in the last week
Key upcoming economic events
Monday, August 24
Chicago Fed National Activity Index (July)
Tuesday, August 25
S&P/Case-Shiller Home Price Index (June)
Richmond Fed Manufacturing Index (August)
New Home Sales (July)
Consumer Confidence (August)
Wednesday, August 26
Personal Income and Spending / PCE Price Index (July)
GDP (Q2, Second Estimate)
Durable Goods Orders (July, Preliminary)
Thursday, August 27
Weekly Jobless Claims
Wholesale Inventories (July, Preliminary)
Jackson Hole Economic Symposium begins
Friday, August 28
Chicago PMI (August)
University of Michigan Consumer Sentiment (Final, August)
Fed Chair Kevin Warsh’s Jackson Hole keynote address, 10:00 a.m. ET
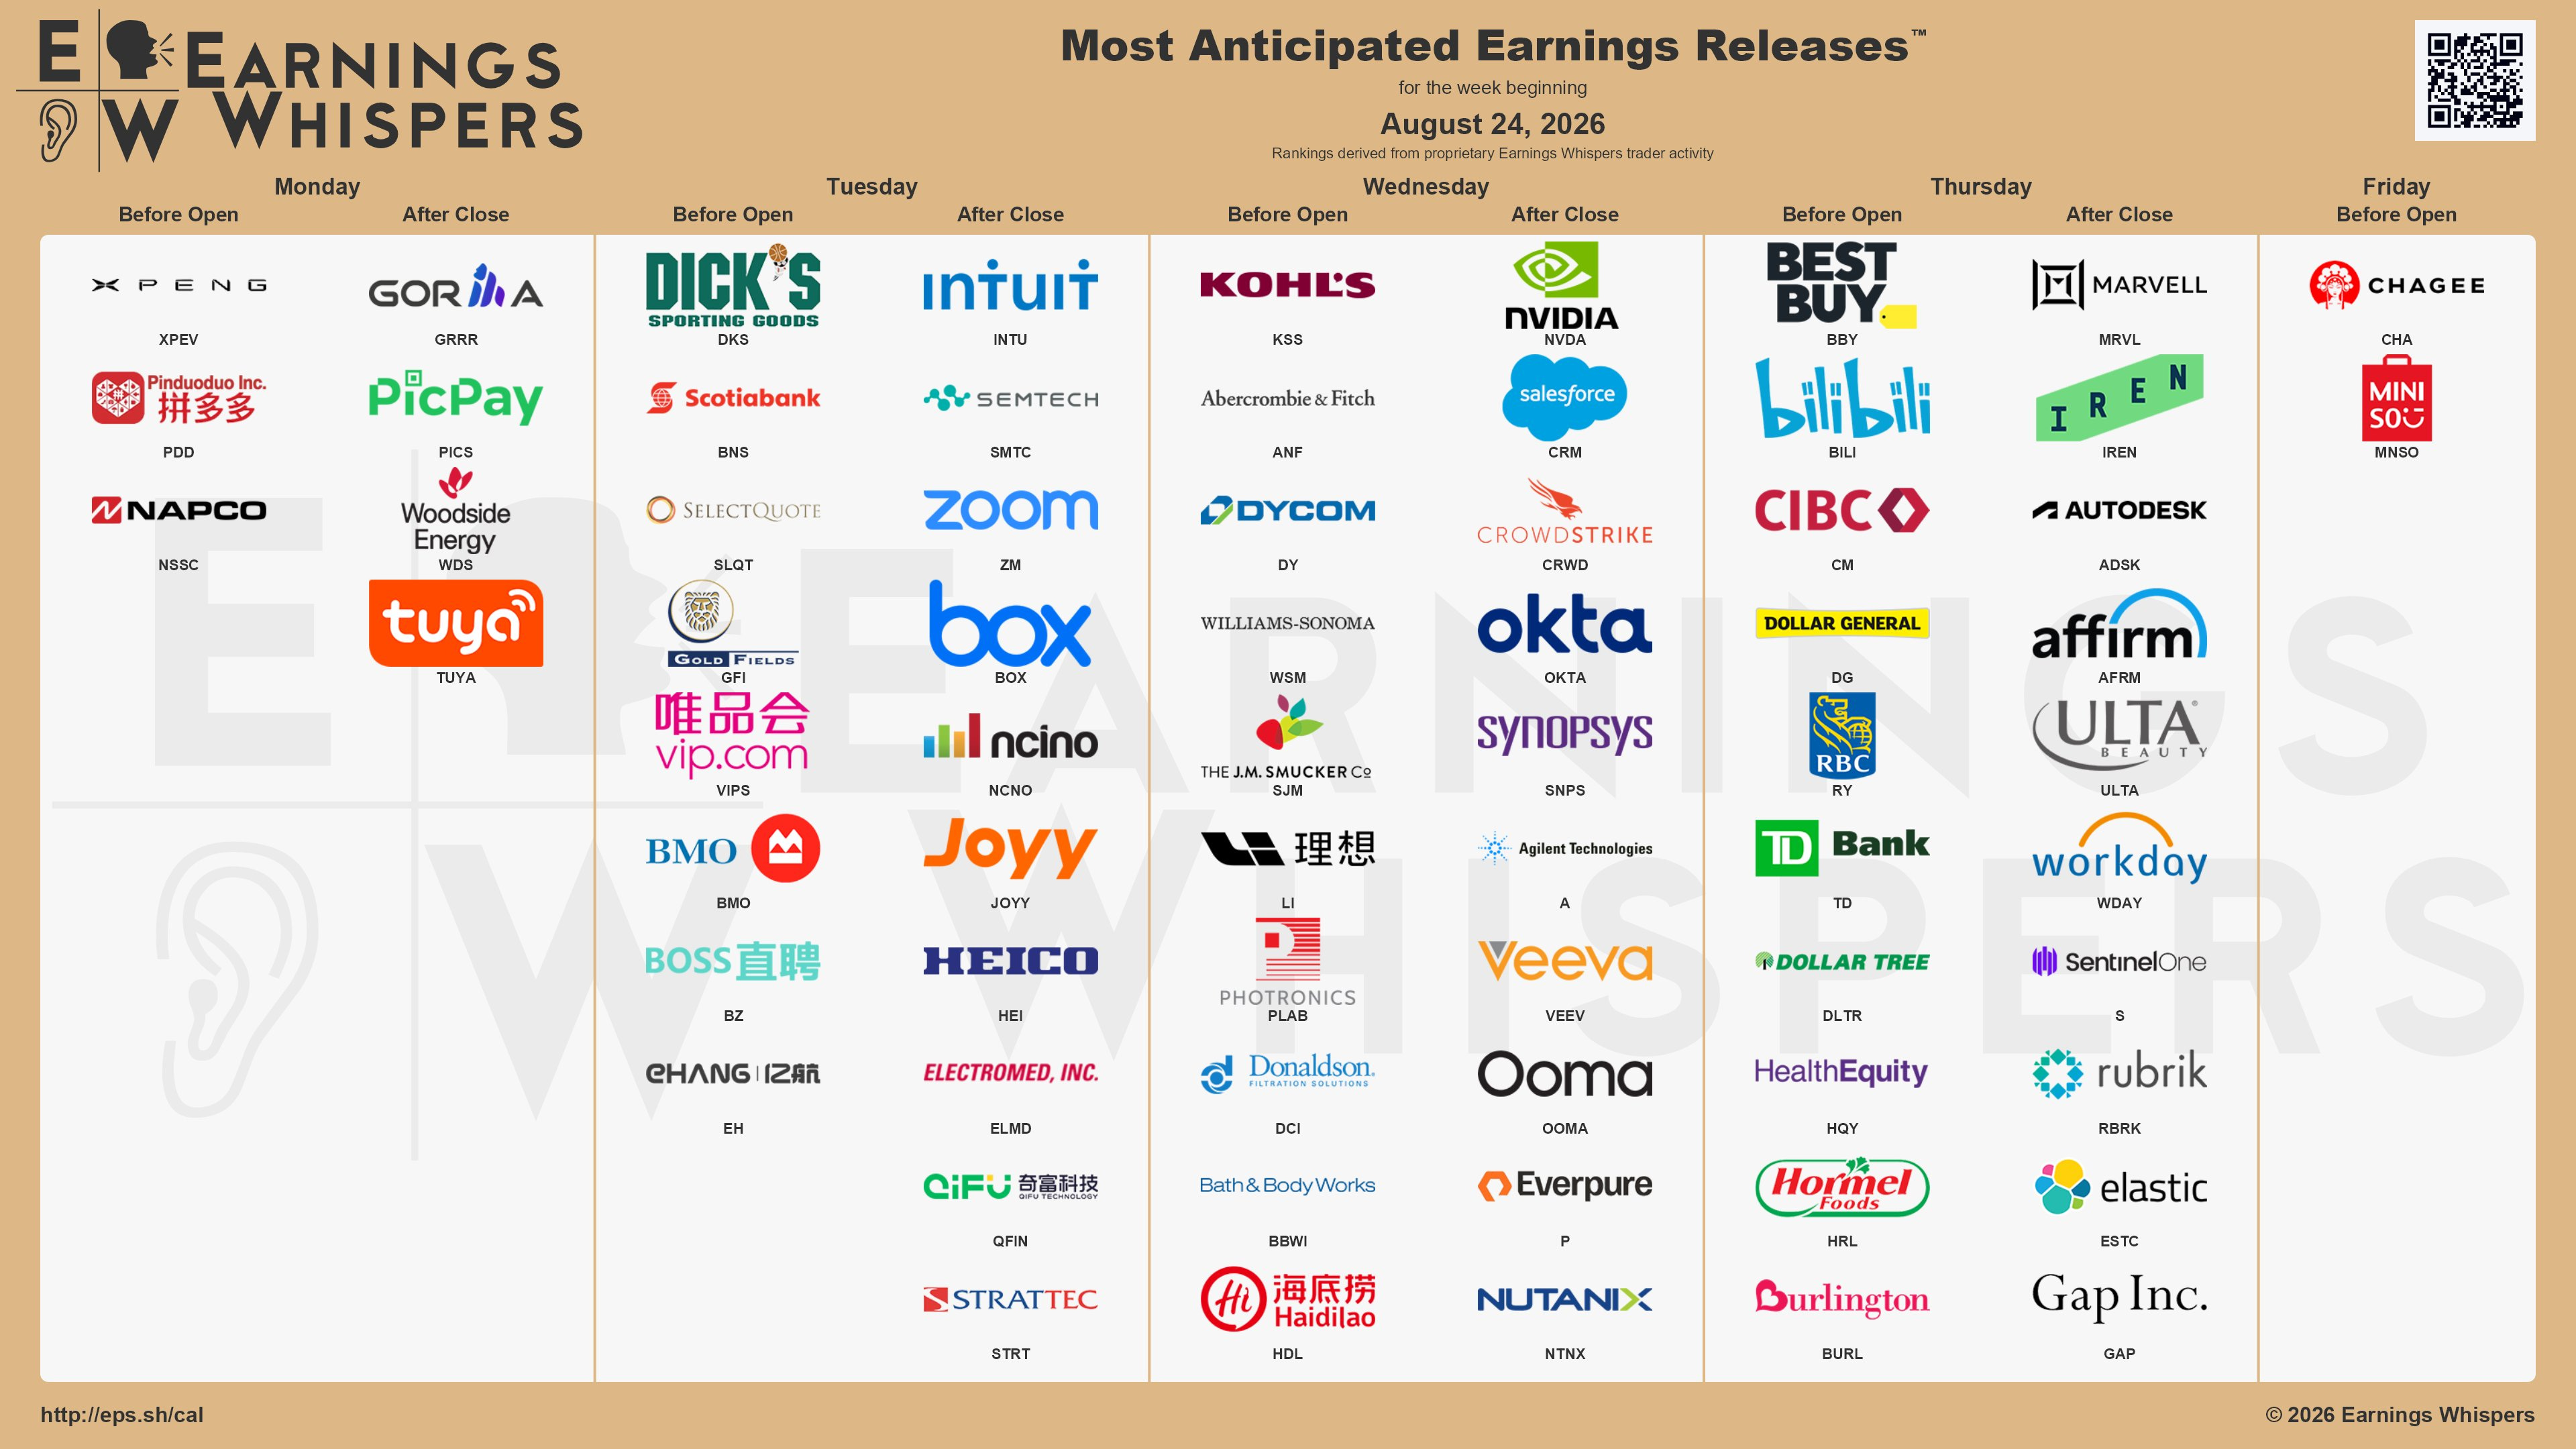
Upcoming Earnings
Below is the infographic by Earnings Whispers highlighting the schedule for this week:
Charts
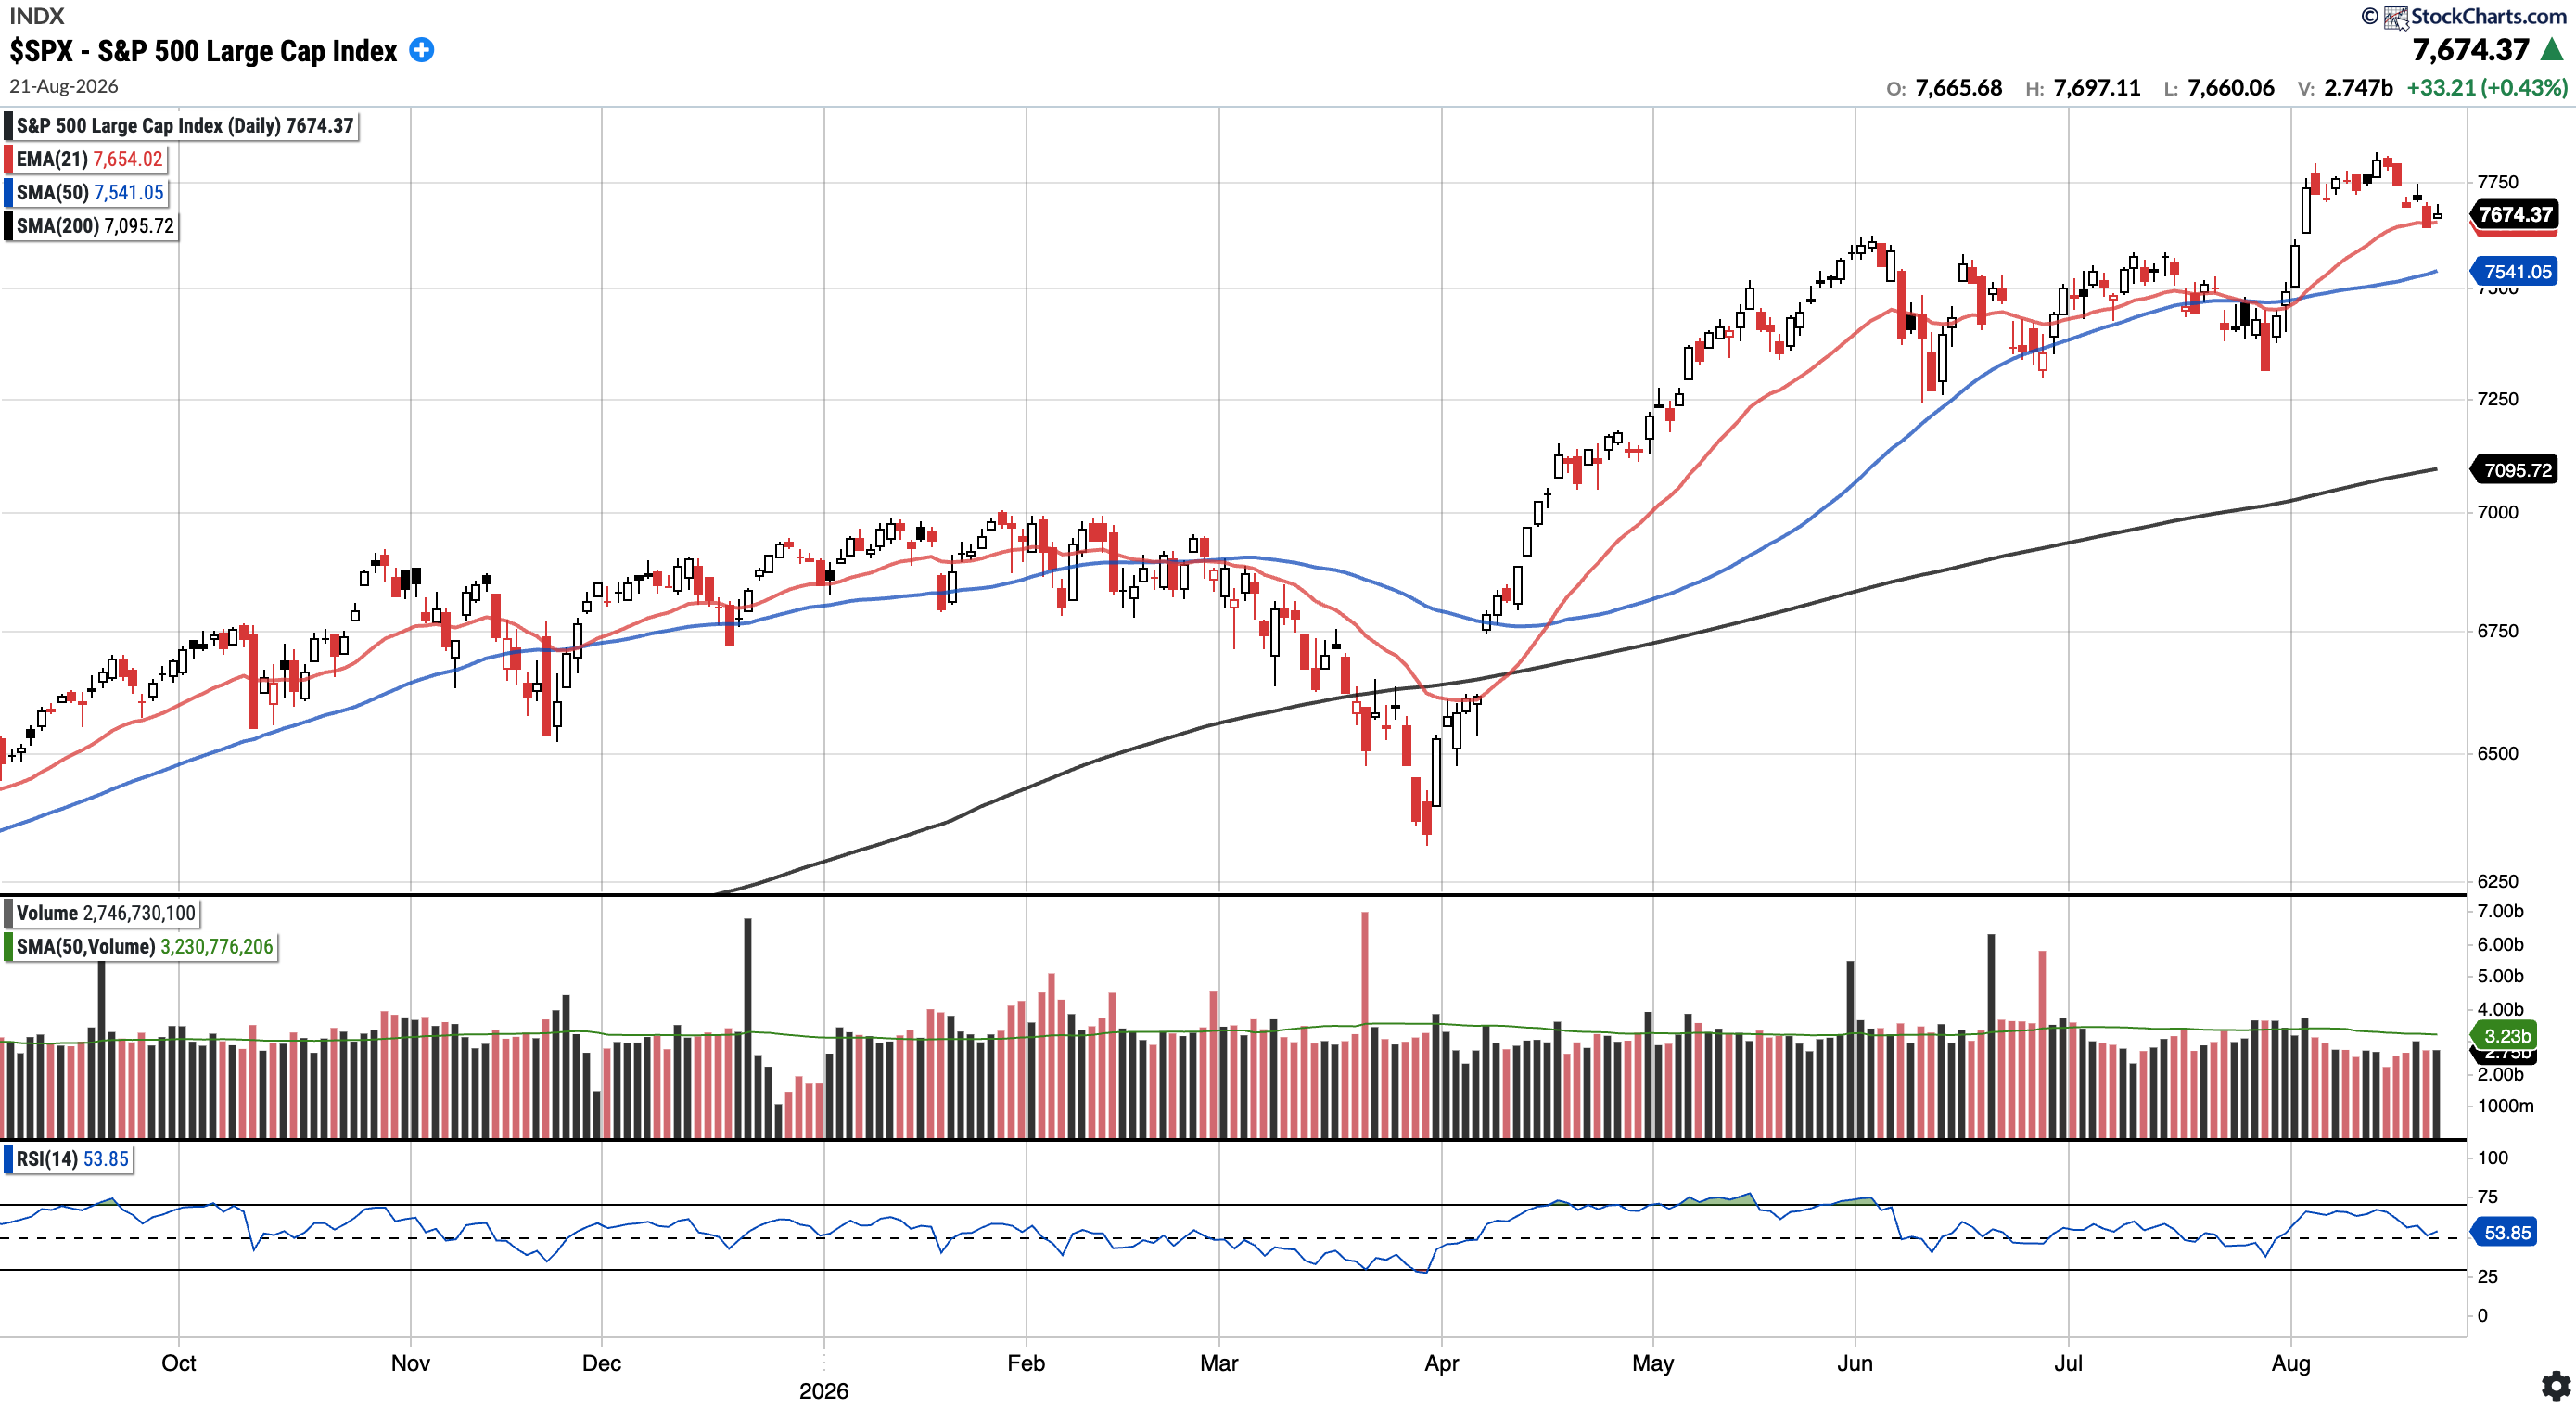
SPX
Currently trades at $7,674.37, 1.77% above the 50SMA and 8.15% above the 200SMA.
RSI 53.85
11.90% YTD
Distribution days in the last week: 1
The S&P 500 pulled back from recent highs this week and closed down 1.43% on the week despite a stronger finish on Friday. The pullback coincided with a spike in the 30-year Treasury yield to its highest level in nearly two decades, amid renewed US-Iran tensions. The index does remain above all key moving averages.
COMPQ
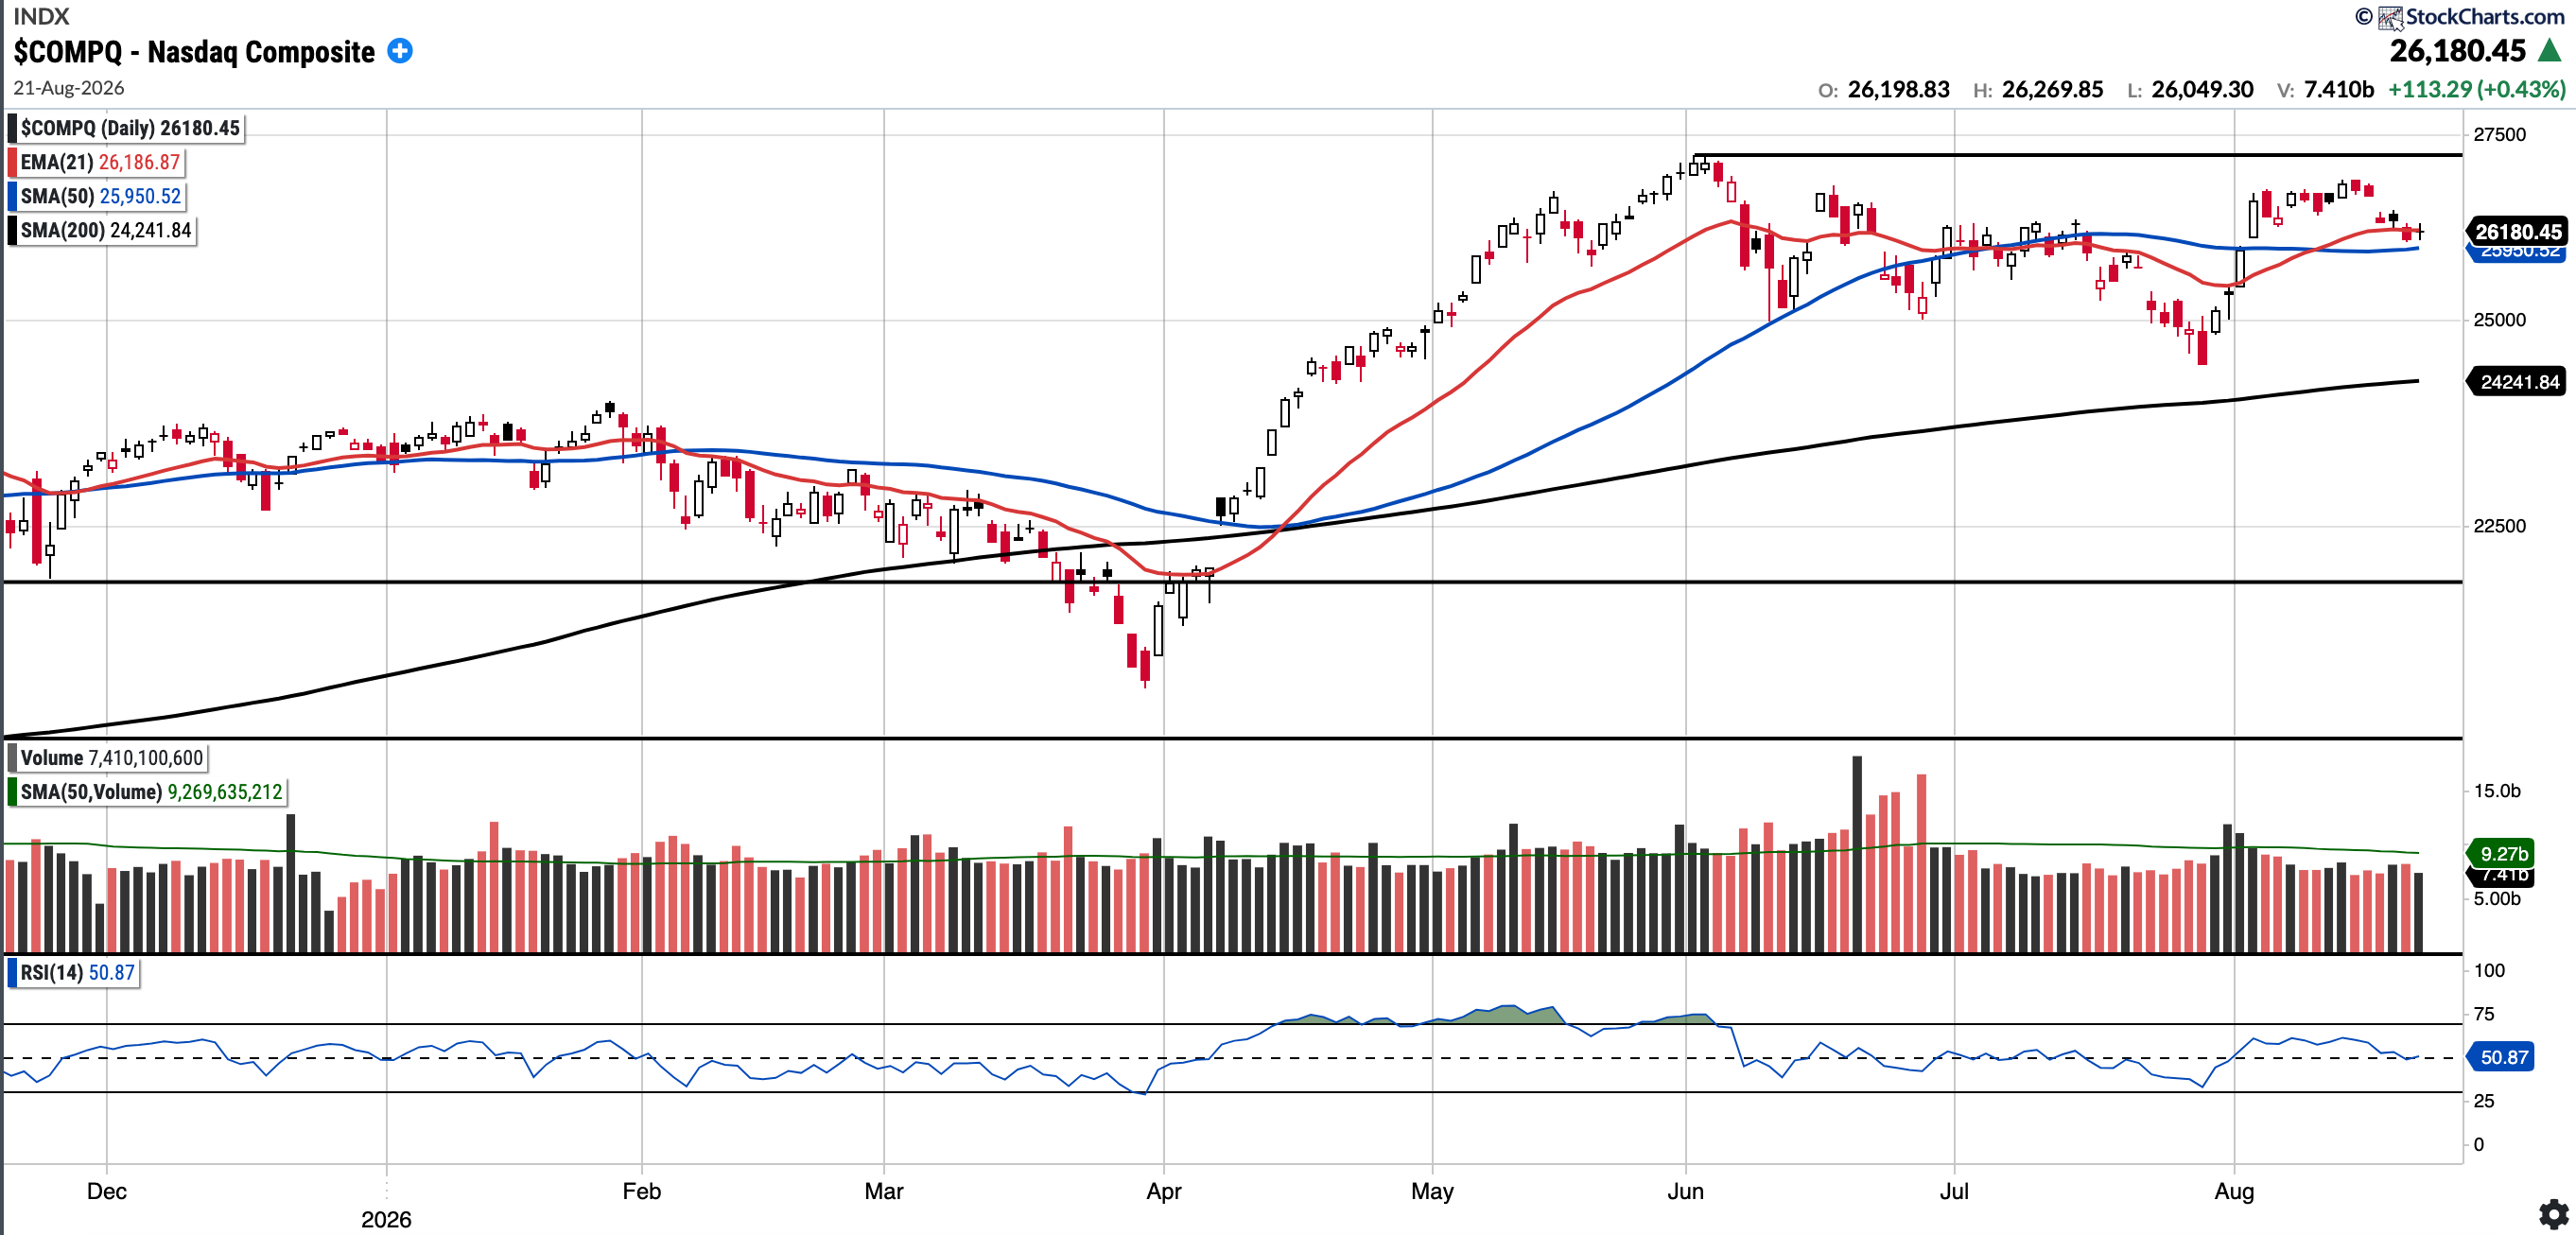
Currently trades at $26,180.46, 0.89% above the 50SMA and 8.00% above the 200SMA.
RSI 50.87
12.67% YTD
The Nasdaq Composite closed down for the week and failed to hold the 21 EMA. The next key moving average support is the 50-SMA at 25950.52.
Distribution days in the last week: 2
The Nasdaq Composite closed down for the week and failed to hold the 21 EMA. The next area of interest is the SMA 50 at 25950.52.
BTC (currently Long)
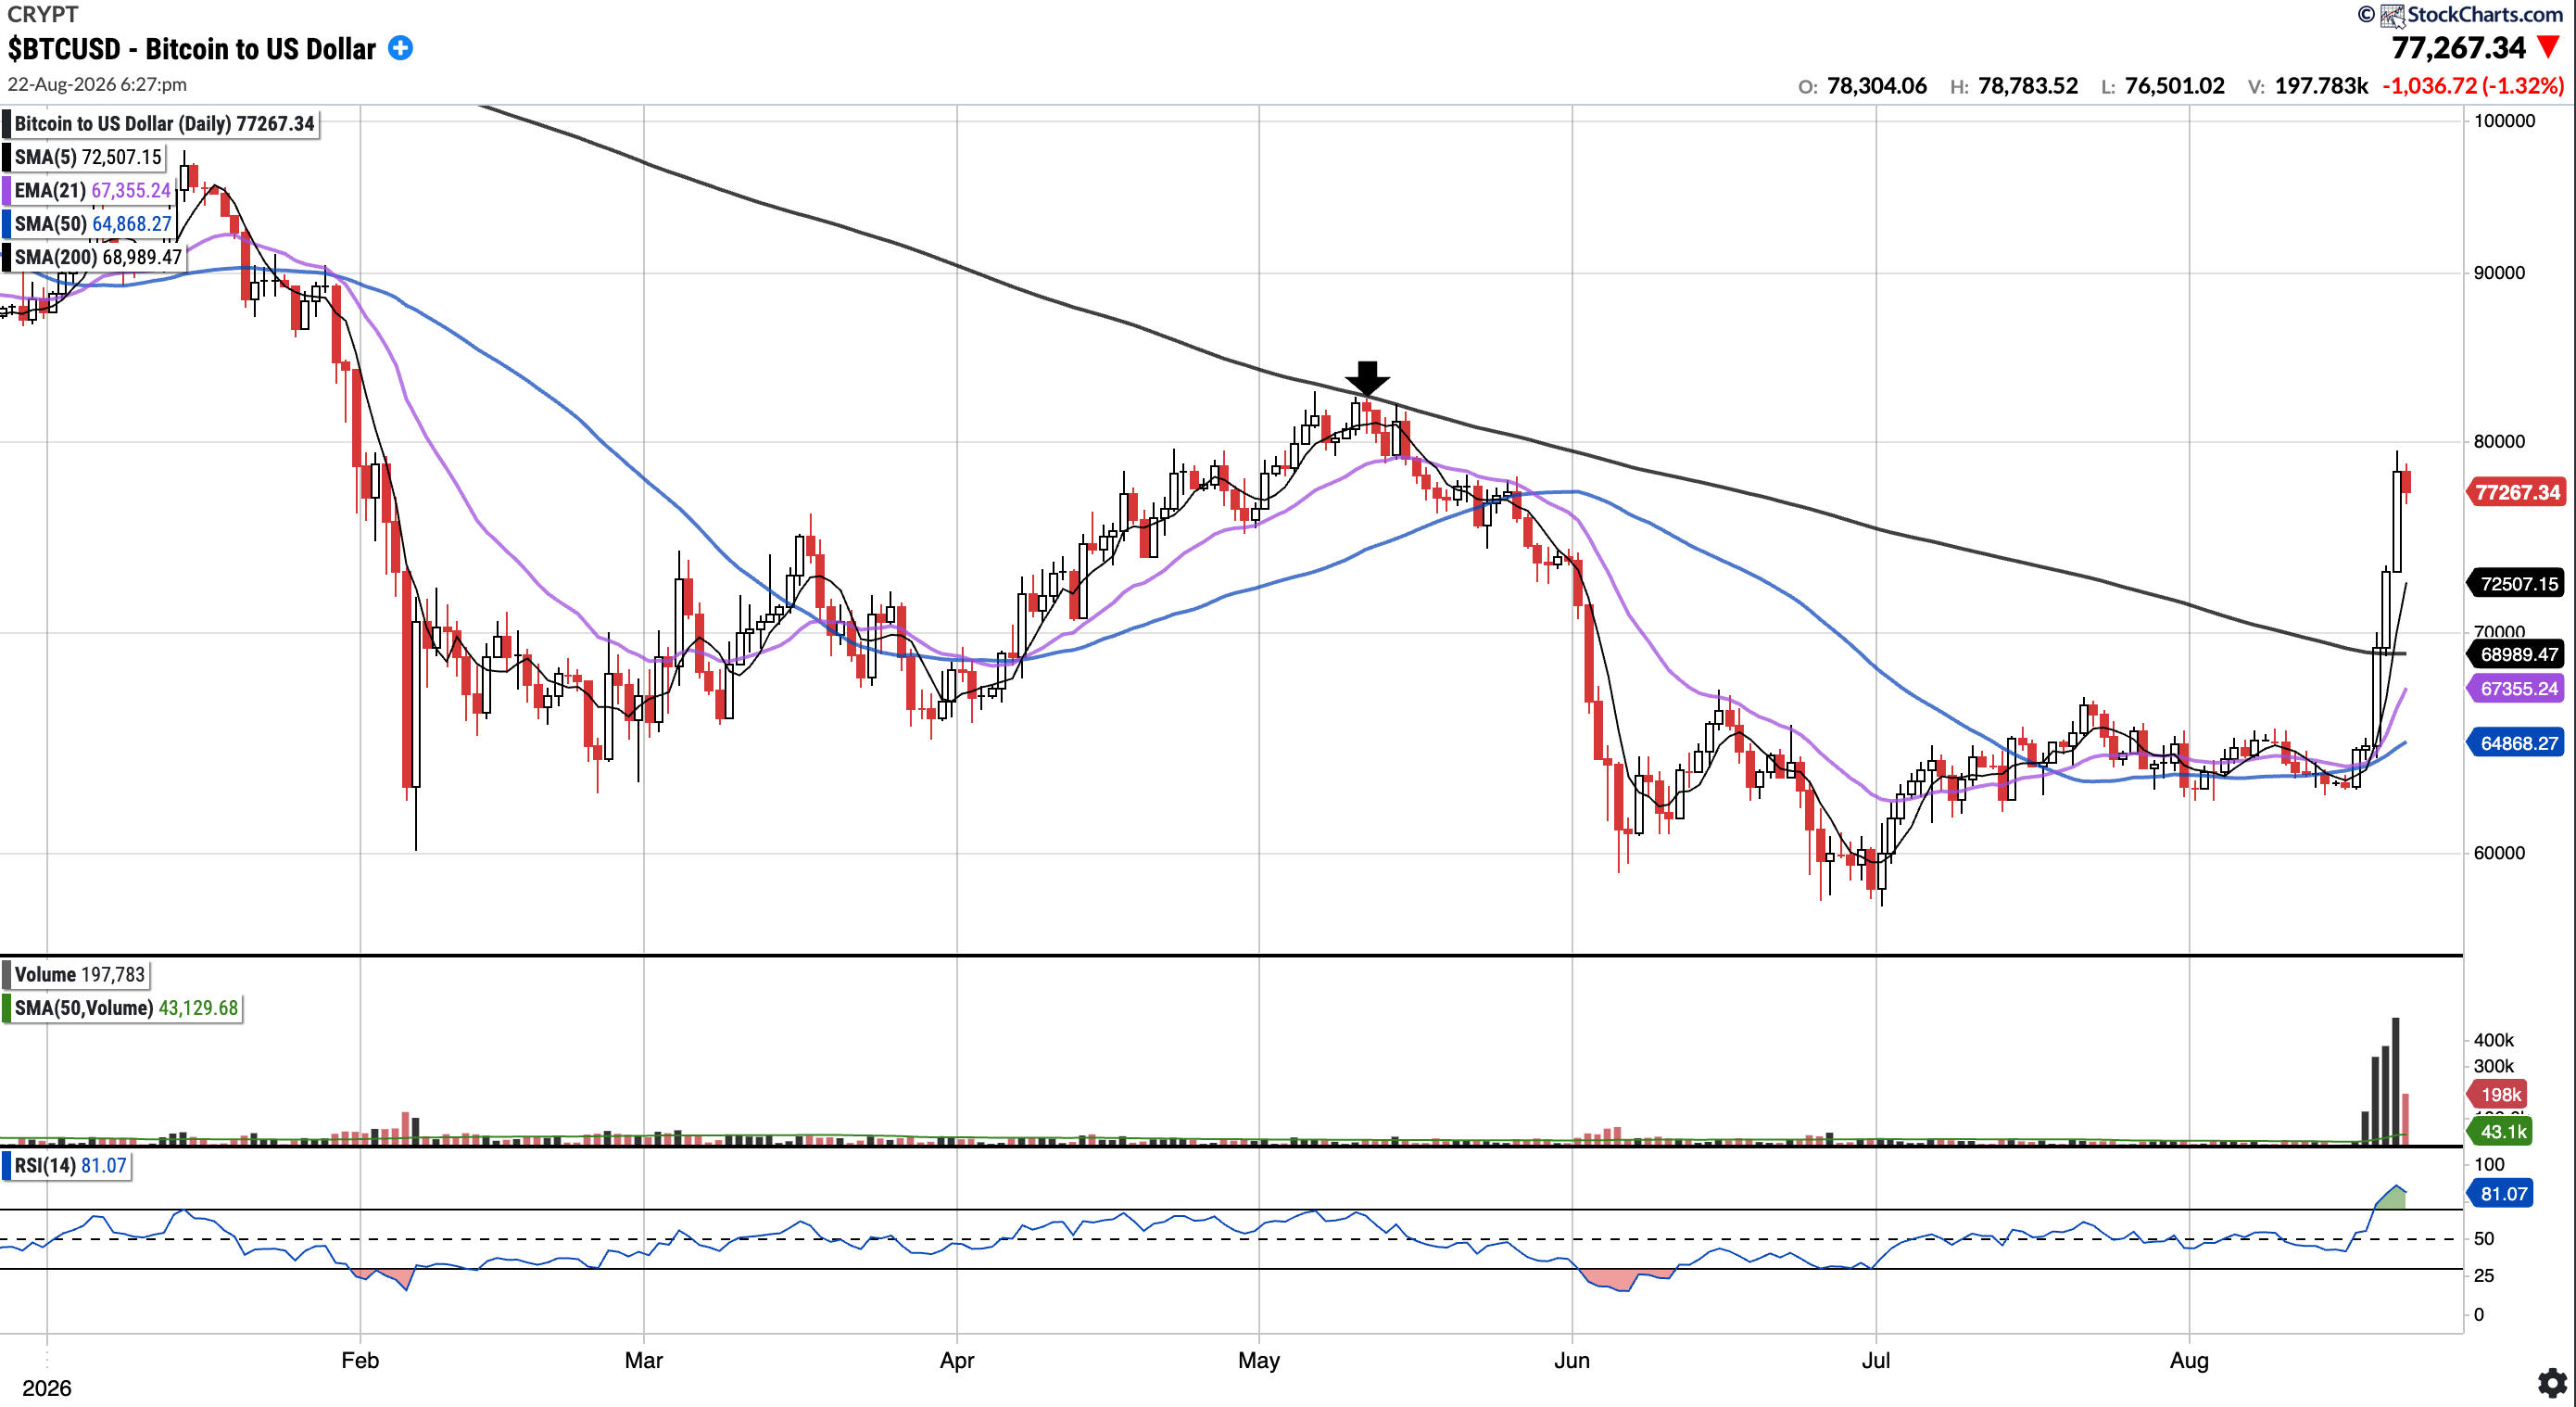
Currently trades at $77,267.34, 19.26% above the 50SMA and 12.14% above the 200SMA.
RSI 81.07
-12.82% YTD
The U.S. Department of the Treasury announced plans to double its long-term bond buybacks, weakening the dollar, with Bitcoin benefitting as an alternative asset.
Last week I had written:
Bulls will want to see a reclaim of those and then 200 SMA in the coming weeks, given that it has served as a strong resistance level.
Bitcoin broke back above both its 50- and 200-day moving averages after a prolonged downtrend, closing up nearly 20% from the week before. The move came as President Trump hosted crypto industry executives at the White House on Wednesday, calling on Congress to pass the Clarity Act. With this recent rally, BTC is in slightly overbought territory, with an RSI of 81.07
EEM
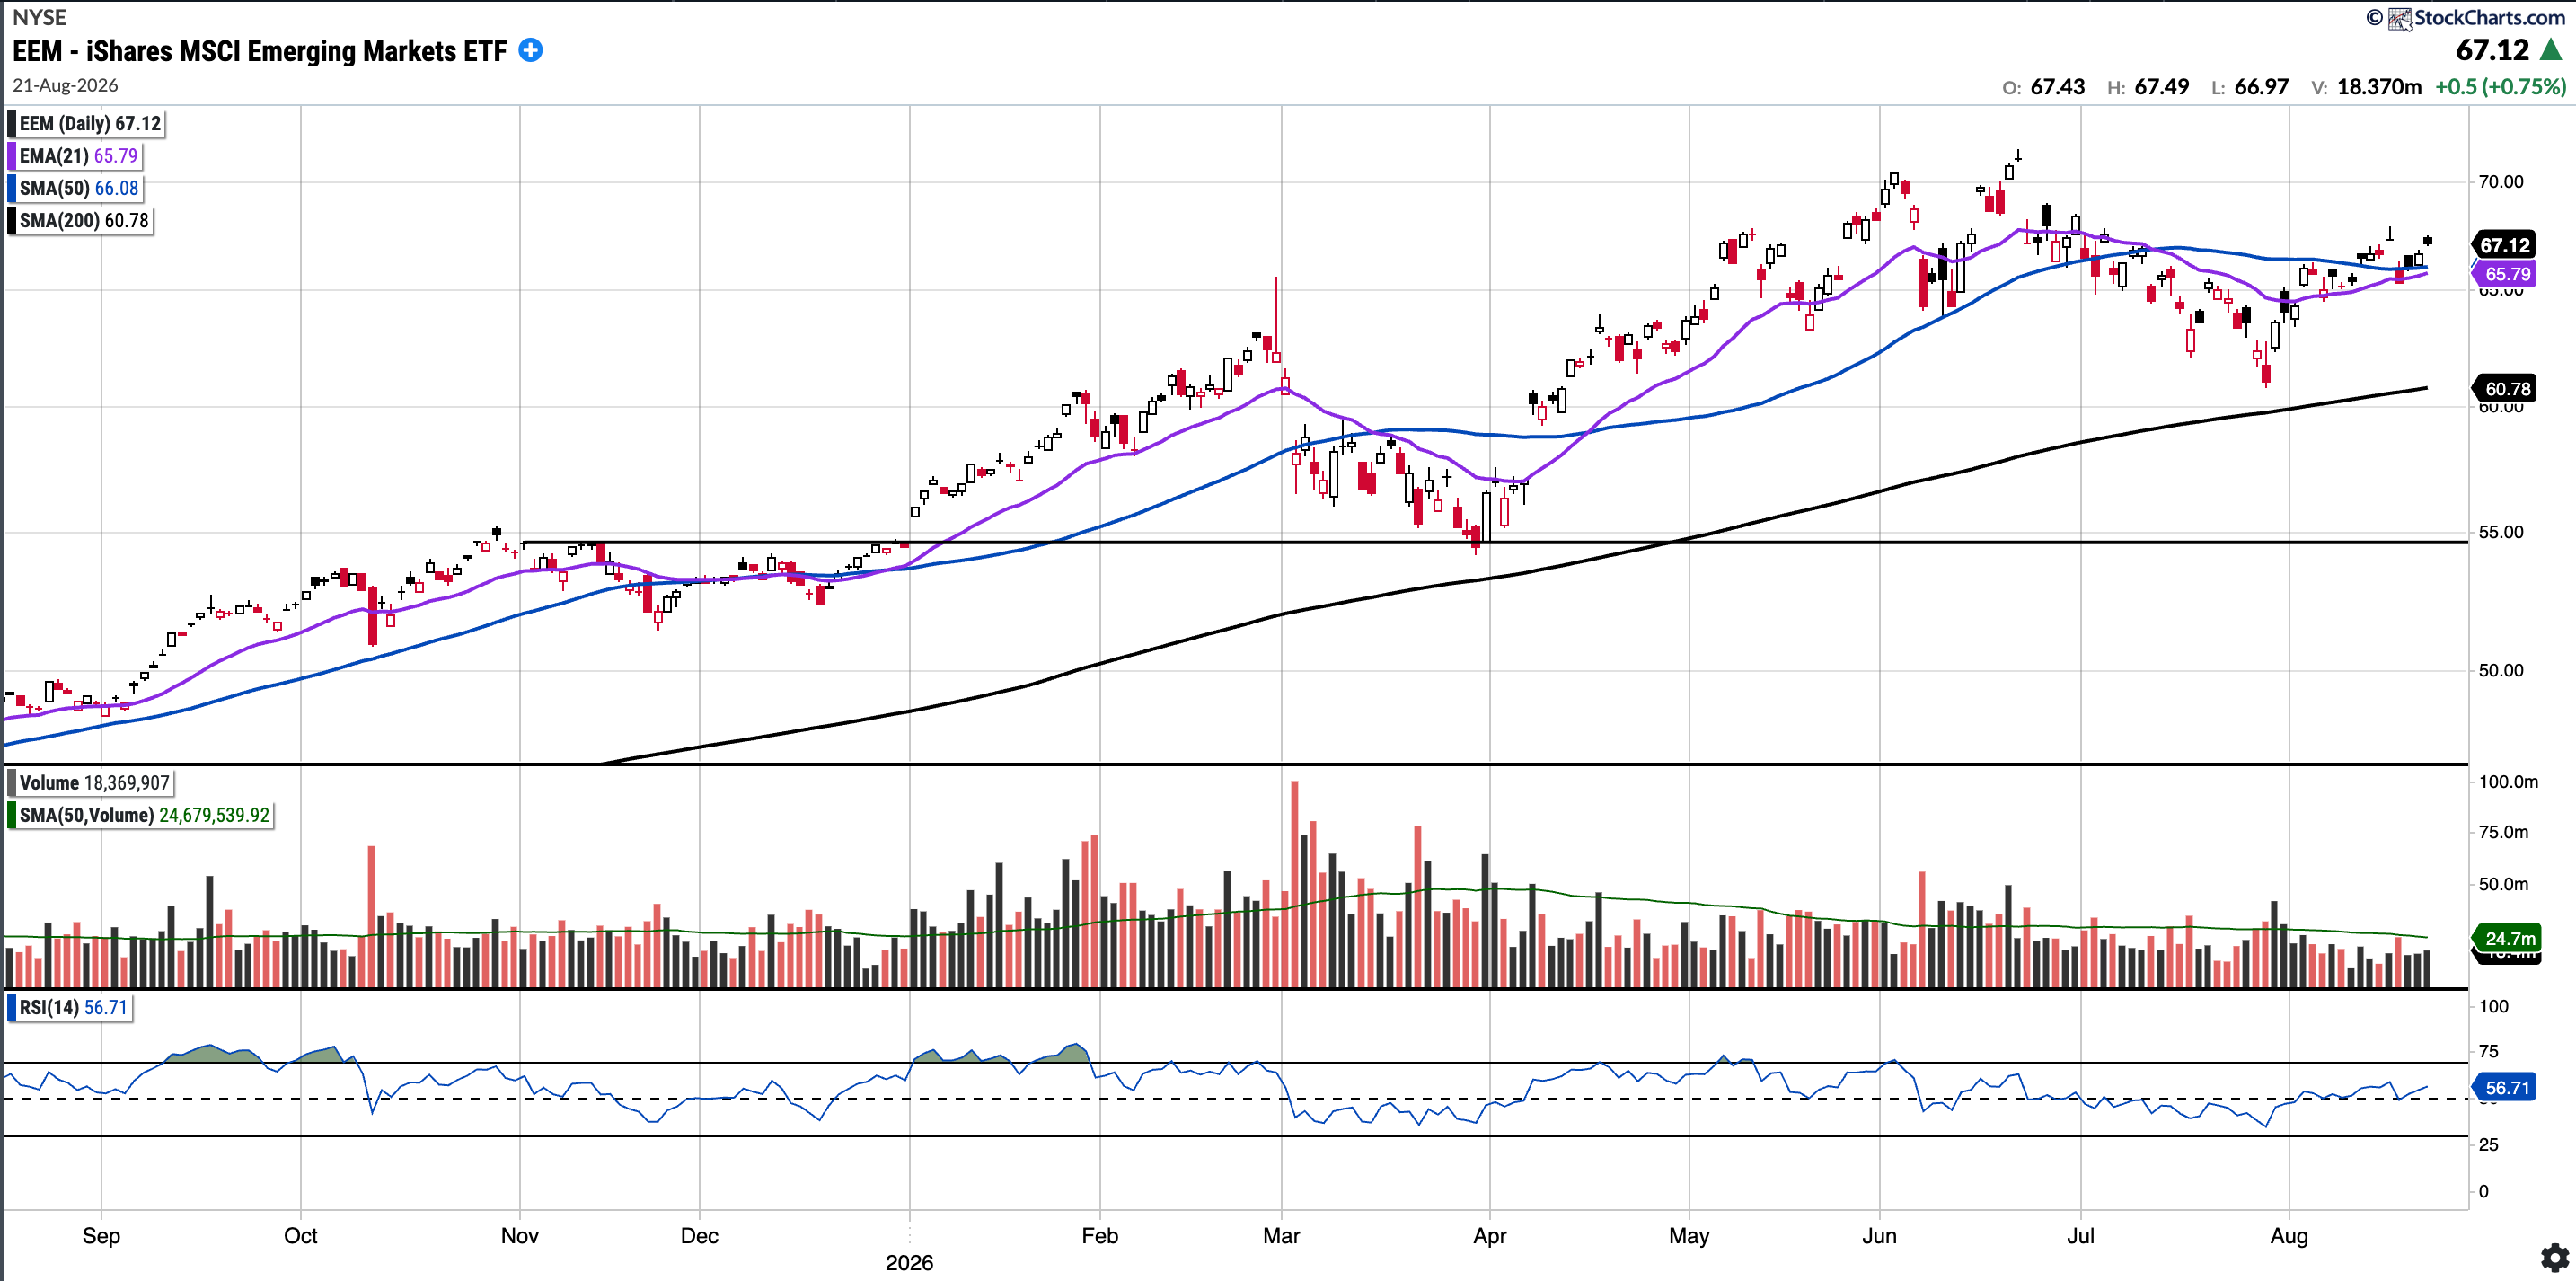
Currently trades at $67.12, 1.6% above the 50SMA and 10.4% above the 200SMA.
RSI 56.71
19.97% YTD
EEM remains in an uptrend and it continues to vastly outperform the SPX YTD, the gap has increased to almost 800bps. It closes above all key moving averages although the 21 EMA does remain below the SMA 50 as yet
GOLD (Long Physical)
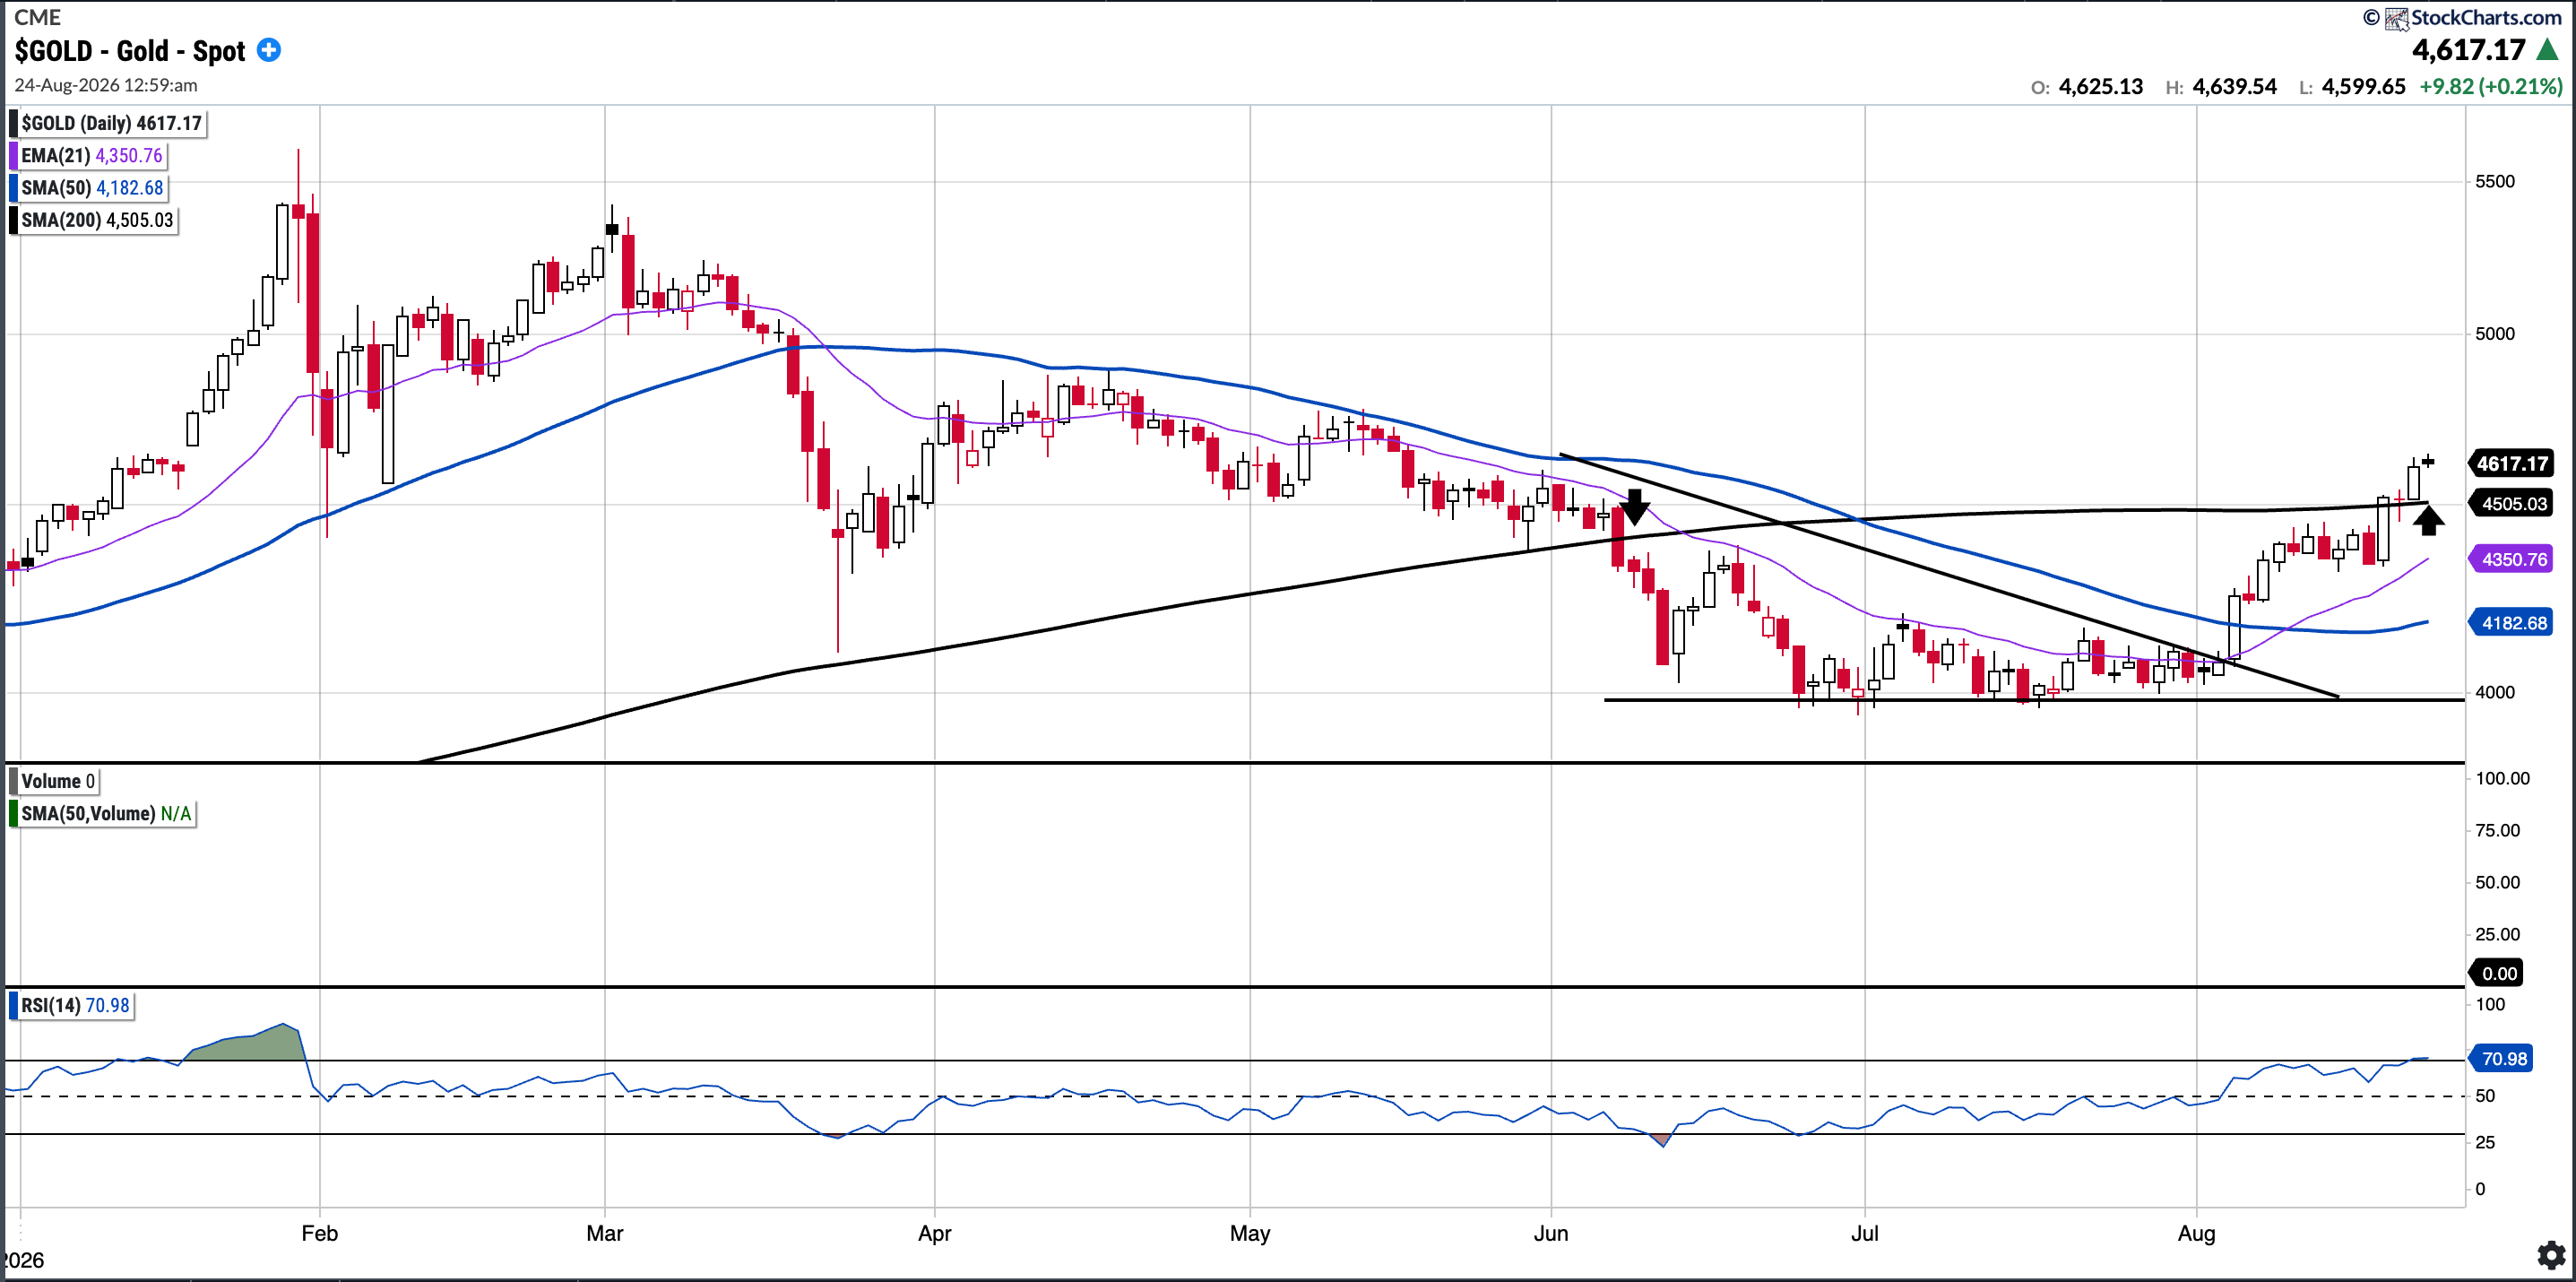
Currently trades at $4,604.49, 10.29% above the 50SMA and 2.28% above the 200SMA.
RSI 70.50
8.49% YTD
In early June, Gold lost its 200-day moving average for the first time since its bull run began in late 2023 which is notable and it had not been able to come close to reclaiming it. However, last week gold broke out of a falling wedge pattern and started to consistently trade above its 21-day moving average, which had previously acted as resistance. It has now reclaimed the 200 day moving average (see arrows)
Gold is a beneficiary of a weakening US Dollar after the U.S. Treasury announced plans to at least double its long-term debt buybacks. This was a significant catalyst for gold as the price pushed higher, clearing the 200-day SMA and closing comfortably above all key moving averages.
SOXX
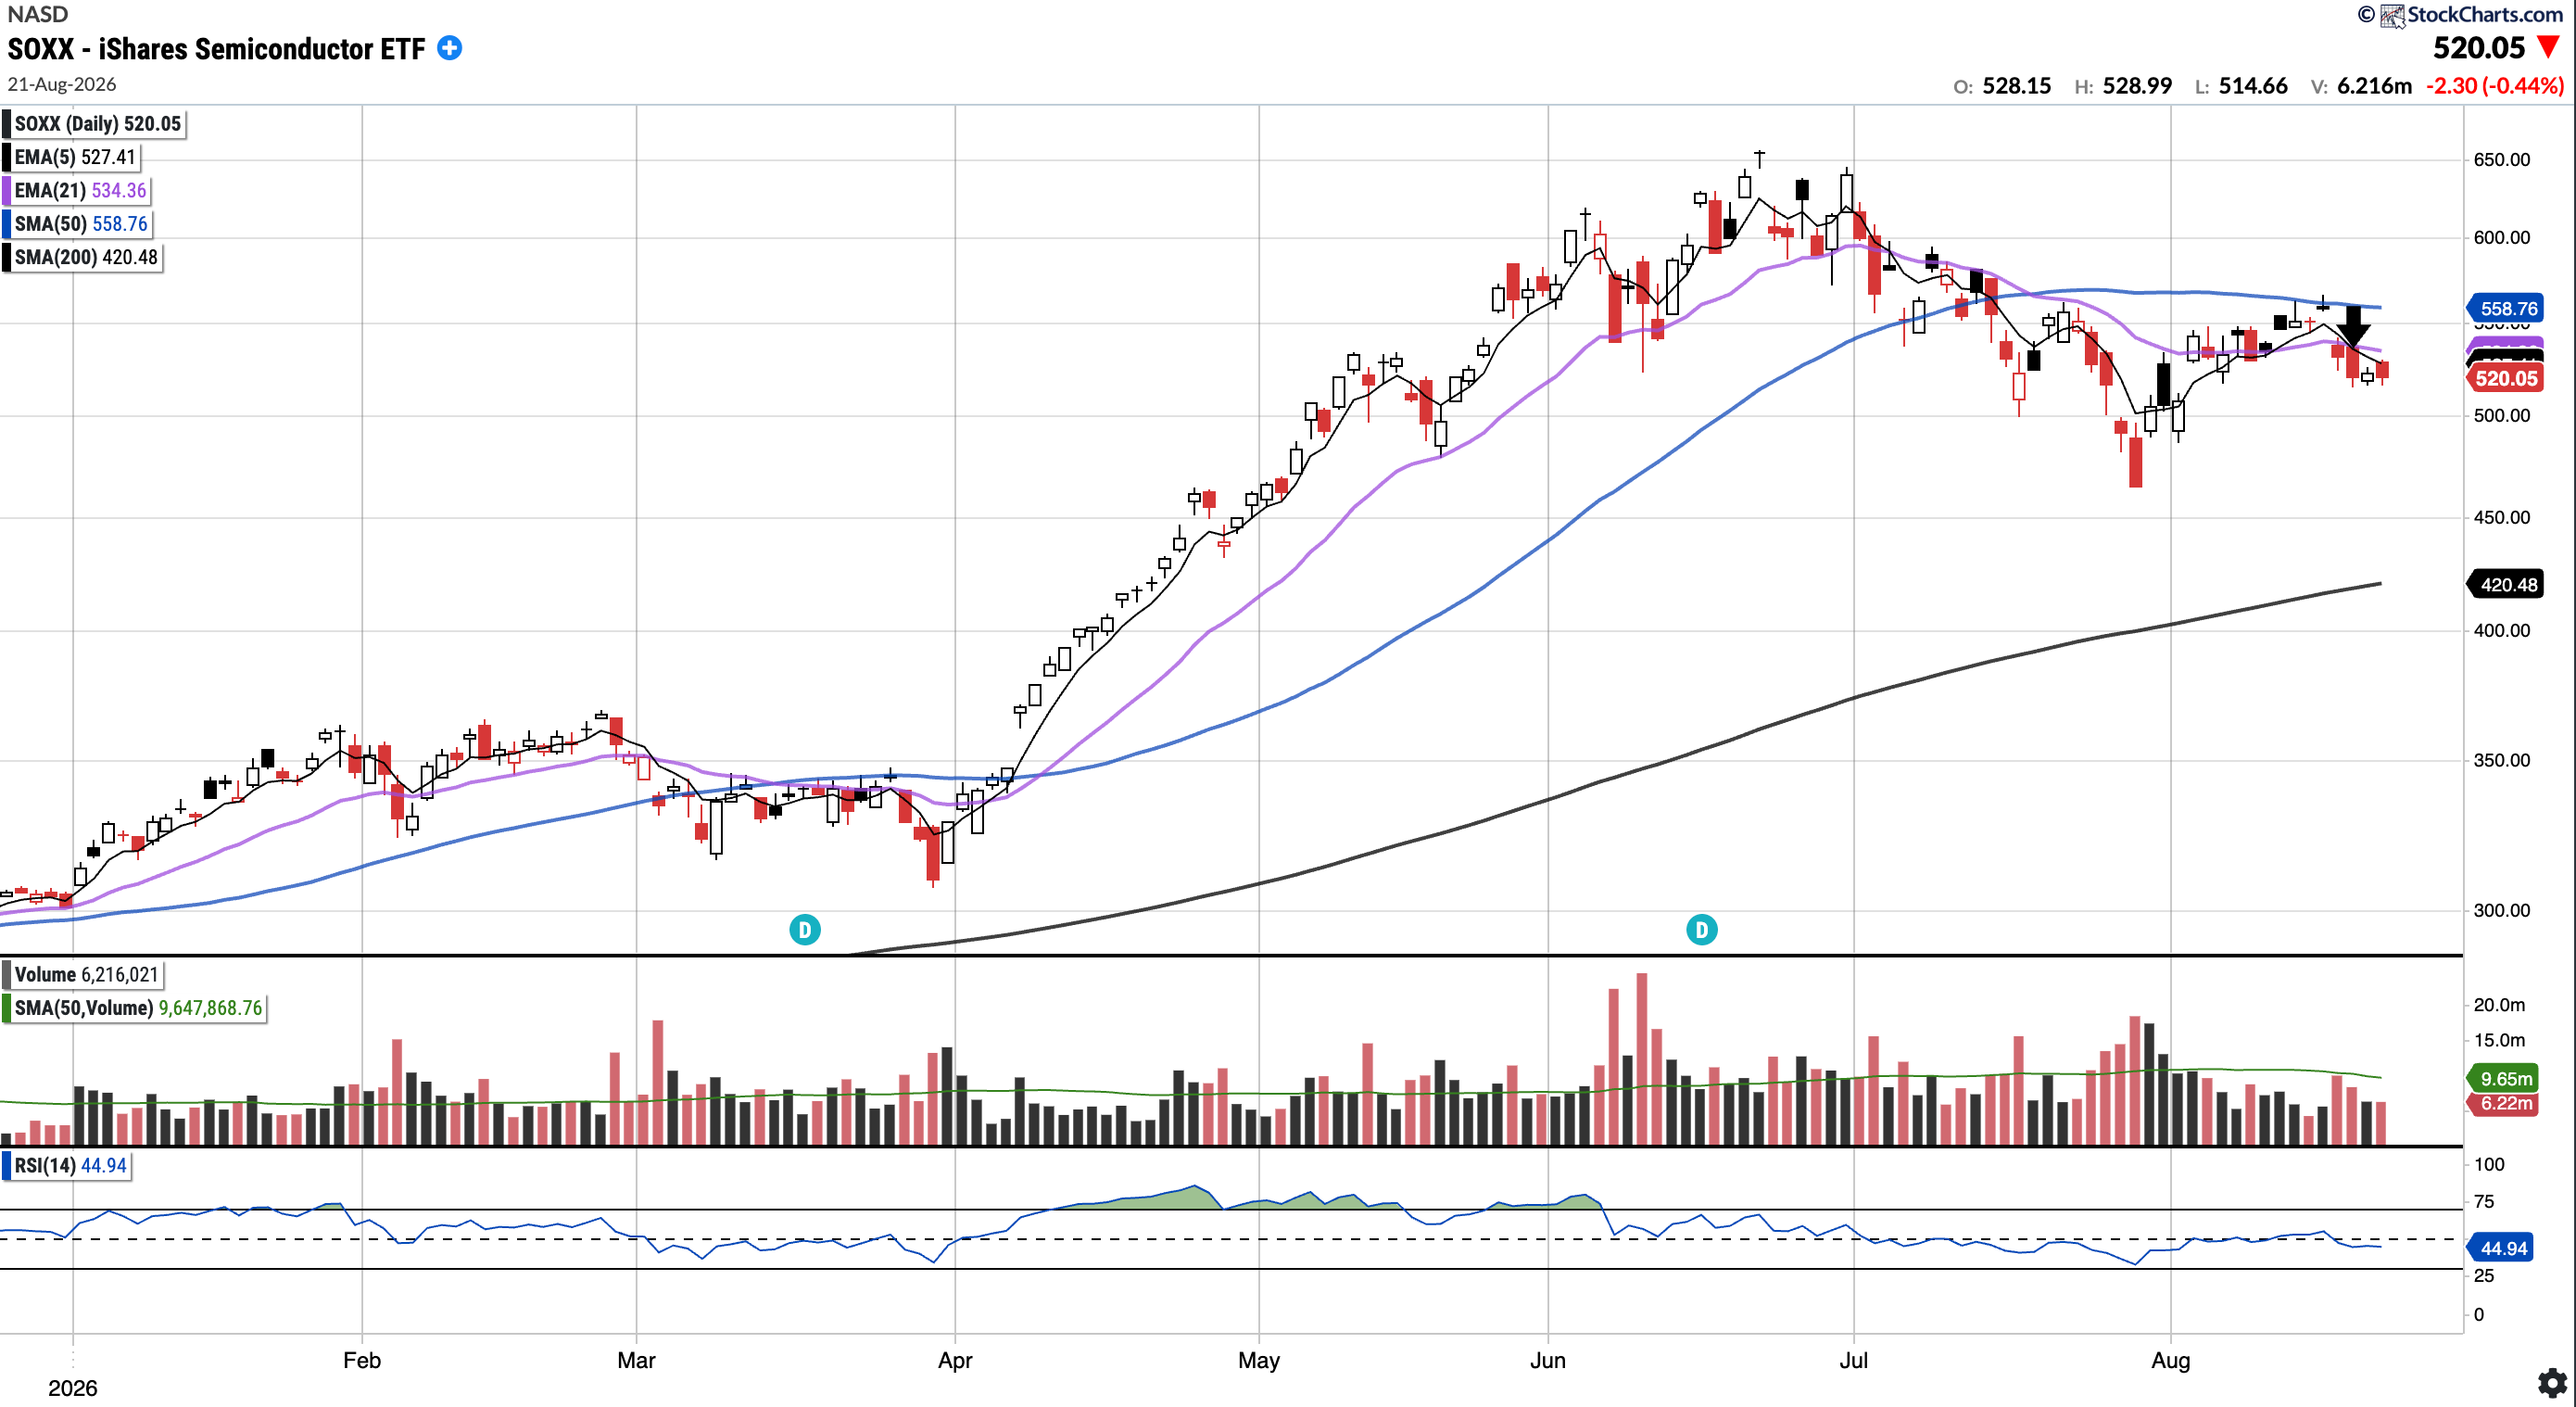
Currently trades at $520.05, 6.93% below the 50SMA and 23.68% above the 200SMA.
RSI 44.94
65.97% YTD
After printing a bullish 5/21 EMA cross on Tuesday, August 11, SOXX failed to hold that momentum as it was rejected at the overhead 50-day SMA. SOXX closed below both the 50-day SMA and 21-day EMA, printing a bearish 5/21 EMA cross on Wednesday, August 19 (see arrow). Bulls will want to see the overhead 50-day SMA (~558) reclaimed soon.
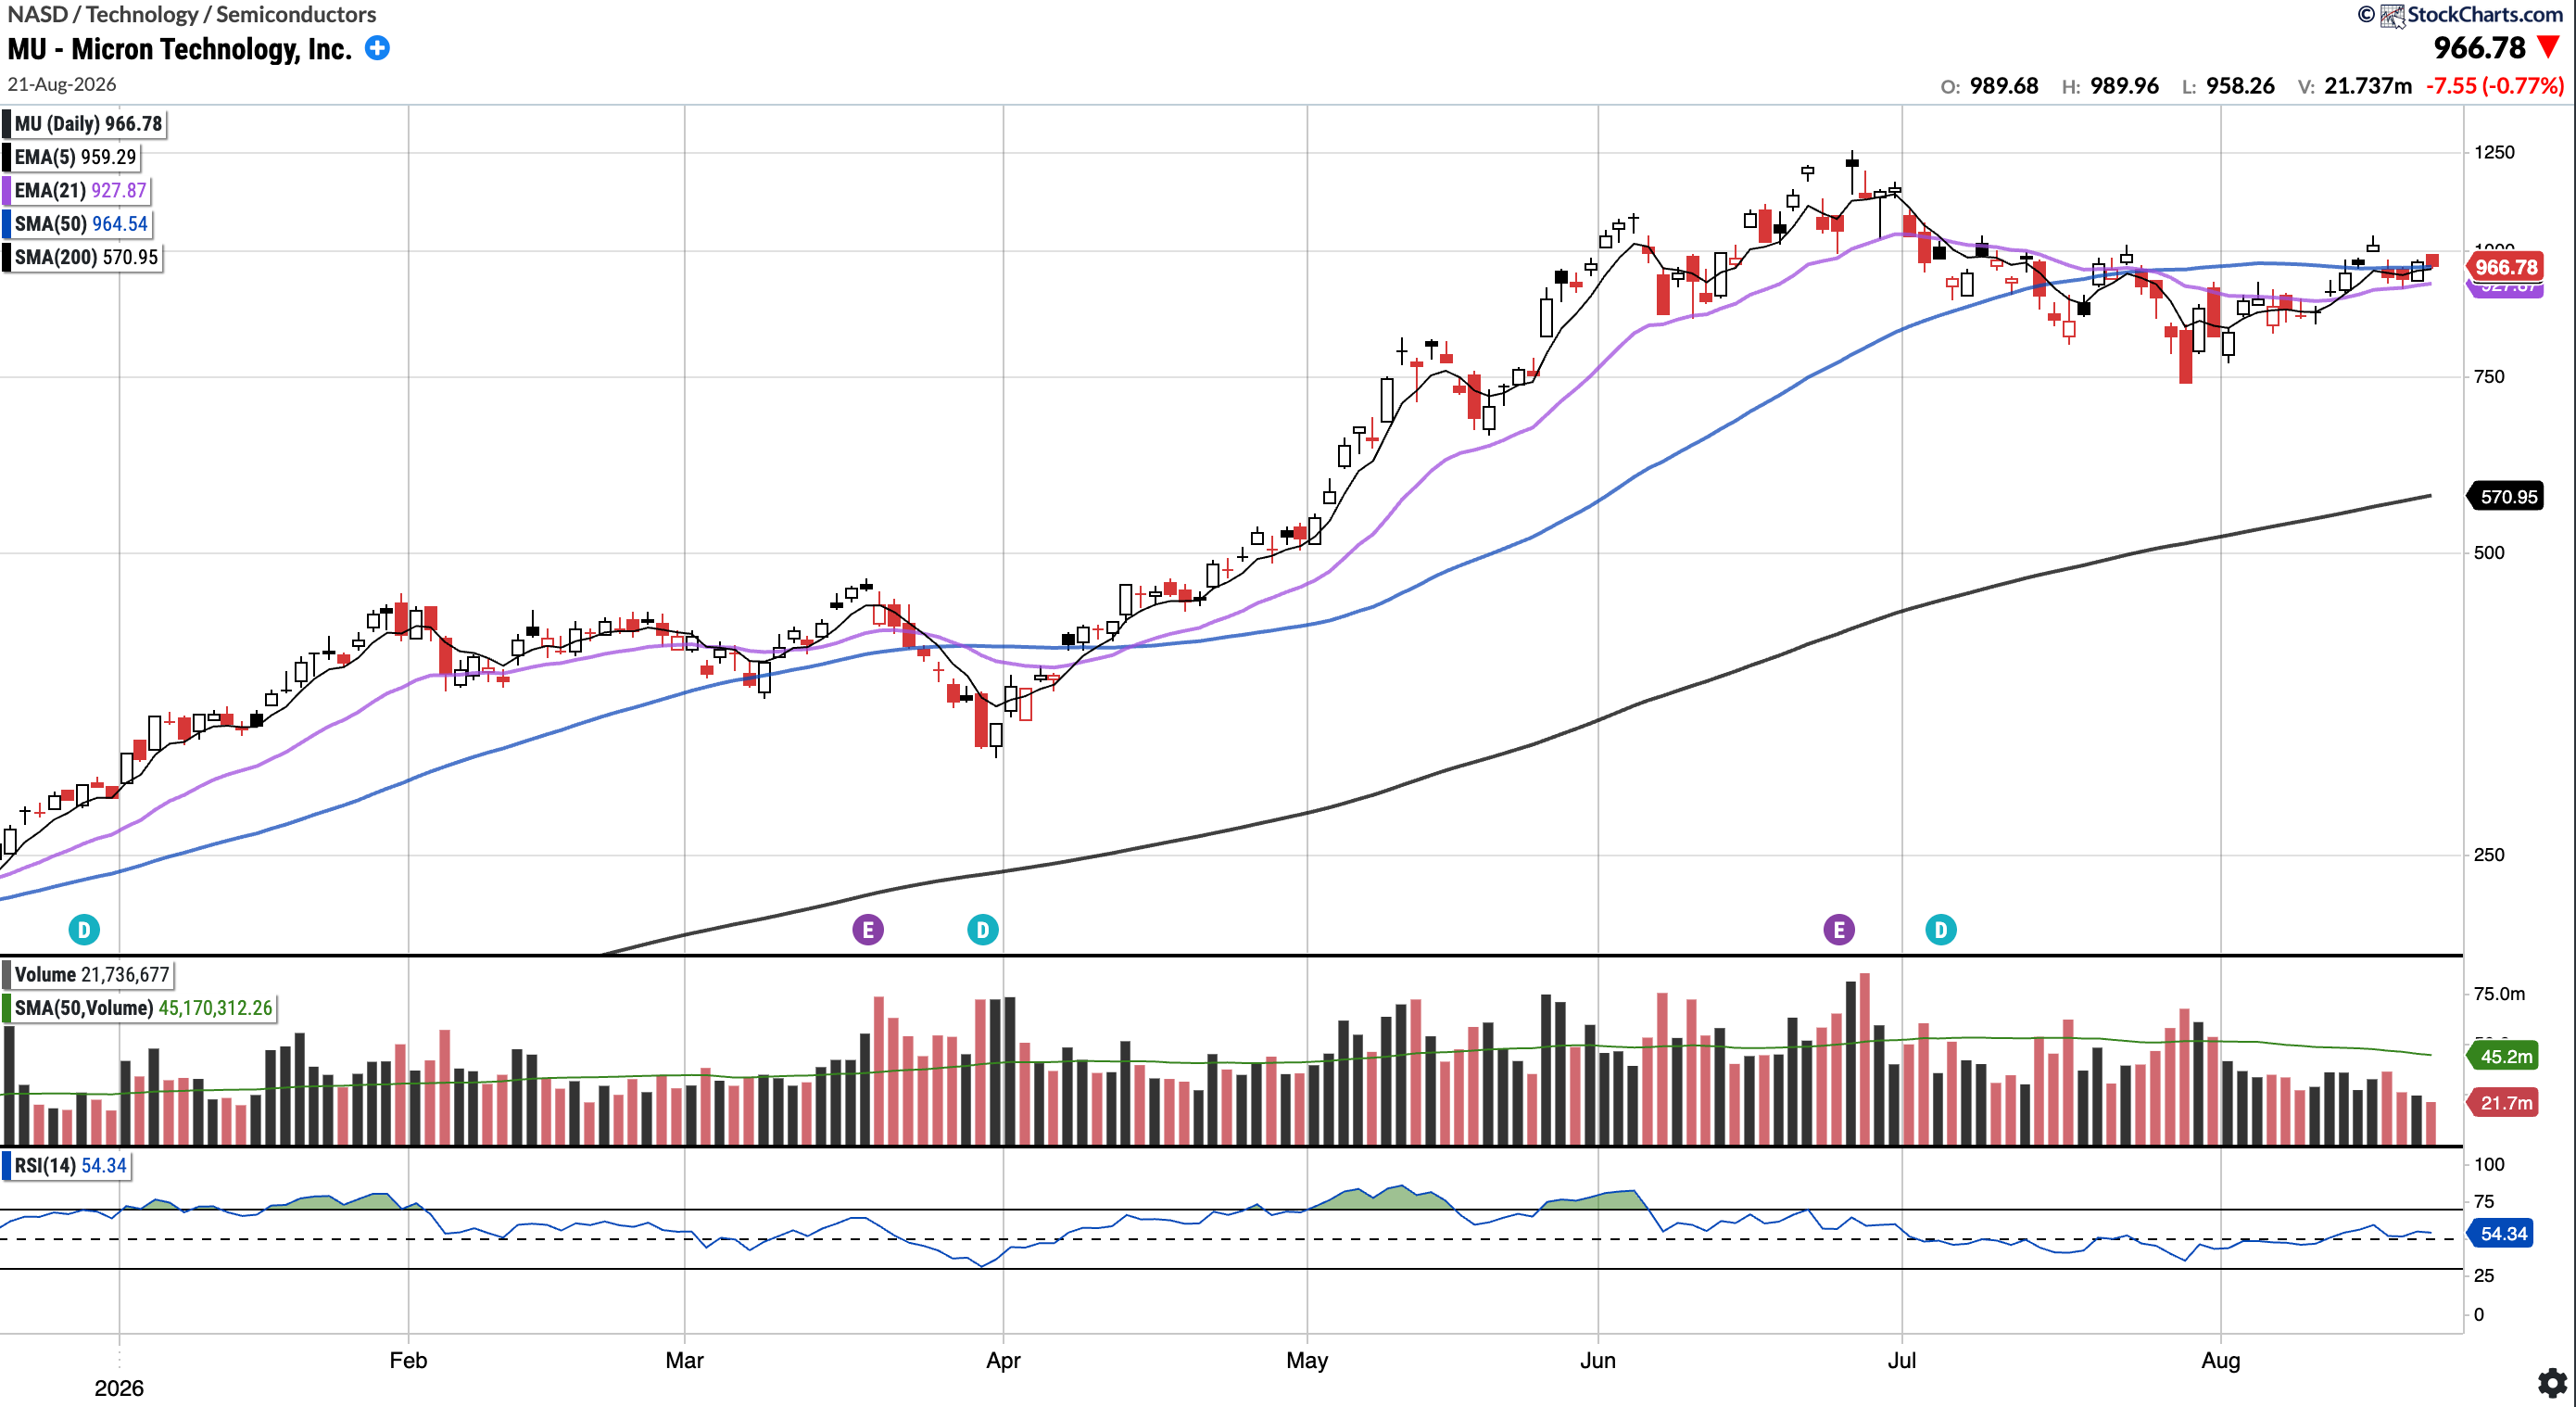
MU
Currently trades at $966.78, 0.18% above the 50SMA and 69.3% above the 200SMA.
RSI 54.34
206.7% YTD
MU traded down on the week, although it managed to close above the 50-day SMA. It held up relatively better than the broader semiconductor space, which is encouraging, but bulls will want to see more constructive price action, including a hold of the 50-day SMA at a minimum.
AMZN (Currently Long)
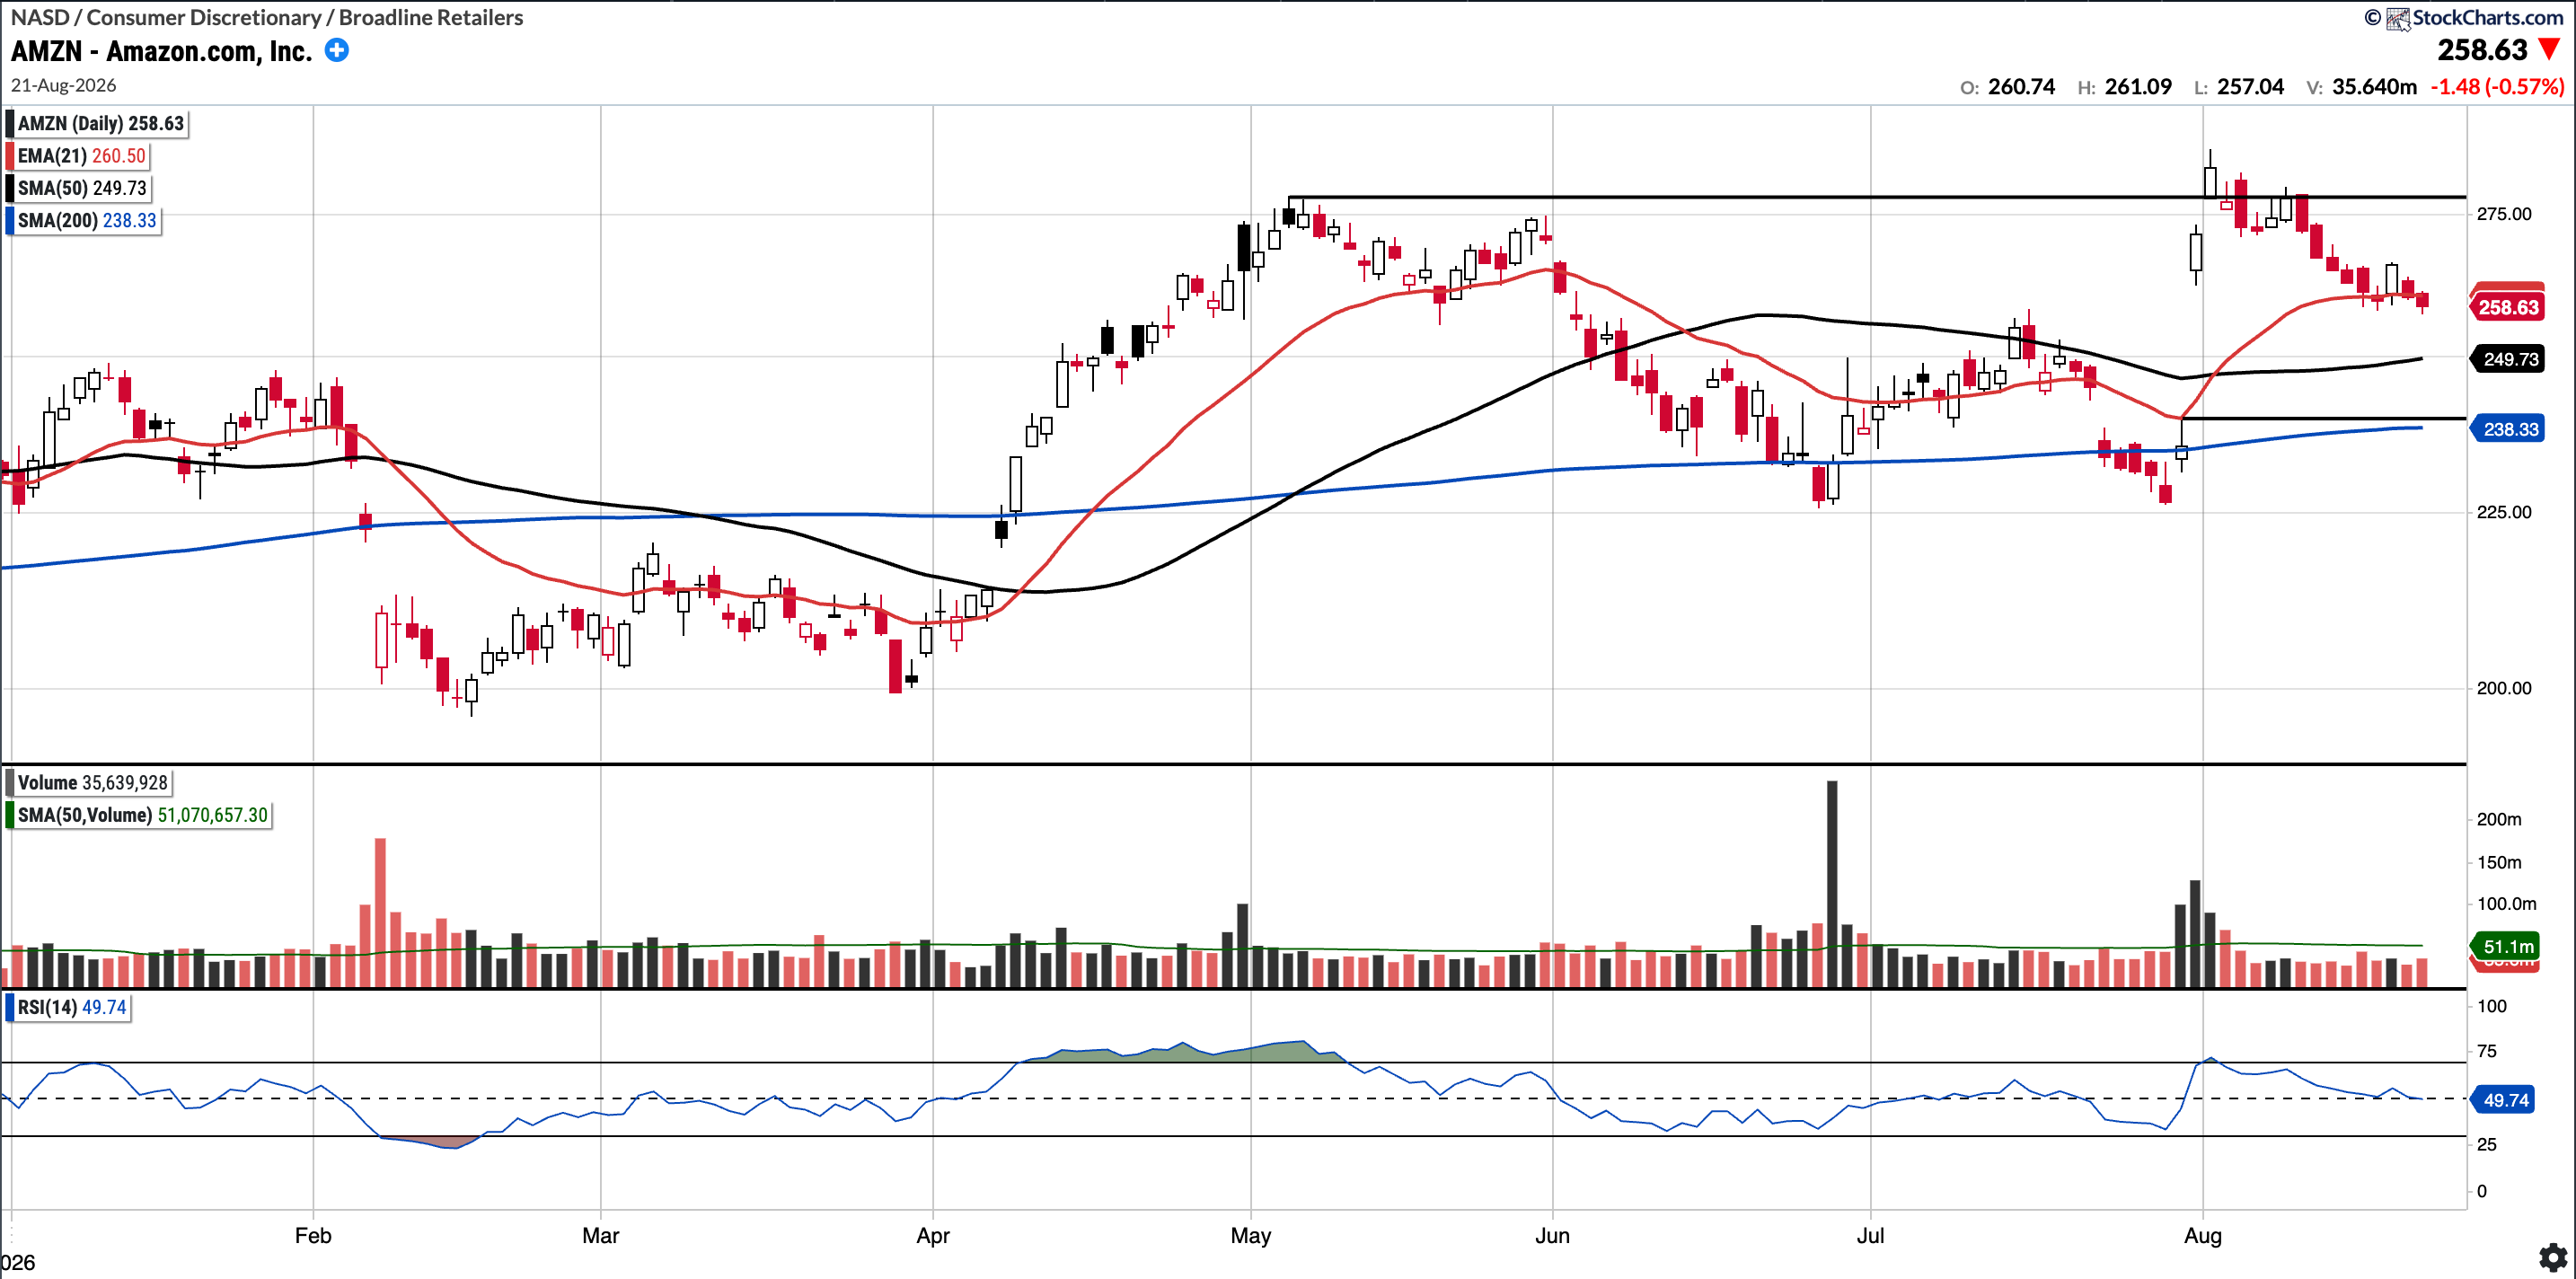
Currently trades at $258.63, 3.6% above the 50SMA and 8.5% above the 200SMA.
RSI 49.74
14.2% YTD
Last week I had written:
The 21-day EMA is near, and bulls will want to see it hold as support before the stock rallies back toward its highs. If it fails to hold, a gap fill to pre-earnings levels is not out of the question.
Amazon did continue to sell of this week and we lost the 21 EMA, so a gap fill to pre-earnings levels looks increasingly possible. The next level to hold is the SMA 50 at 249.73.
COIN (Currently Long)
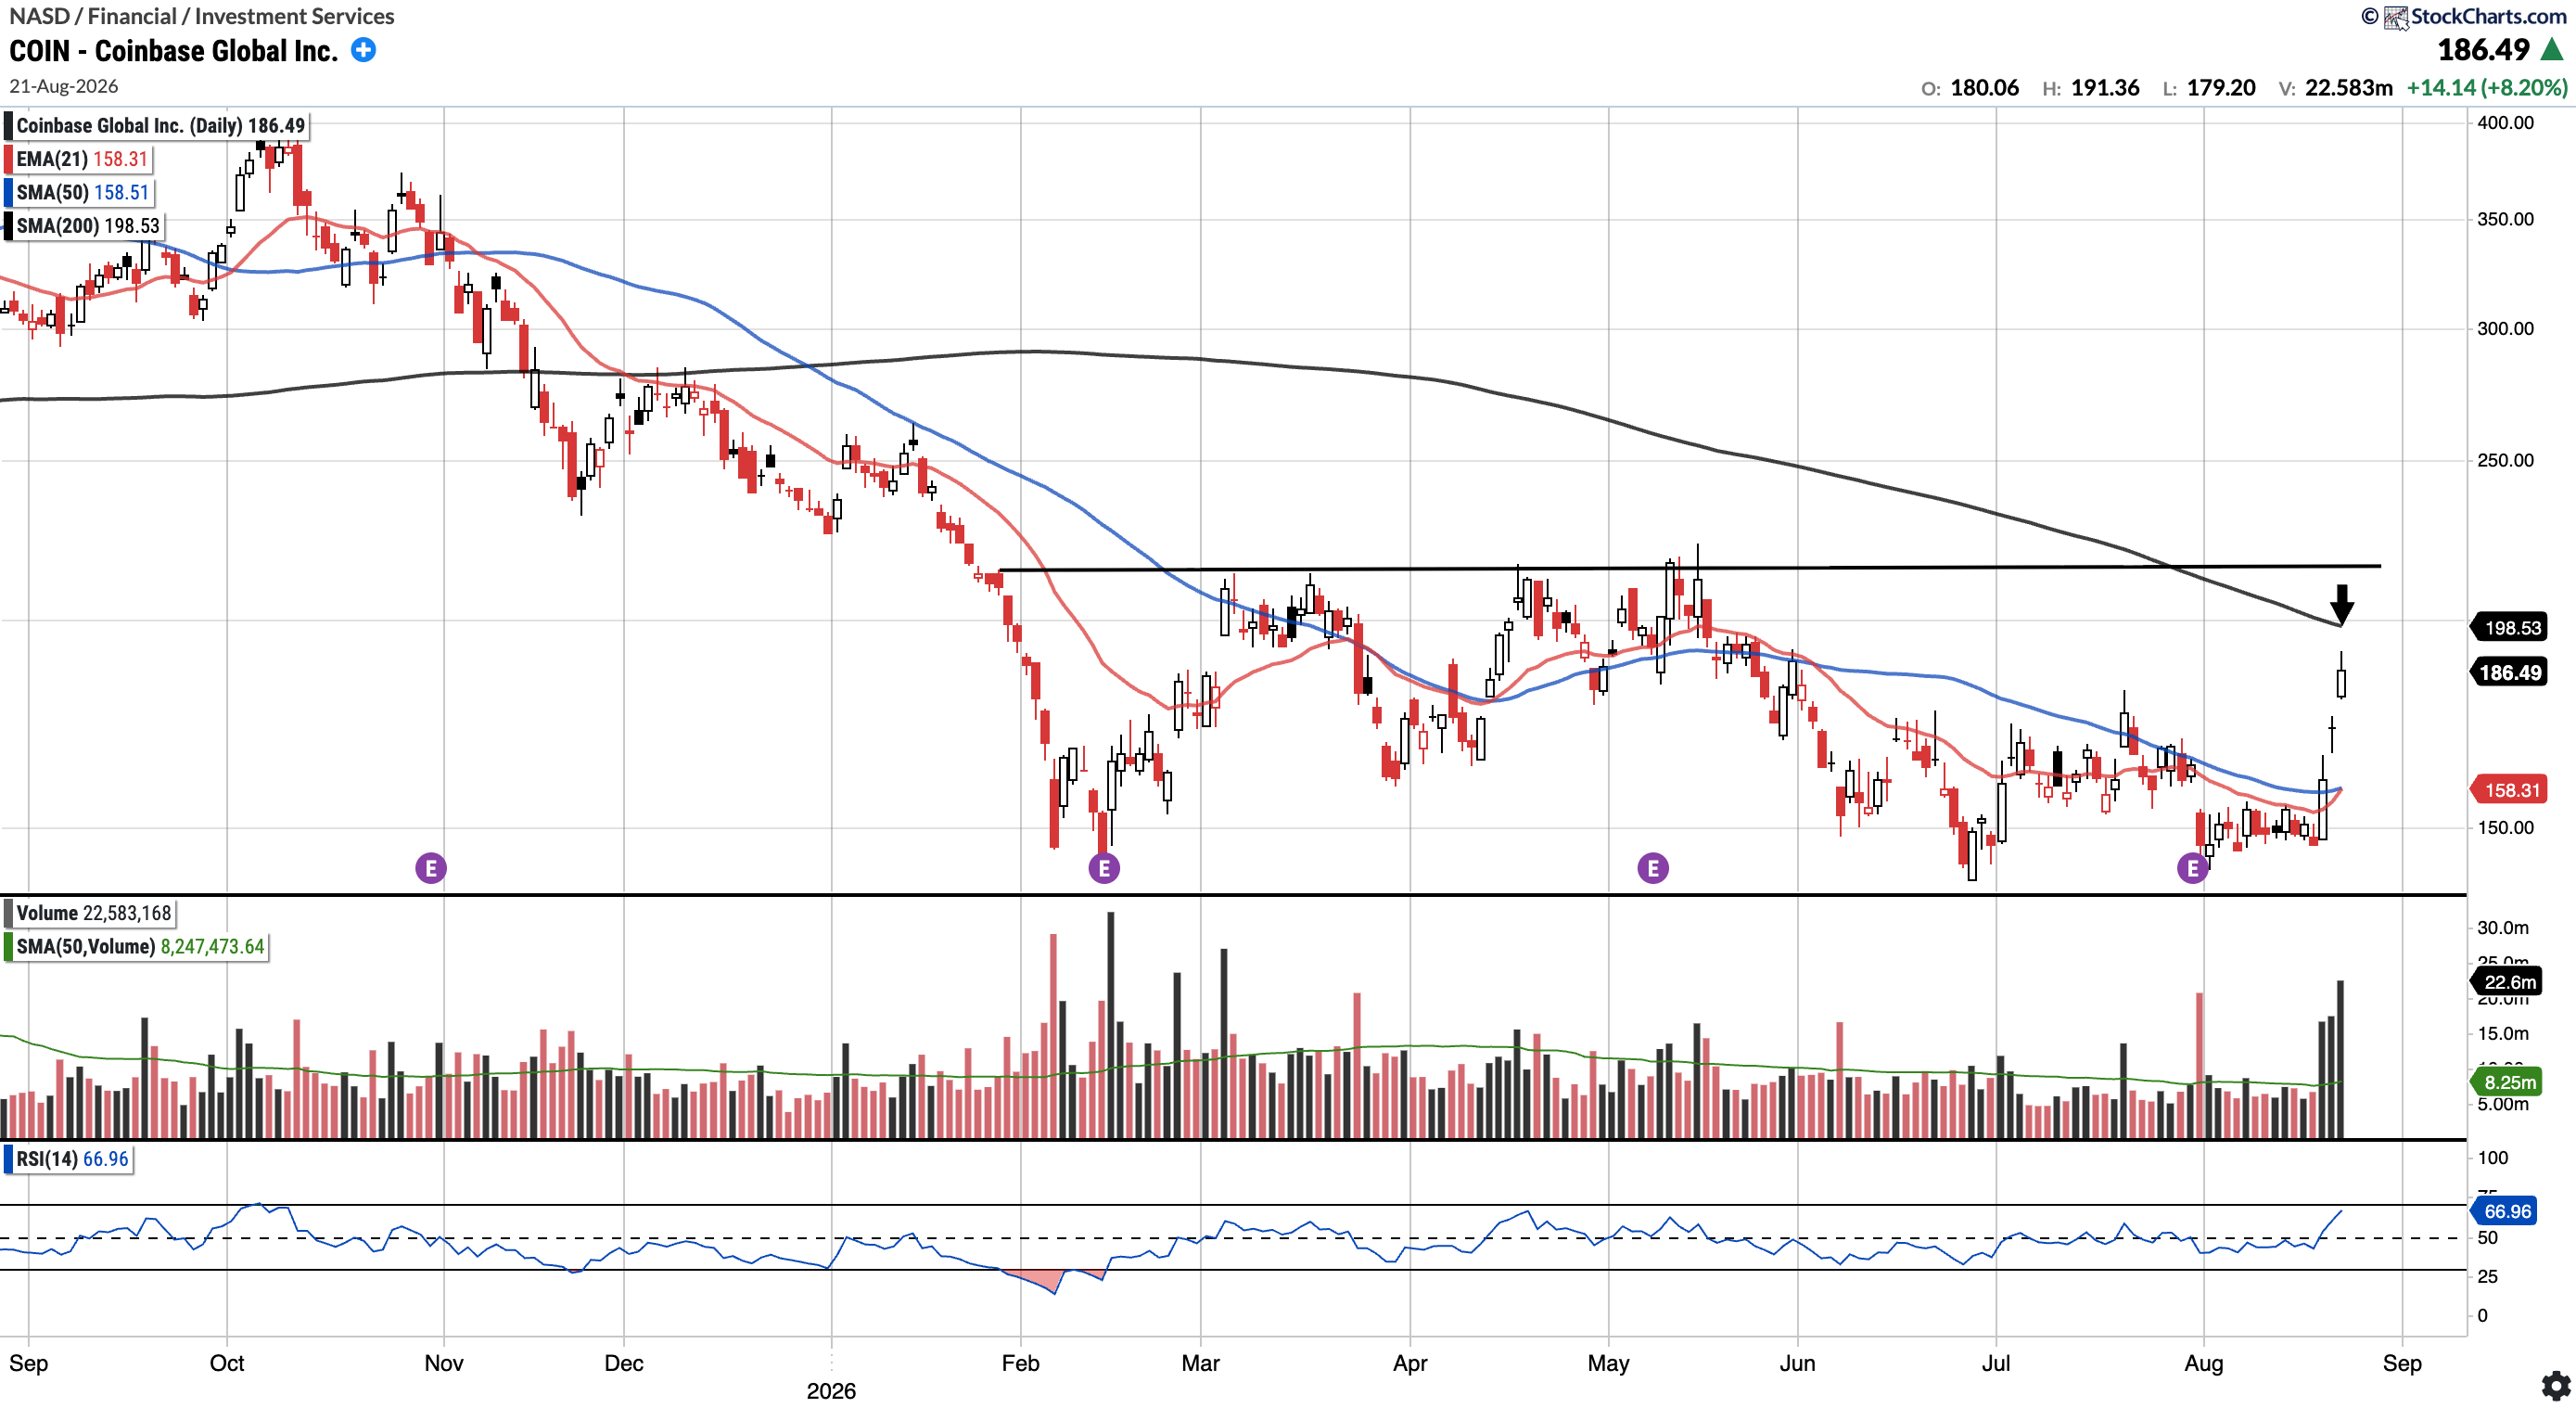
Currently trades at $186.49, 17.65% above the 50SMA and 6.06% below the 200SMA.
RSI 66.96
-21.16% YTD
COIN had a big move up this week on significant volume. The overhead, descending 200-day SMA is likely to act as resistance (see arrows). Once surpassed, there is a horizontal level of interest at 214–215. I believe both of these are in play if the near-term bounce in crypto holds.
XBI
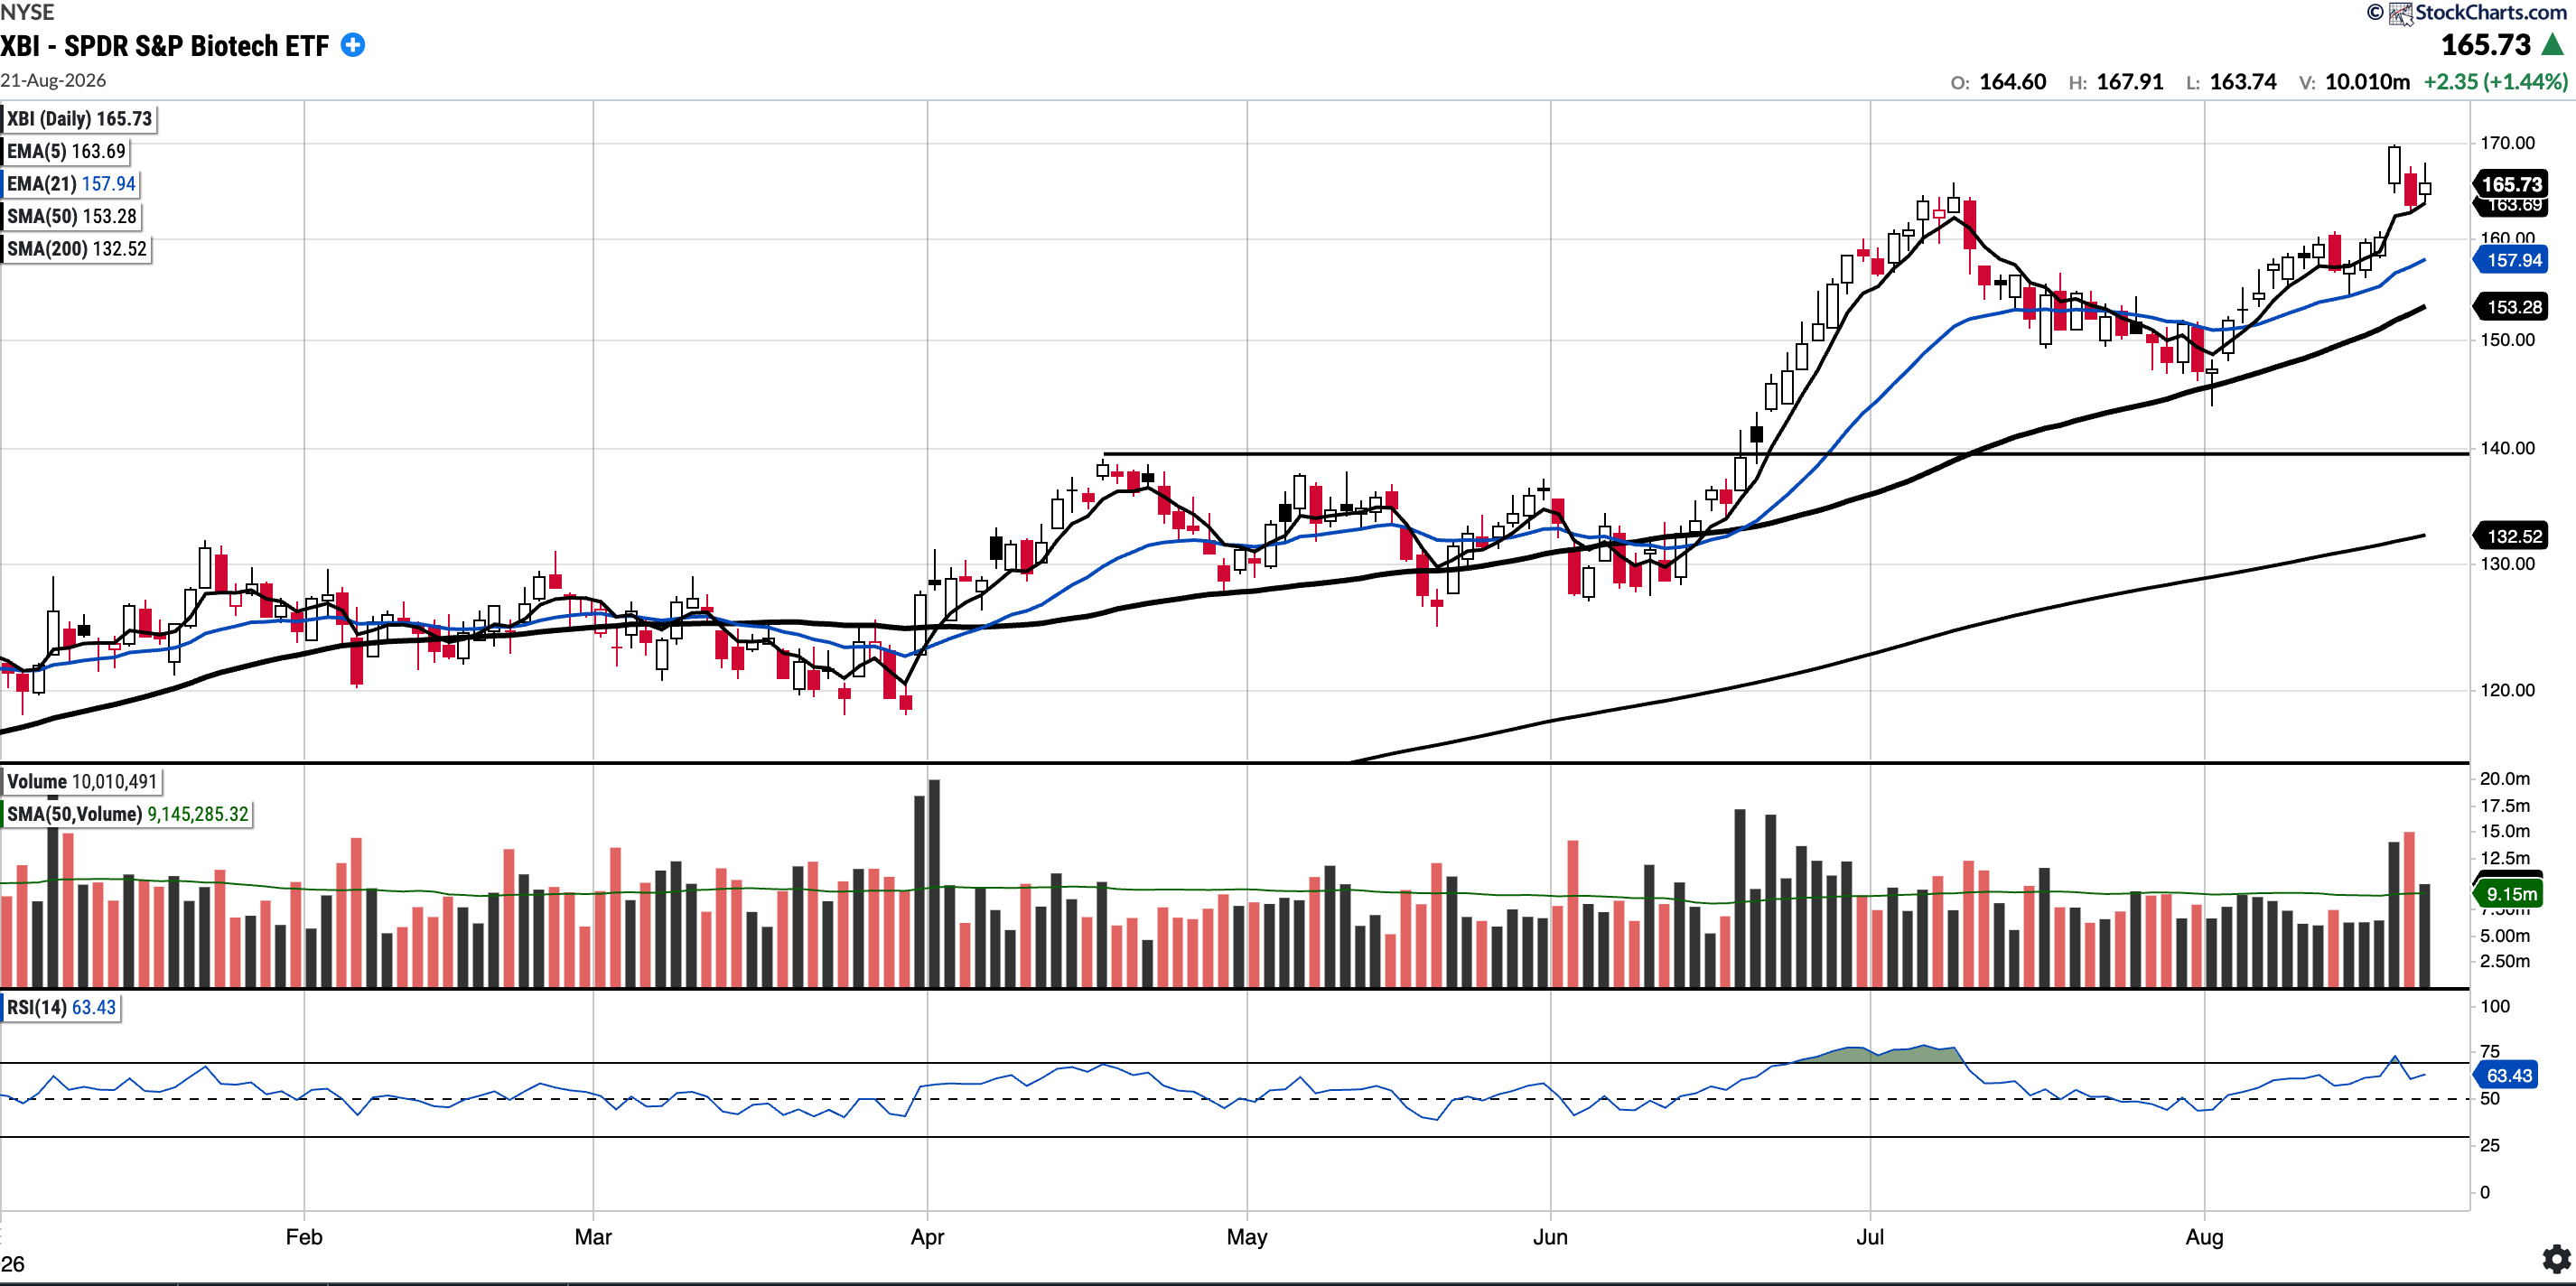
Currently trades at $165.73, 8.12% above the 50SMA and 25.06% above the 200SMA.
RSI 63.43
36.38% YTD
The XBI (S&P Biotech ETF) reached an all-time record closing high of $169.68 on August 19, 2026, driven by a massive sector rally following positive Phase 3 mRNA cancer vaccine trial results.
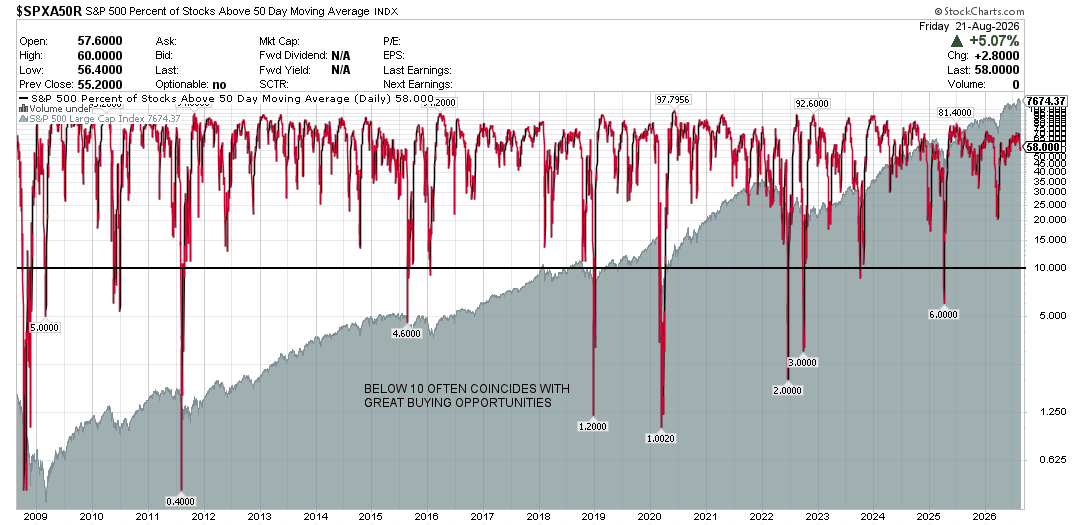
S&P 500 Percentage of Stocks Above the 50 Day Moving Average: Currently 58%
Breadth decreased significantly this week, with the percentage of stocks above the 50-day moving average now at 58.0%.
Notable portfolio changes in previous week (all updated live in subscriber channels):
