
Preview of the Week Ahead: W/C July 6, 2026
Major indices advance while semiconductors and AI stocks sell off. Is this rotation fleeting, or something more?

Hope you all are having a good weekend. Below, we will be previewing the upcoming week’s events and providing a portfolio update as usual.
Format for what is covered in this weekly preview:
A Look at the Indices
Key Upcoming Economic Events
Upcoming Earnings Reports
Charts
Notable Portfolio Changes from the Previous Week
Current Portfolio Holdings
Position size, cost basis, and commentary on each holding regarding the intended holding period and any planned activity
Closing Thoughts
I recommend checking out the most recent Monthly Portfolio and Performance Update below:

Also, ensure to check out the post below regarding upcoming pricing changes plus feedback from our readers:

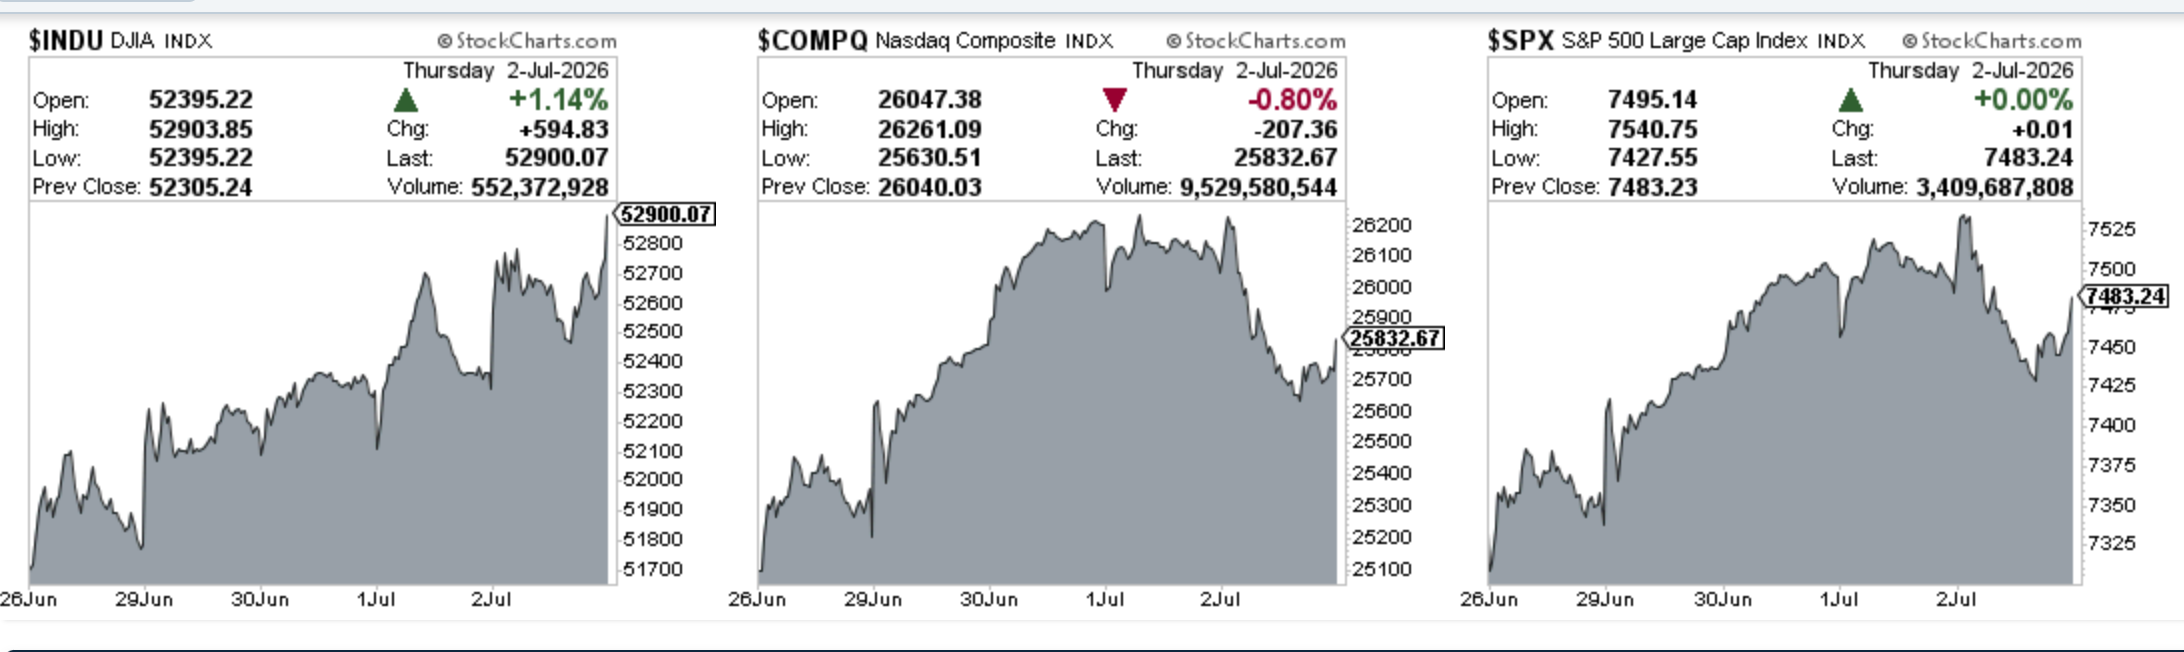
Indices
Dow Jones advanced 2.31% in the last week
S&P 500 advanced 2.46% in the last week
Nasdaq Composite advanced 3.13% in the last week
IWM advanced 0.48% in the last week
Key upcoming economic events
Monday, July 6
ISM Non-Manufacturing (Services) PMI
S&P Global Composite and Services PMI
Fed Governor Christopher Waller Speaks
Tuesday, July 7
U.S. Trade Balance (May)
Wednesday, July 8
FOMC Meeting Minutes: Markets will be looking for clues regarding the Federal Reserve’s stance on monetary policy following their June meeting.
Wholesale Inventories (May)
Consumer Credit (May)
Thursday, July 9
Existing Home Sales (June)
Initial & Continued Jobless Claim
Friday, July 10
No major economic data releases are scheduled for this day.
Upcoming Earnings
Below is the infographic by Earnings Whispers highlighting the schedule for this week:

Charts
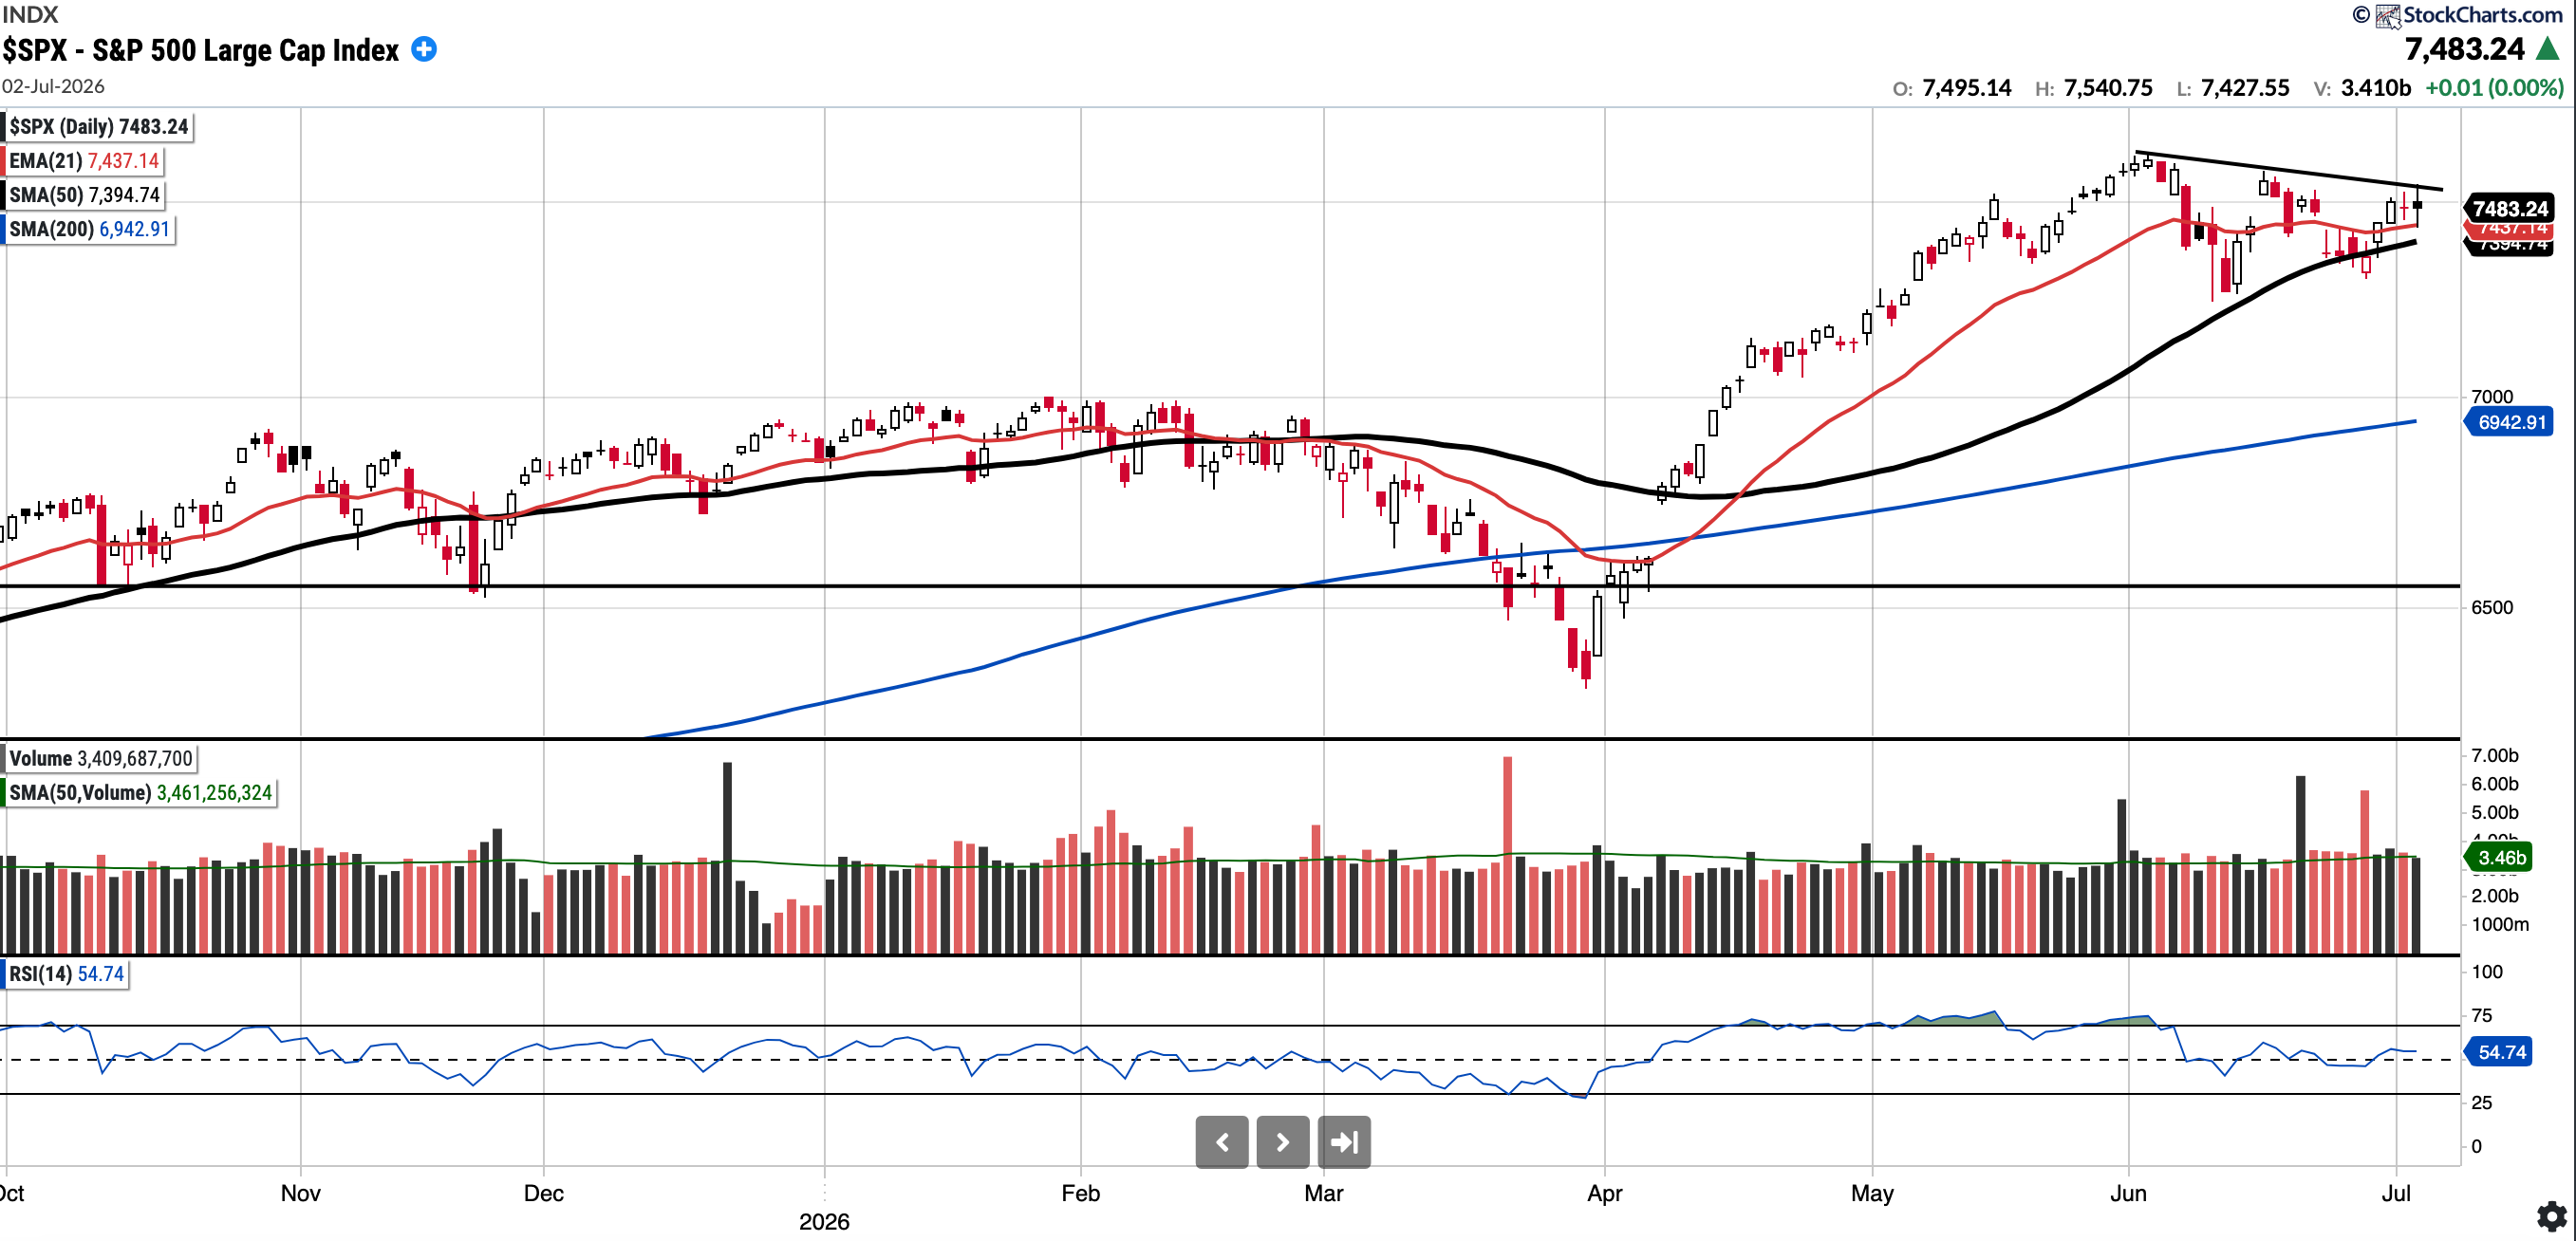
SPX
Currently trades at 7483.24.02, 1.20% above the 50SMA and 7.78% above the 200SMA.
RSI 54.74
9.11% YTD
Distribution days in the last week: 0
The S&P 500 traded up this week on improved breadth and reclaimed both the EMA 21 and SMA 50.
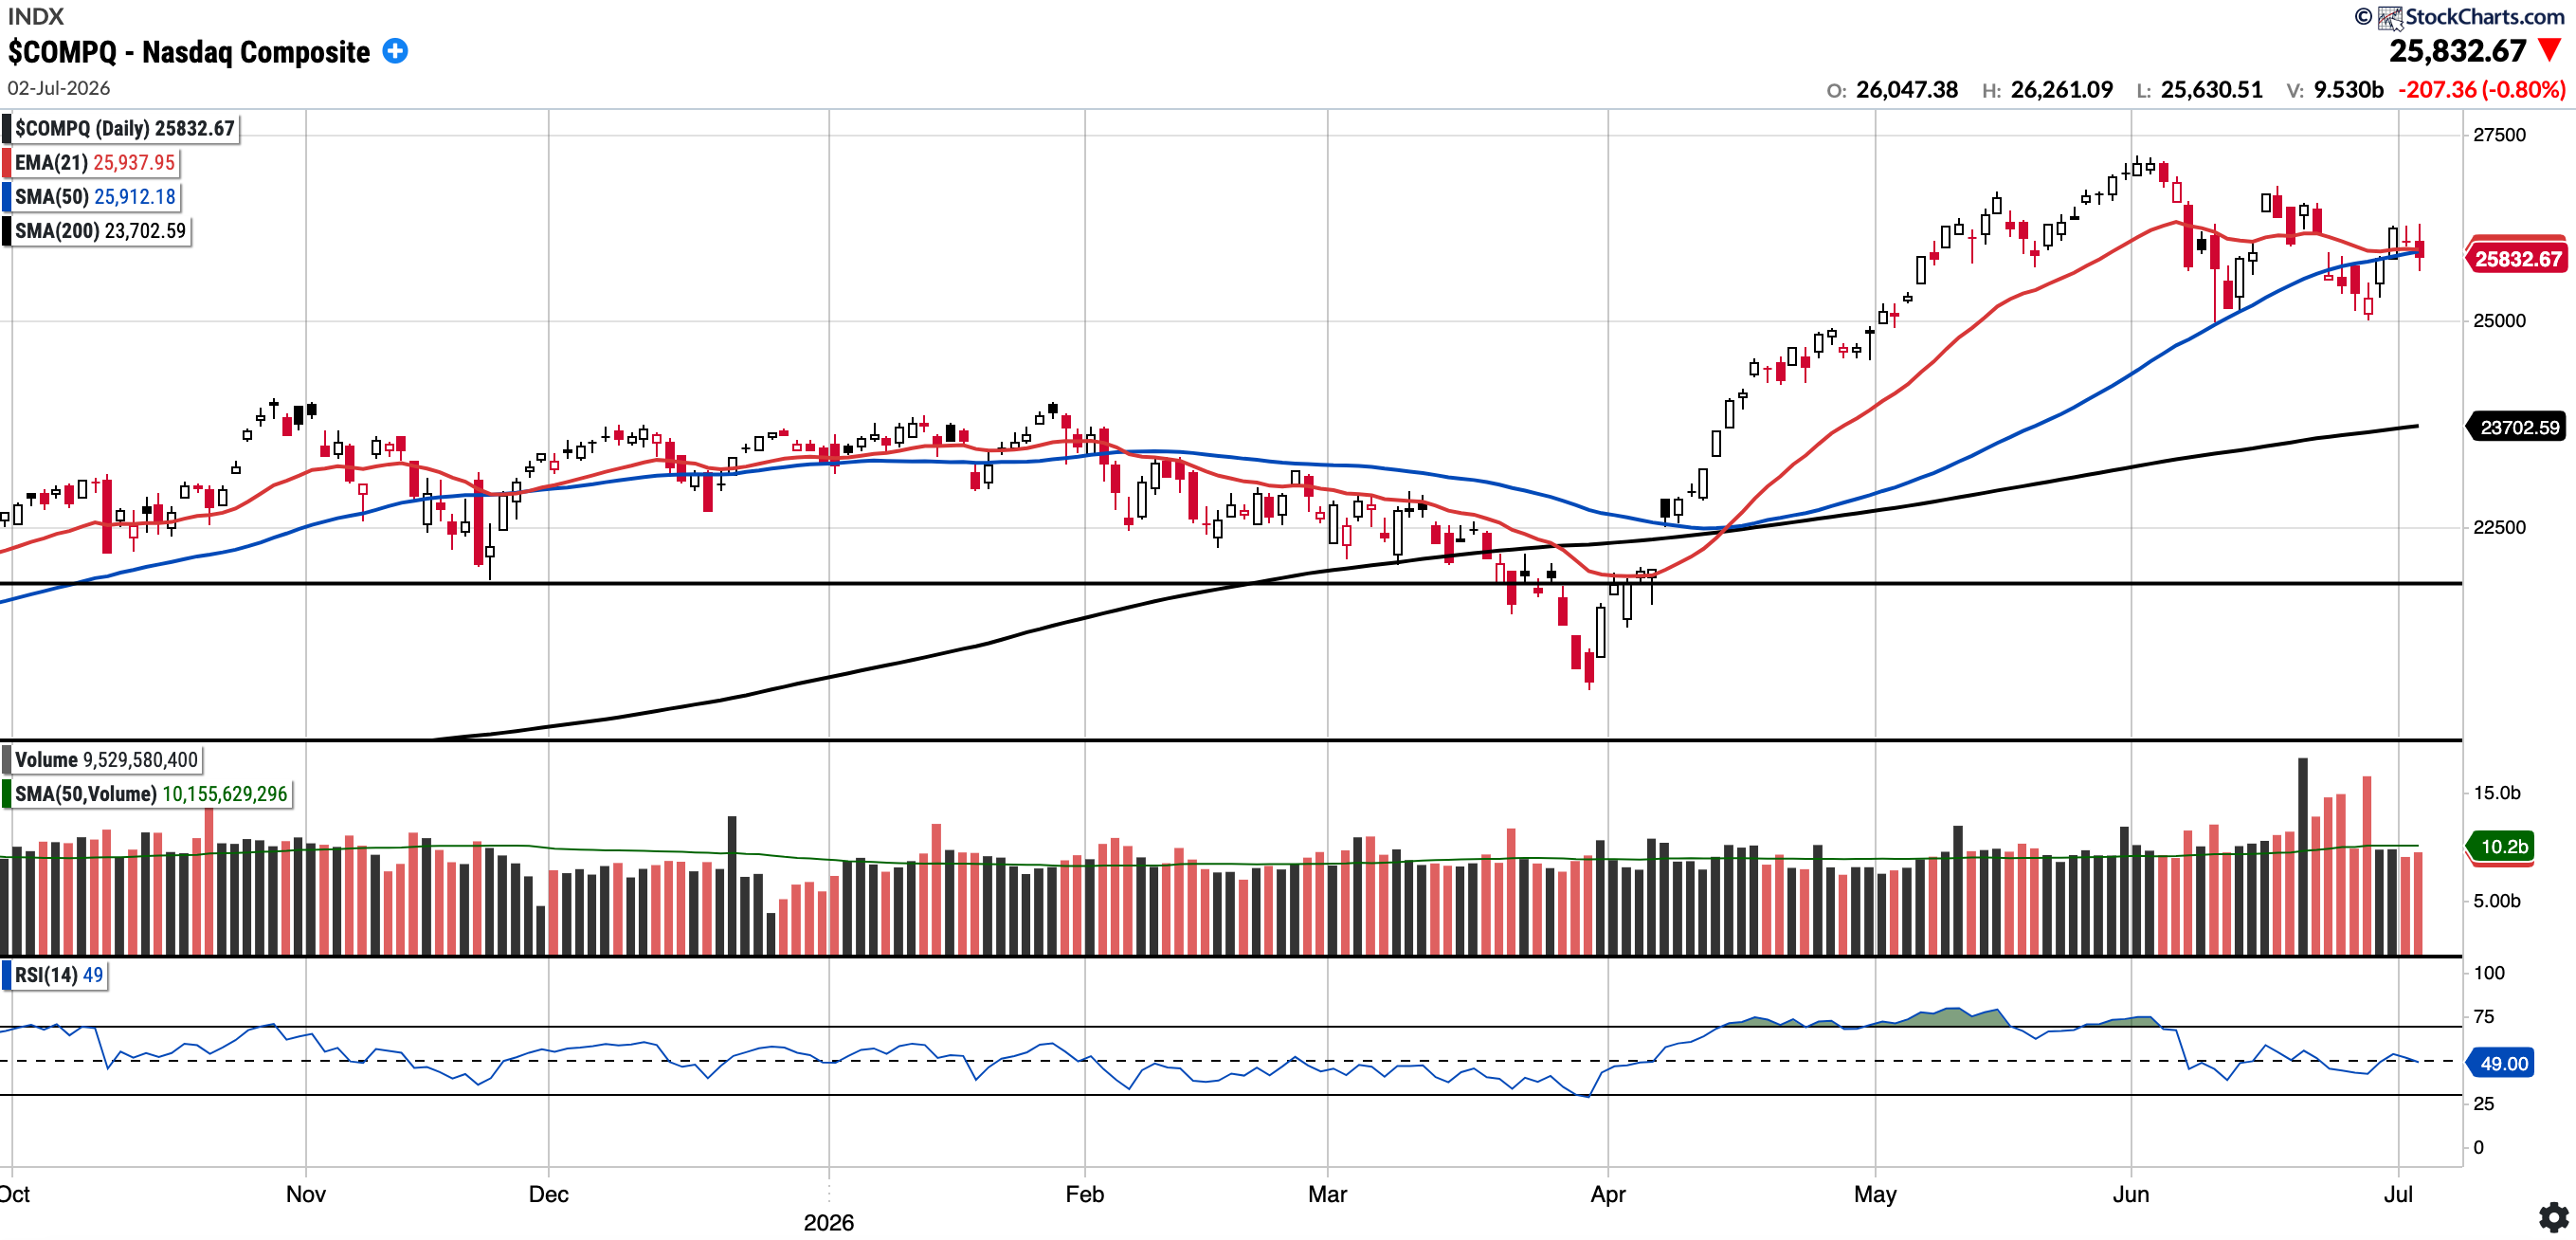
COMPQ
Currently trades at 25,832.67, 0.31% below the 50SMA and 8.99% above the 200SMA.
RSI 49.0
11.18% YTD
Distribution days in the last week: 0
The Nasdaq Composite closed below the 21-day EMA and the 50 SMA for the second consecutive week.
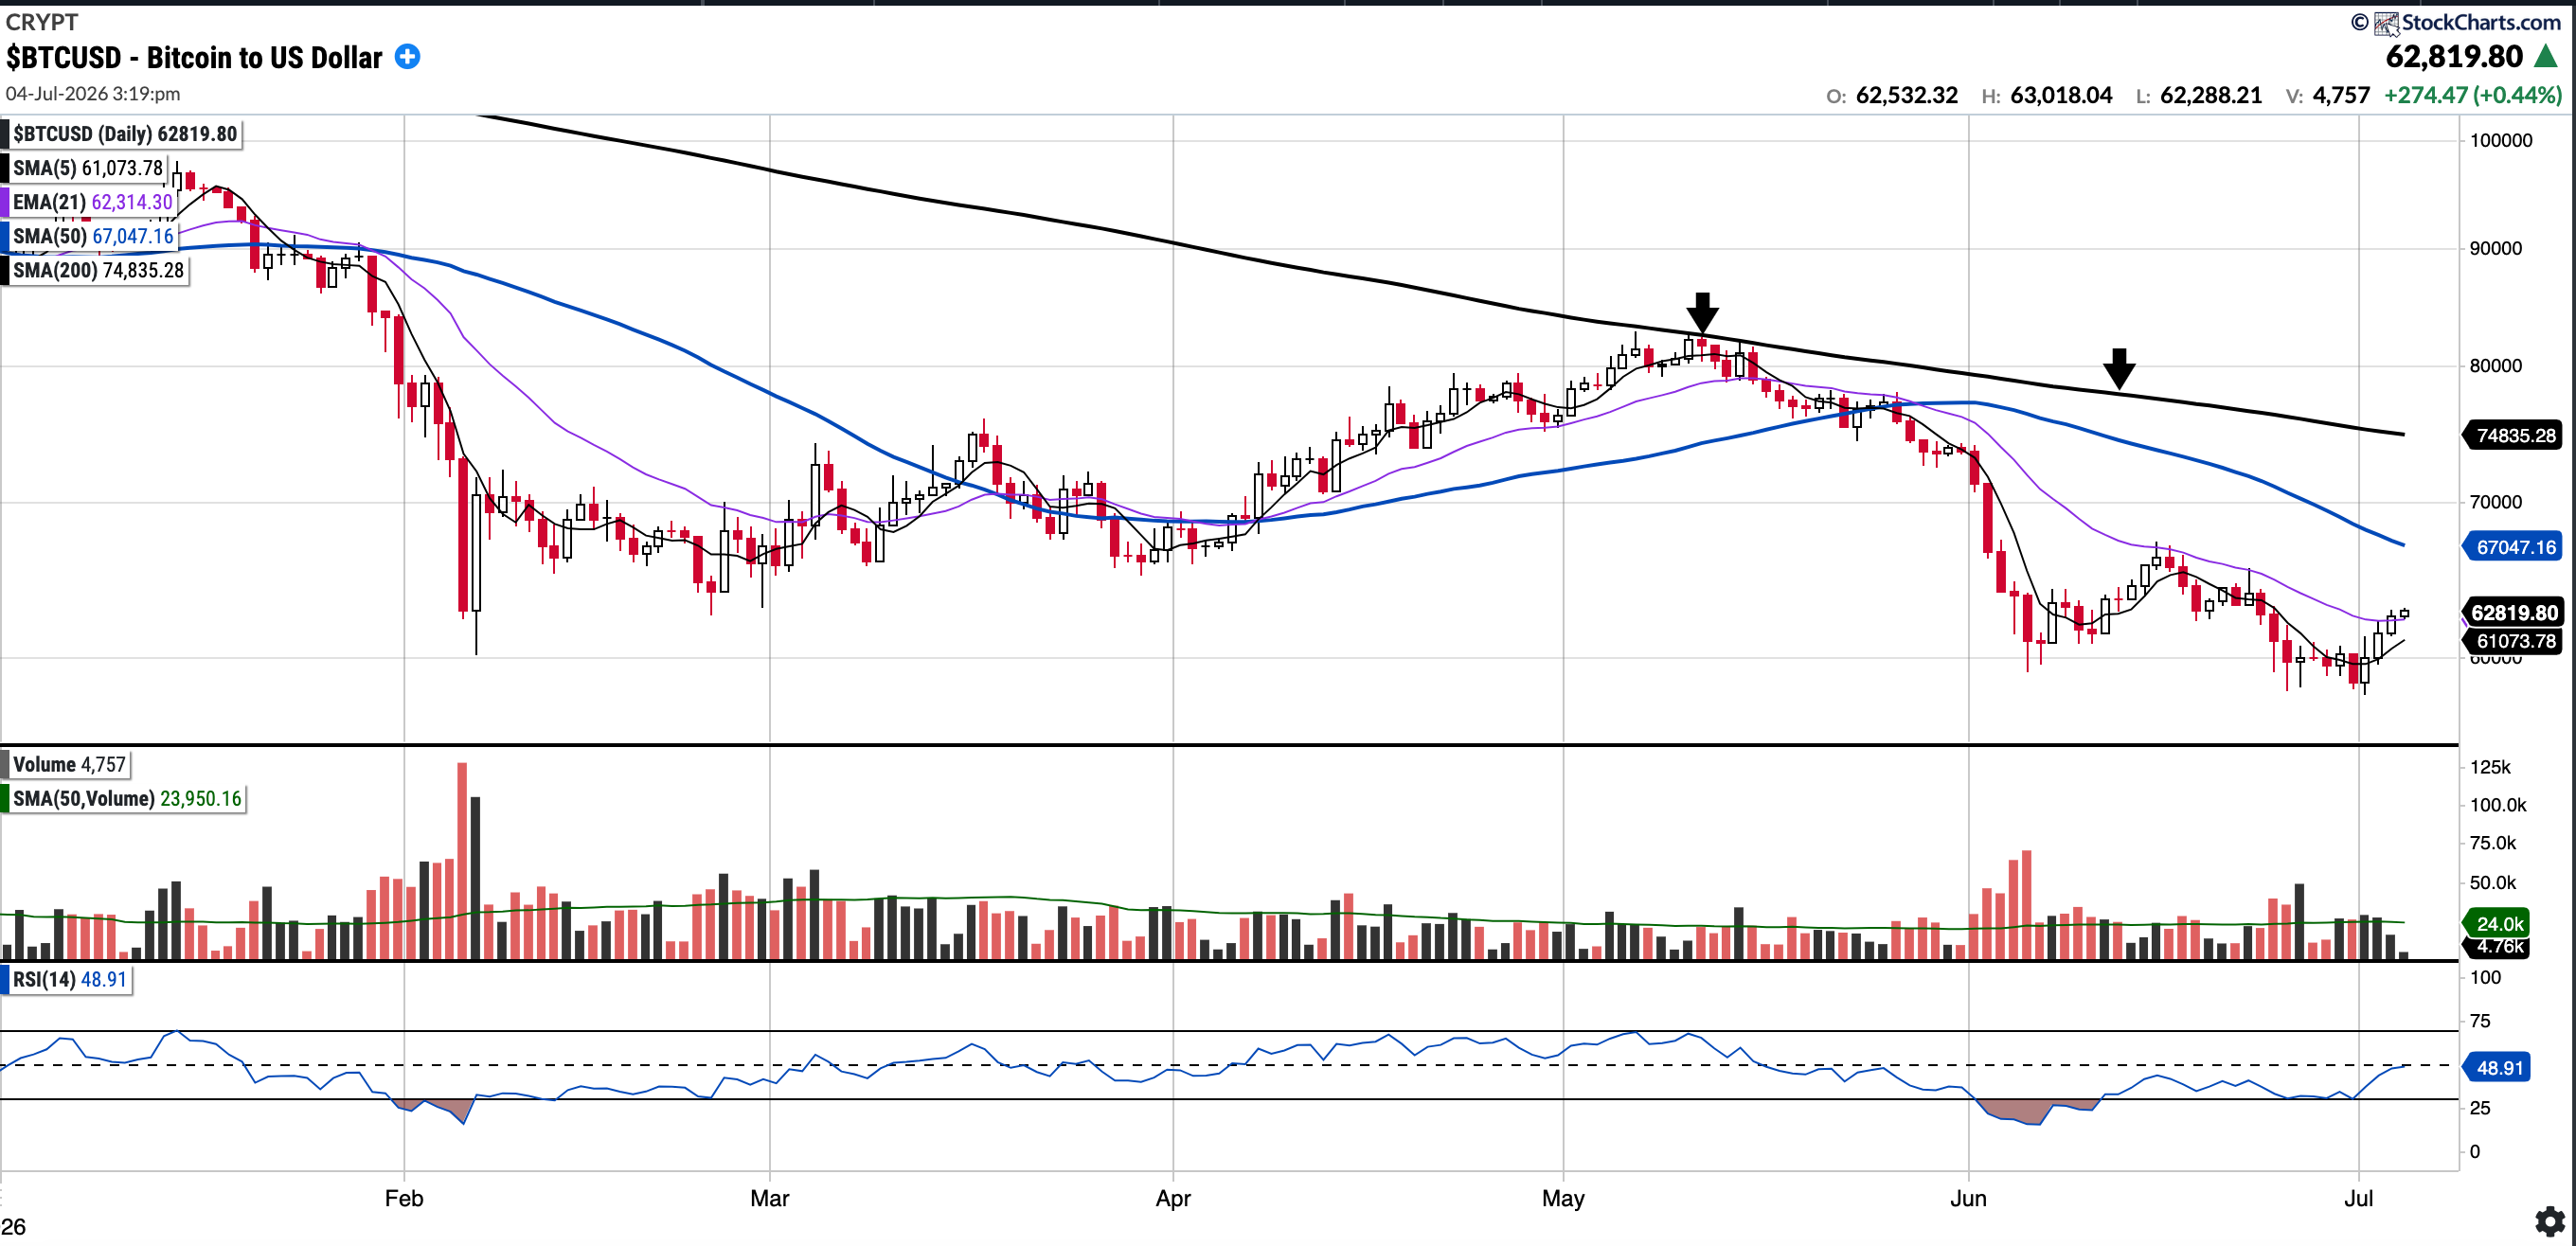
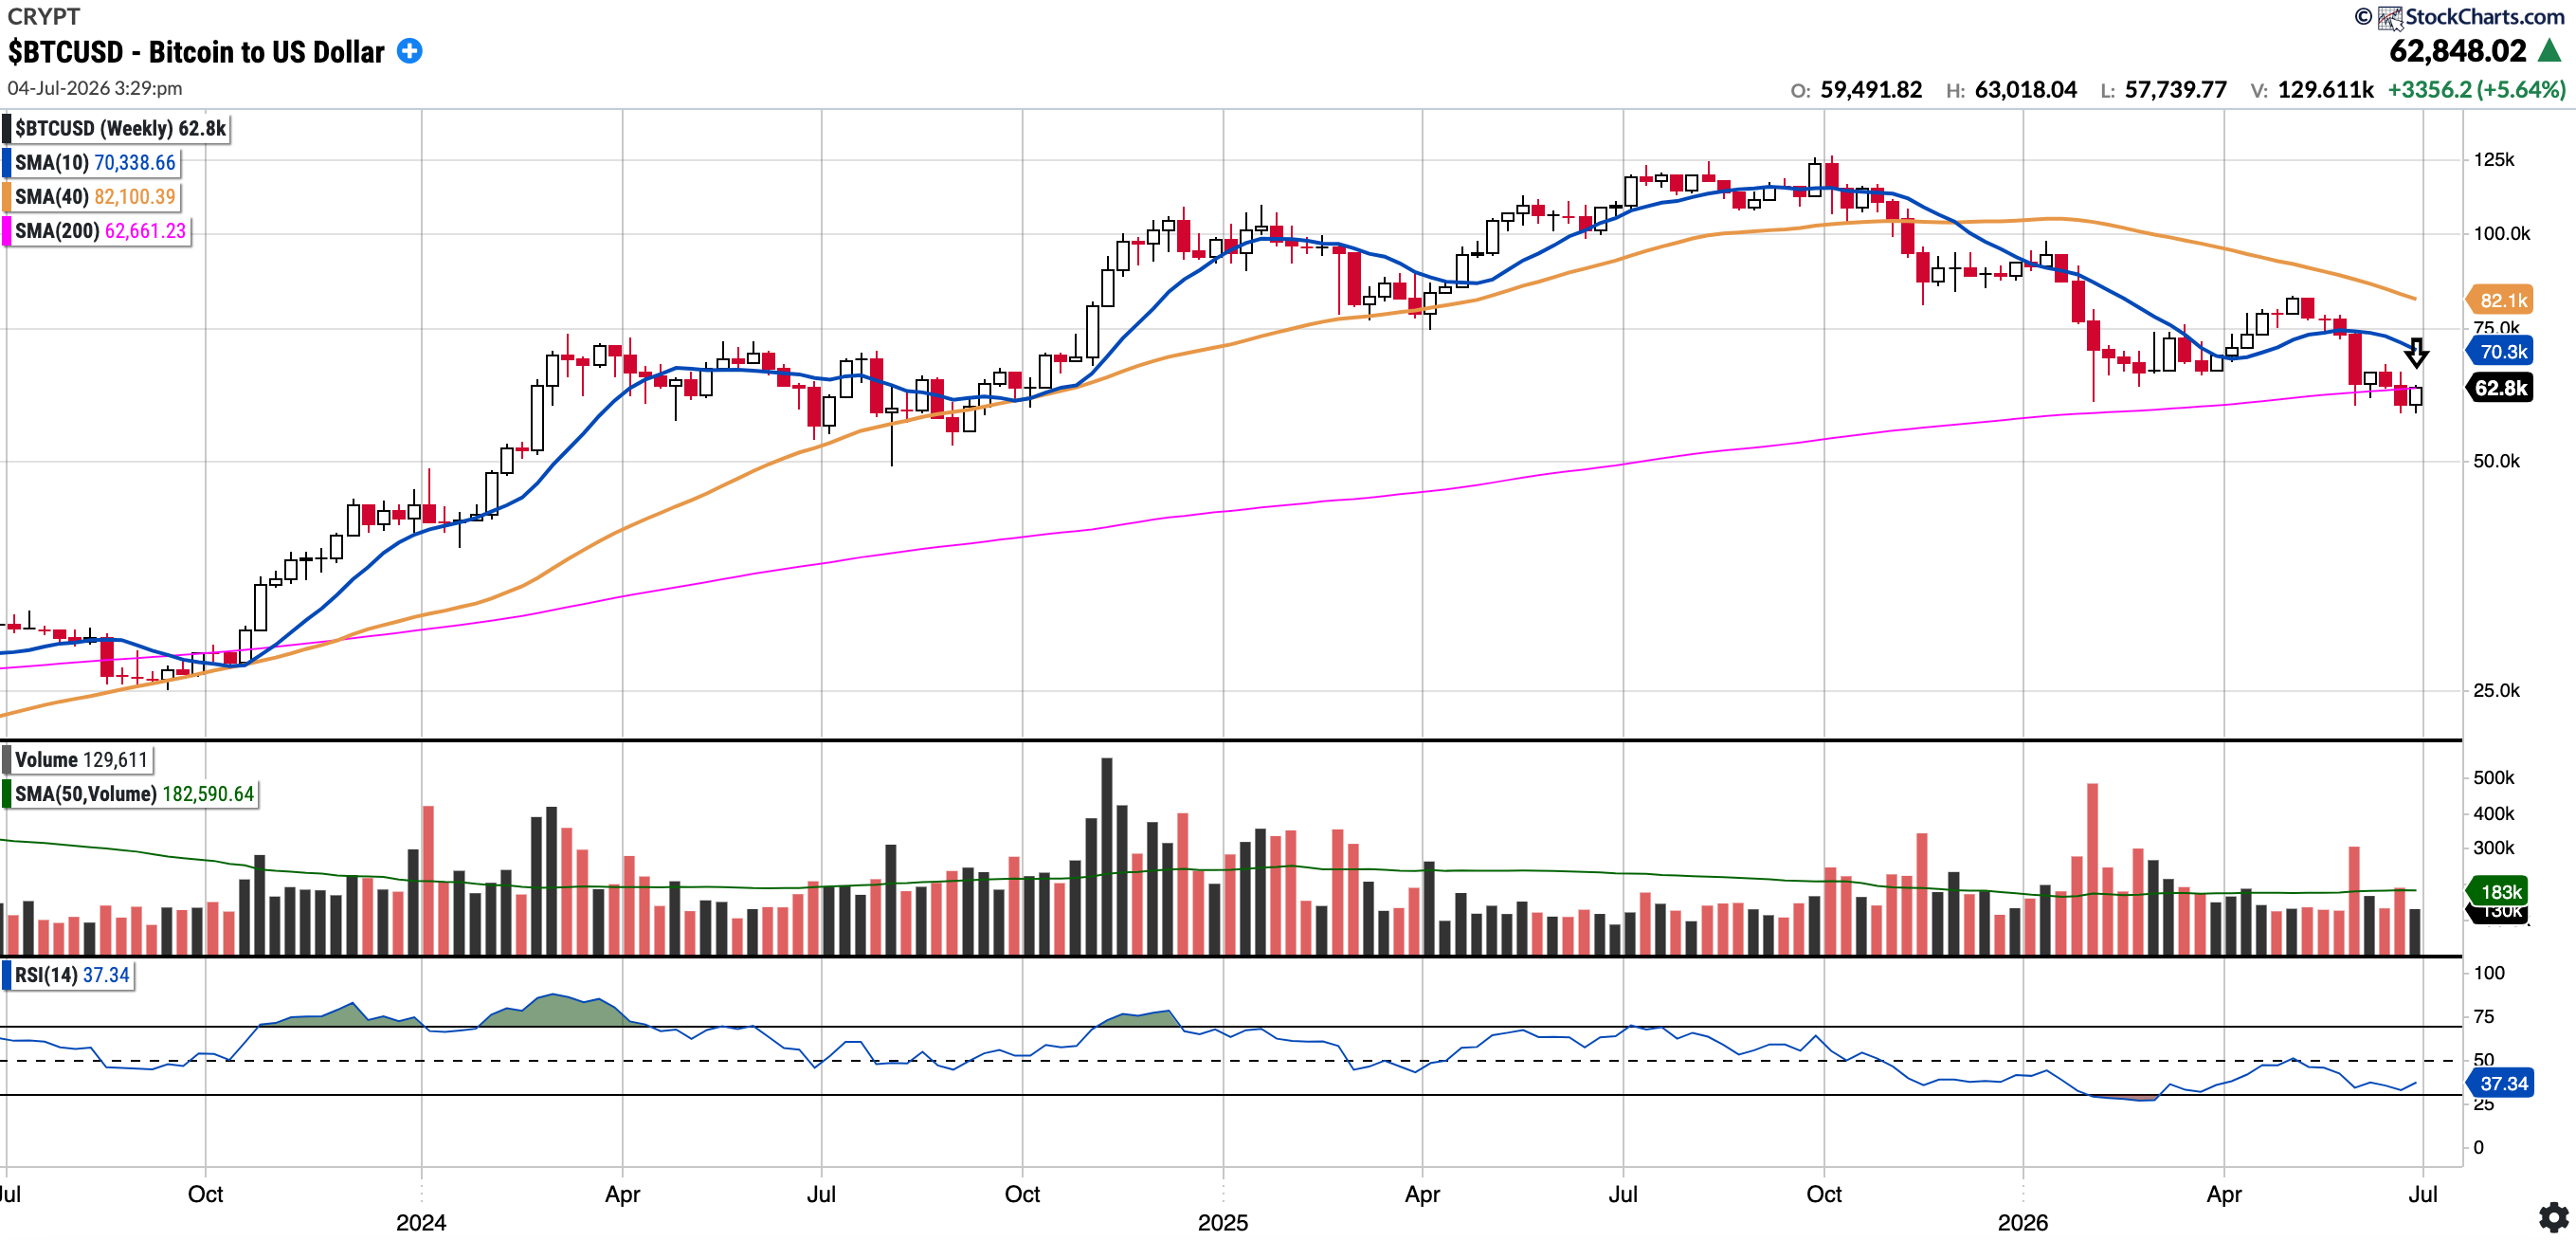
BTC (currently Long)
Currently trades at $62,819.80 6.31% below the 50SMA and 16.06% below the 200SMA.
RSI 48.91
-29.2% YTD.
The U.S. Senate Banking Committee advanced the Digital Asset Market Clarity Act to the full Senate in a bipartisan 15–9 vote a few weeks ago. Yet, despite this regulatory progress, BTC was firmly rejected at its 200-day moving average recently (twice) and is now below the 200-week moving average also.
As of Saturday, July 4th at 16:29 BST, BTC is trading below the key moving averages, except for the 21 EMA. From a technical perspective, it remains weak for now, although it has made a small move off the lows. Bulls will want to see the 200-week MA hold, and then a reclaim of the near-term moving averages. Above, $74k is also a key level that currently aligns with the 200 SMA, an area that previously served as resistance.
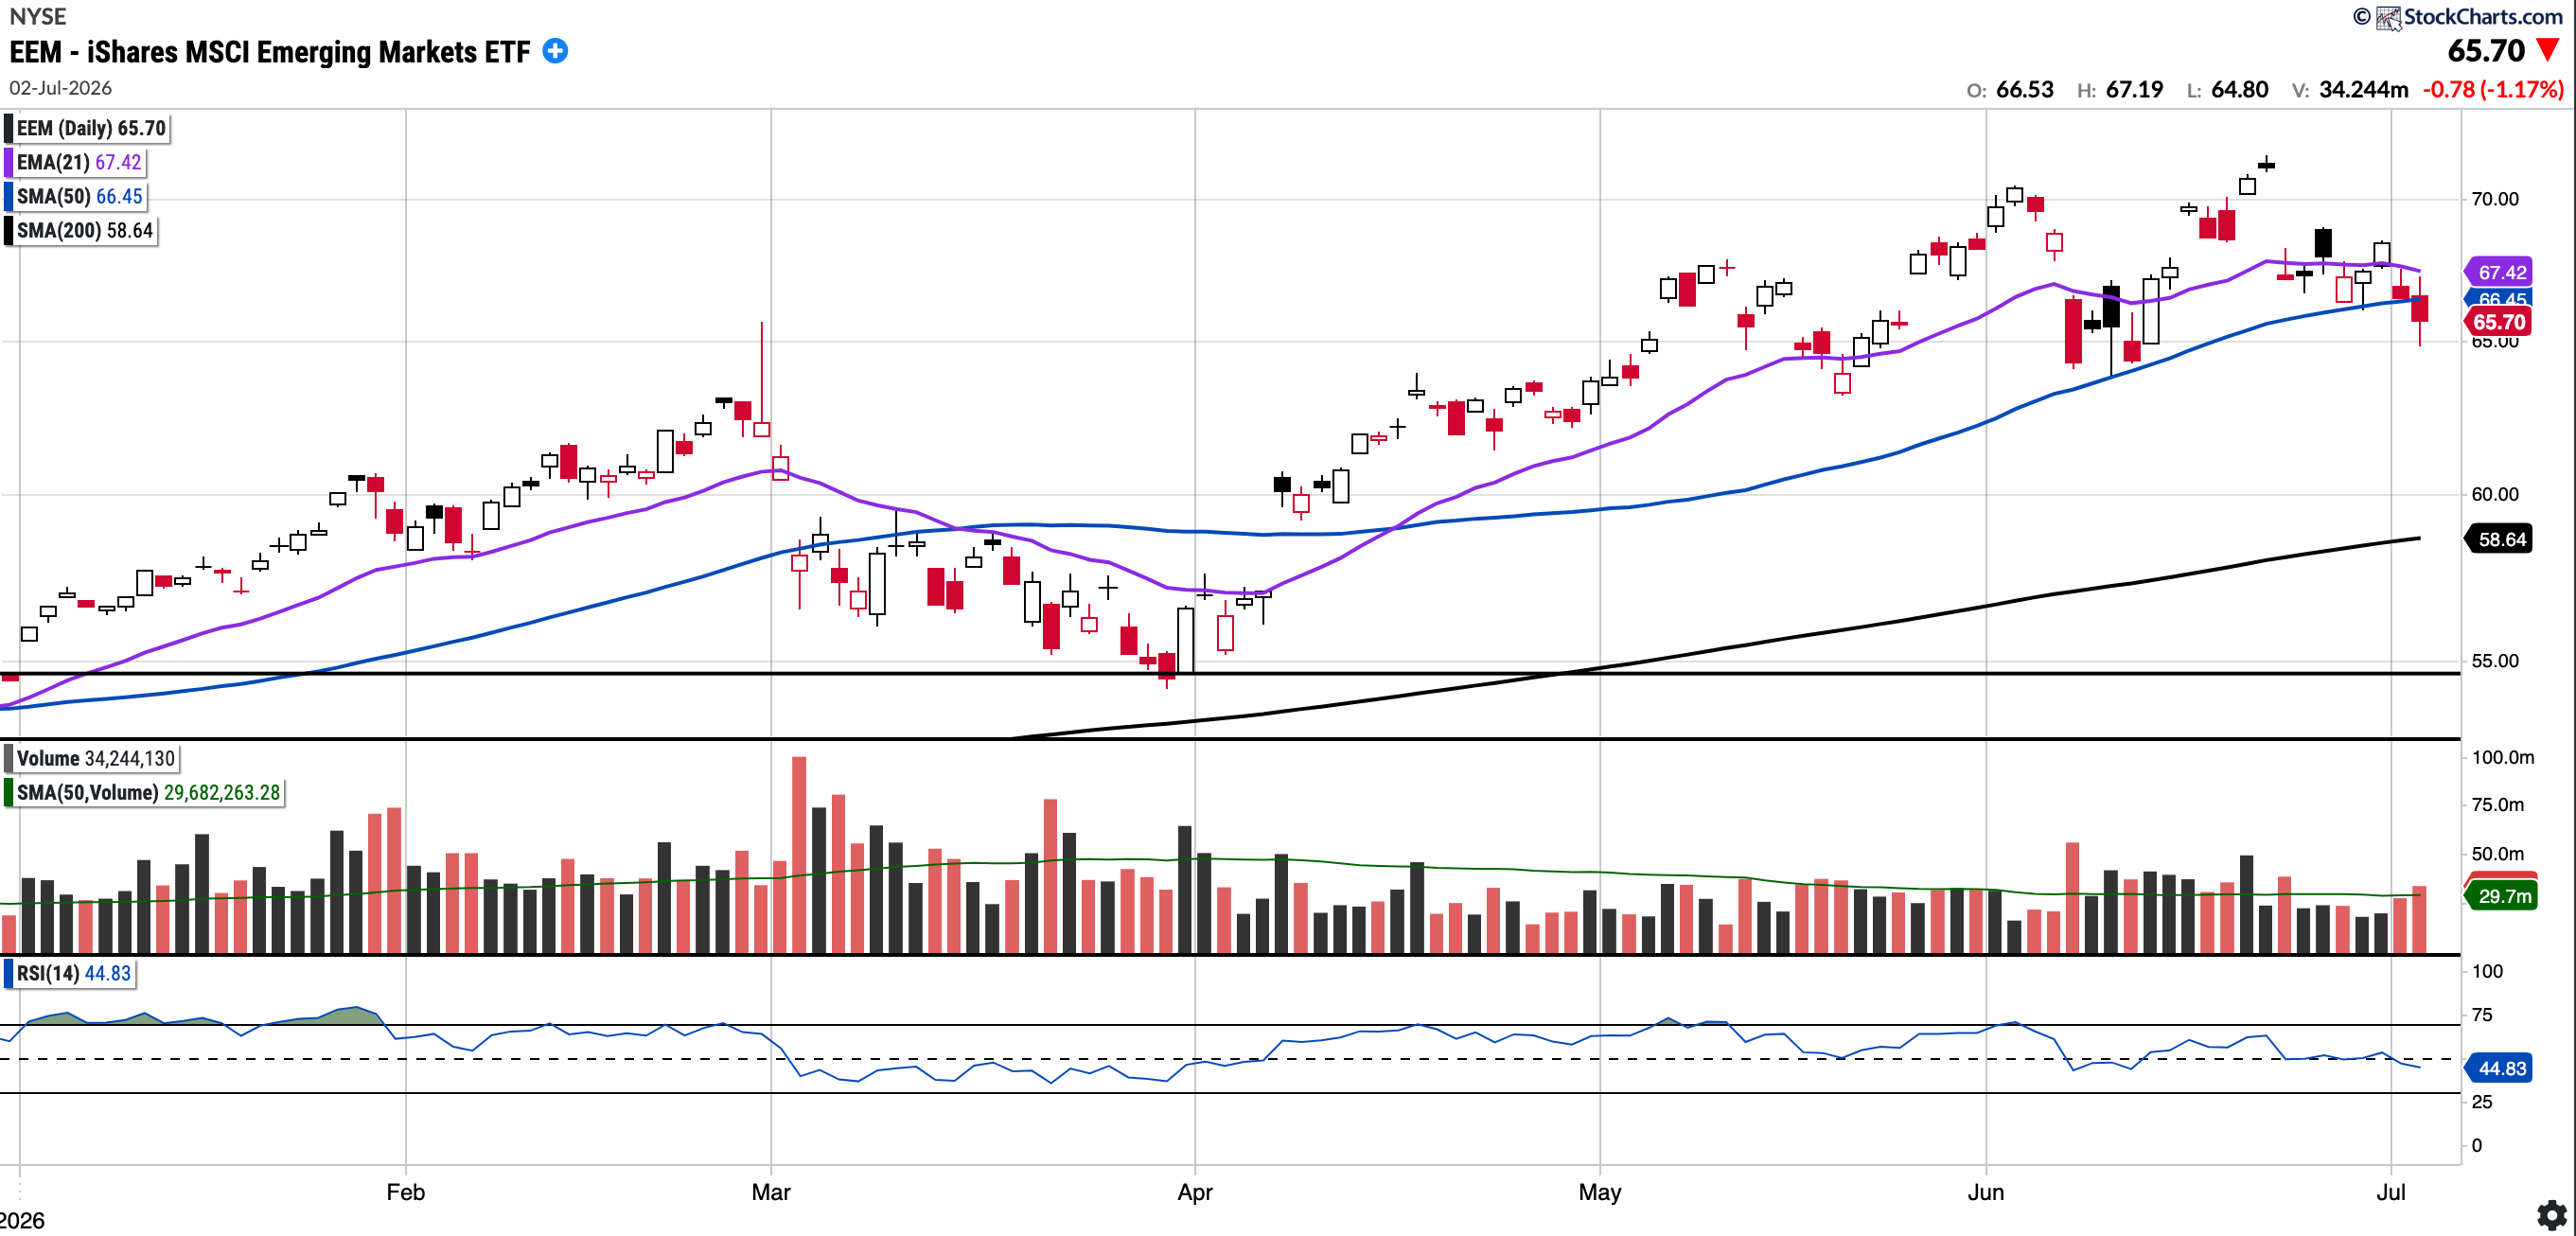
EEM
Currently trades at $65.7, 1.13% below the 50SMA and 12.03% above the 200SMA
RSI 44.83
+17.43% YTD
EEM remains in a strong uptrend and continues to comfortably outperform U.S. indices by more than 800 bps year-to-date. However, EEM closes the week below both the 21 EMA and the 50 SMA for the first time since March. Key levels to watch for pullback buys are here at the 50-day SMA (66.45), followed by the $55–$58 zone (horizontal support and 200-day SMA).
I do believe emerging markets could setting up for multi-year outperformance; hence, I continue to watch them closely. If it can pull in further to the 200 day, I may be positioning long in a related ETF. One point worth noting regarding the EEM ETF is that it may not be the best representative of emerging markets as a whole, given that TSMC, Samsung, and SK Hynix make up roughly 30% of the fund.
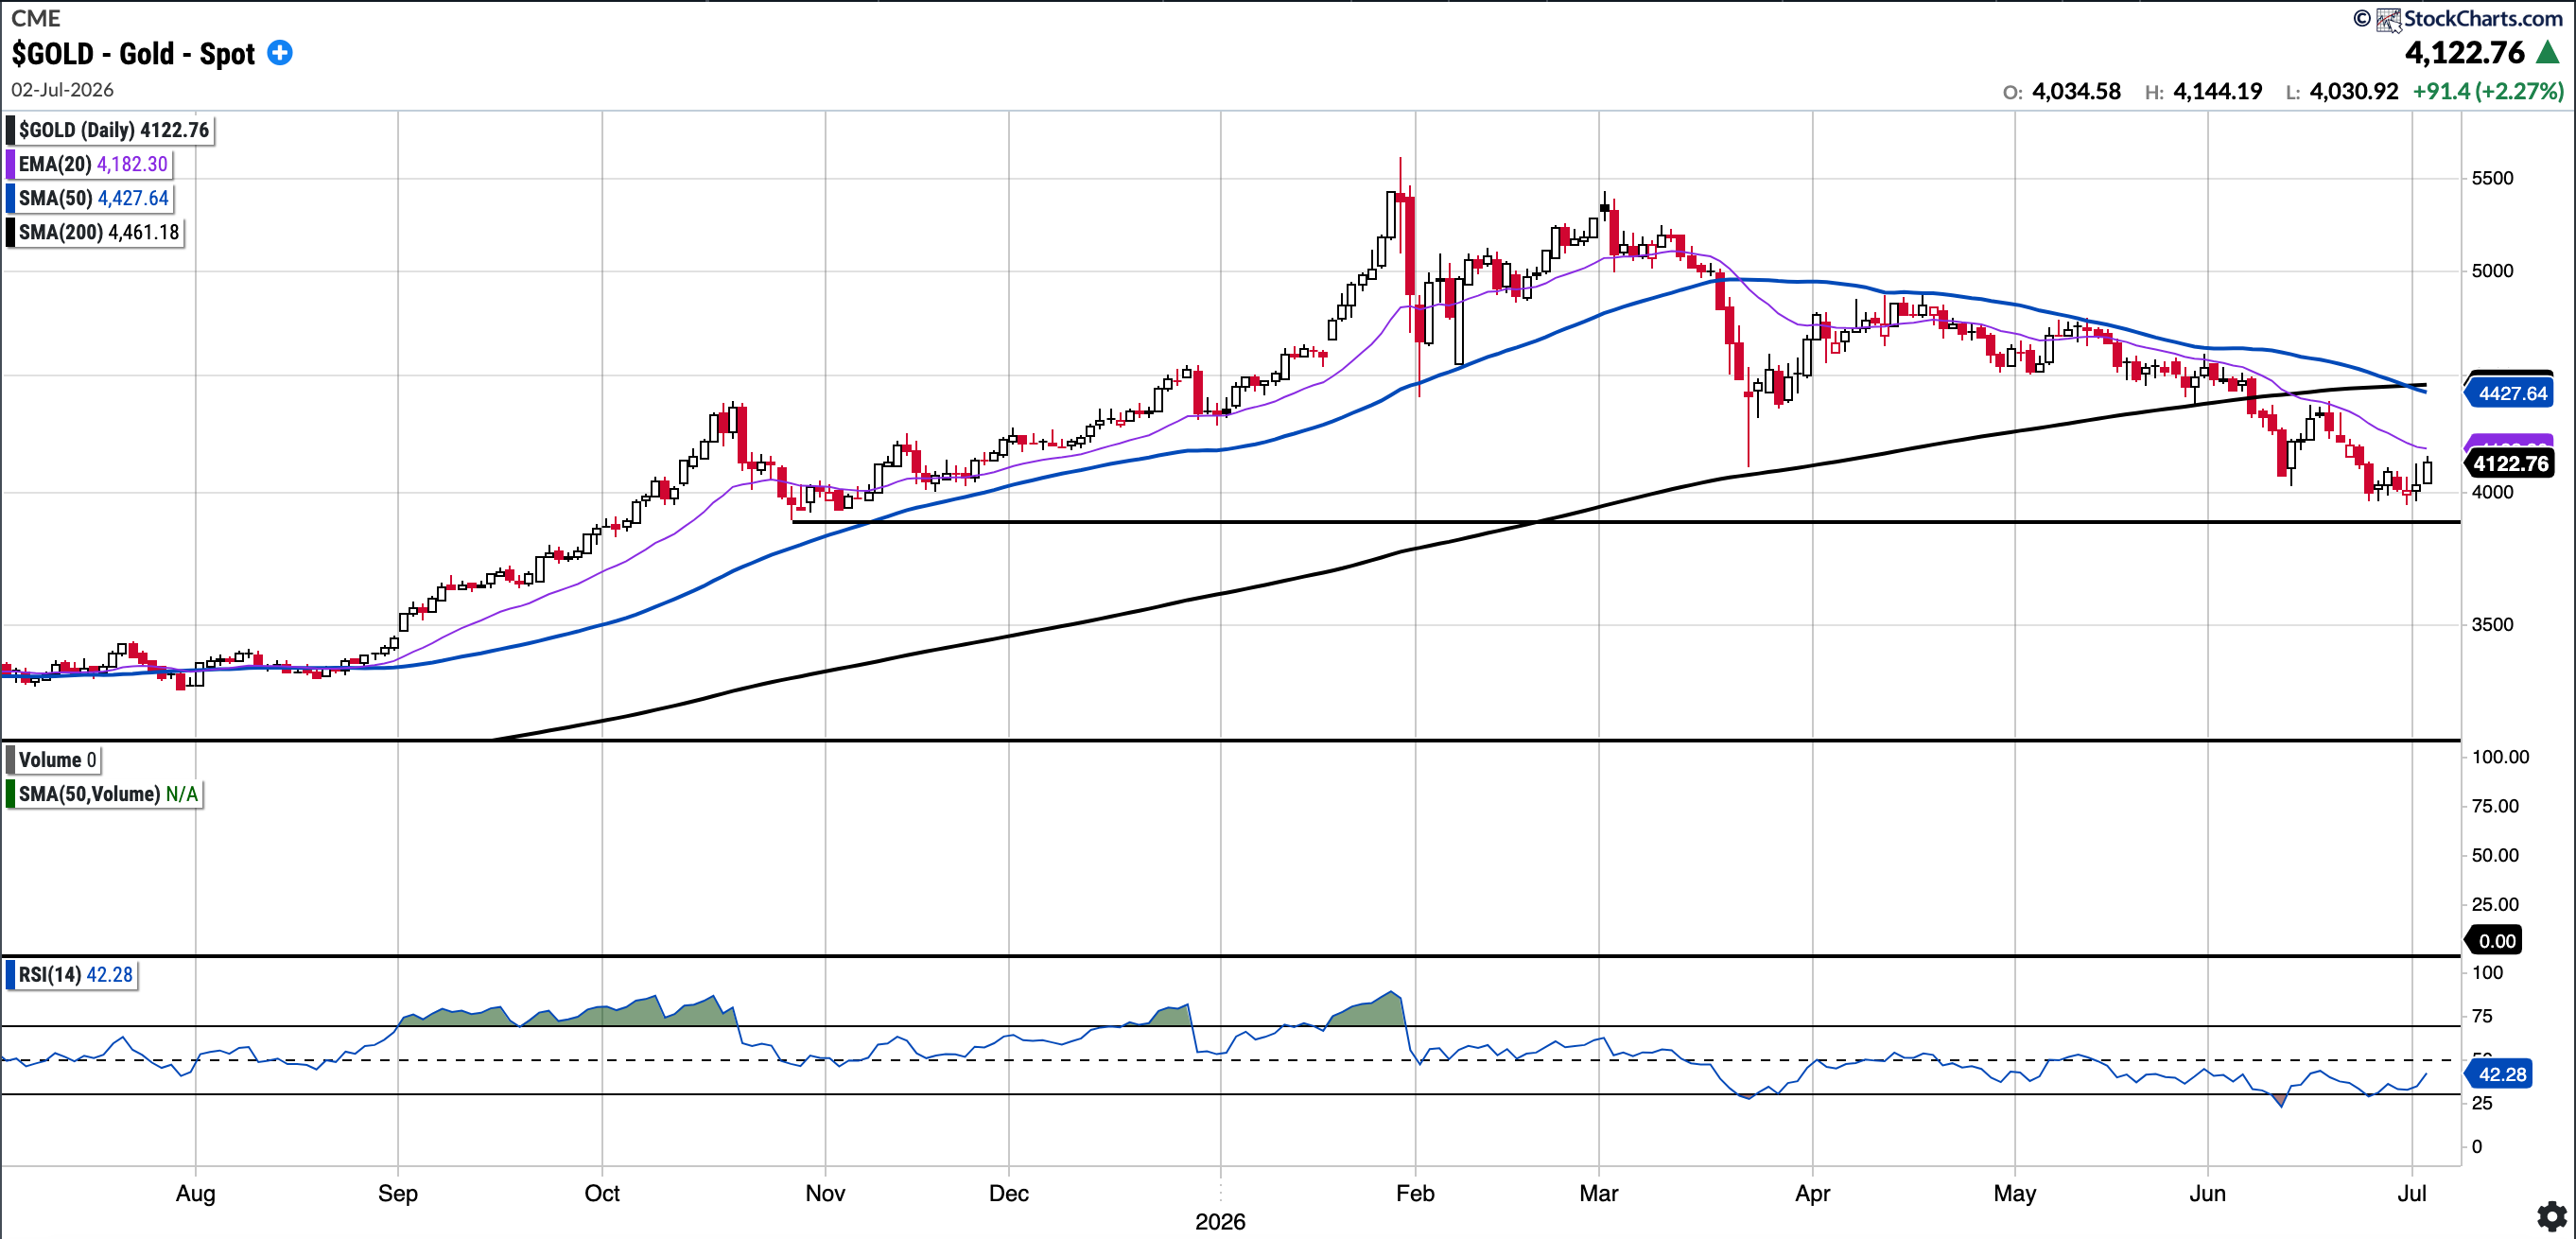
GOLD (Long Physical)
Currently trades at $4,122.76, 6.89% below the 50SMA and 7.59% below the 200SMA
RSI 42.28
-4.62% YTD
Gold lost its 200-day moving average recently for the first time since its bull run began in late 2023. That is notable and potentially concerning if not reclaimed.
Gold was rejected at the descending 21-day EMA mid June and is again coming up to that level. Bulls would like to see the 4100 level of interest hold and then key overhead moving averages reclaimed, starting with the 200-day. I would be tempted to add some physical if we can trade to the 3700-3900 level.
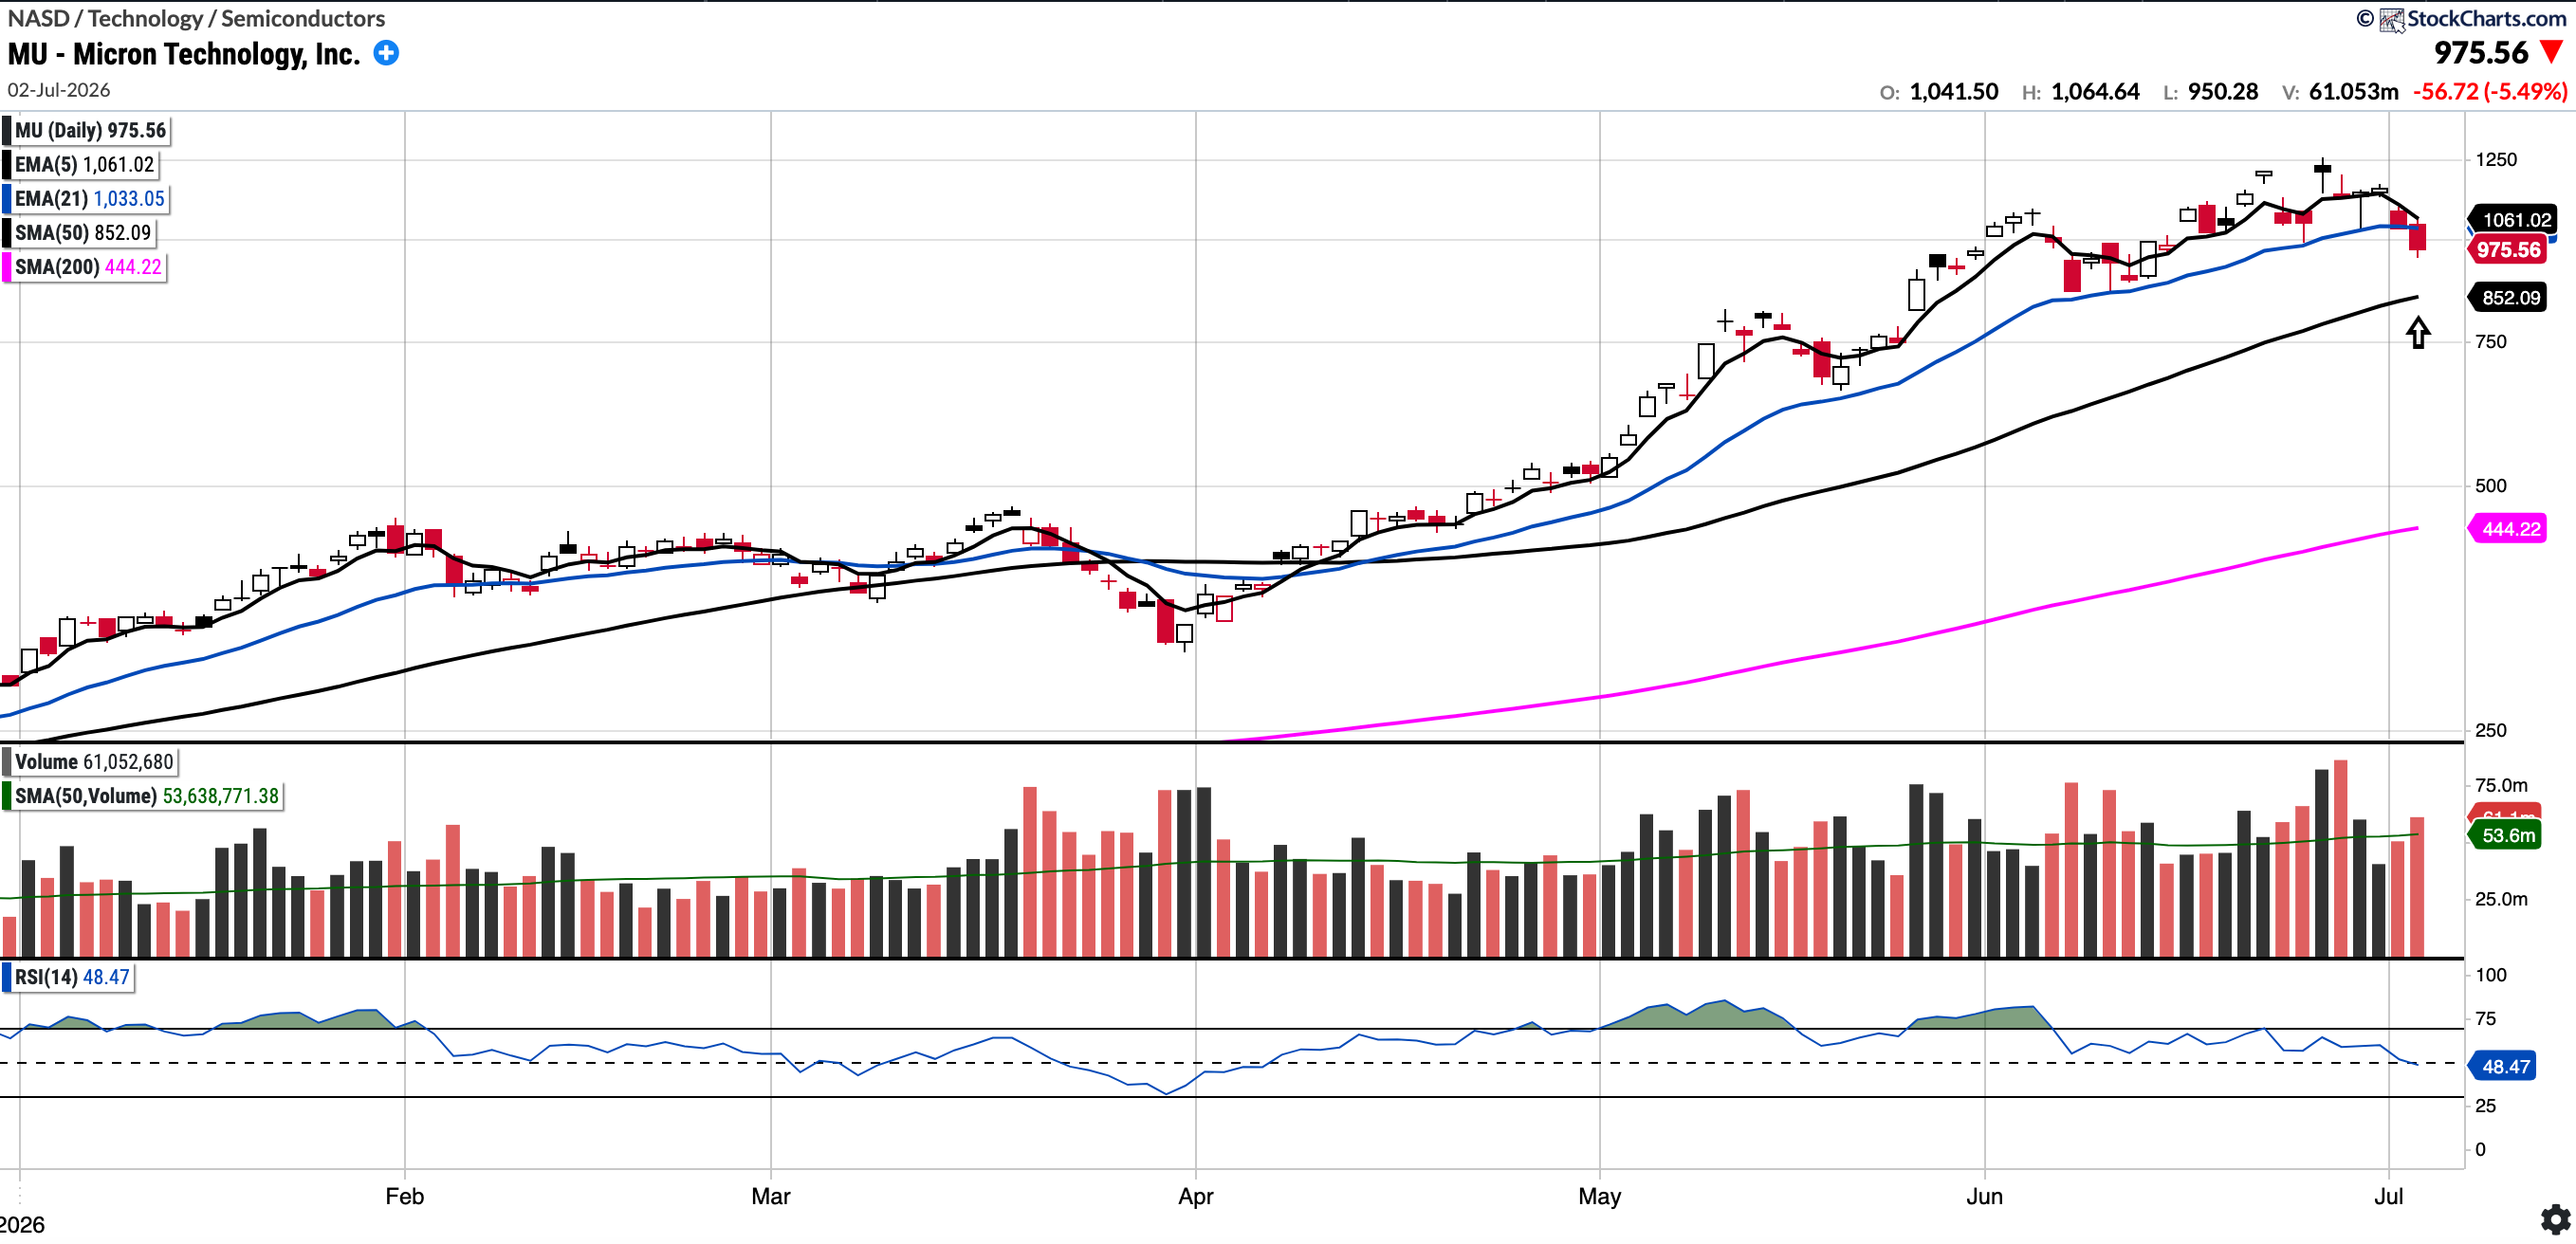
MU
Currently trades at $975.56, 14.49% above the 50SMA and 119.61% above the 200SMA
RSI 48.47
209.42% YTD
MU has been one of the top-performing stocks in the broader market over the last year, appreciating more than 10x.
However, since early June, we can see that high-volume selling has started to take place alongside a bearish divergence. The stock also lost its 21-day EMA for the first time since mid-March, which is notable. Bulls will want to see the 21 EMA reclaimed or, if there is further selling, for the ascending 50-day SMA to hold (see arrow).
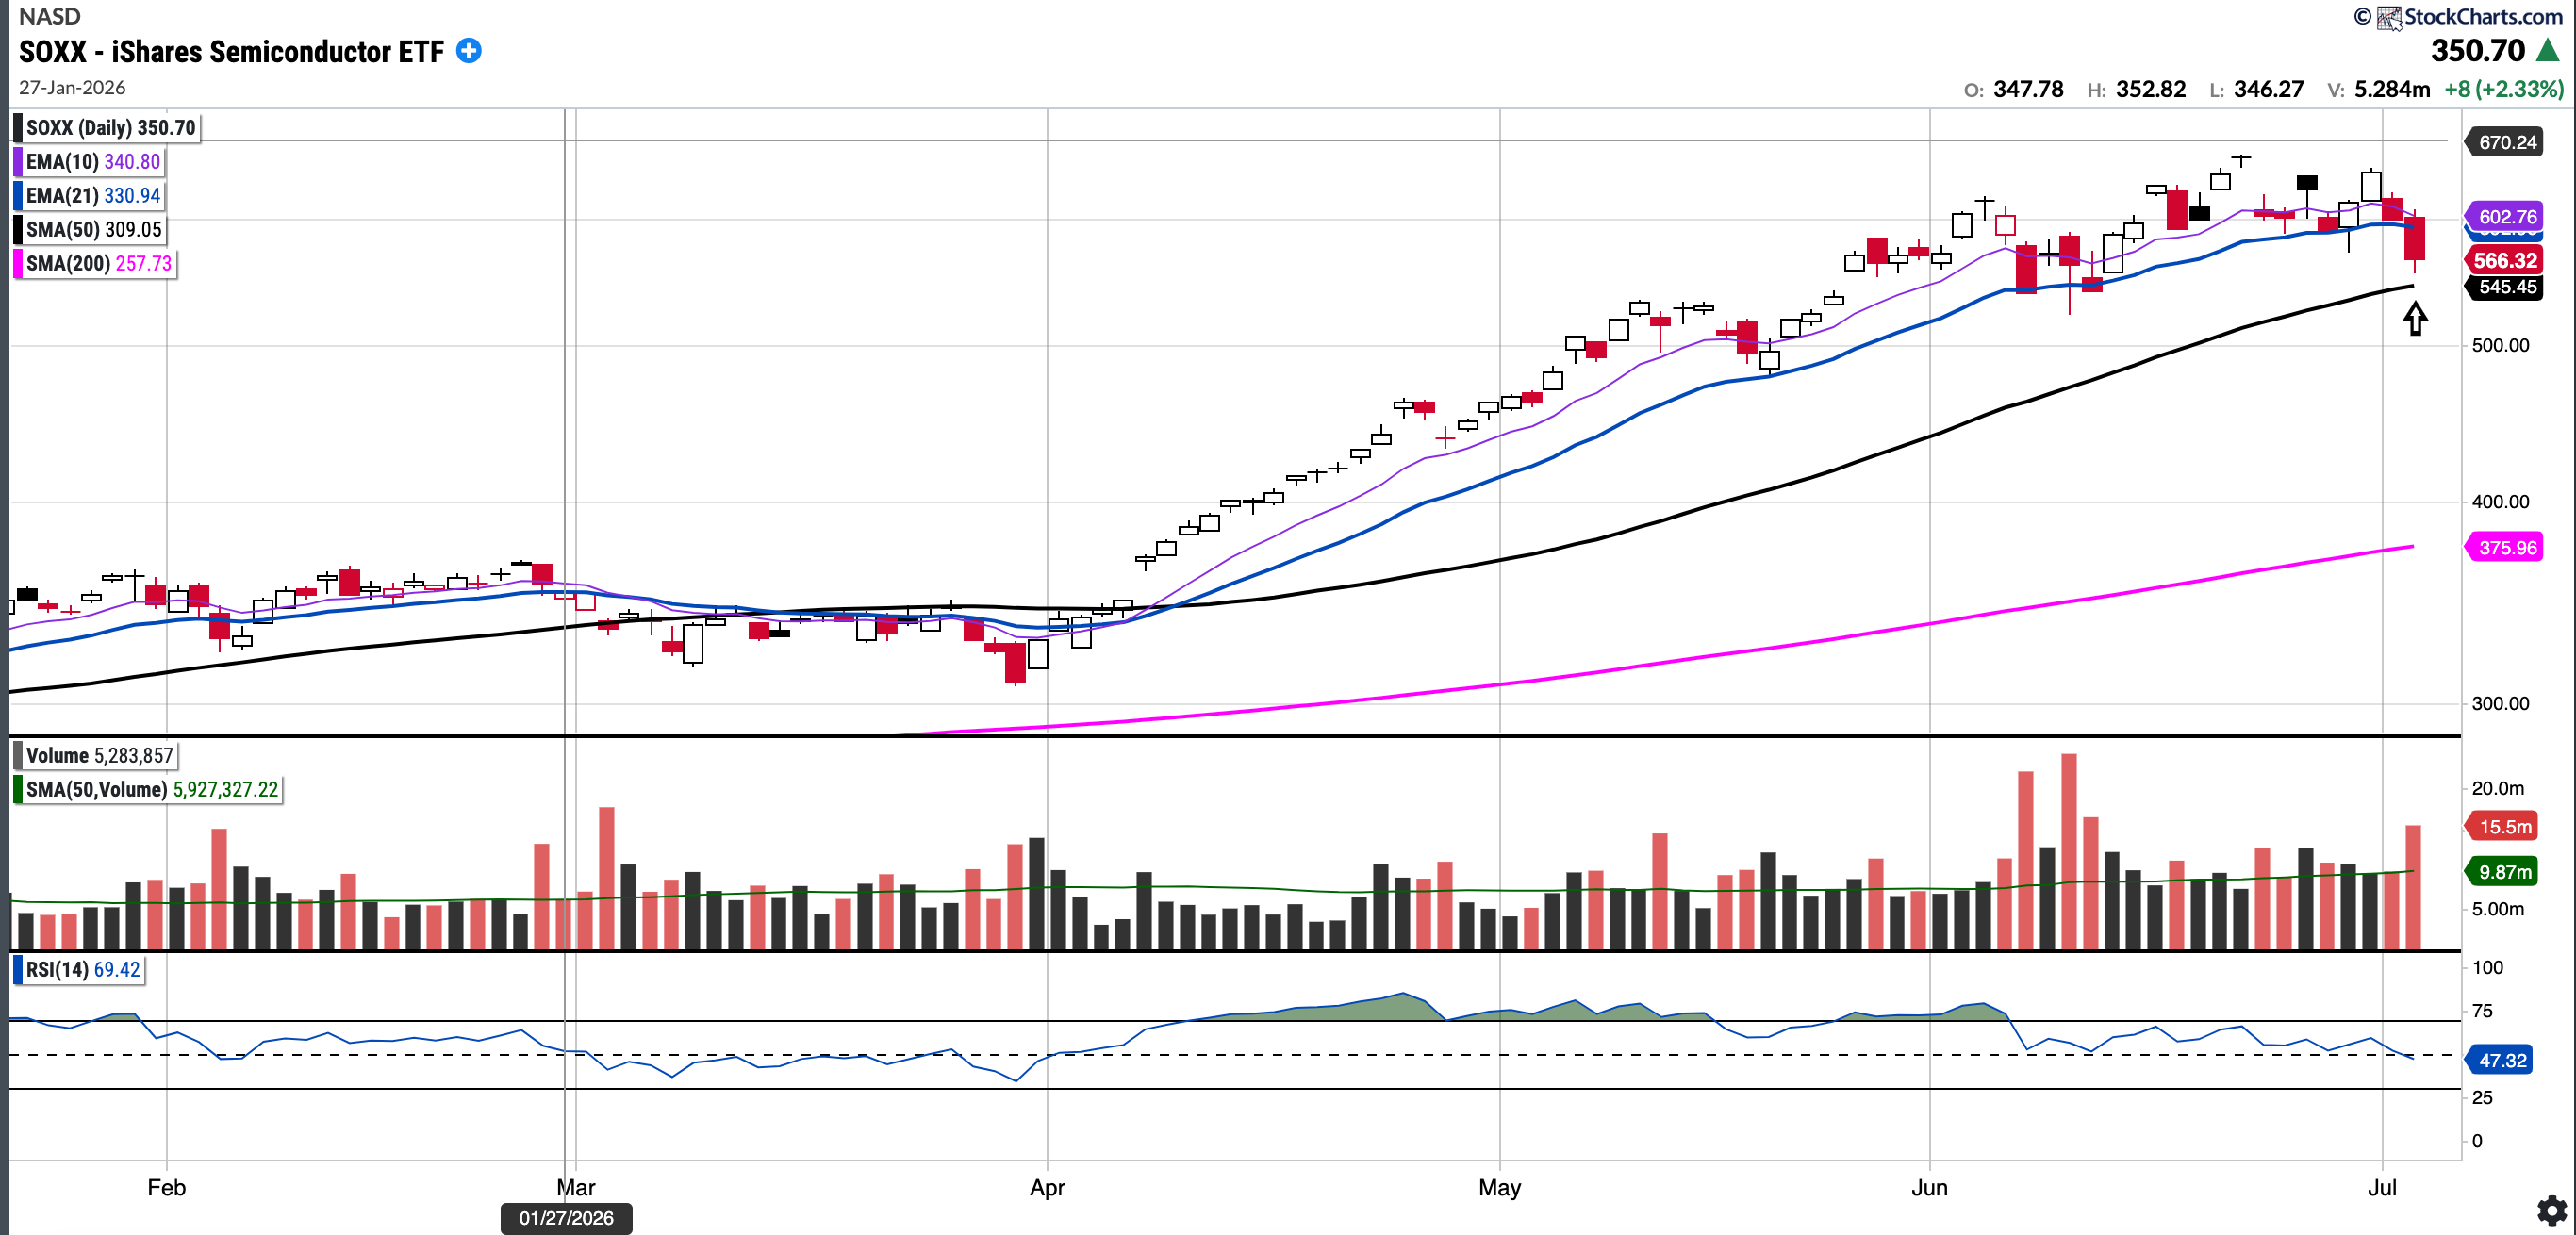
SOXX
Currently trades at $566.32, 3.83% above the 50SMA and 50.63% above the 200SMA
RSI 47.32
80.73% YTD
SOXX has broken below its 21-day moving average on above average volume. The semi complex has looked weak over the last few sessions, though it will be interesting to see if semis can turn around or if they are due to consolidate. A retest of the 50-day moving average looks probable at some stage (see arrow)
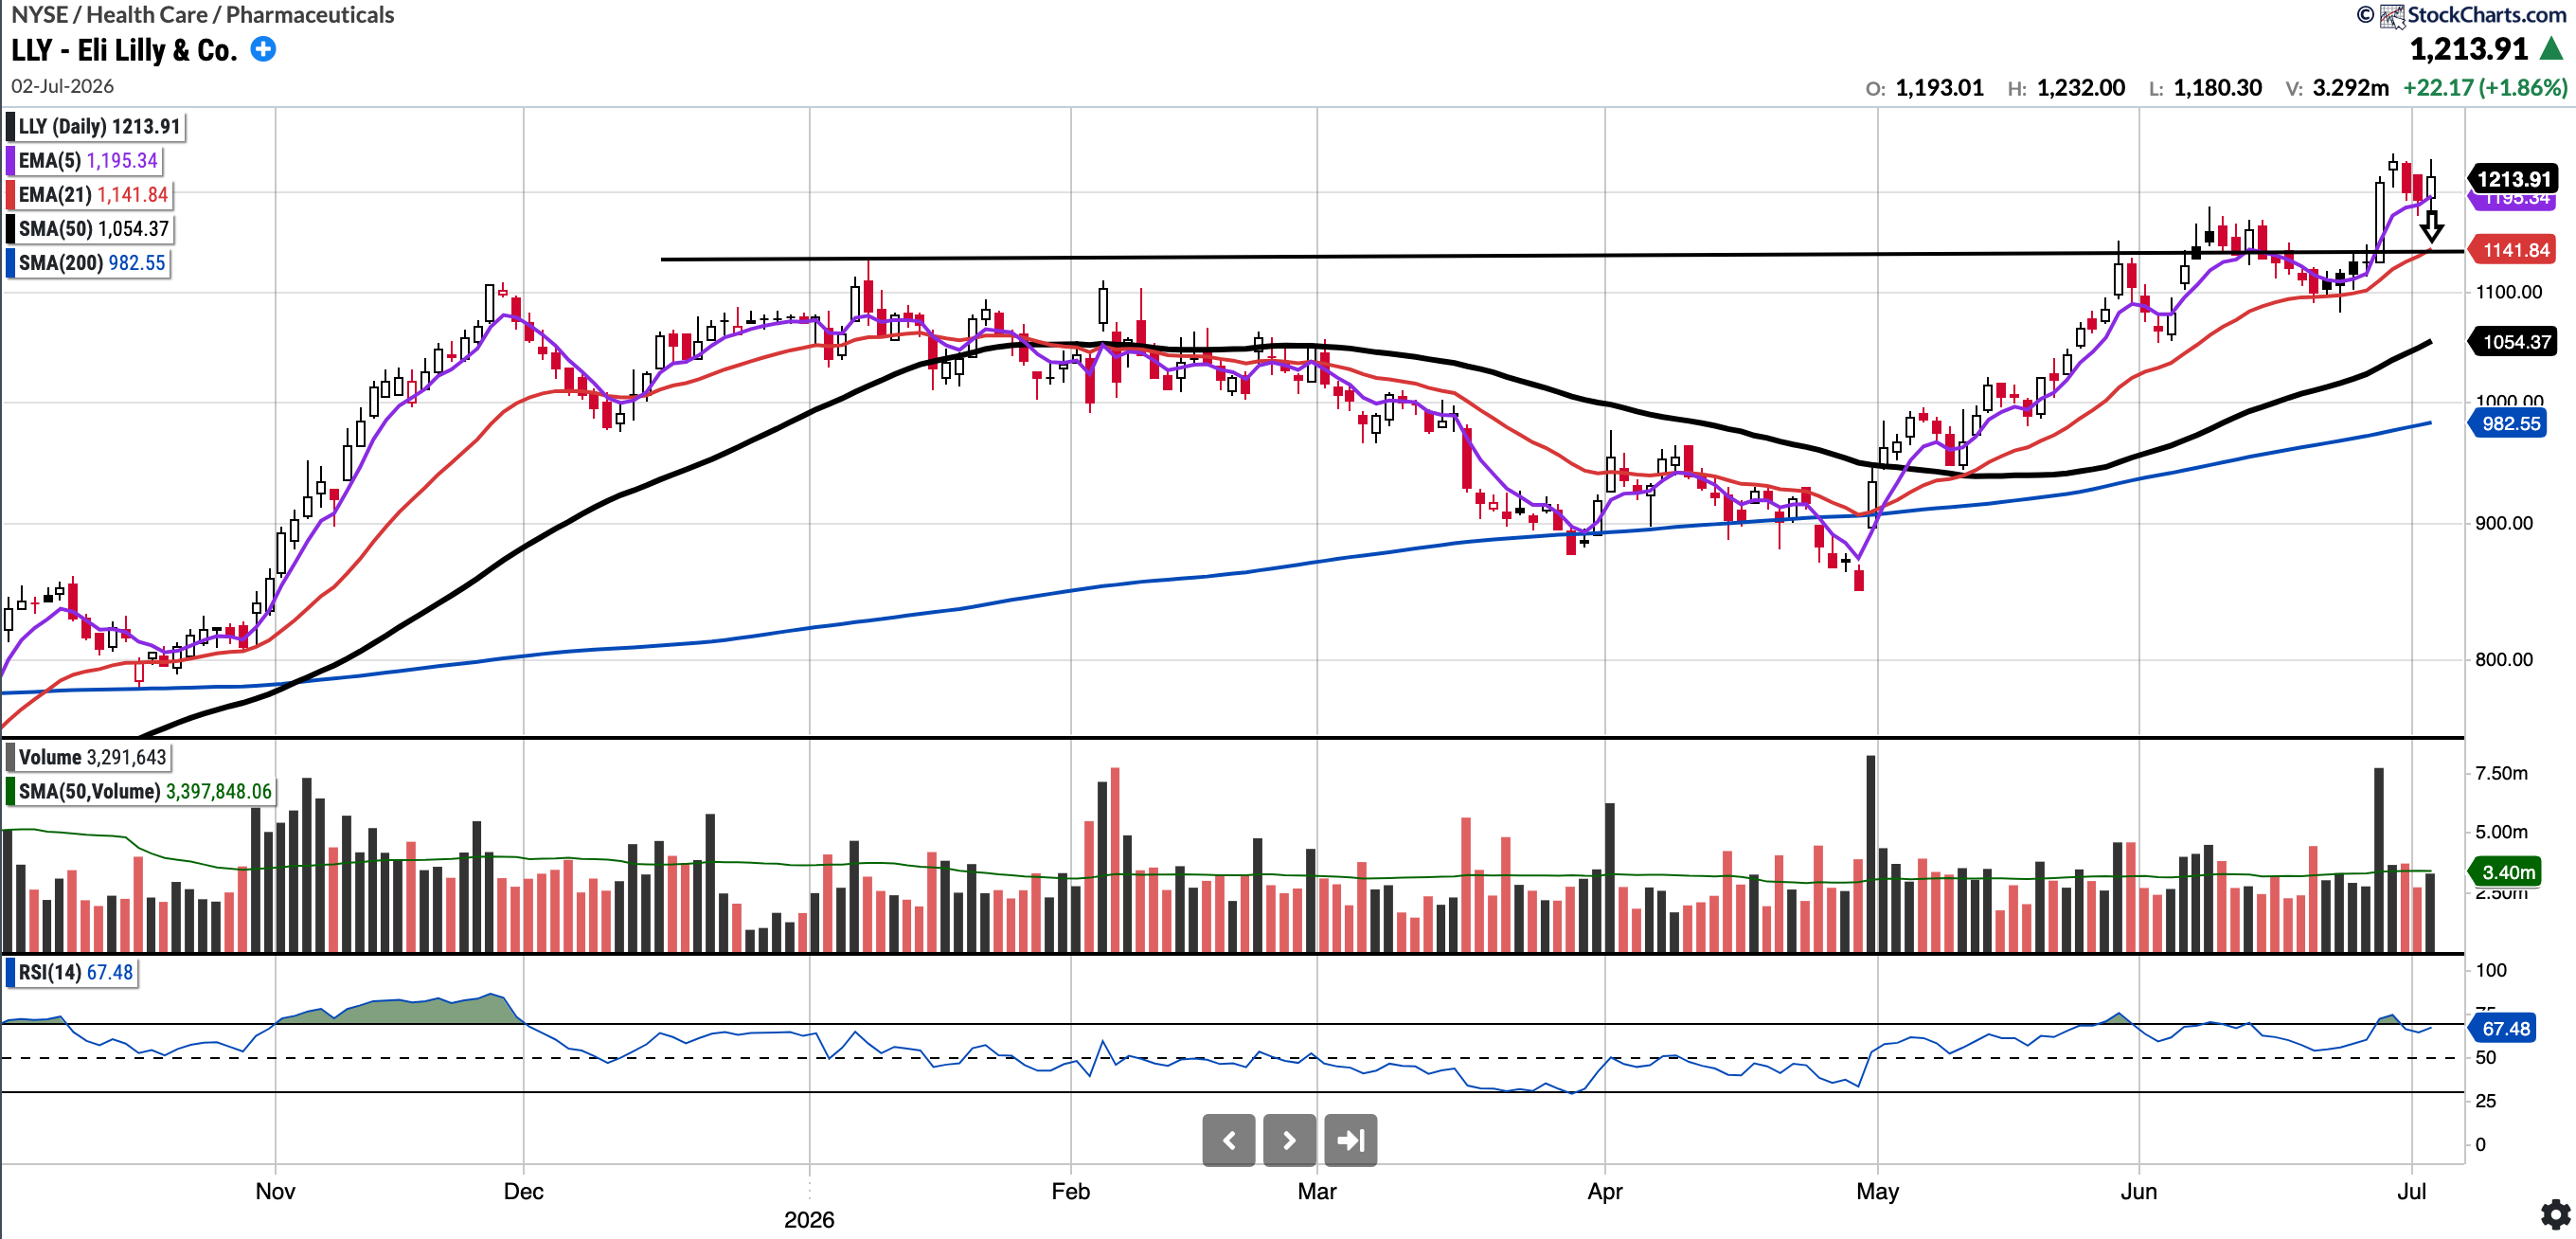
LLY (Currently Long)
Currently trades at $1213.91, 15.13% above the 50SMA and 23.55% above the 200SMA
RSI 75.87
12.74% YTD
Eli Lilly and Co. has been one of the leading pharmaceutical companies in the world and continues to show solid execution. From a technical perspective, the stock has broken to new highs. A shallow pullback to the rising 21-day EMA, which coincides with the breakout level, may offer a lower-risk entry (see arrow). I am long from $888, so I am not too keen to add up here, but I am certainly holding.
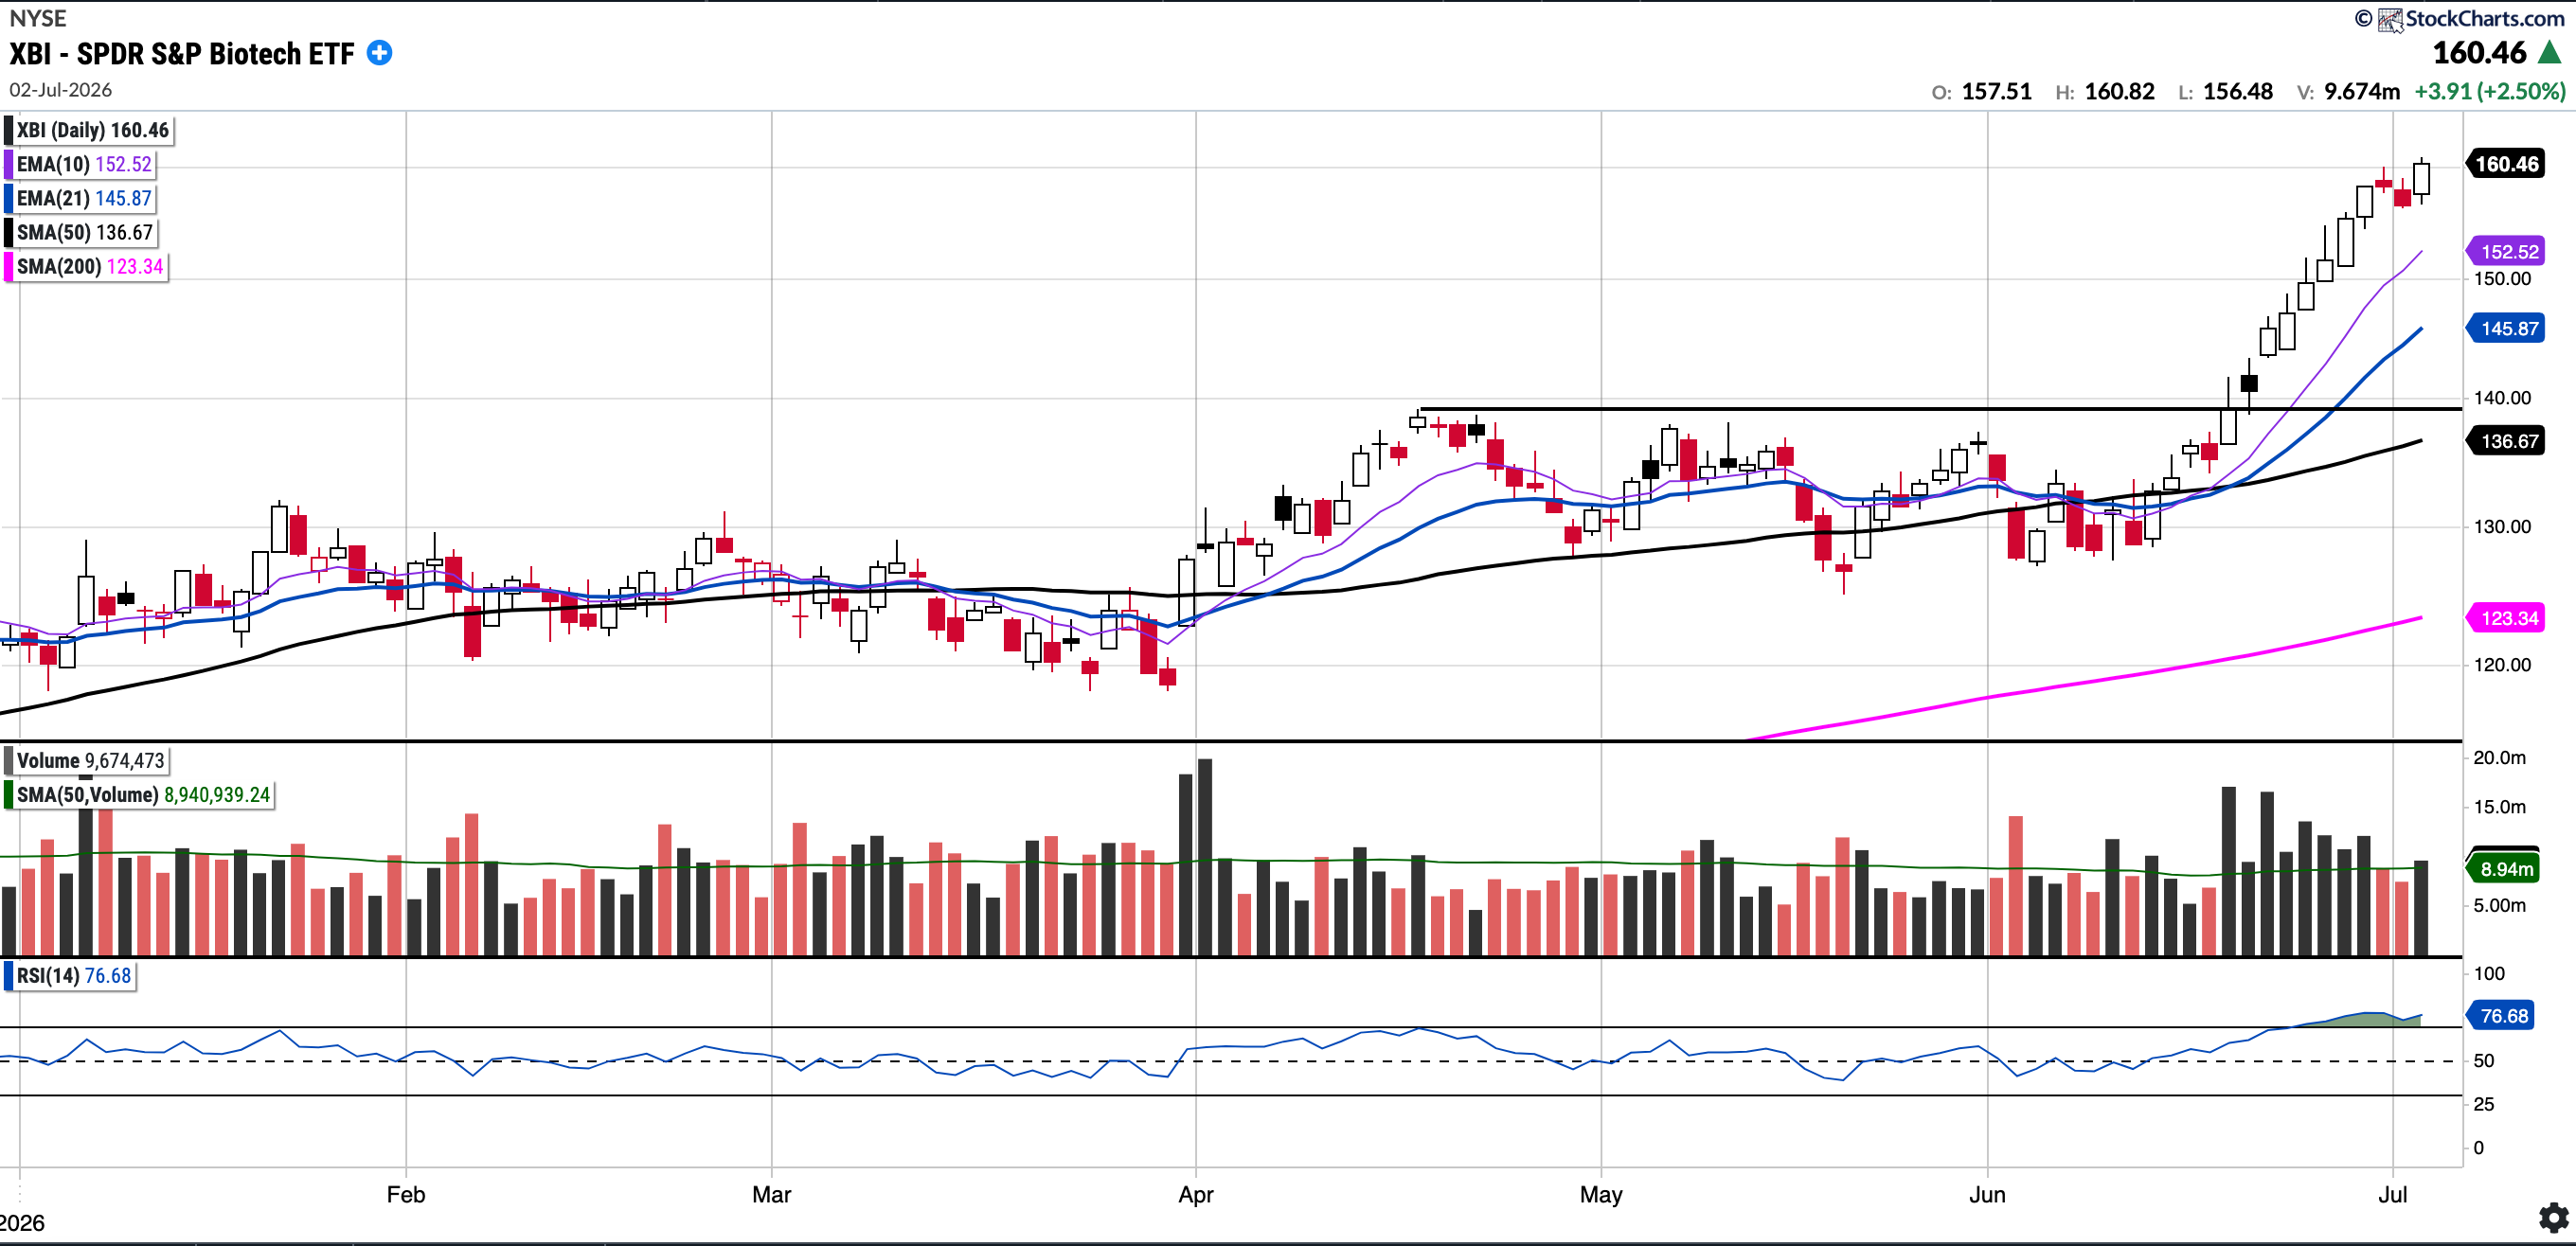
XBI
Currently trades at $160.46, 17.41% above the 50SMA and 30.09% above the 200SMA
RSI 76.68
31.73% YTD
The XBI (S&P Biotech ETF) has shown a lot of strength in recent weeks, but frankly, it has been in a bull market since last August. It is too overbought in the near term to get long but is one to keep on the watchlist in case it pulls back. An orderly pullback to the 21 EMA may give a chance to get in. See the chart below plus along with screen grabs of the top 20 performers within this ETF.


Important: I will feature several other Trading ideas in the Watchlist Snapshot post, so keep a look out for that post later. It will also include my Trading Account holdings.
Recent weeks post (link below) have had countless positions responding to key levels and running sharply such as:
ASTS 74 to 130
FLY 32 to 62
NOK 12.4 to 16
RBRK 60 to 78
CIFR 18 to 25
USAR 19 to 30
ORCL 160 to 225

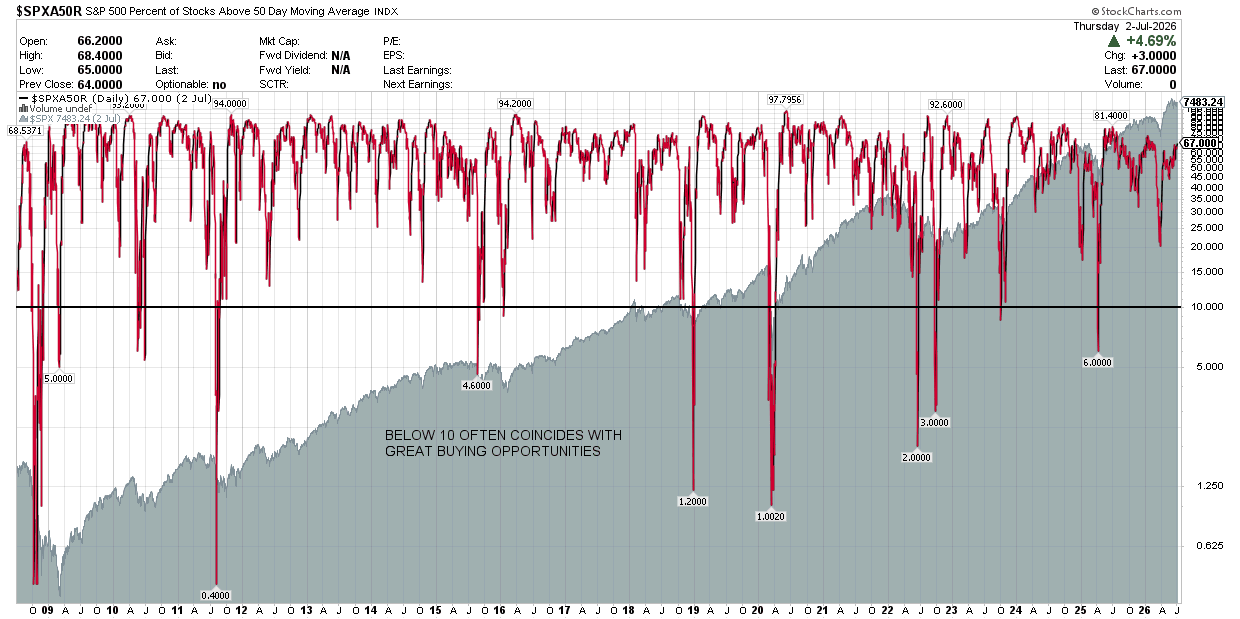
S&P 500 Percentage of Stocks Above the 50 Day Moving Average: Currently 67%
Breadth increased this week, with the percentage of stocks above the 50-day moving average now at 67%
Notable portfolio changes in previous week (all updated live in subscriber channels):
