

Hope you all are having a good weekend. Below, we will be previewing the upcoming week’s events and providing a portfolio update as usual.
Format for what is covered in this weekly preview:
A Look at the Indices
Key Upcoming Economic Events
Upcoming Earnings Reports
Charts
Notable Portfolio Changes from the Previous Week
Current Portfolio Holdings
Position size, cost basis, and commentary on each holding regarding the intended holding period and any planned activity
Closing Thoughts
I recommend checking out the most recent Monthly Portfolio and Performance Update below:

Indices
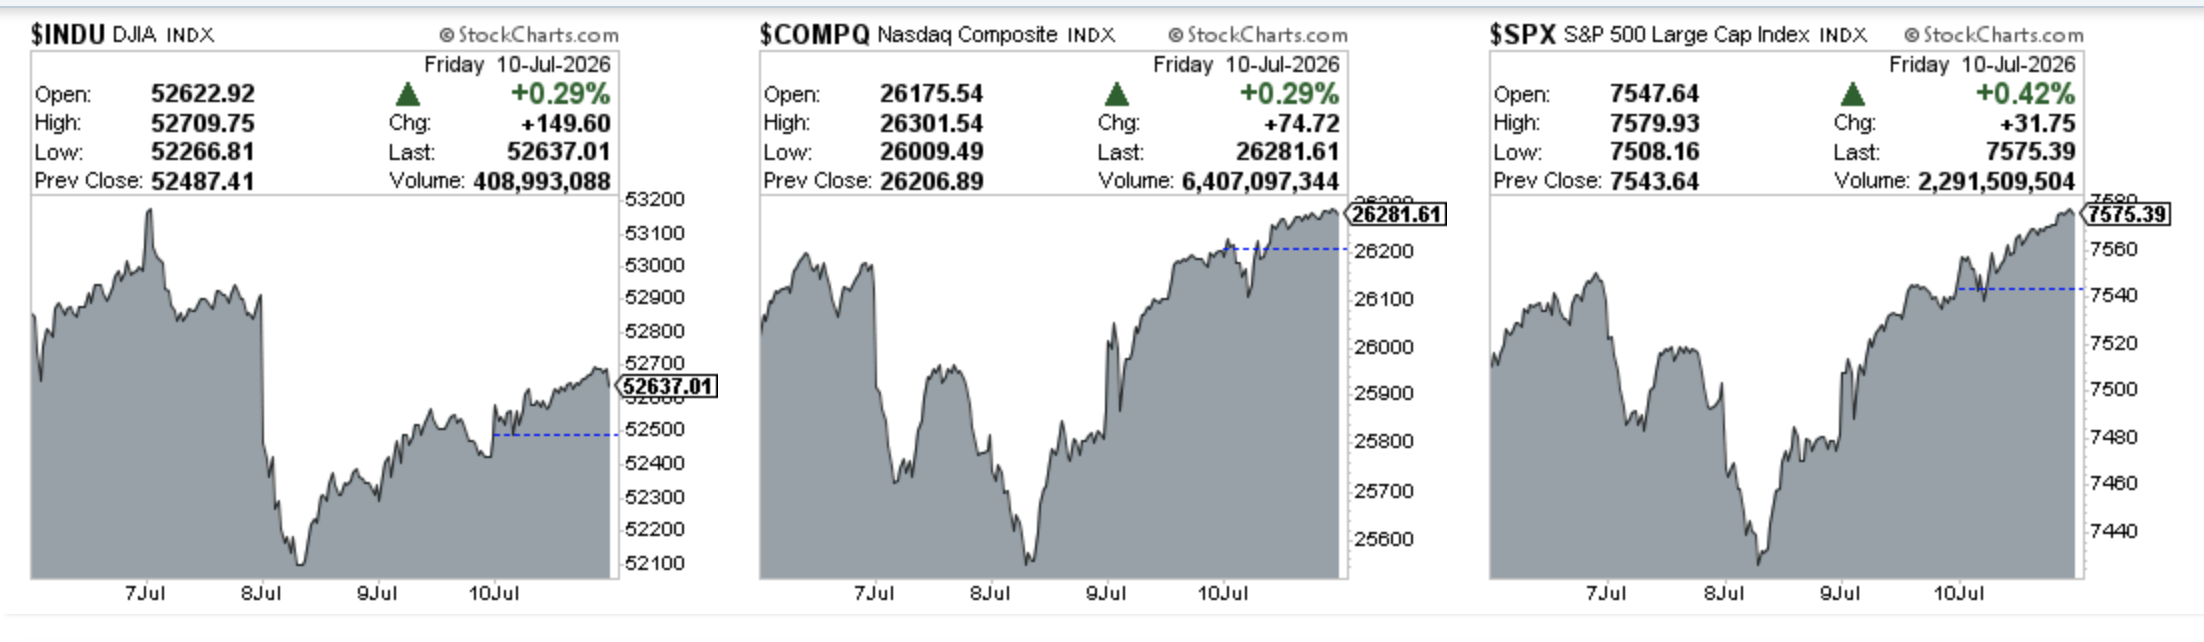
Dow Jones declined 0.74% in the last week
S&P 500 advanced 0.74% in the last week
Nasdaq Composite advanced 0.82% in the last week
IWM declined 1.01% in the last week
Key upcoming economic events
Monday, July 13
Treasury Bill Auctions: 3-Month and 6-Month.
US Monthly Budget Statement
Tuesday, July 14
Consumer Price Index (CPI)
Wednesday, July 15
Producer Price Index (PPI)
Thursday, July 16
Retail Sales
Initial Jobless Claims
Friday, July 17
University of Michigan Consumer Sentiment Index (Preliminary)
Upcoming Earnings
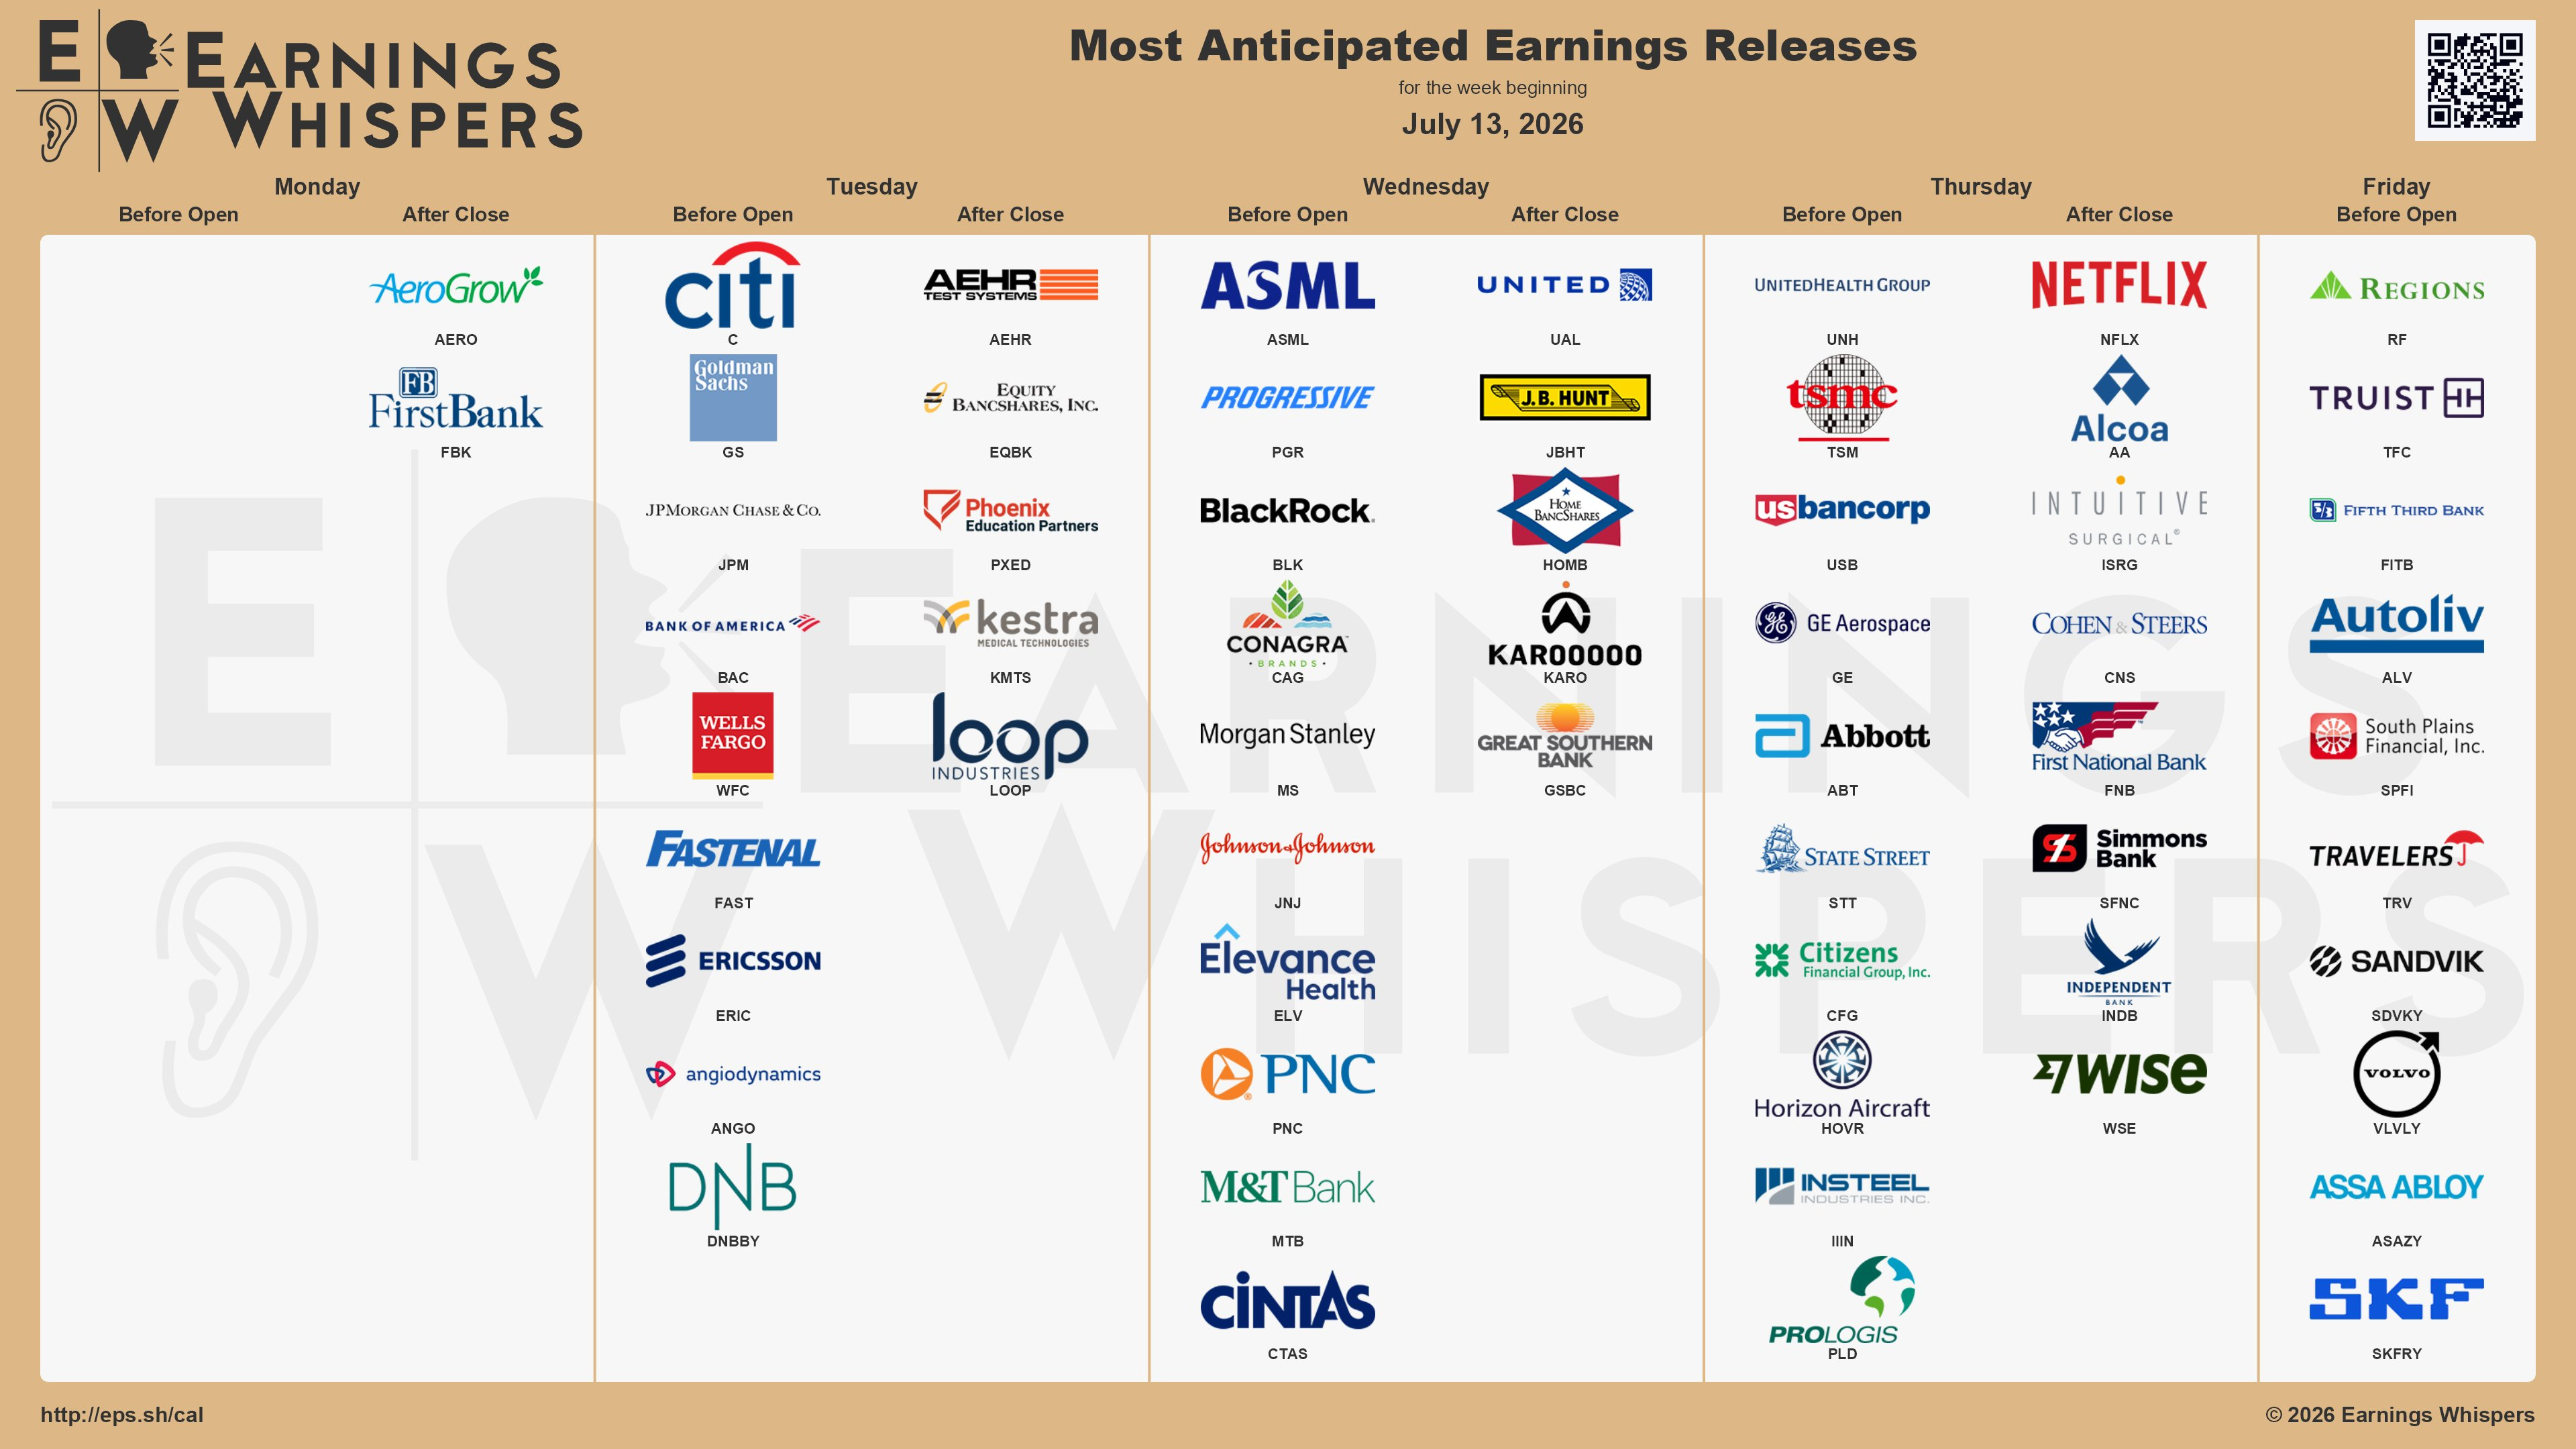
Below is the infographic by Earnings Whispers highlighting the schedule for this week:
Charts
SPX
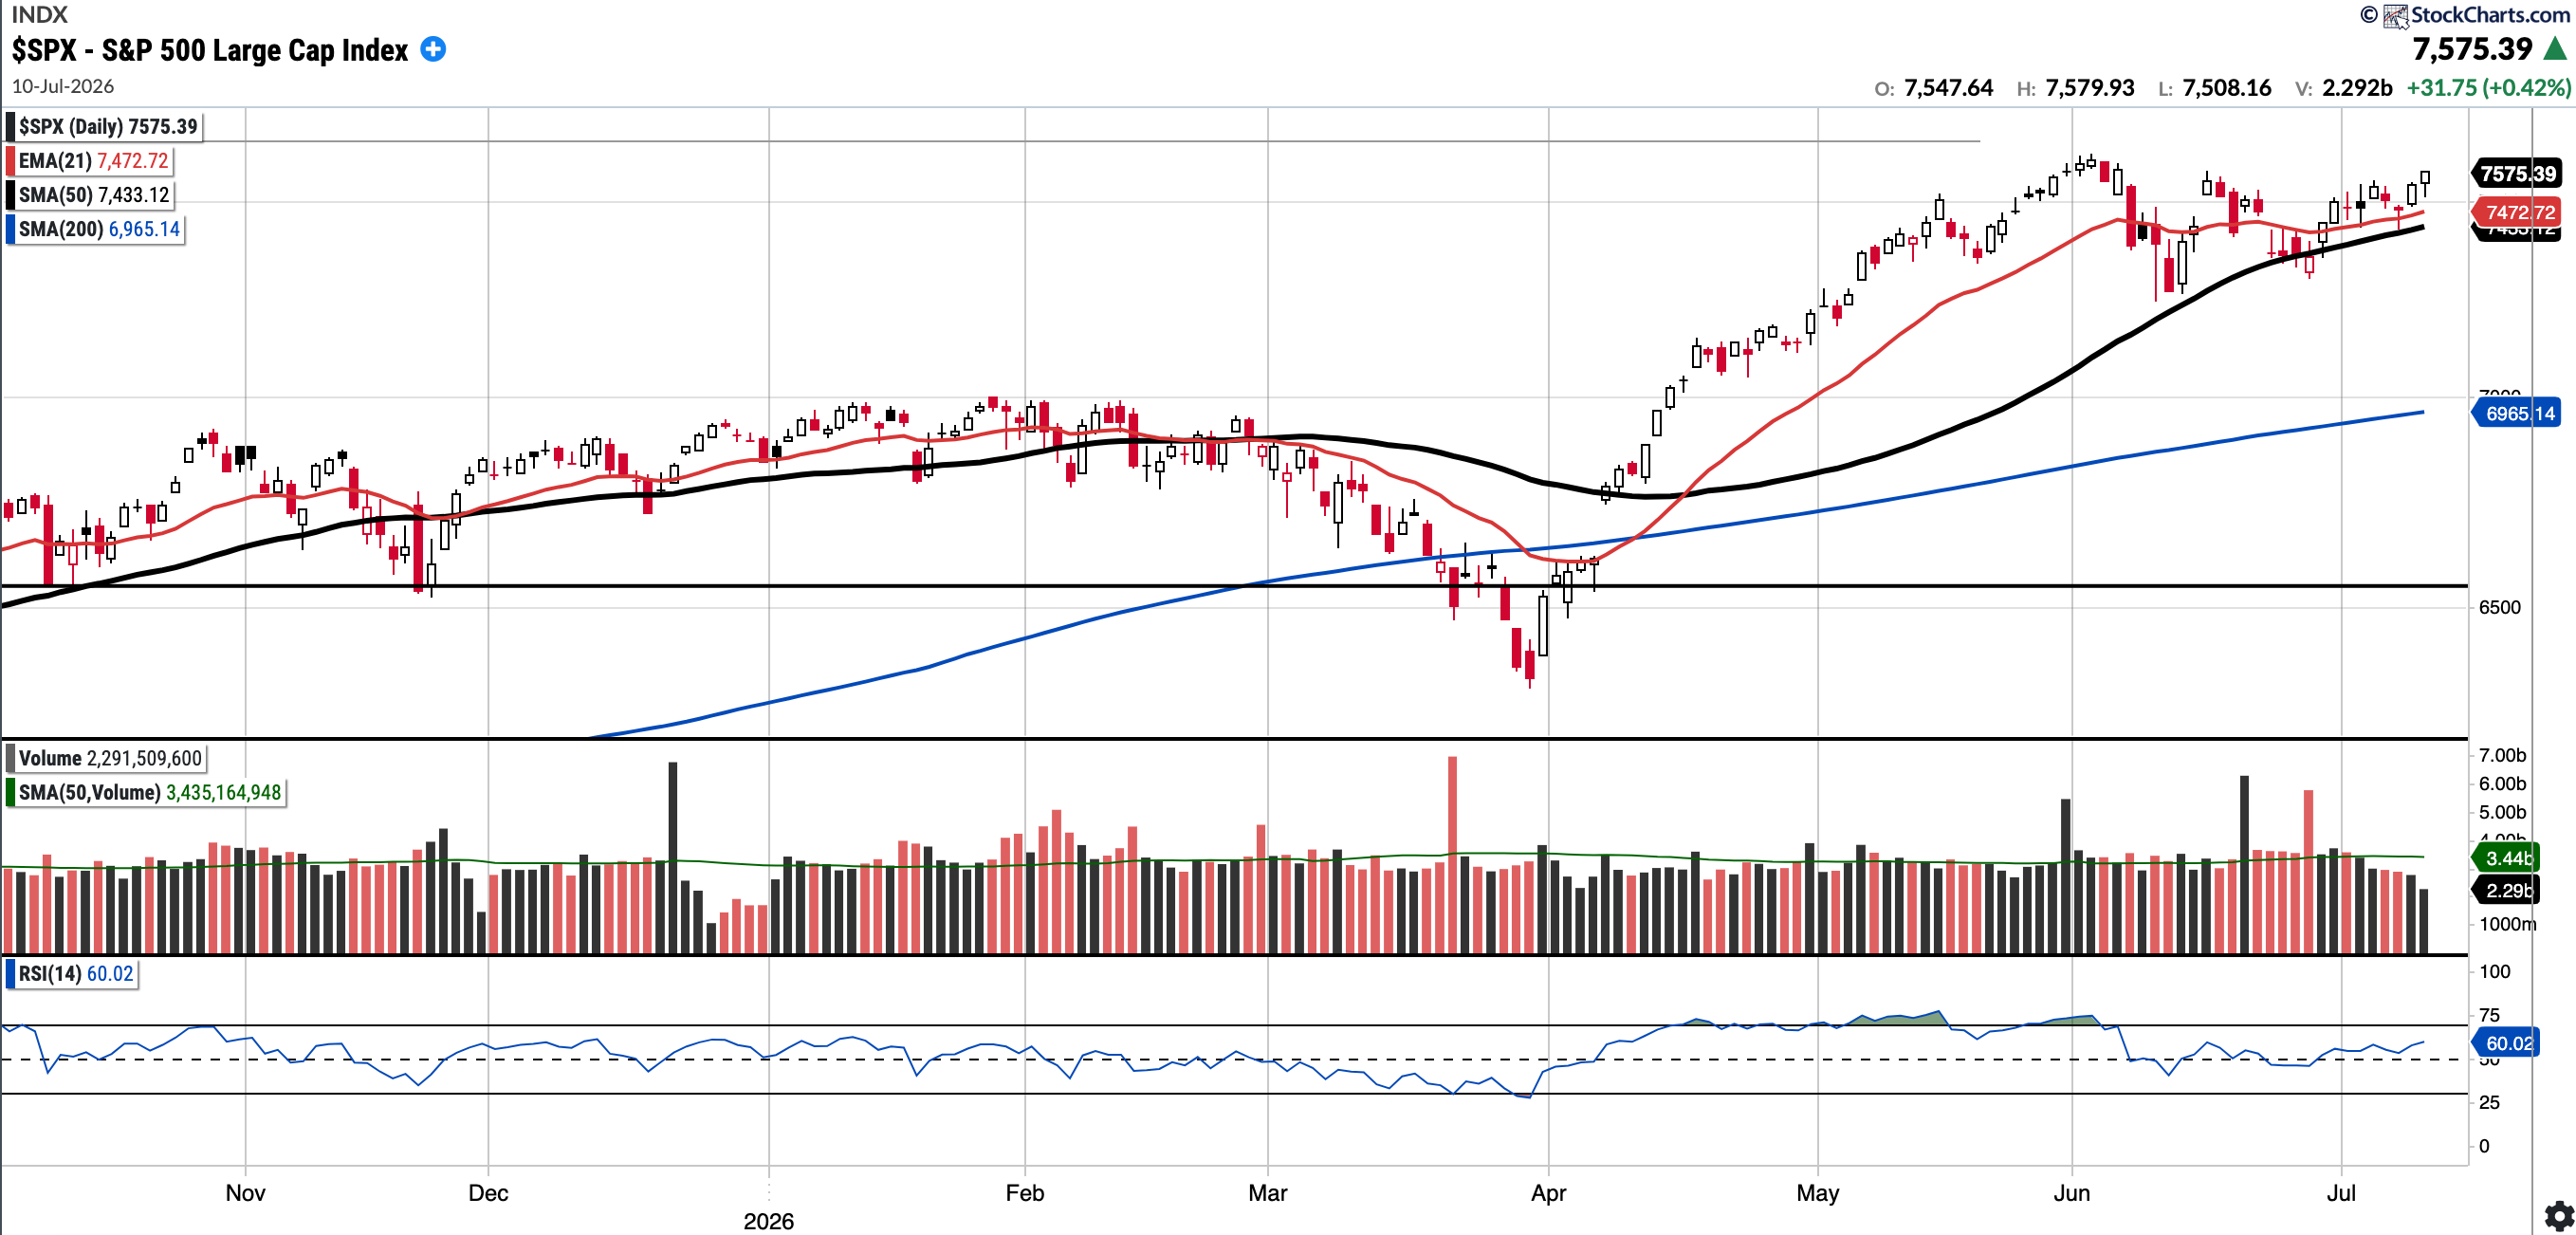
Currently trades at 7,575.39, 1.91% above the 50SMA and 8.76% above the 200SMA.
RSI 60.02
10.45% YTD
Distribution days in the last week: 0
The S&P 500 closed the week comfortably above all moving averages.
COMPQ
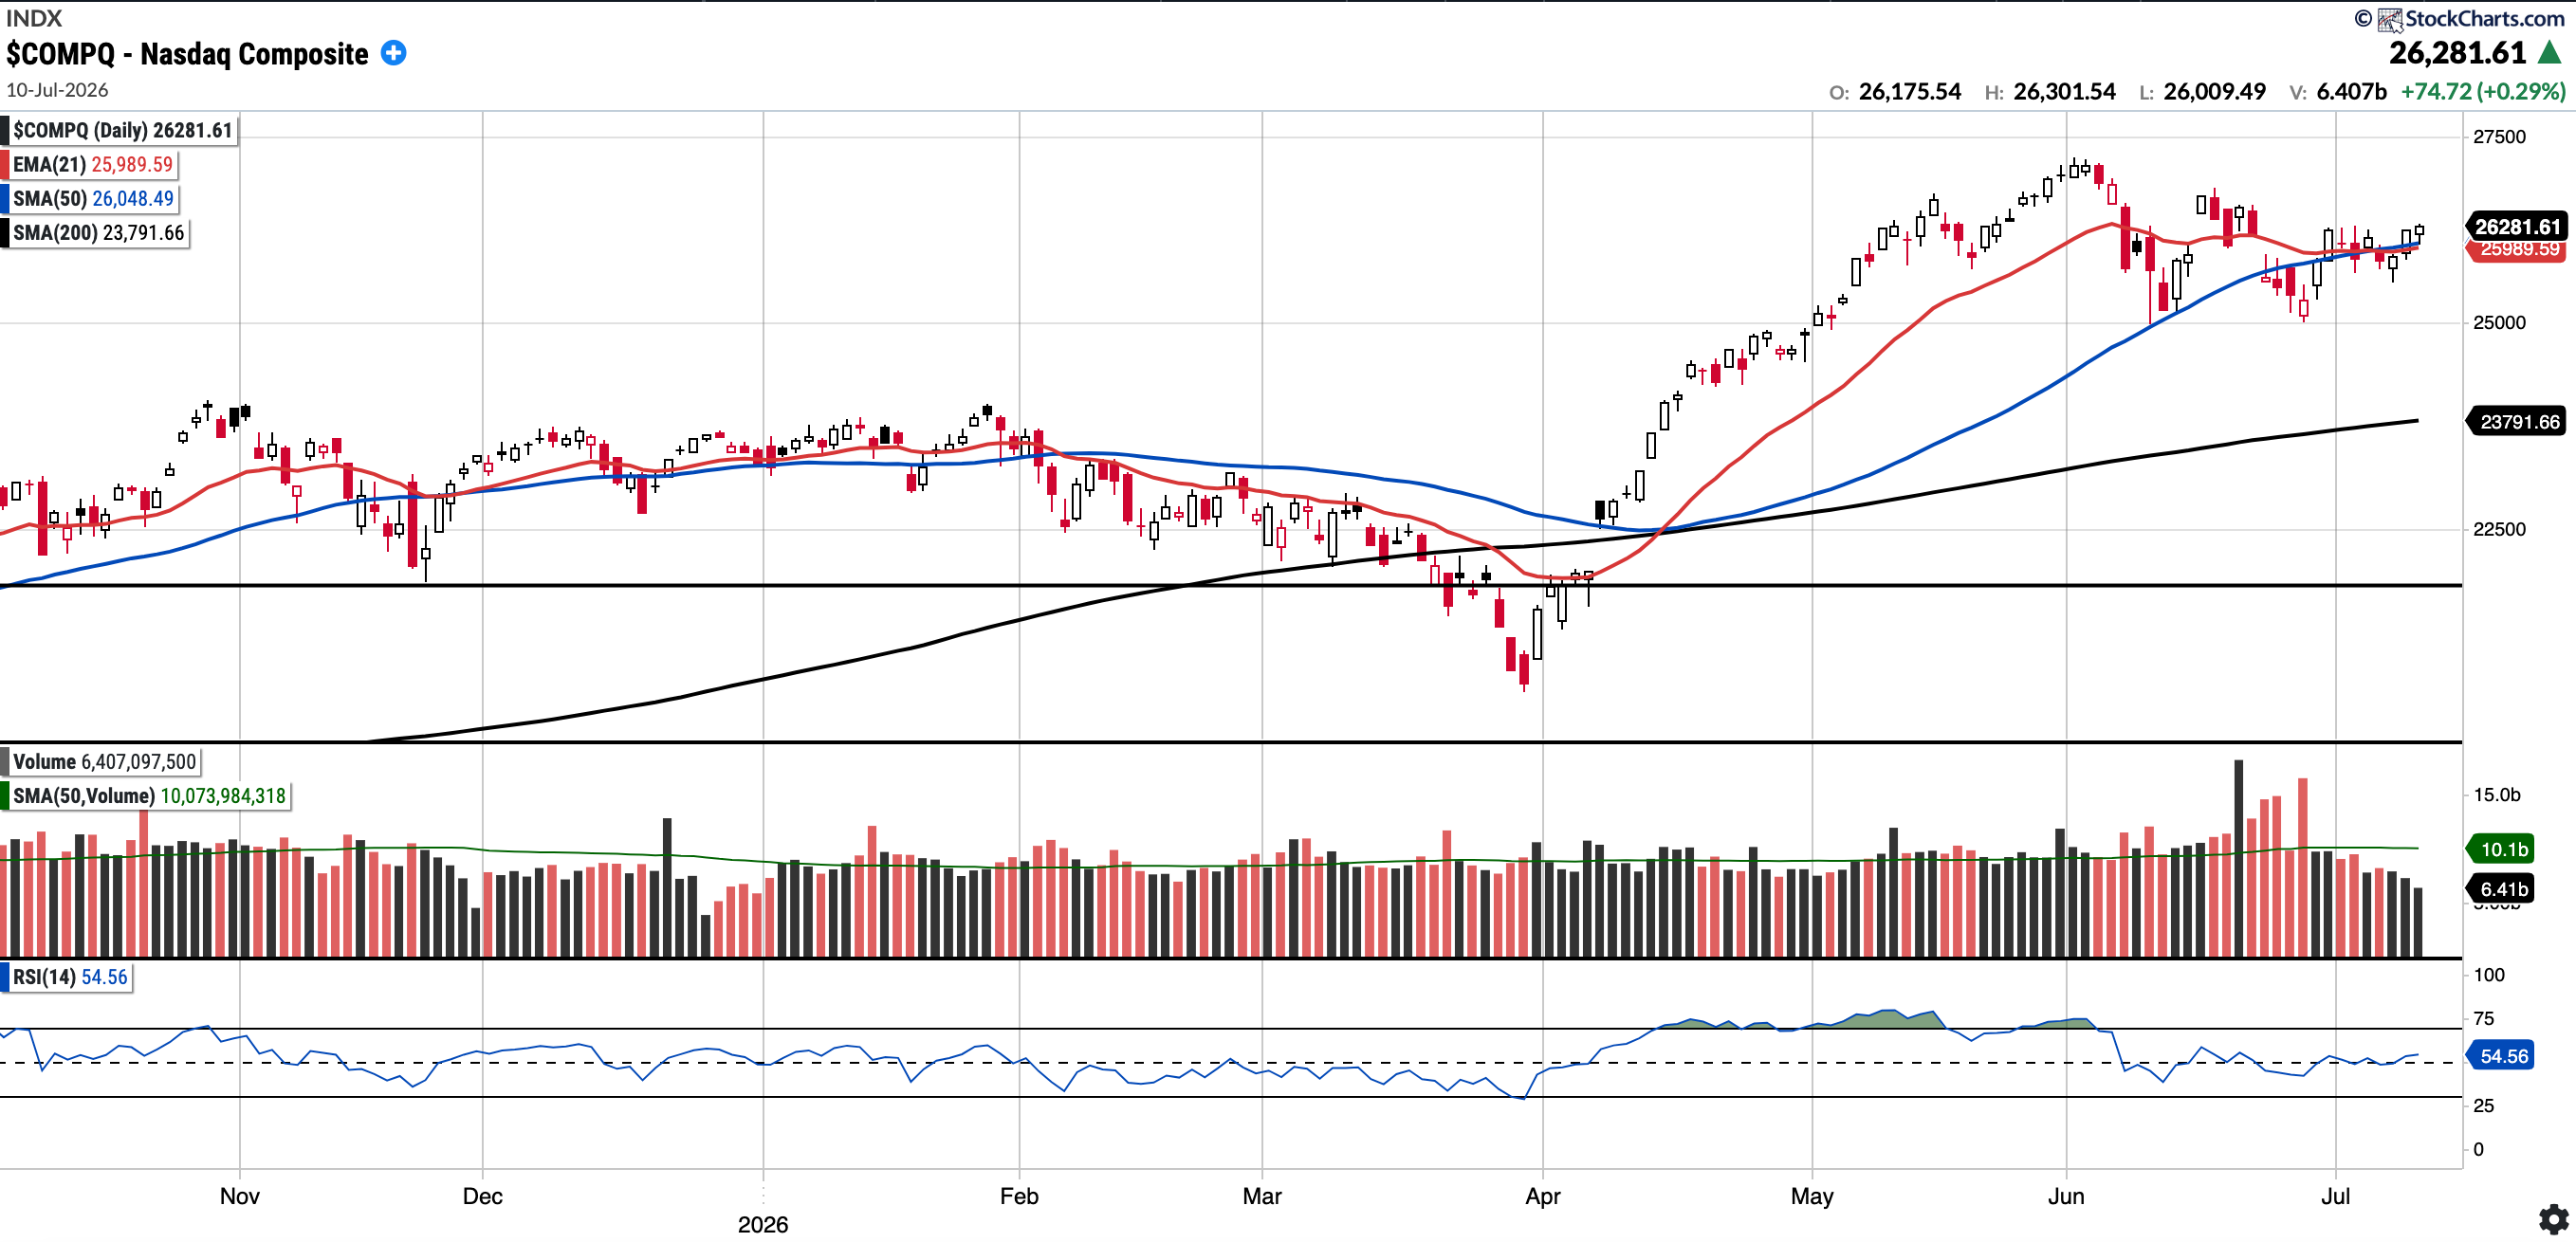
Currently trades at 26,281.61, 0.89% above the 50SMA and 10.47% above the 200SMA.
RSI 54.56
13.11% YTD
Distribution days in the last week: 1
The Nasdaq Composite closed above the 21-day EMA and the 50 SMA for the first time in three weeks.
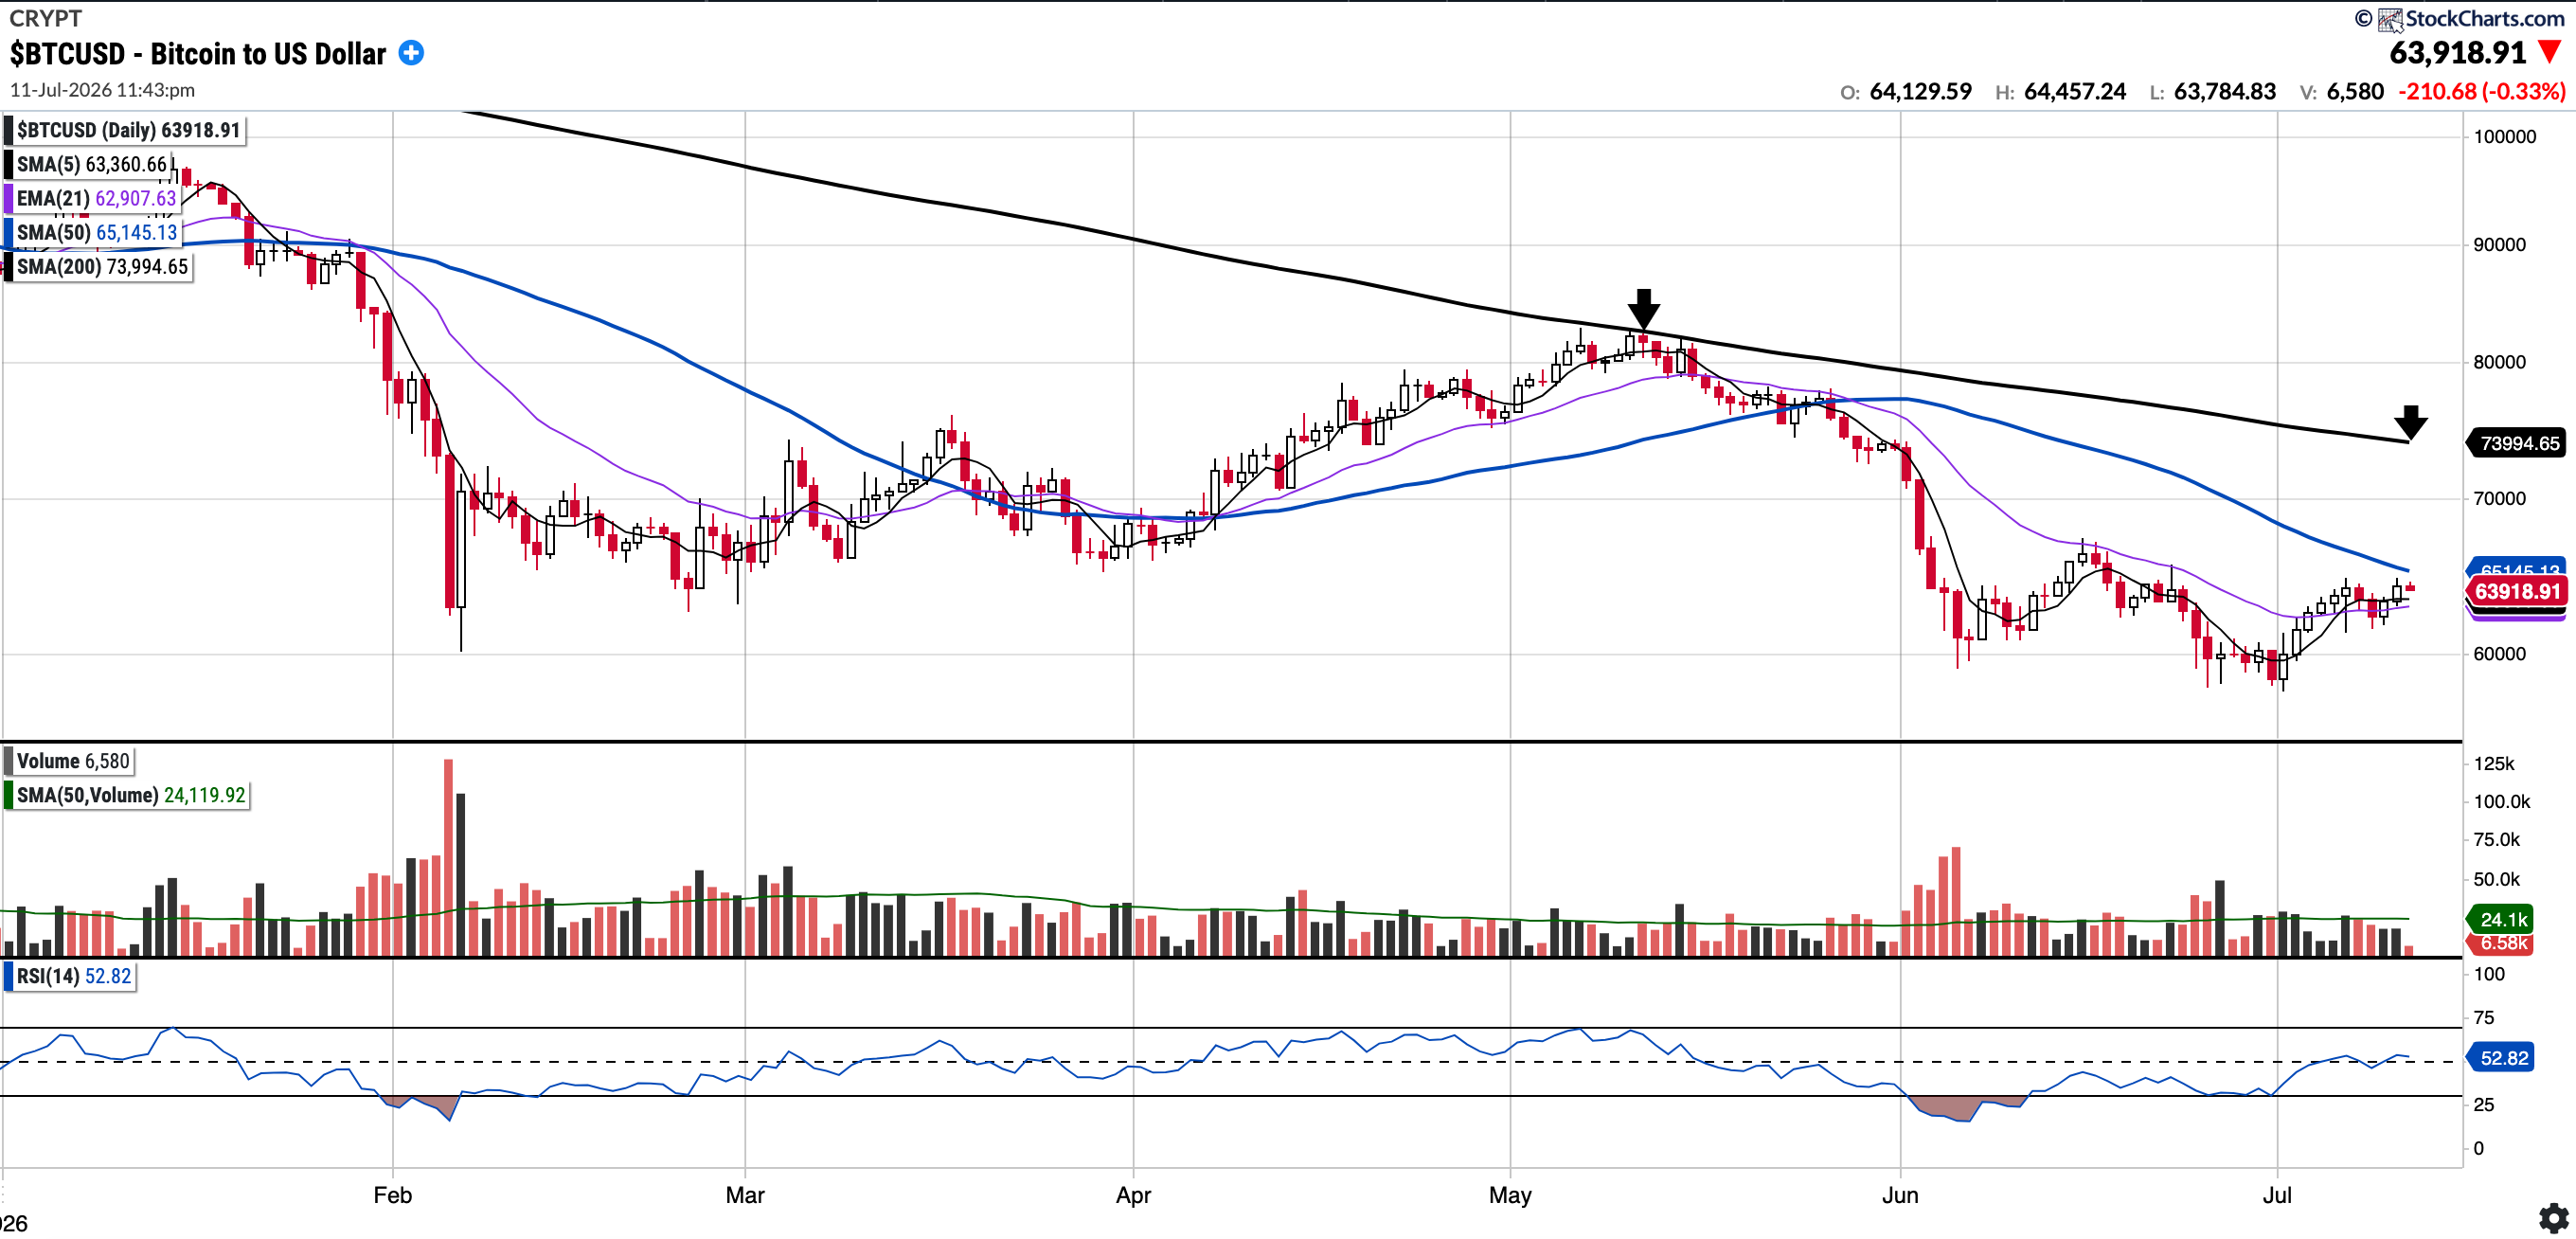
BTC (currently Long)
Currently trades at $62,819.80, 1.88% below the 50SMA and 13.62% below the 200SMA.
RSI 48.91
-26.97% YTD.
The U.S. Senate Banking Committee advanced the Digital Asset Market Clarity Act to the full Senate in a bipartisan 15–9 vote a few weeks ago. Yet, despite this regulatory progress, BTC was firmly rejected at its 200-day moving average and has traded down since.
As of Sunday, July 12th at 00:54 BST, BTC is trading at 63,918.
From a technical perspective, BTC is trading below the 50- and 200-day SMAs, but above the 21-day EMA. BTC did print a 5/21 EMA cross, which is a positive sign. Bulls will want to see the 200-week MA hold, followed by a reclaim of the overhead moving averages. On the upside, $74,000 is also a key level that currently aligns with the 200-day SMA, an area that previously served as resistance.
EEM
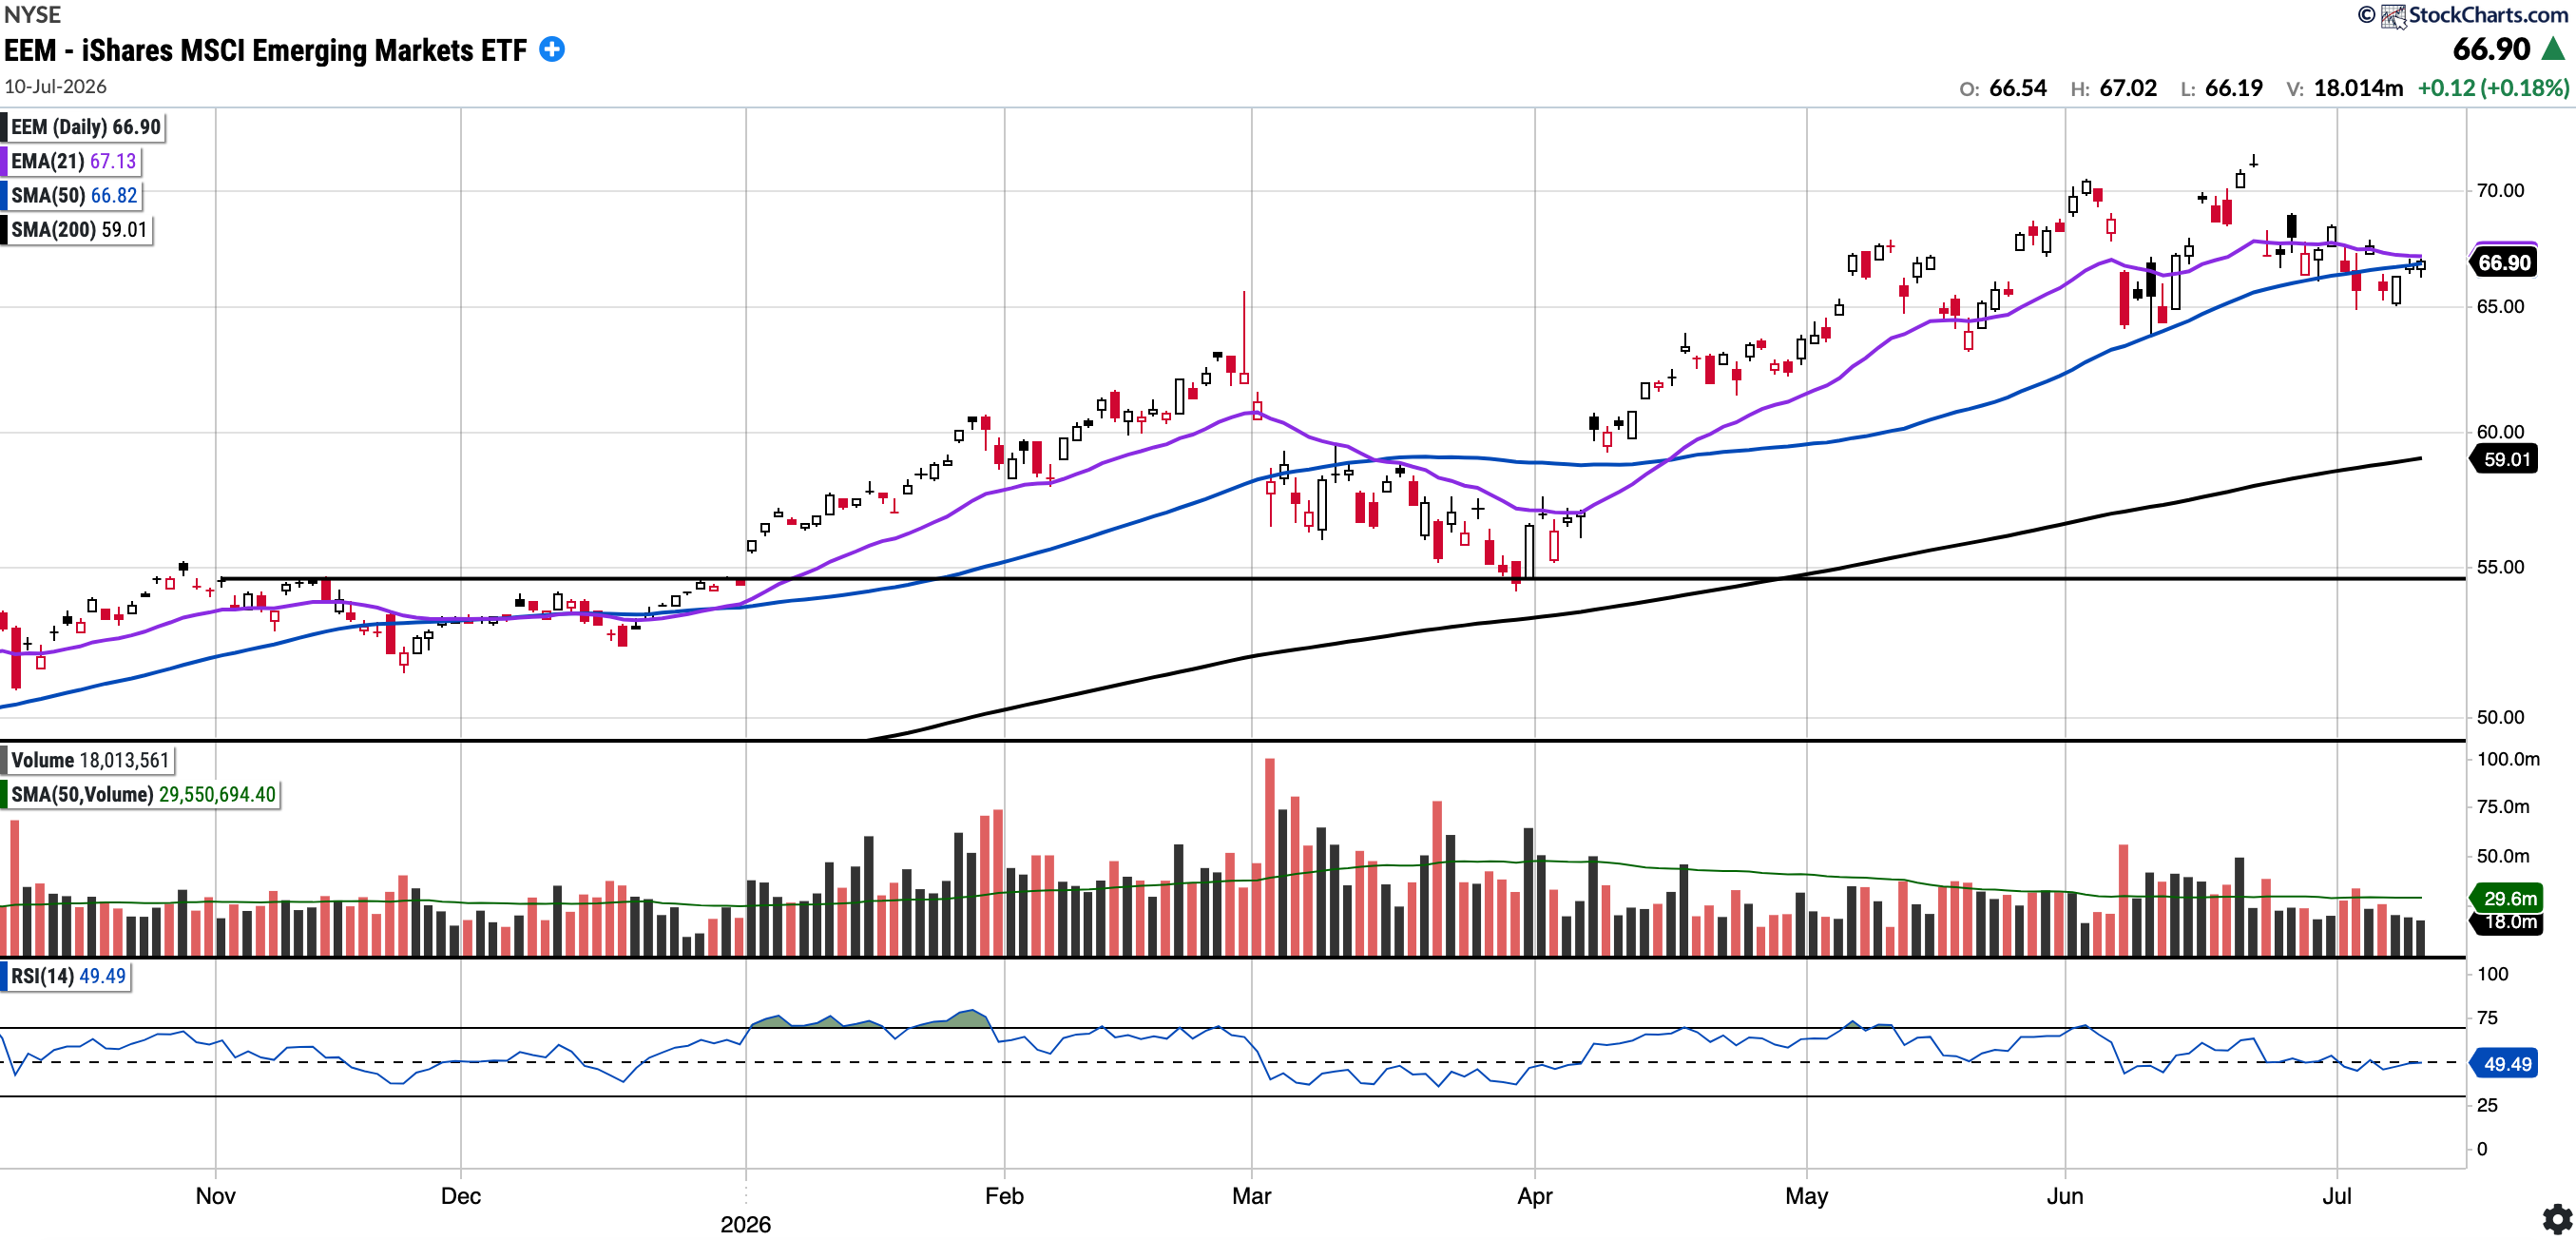
Currently trades at $66.90, 0.12% above the 50SMA and 13.38% above the 200SMA
RSI 44.83
+19.57% YTD
EEM remains in a strong uptrend and continues to comfortably outperform U.S. indices by more than 900 bps year-to-date.
EEM closed last week below both the 21 EMA and the 50 SMA for the first time since March, however this week it did reclaim the 50 day though remains below the 21 day moving average. Bulls would like to see the 21 EMA reclaimed.
I do believe emerging markets could setting up for multi-year outperformance; hence, I continue to watch them closely. If it can pull in further to the 200 day, I may be positioning long in a related ETF. One point worth noting regarding the EEM ETF is that it may not be the best representative of emerging markets as a whole, given that TSMC, Samsung, and SK Hynix make up roughly 30% of the fund.
GOLD (Long Physical)
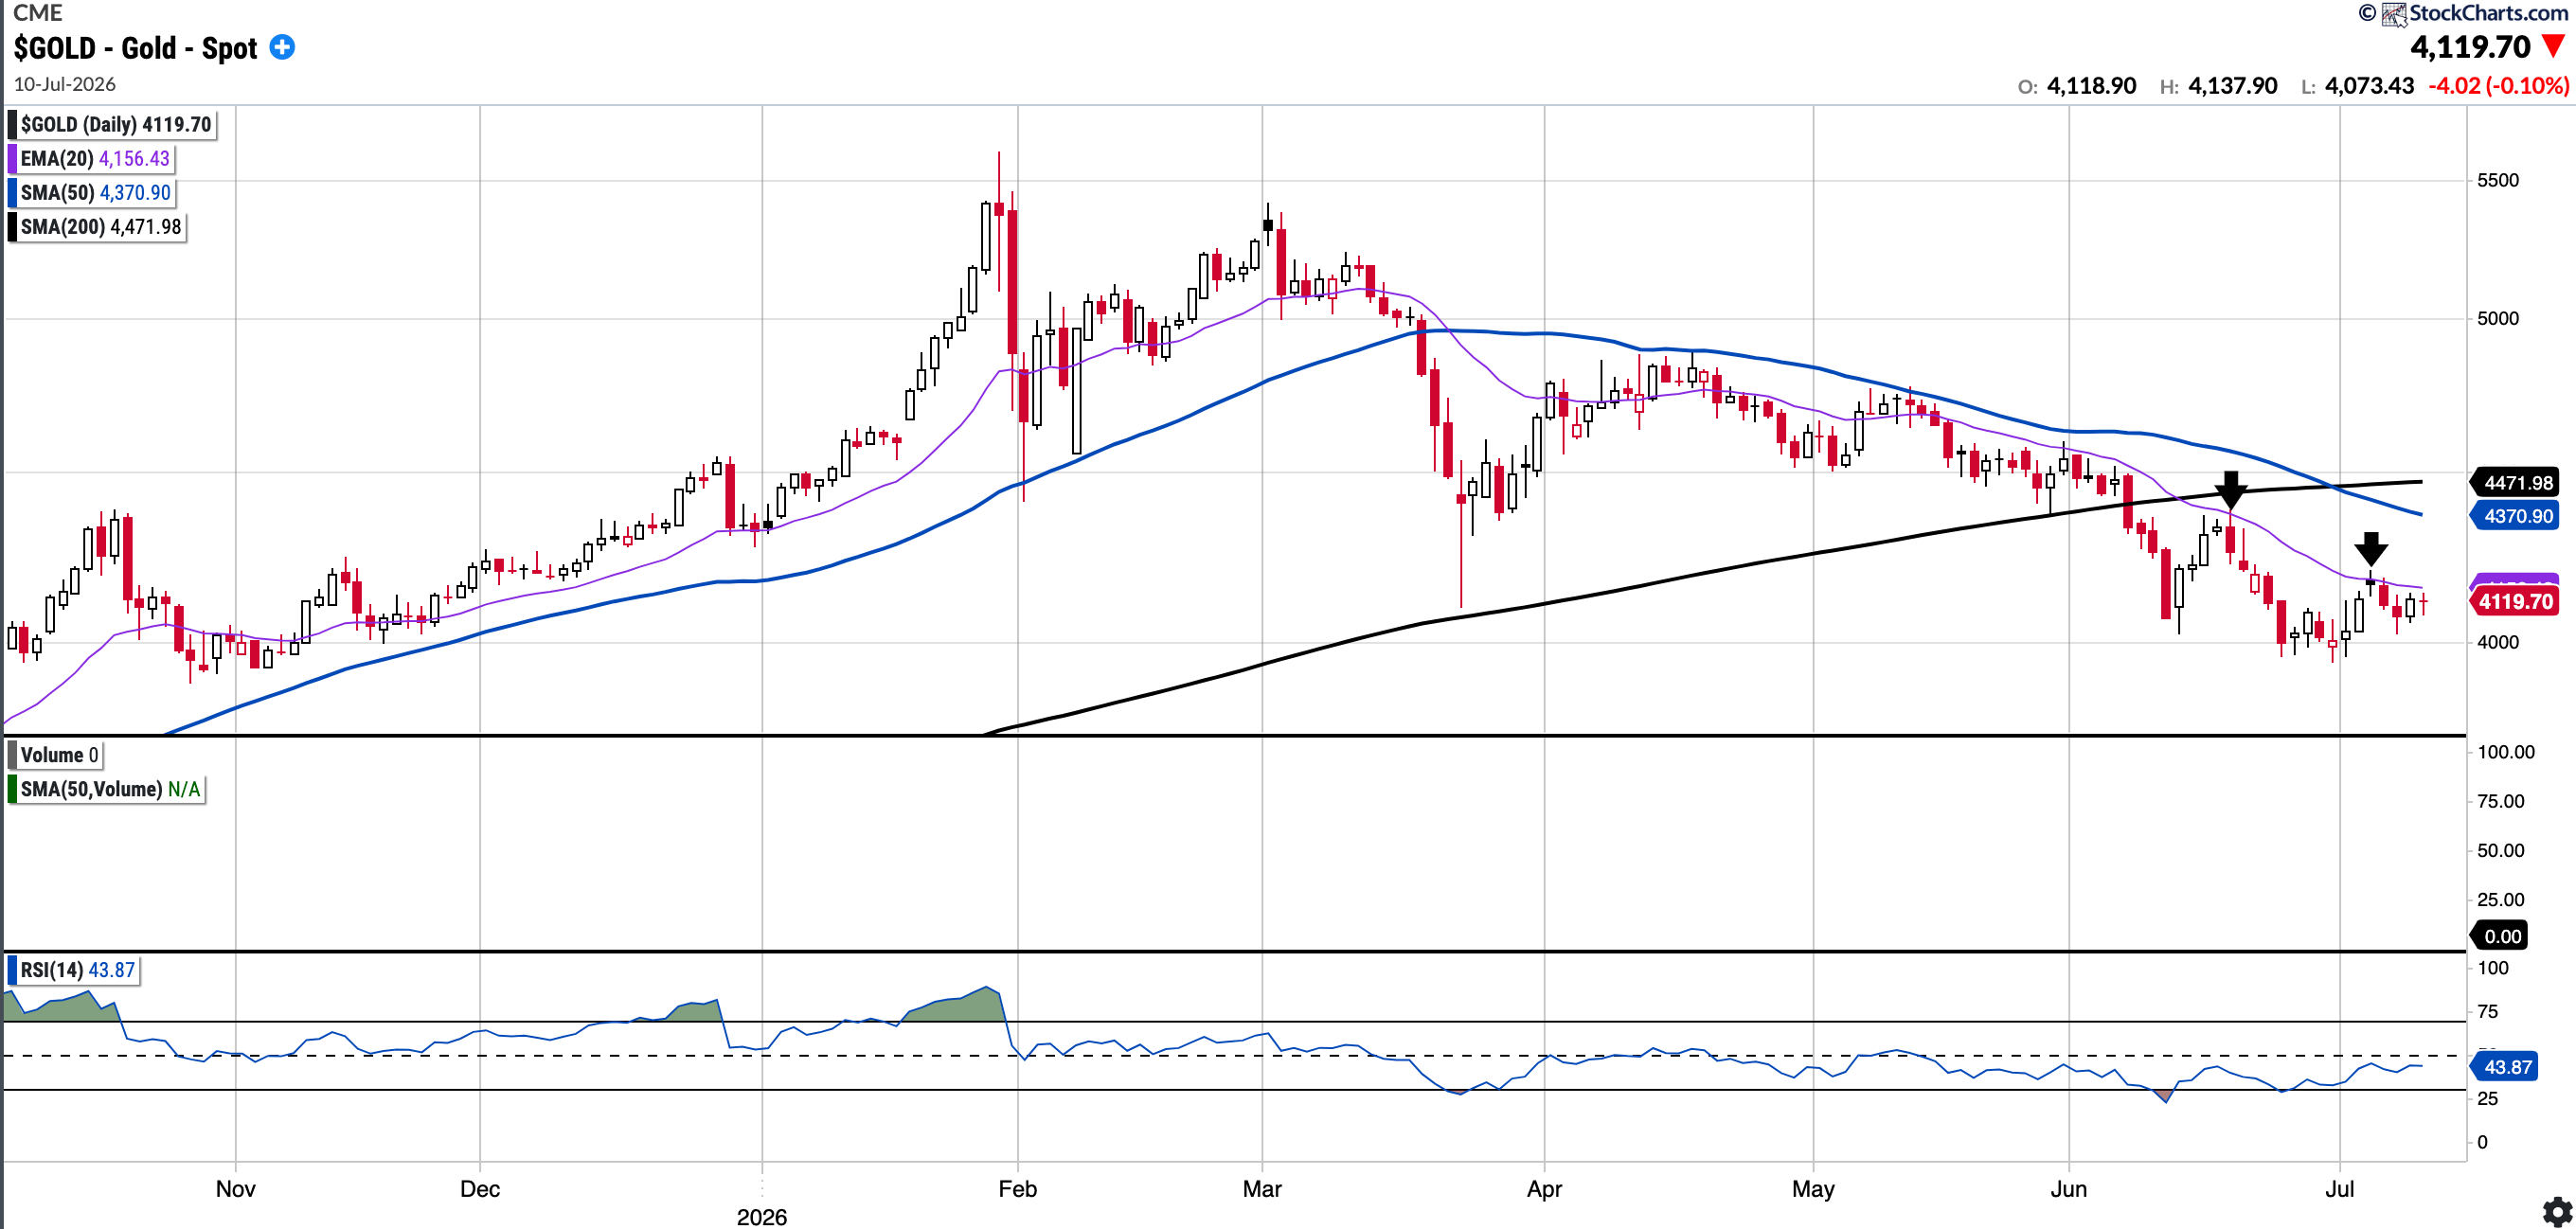
Currently trades at $4,119.70, 5.75% below the 50SMA and 7.88% below the 200SMA
RSI 43.87
-4.69% YTD
Gold recently lost its 200-day moving average for the first time since its bull run began in late 2023. That is notable, and it becomes more concerning the longer it is not reclaimed.
Gold was rejected at the descending 21-day EMA in mid-June and again twice this week. This is now serving as a clear resistance point. Whilst it is positive that the 4,000 level is holding, bulls will want to see key overhead moving averages reclaimed, starting with the near-term ones. I would be tempted to add some physical if we trade down to the 3,700–3,900 range.
MU
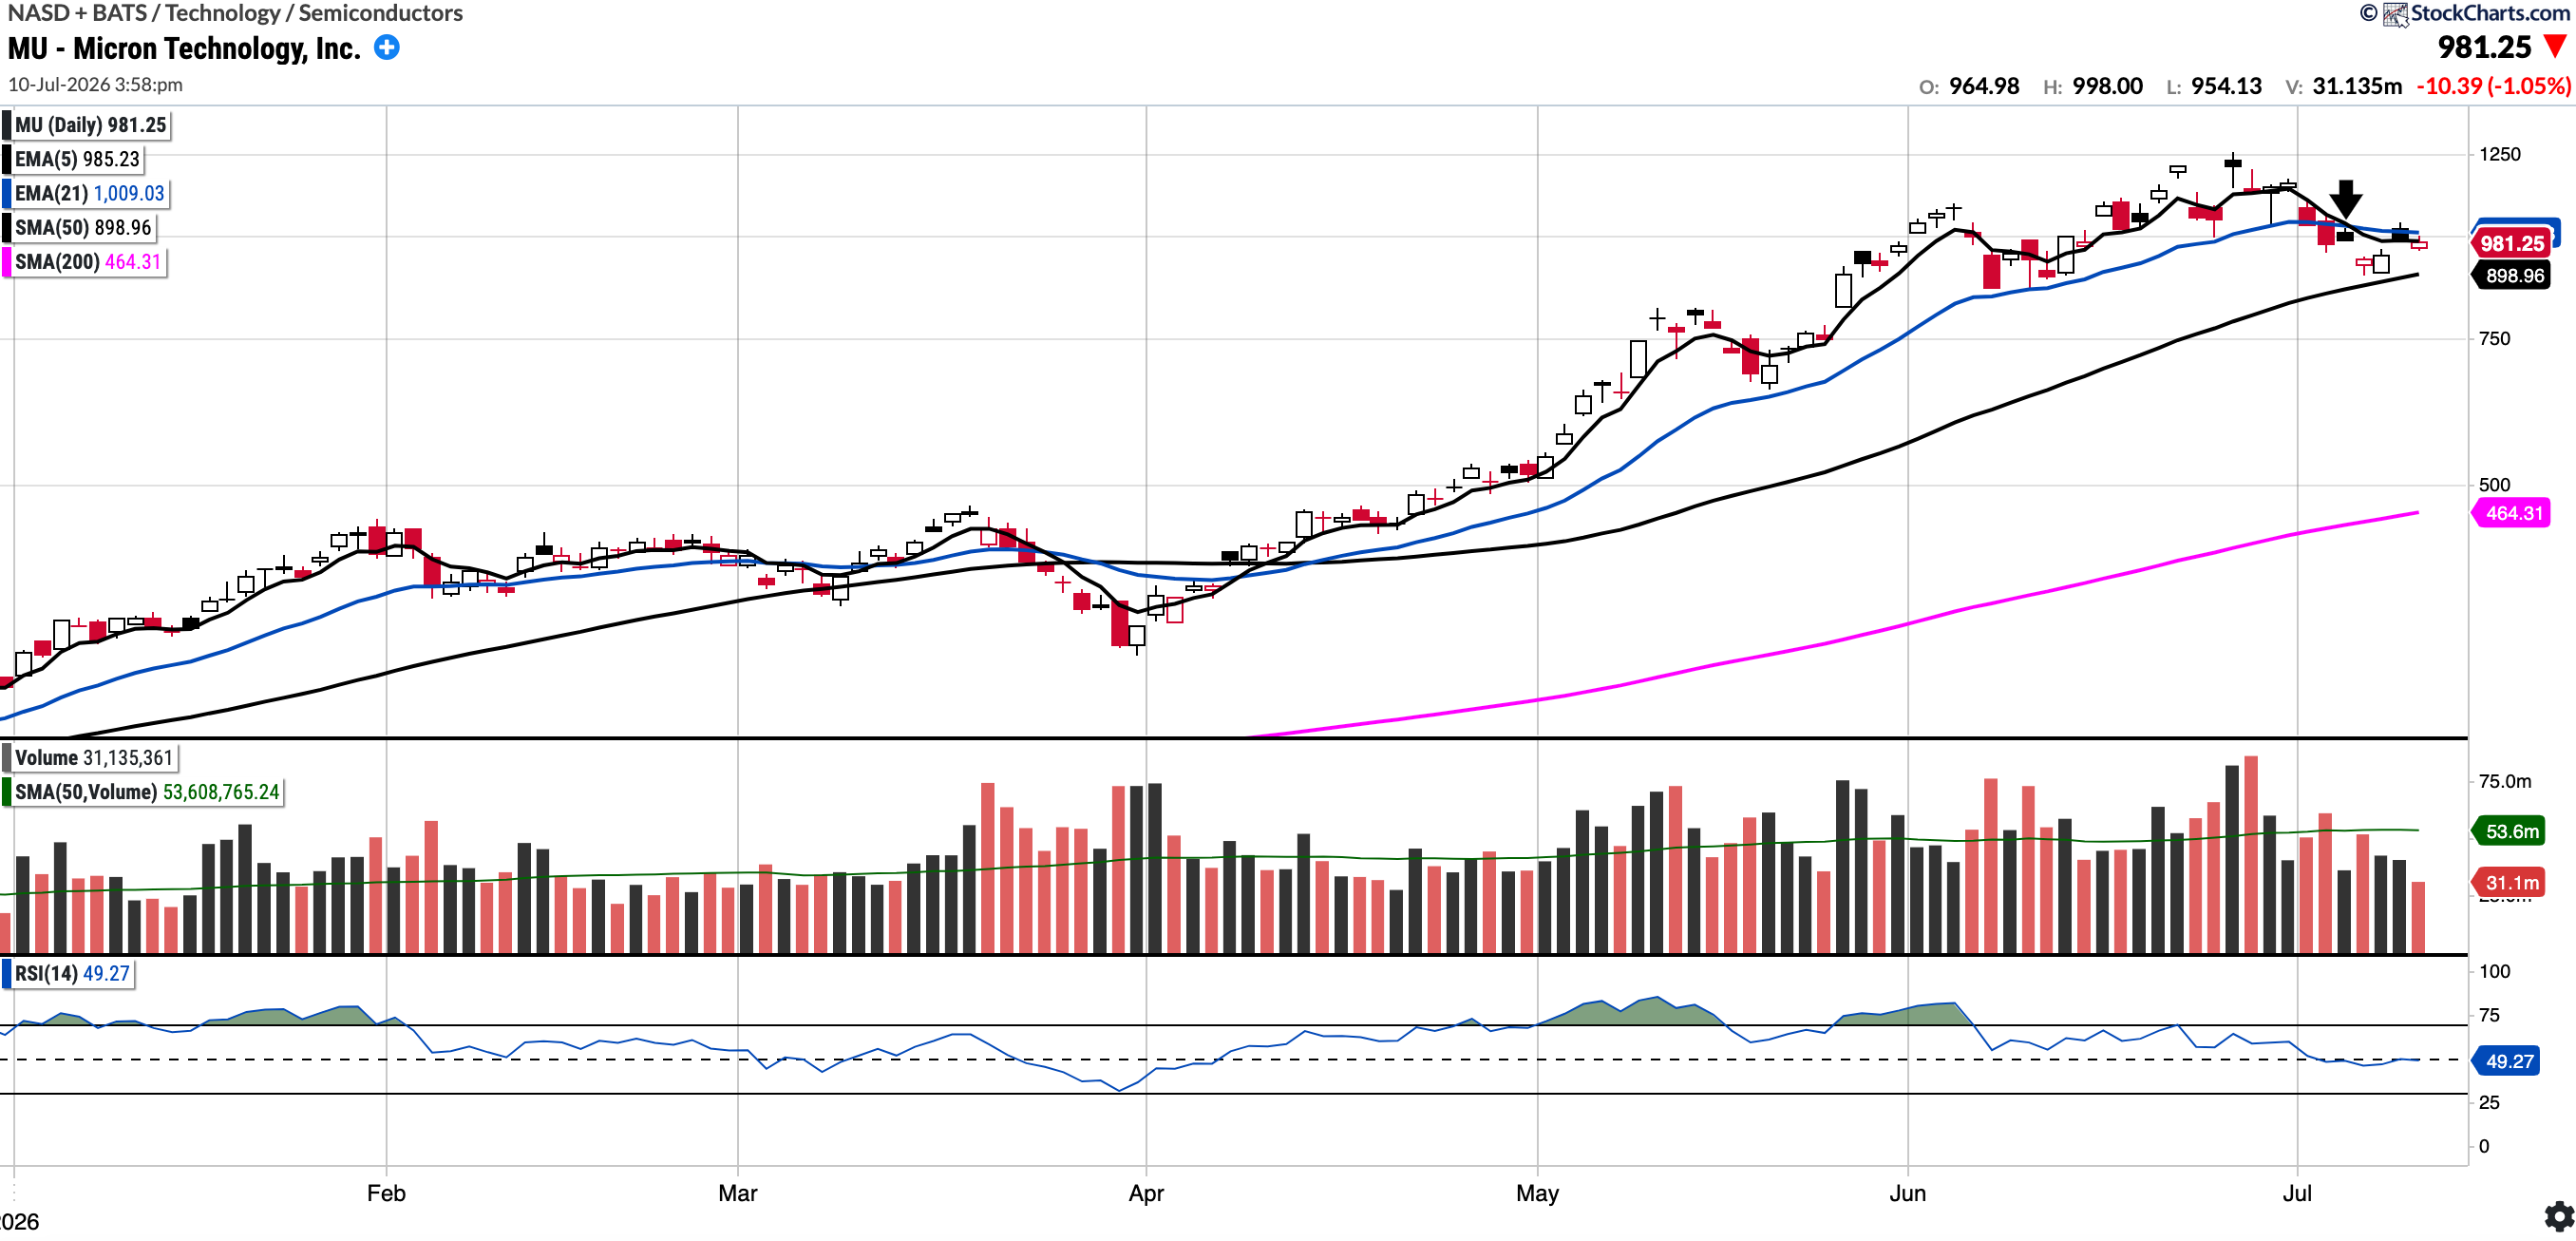
Currently trades at $979.3, 8.94% above the 50SMA and 110.92% above the 200SMA
RSI 48.47
210.65% YTD
MU has been one of the top-performing stocks in the broader market over the last year, appreciating more than 10x.
However, since early June, we can see that high-volume selling has started to take place alongside a bearish divergence. The stock also lost its 21-day EMA last week for the first time since mid-March, and closed below the 21-day EMA again this week. Furthermore, on Monday this week, there was a bearish 5/21 EMA cross (see arrow)—the first instance since the 25th of March.
Bulls will want to see the 21 EMA reclaimed or, if there is further selling, for the ascending 50-day SMA to hold.
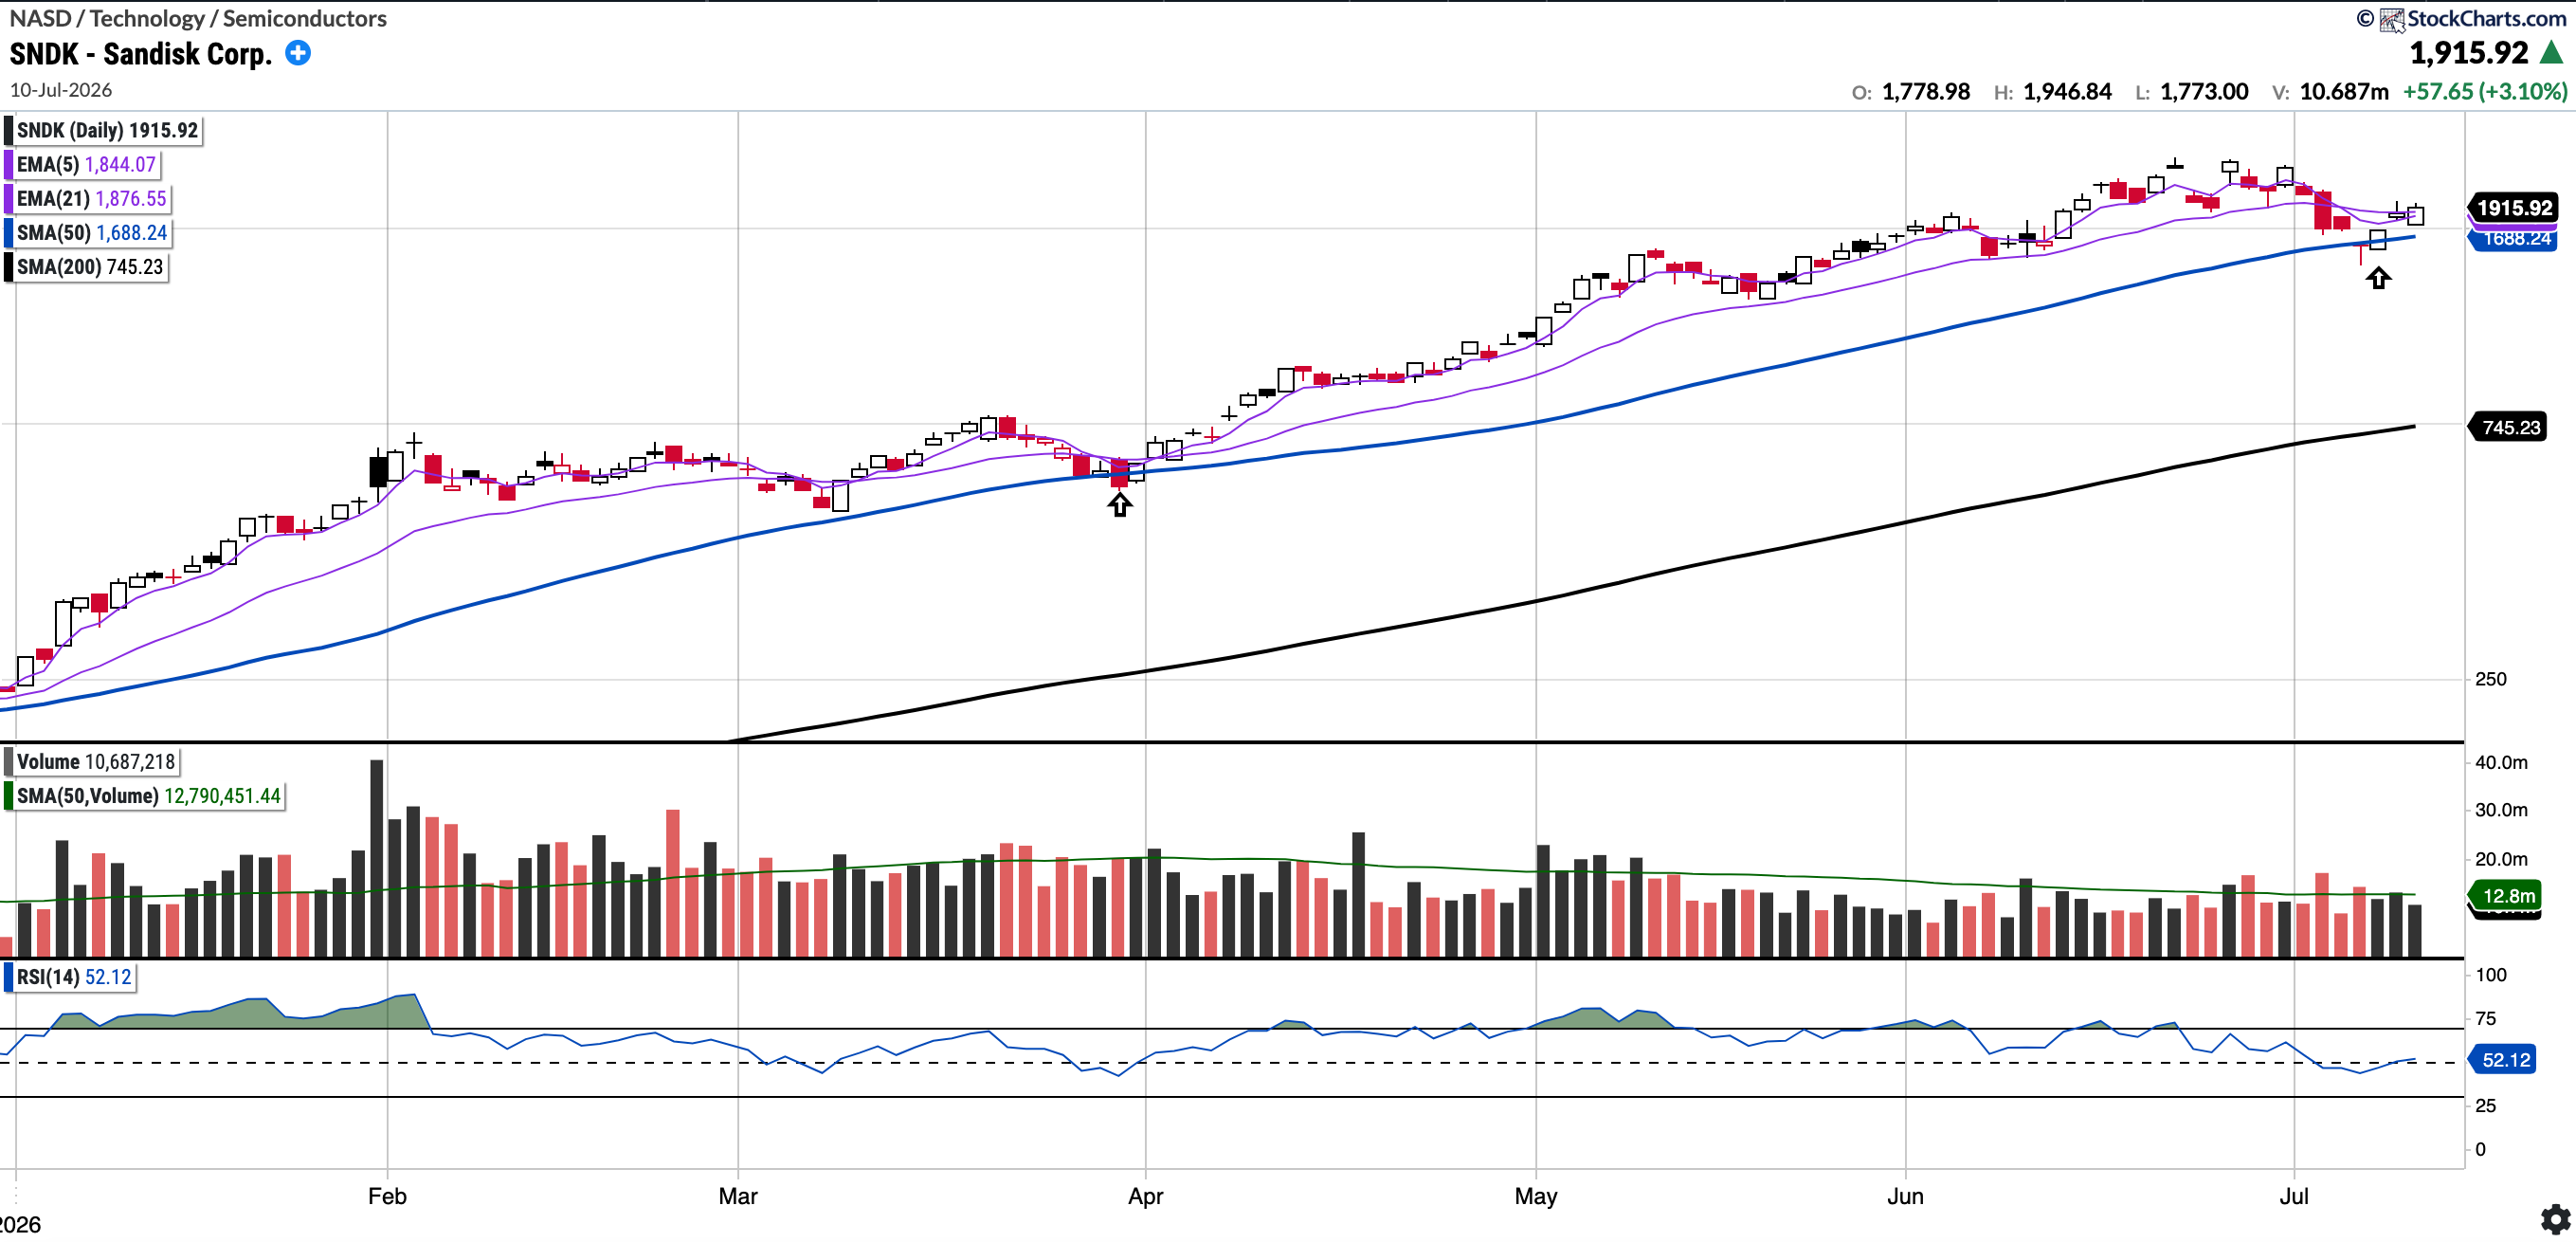
SNDK
Currently trades at $1915.92, 13.49% above the 50SMA and 157.09% above the 200SMA
RSI 48.47
596.09% YTD
SNDK did trade down to the 50-day SMA, which it held, and closed the week above all key moving averages. In comparison, we saw above that MU was rejected at the 21-day EMA. A retest and hold of the 21-day EMA may offer a strong entry if looking to position long, or conversely, one could wait for another retest of the 50-day SMA.
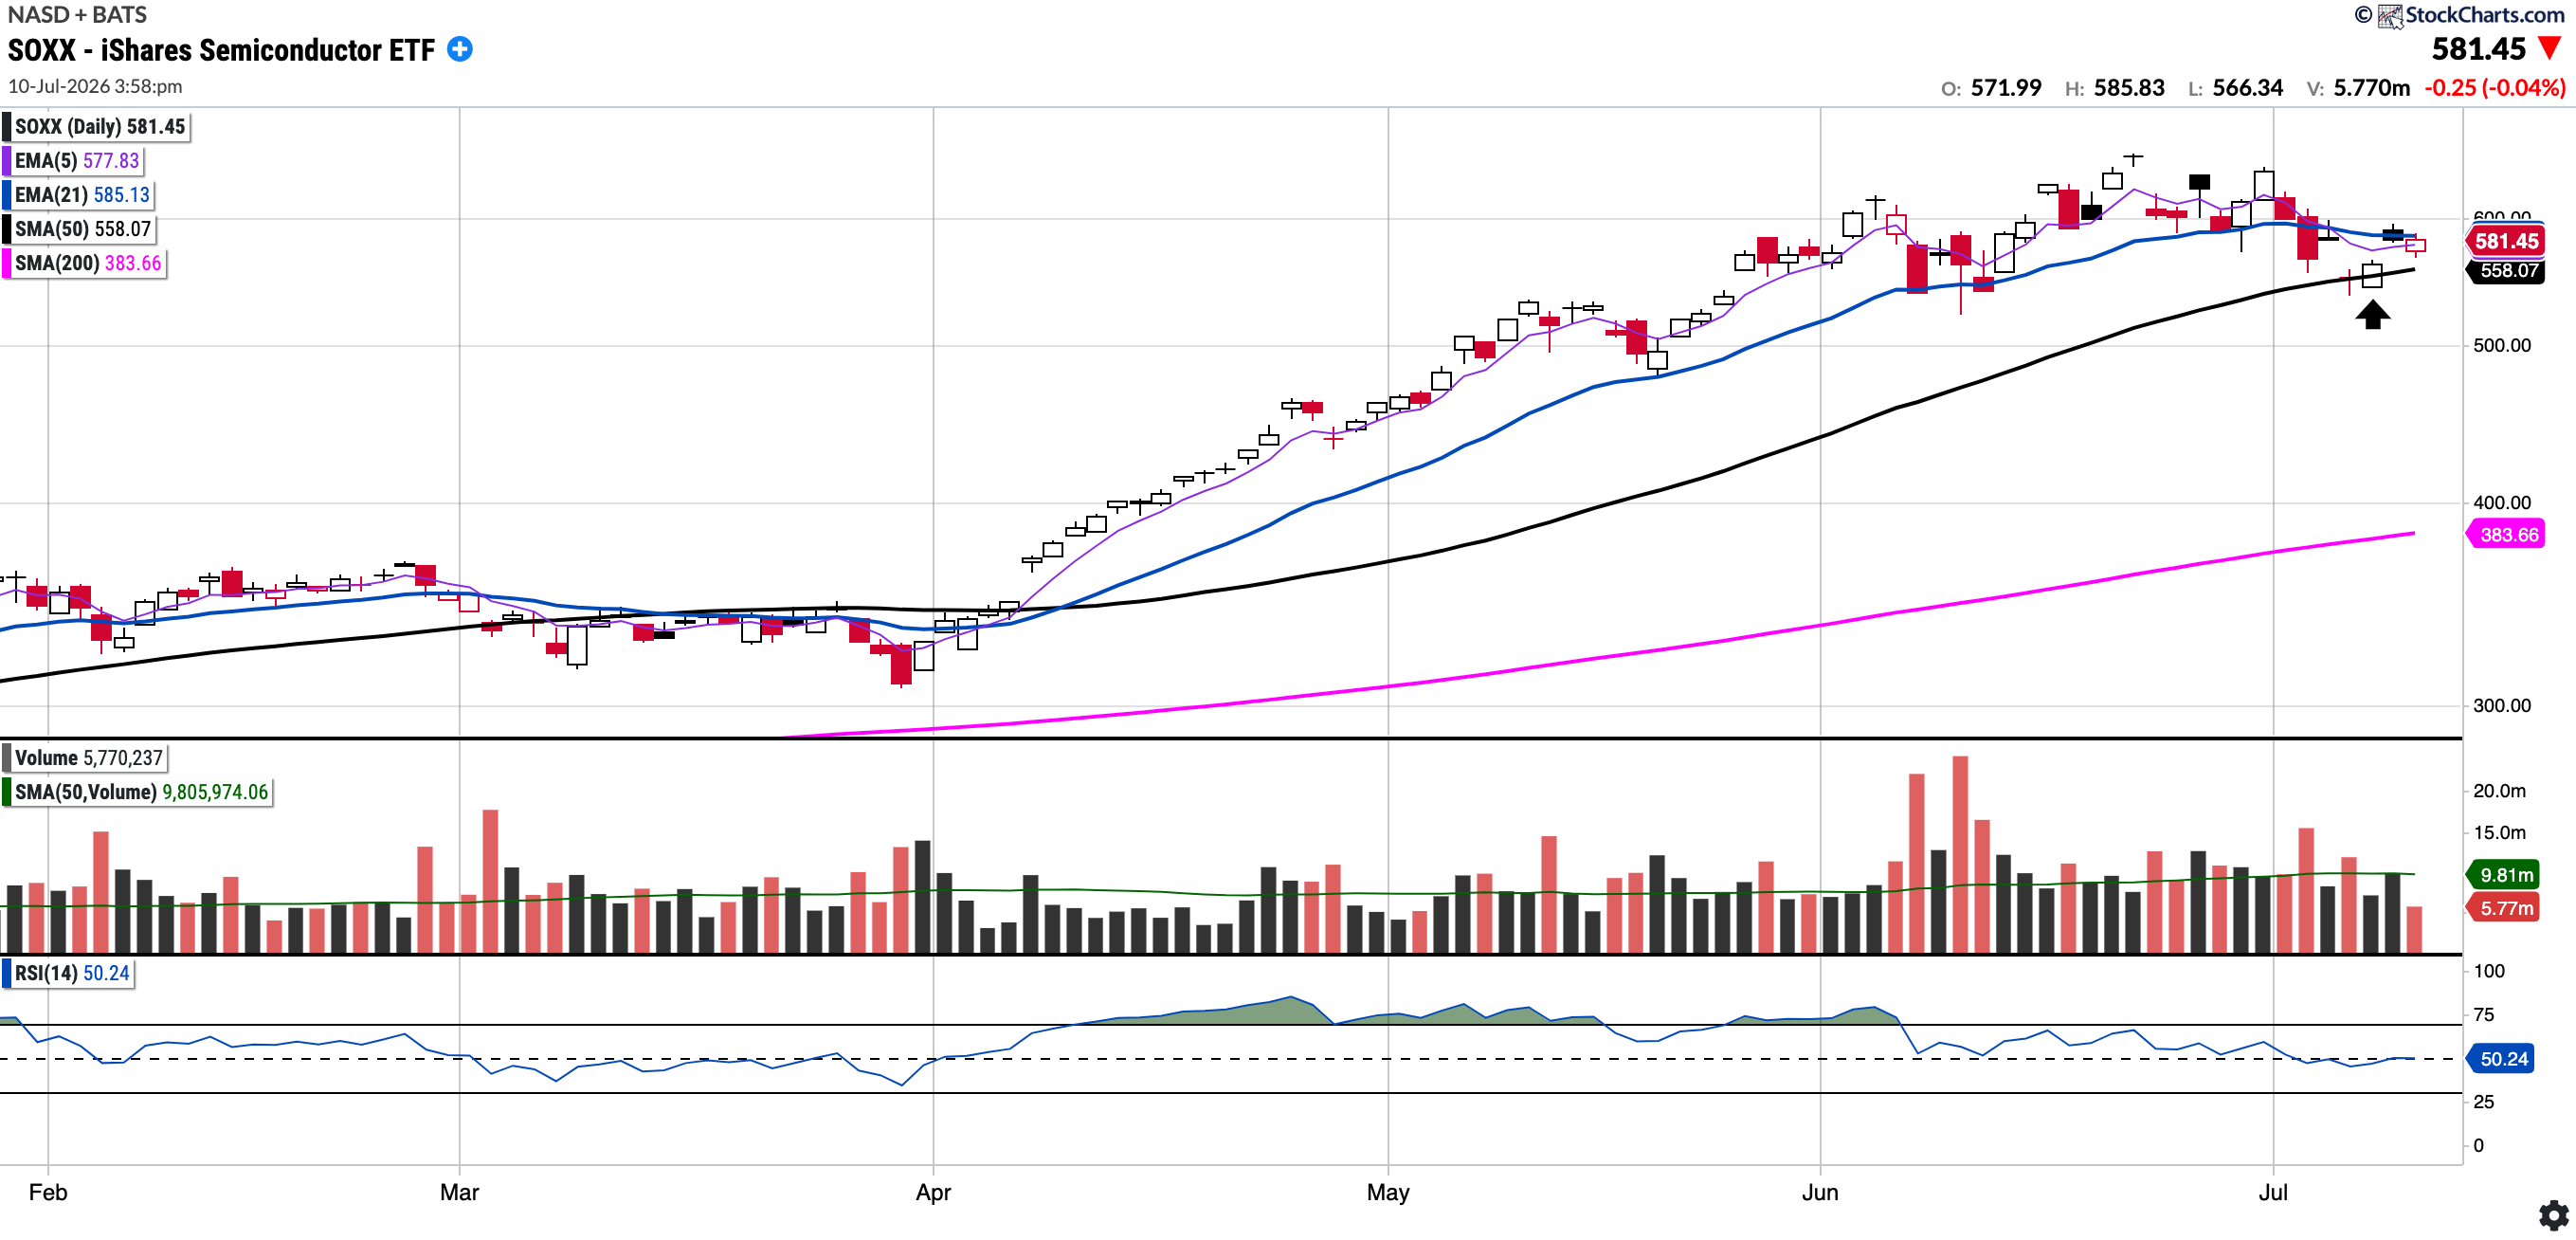
SOXX
Currently trades at $581.34, 4.17% above the 50SMA and 51.52% above the 200SMA
RSI 47.32
85.53% YTD
Last week, SOXX broke below its 21-day moving average on above average volume and I had written:
“The semi complex has looked weak over the last few sessions, though it will be interesting to see if semis can turn around or if they are due to consolidate. A retest of the 50-day moving average looks probable at some stage”
This week SOXX did test and hold the SMA 50 (see arrow) though it closes the week below the 21 day moving average. There was also a bearish 5/21 EMA cross on Monday this week which is worth noting.
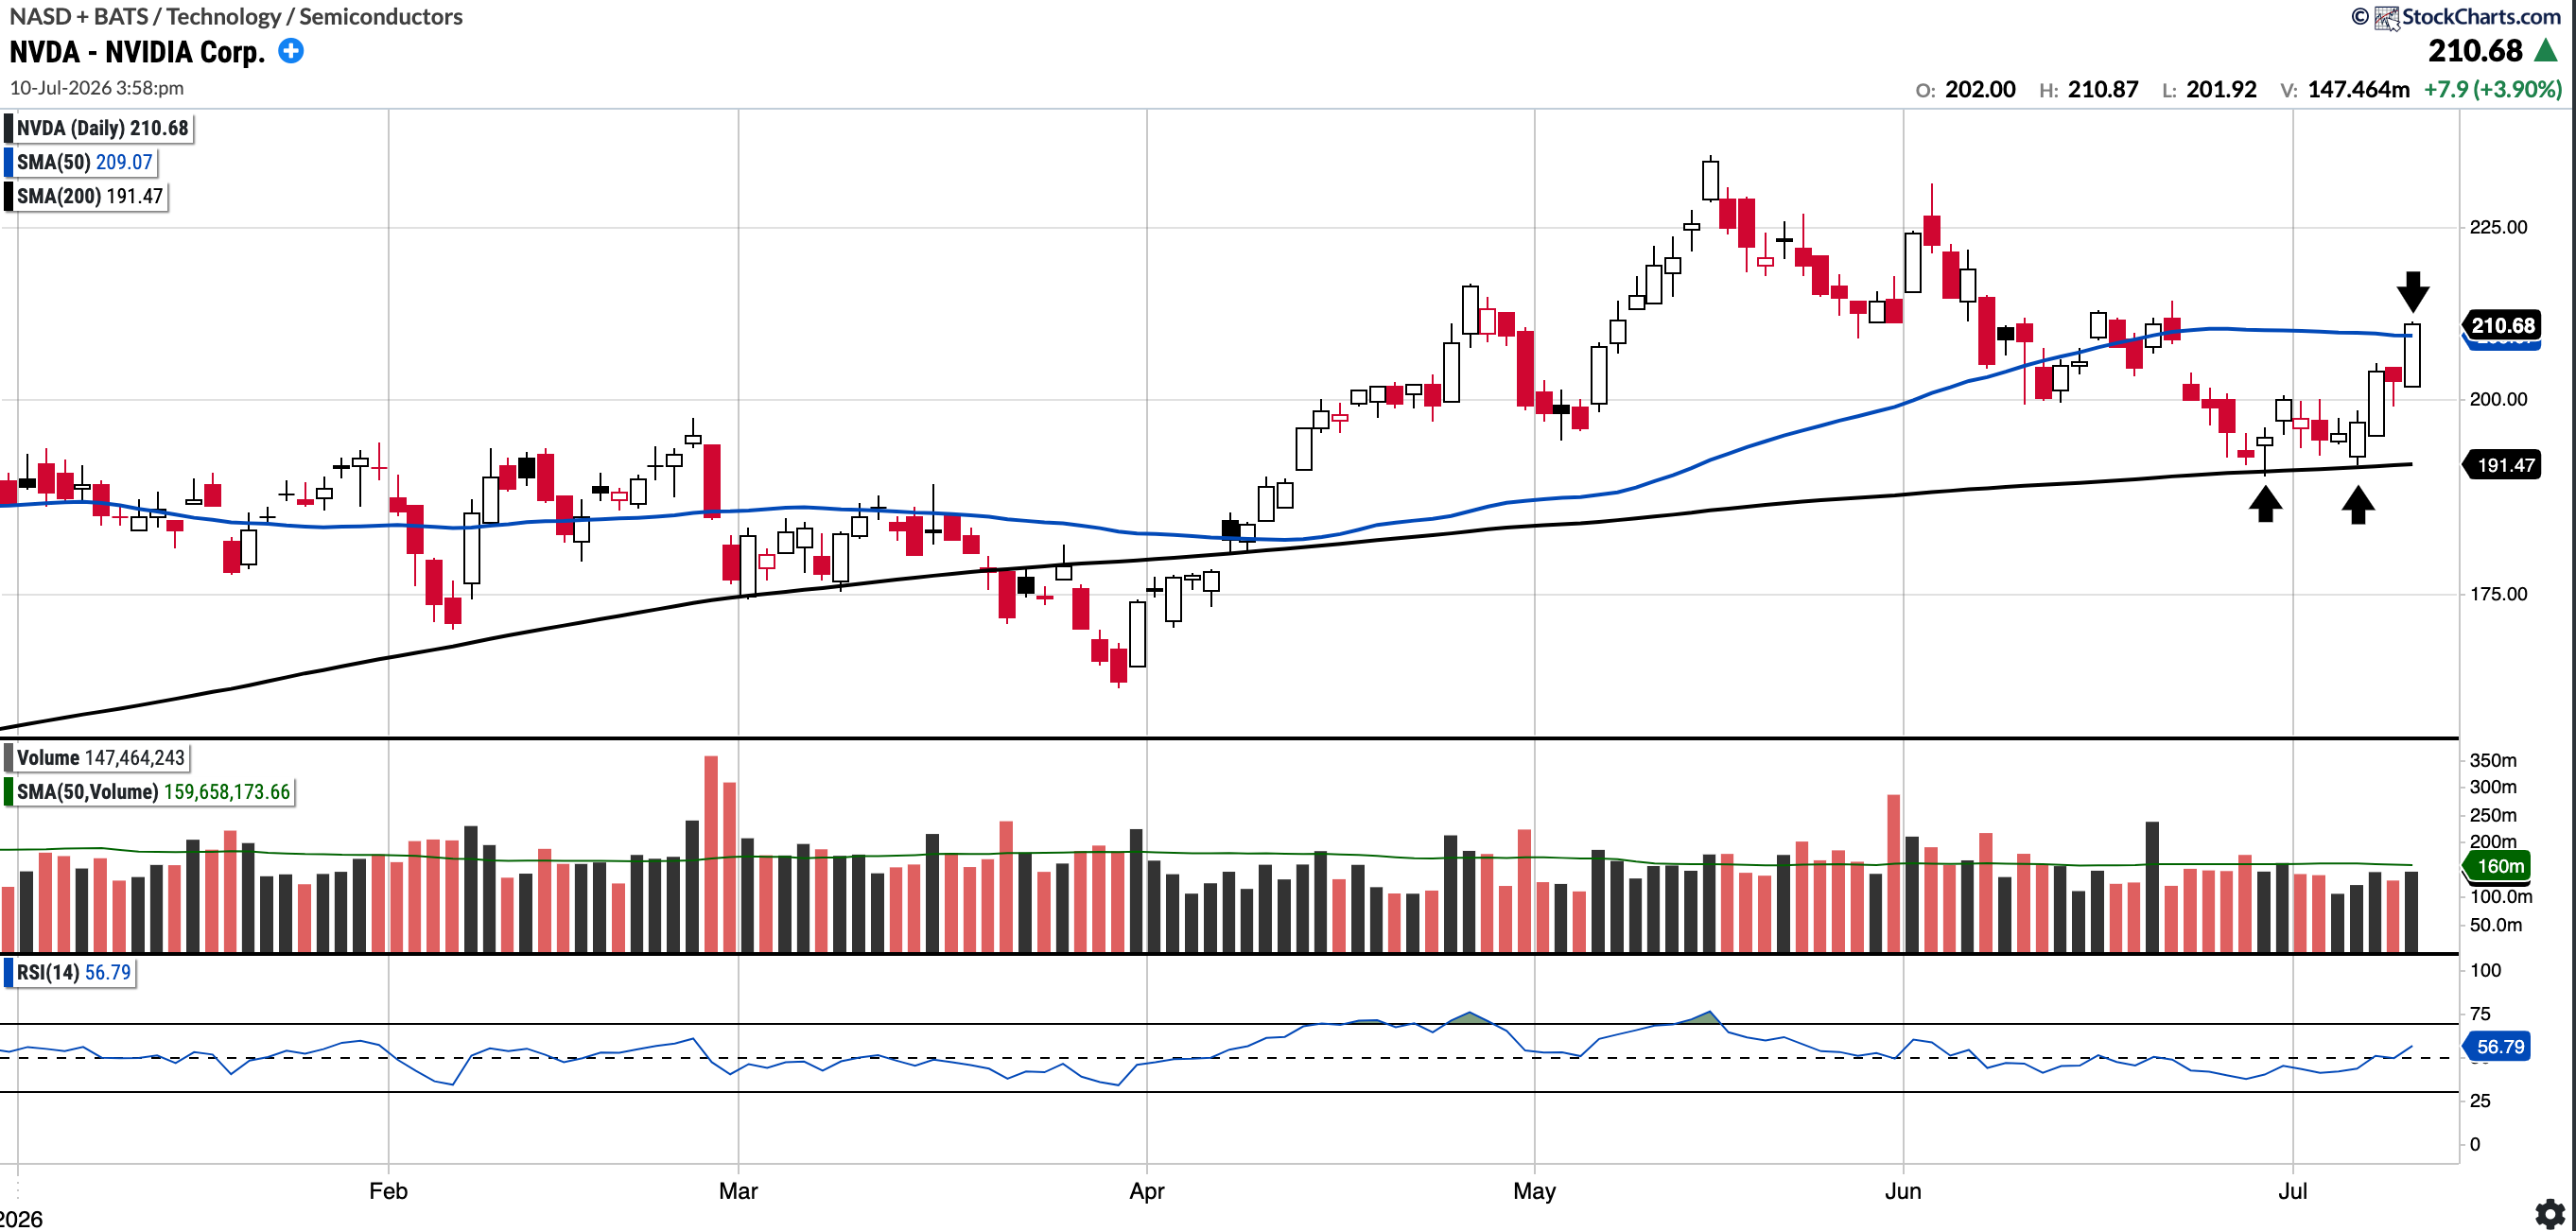
NVDA (Currently Long)
Currently trades at $210.96, 0.9% above the 50SMA and 10.18% above the 200SMA
RSI 56.79
11.84% YTD
NVDA traded constructively this week. It found support at the 200-day moving average and then regained the 50-day moving average on Friday. This is encouraging to see, and bulls will want to see the 50-day SMA hold and flip to support. Key levels of interest above are 225 initially, followed by 240.
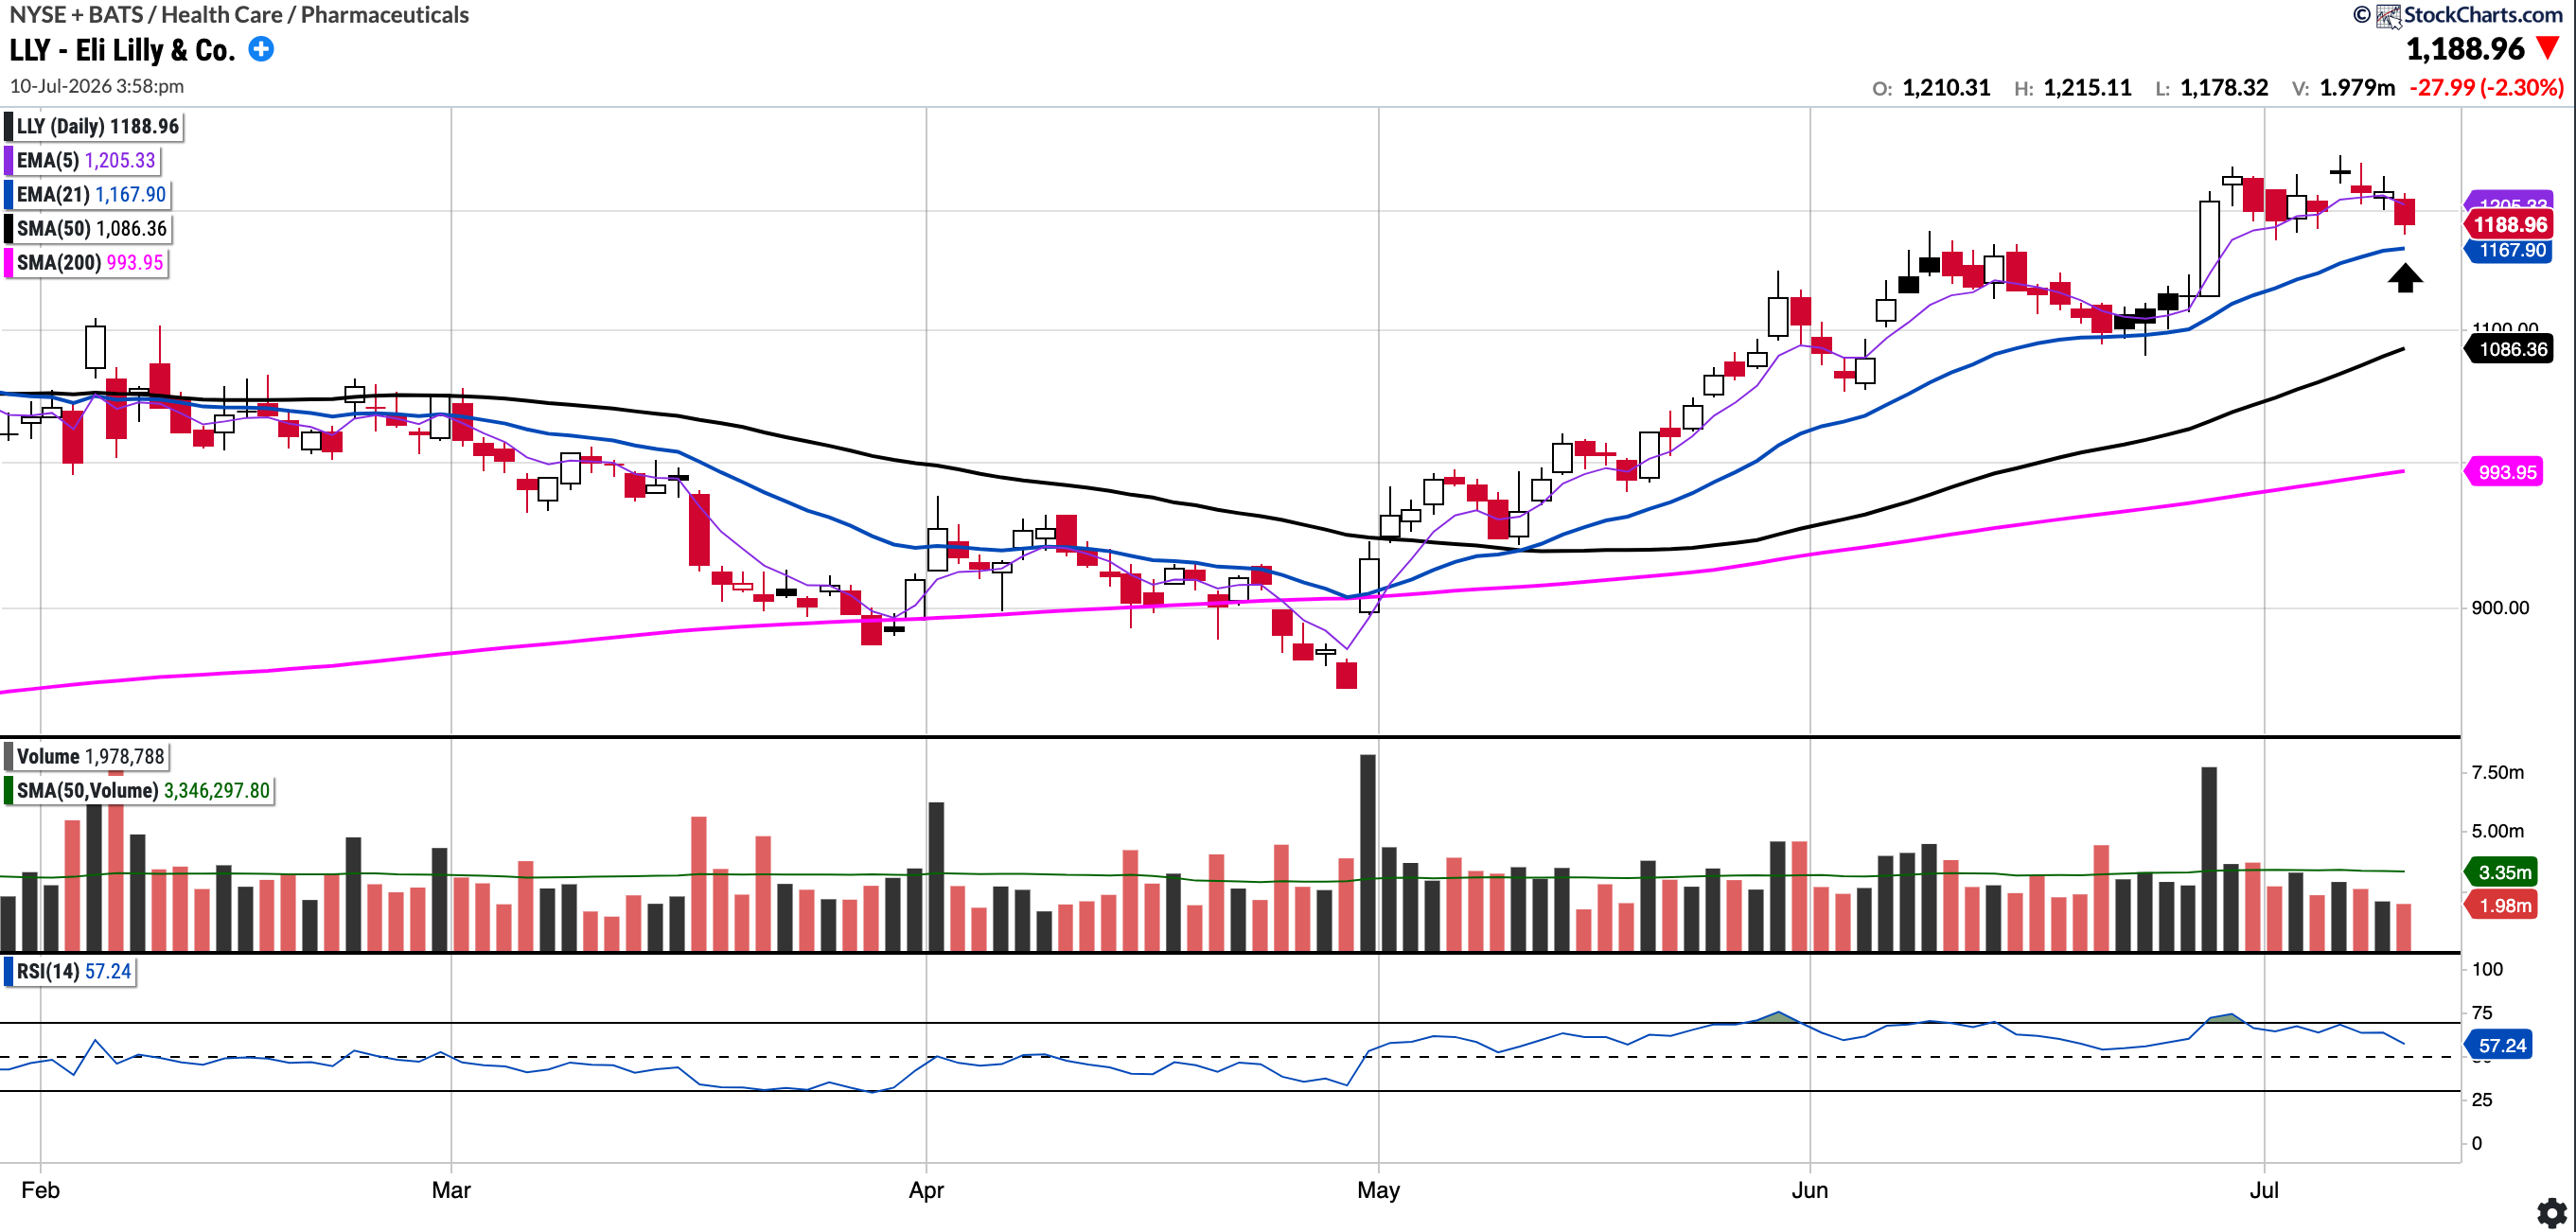
LLY (Currently Long)
Currently trades at $1188.58, 9.41% above the 50SMA and 19.58% above the 200SMA
RSI 57.24
10.39% YTD
Eli Lilly and Co. has been one of the leading pharmaceutical companies in the world and continues to show solid execution. From a technical perspective, the stock has broken to new highs recently, although it was somewhat flat this week. A shallow pullback to the rising 21-day EMA (see arrow) which coincides with a prior breakout level, may offer a lower-risk entry I am long from $888, so I am not too keen to add up here, but I am certainly holding.
On the contrary, if there is a bearish 5/21 cross over then I may be tempted to reduce part of my position.
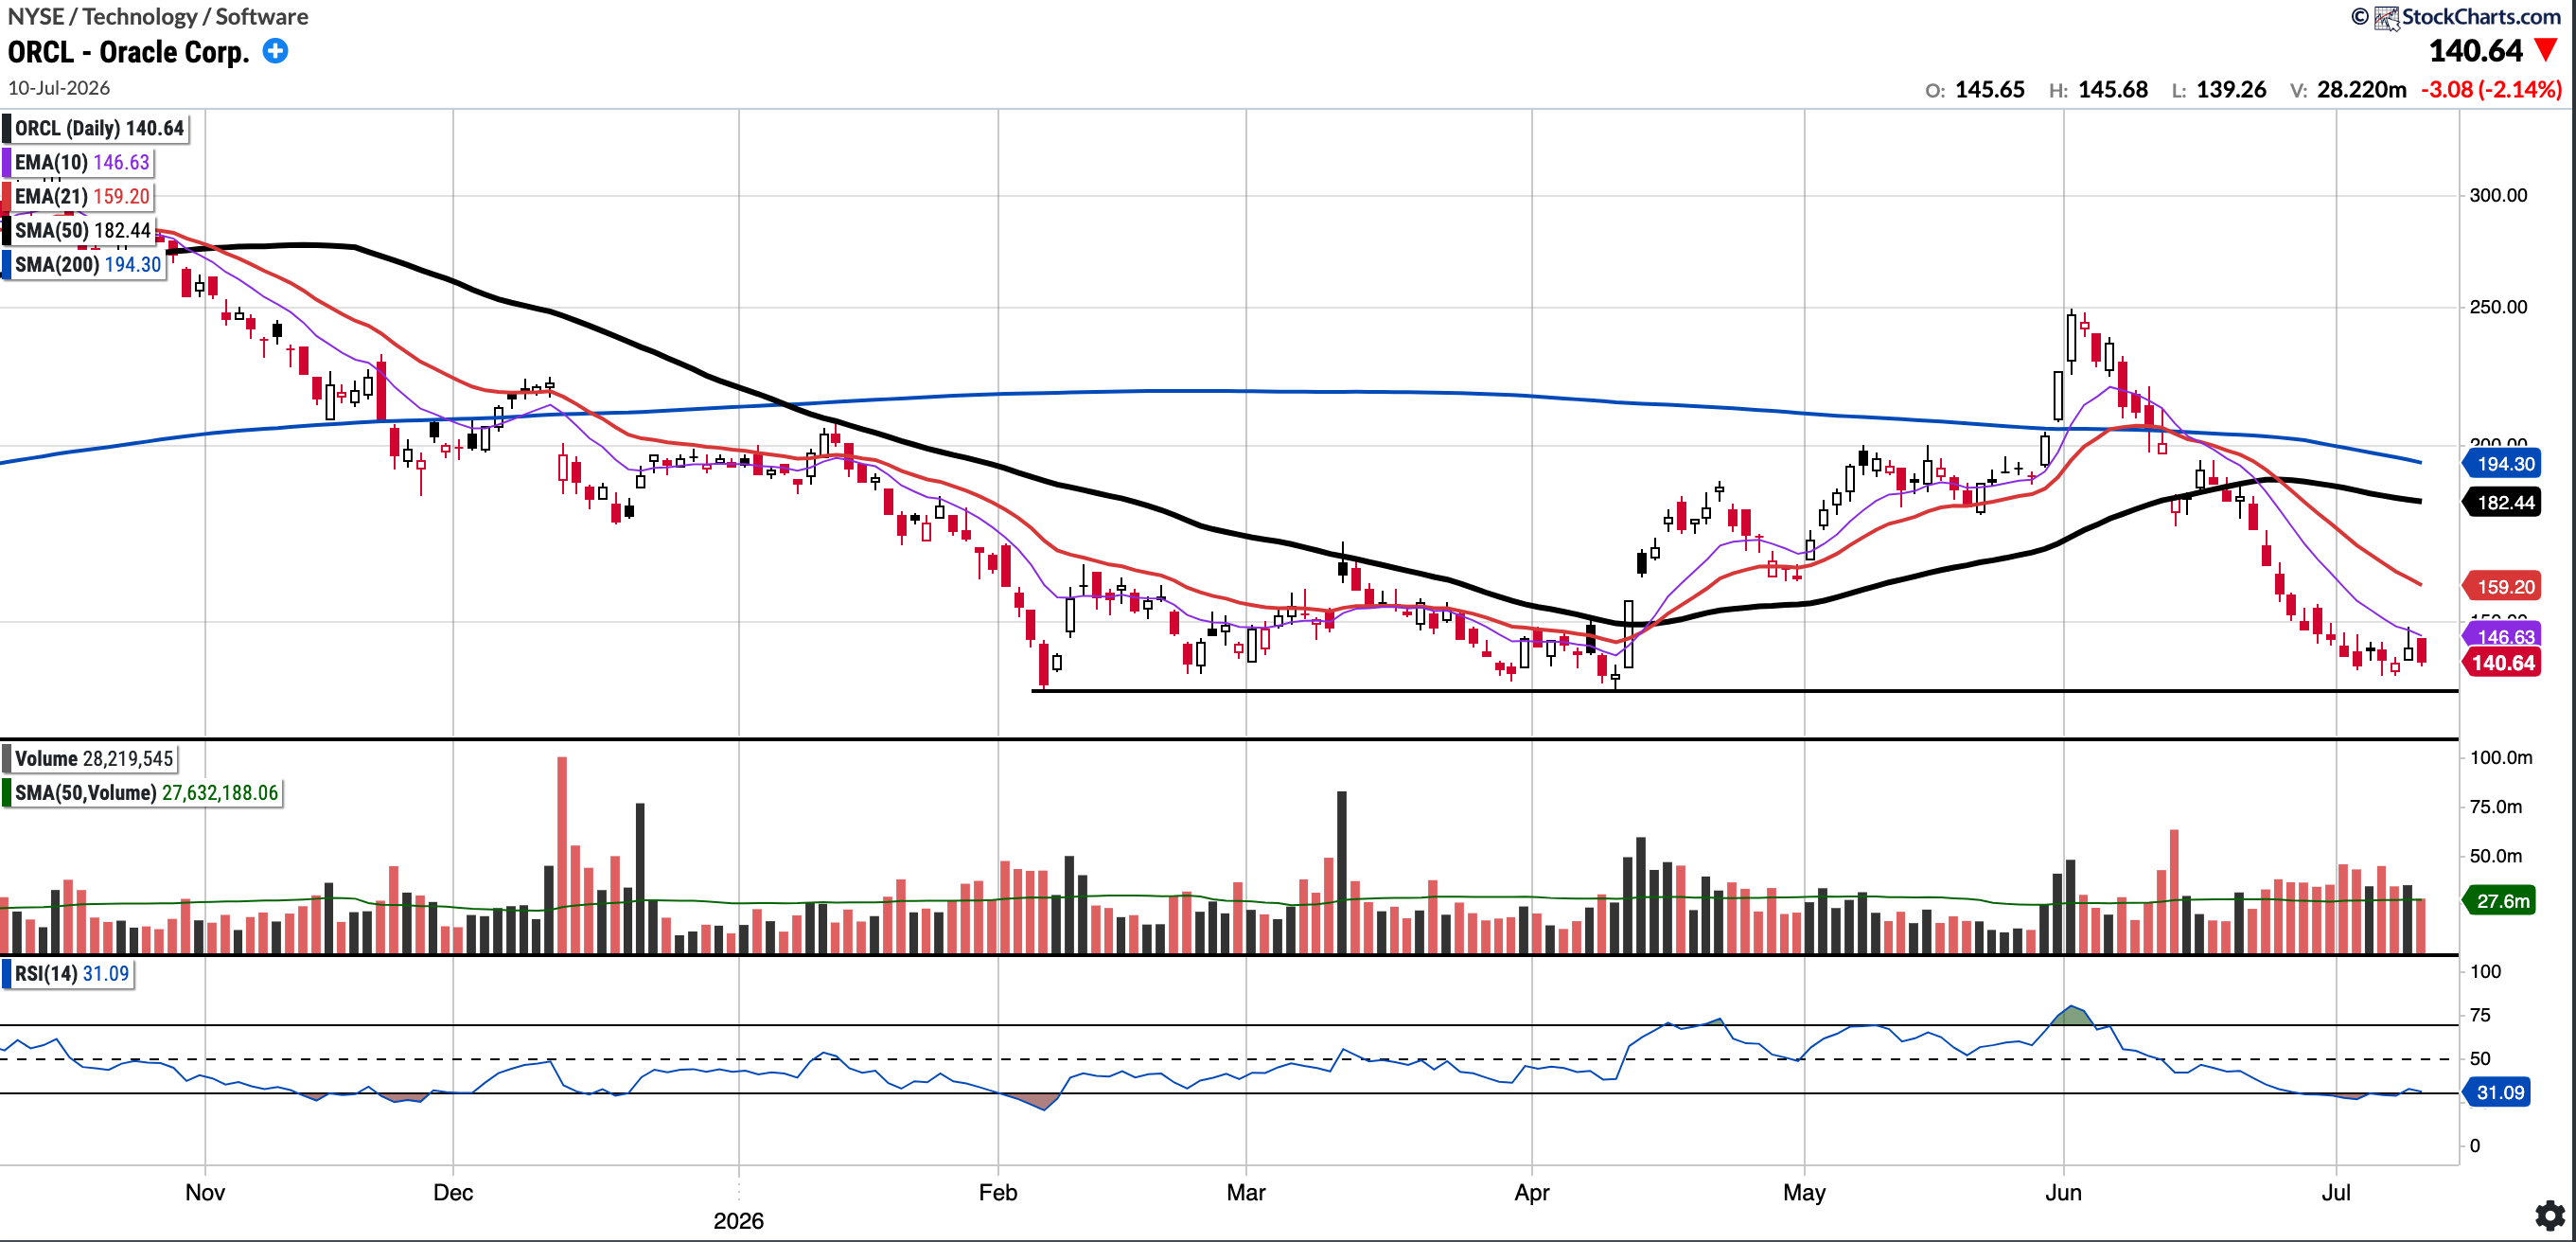
ORCL
Currently trades at $140.64, 22.91% below the 50SMA and 27.62% below the 200SMA
RSI 31.09
-27.45% YTD
ORCL has been exceptionally weak of late. However, the chart demonstrates that it is pulling back into the 135–138 range, which has served as support this year (see horizontal line on the chart). For an oversold bounce or mean-reversion trade, ORCL could be an interesting setup here, especially given that there is a defined level to measure risk against. Conversely, one could wait for a 5/21 EMA cross as a short-term momentum shift indicator.
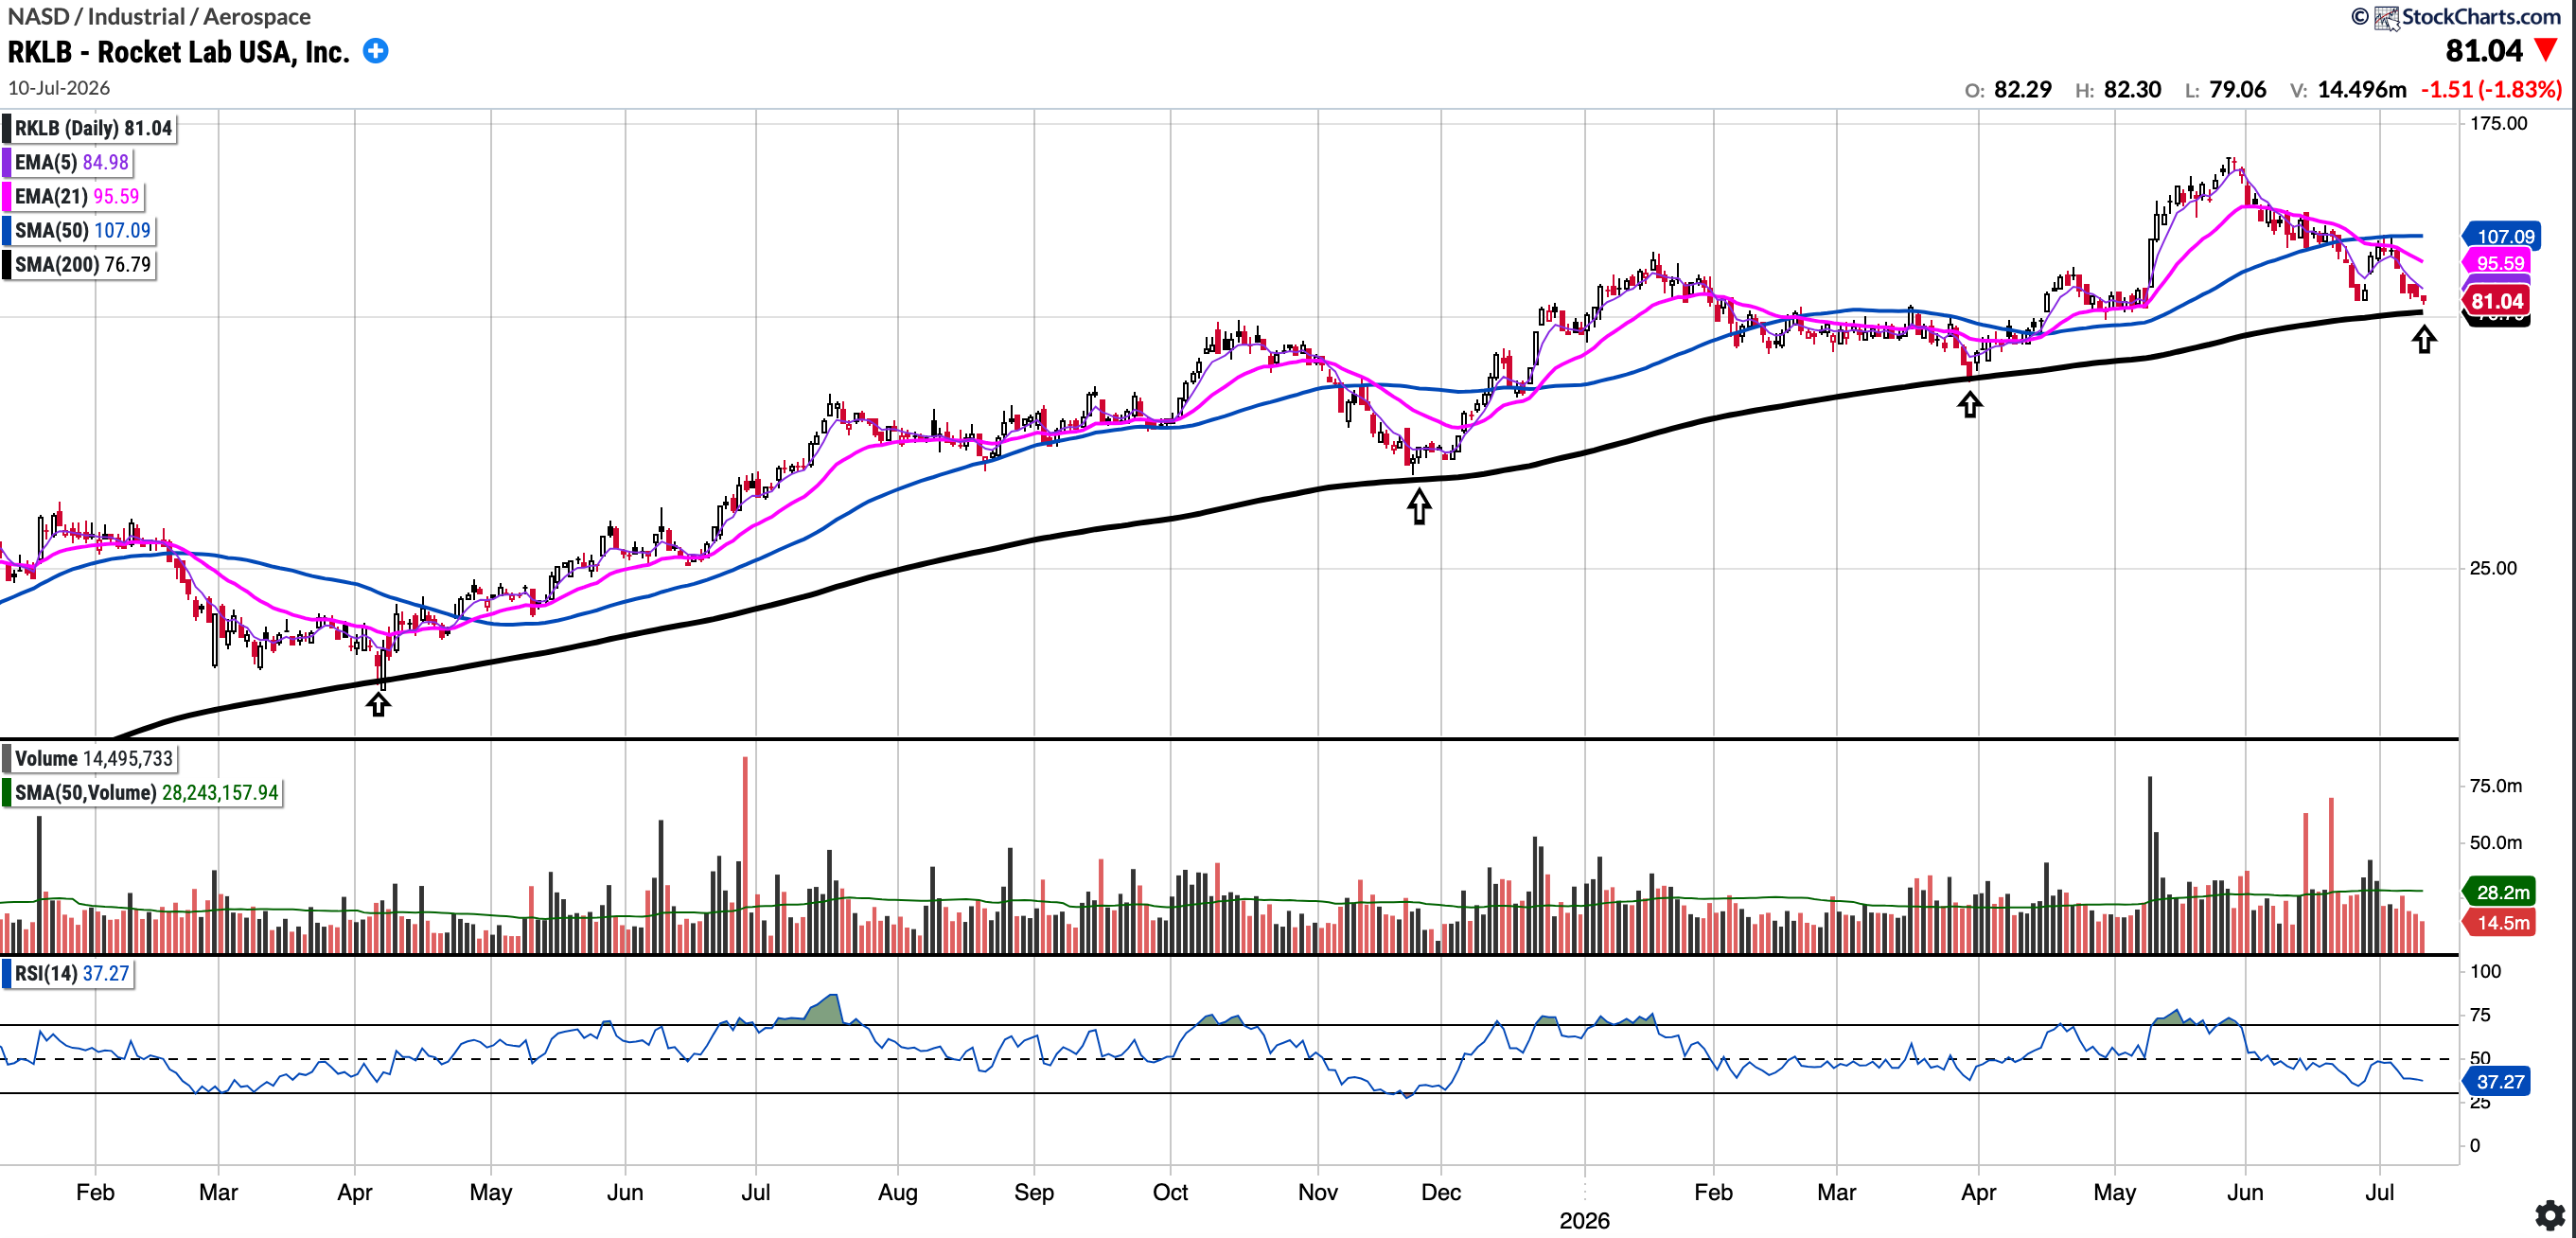
RKLB (Currently Long)
Currently trades at $81.04, 24.33% below the 50SMA and 5.53% above the 200SMA
RSI 57.24
6.65% YTD
RKLB is pulling back to the 200-day SMA. This is an area of interest, given that it has tended to find support here over the past 18 months (see arrows). If it can retest and hold, or undercut and then rally back above, it may be an attractive risk-reward spot to position long.
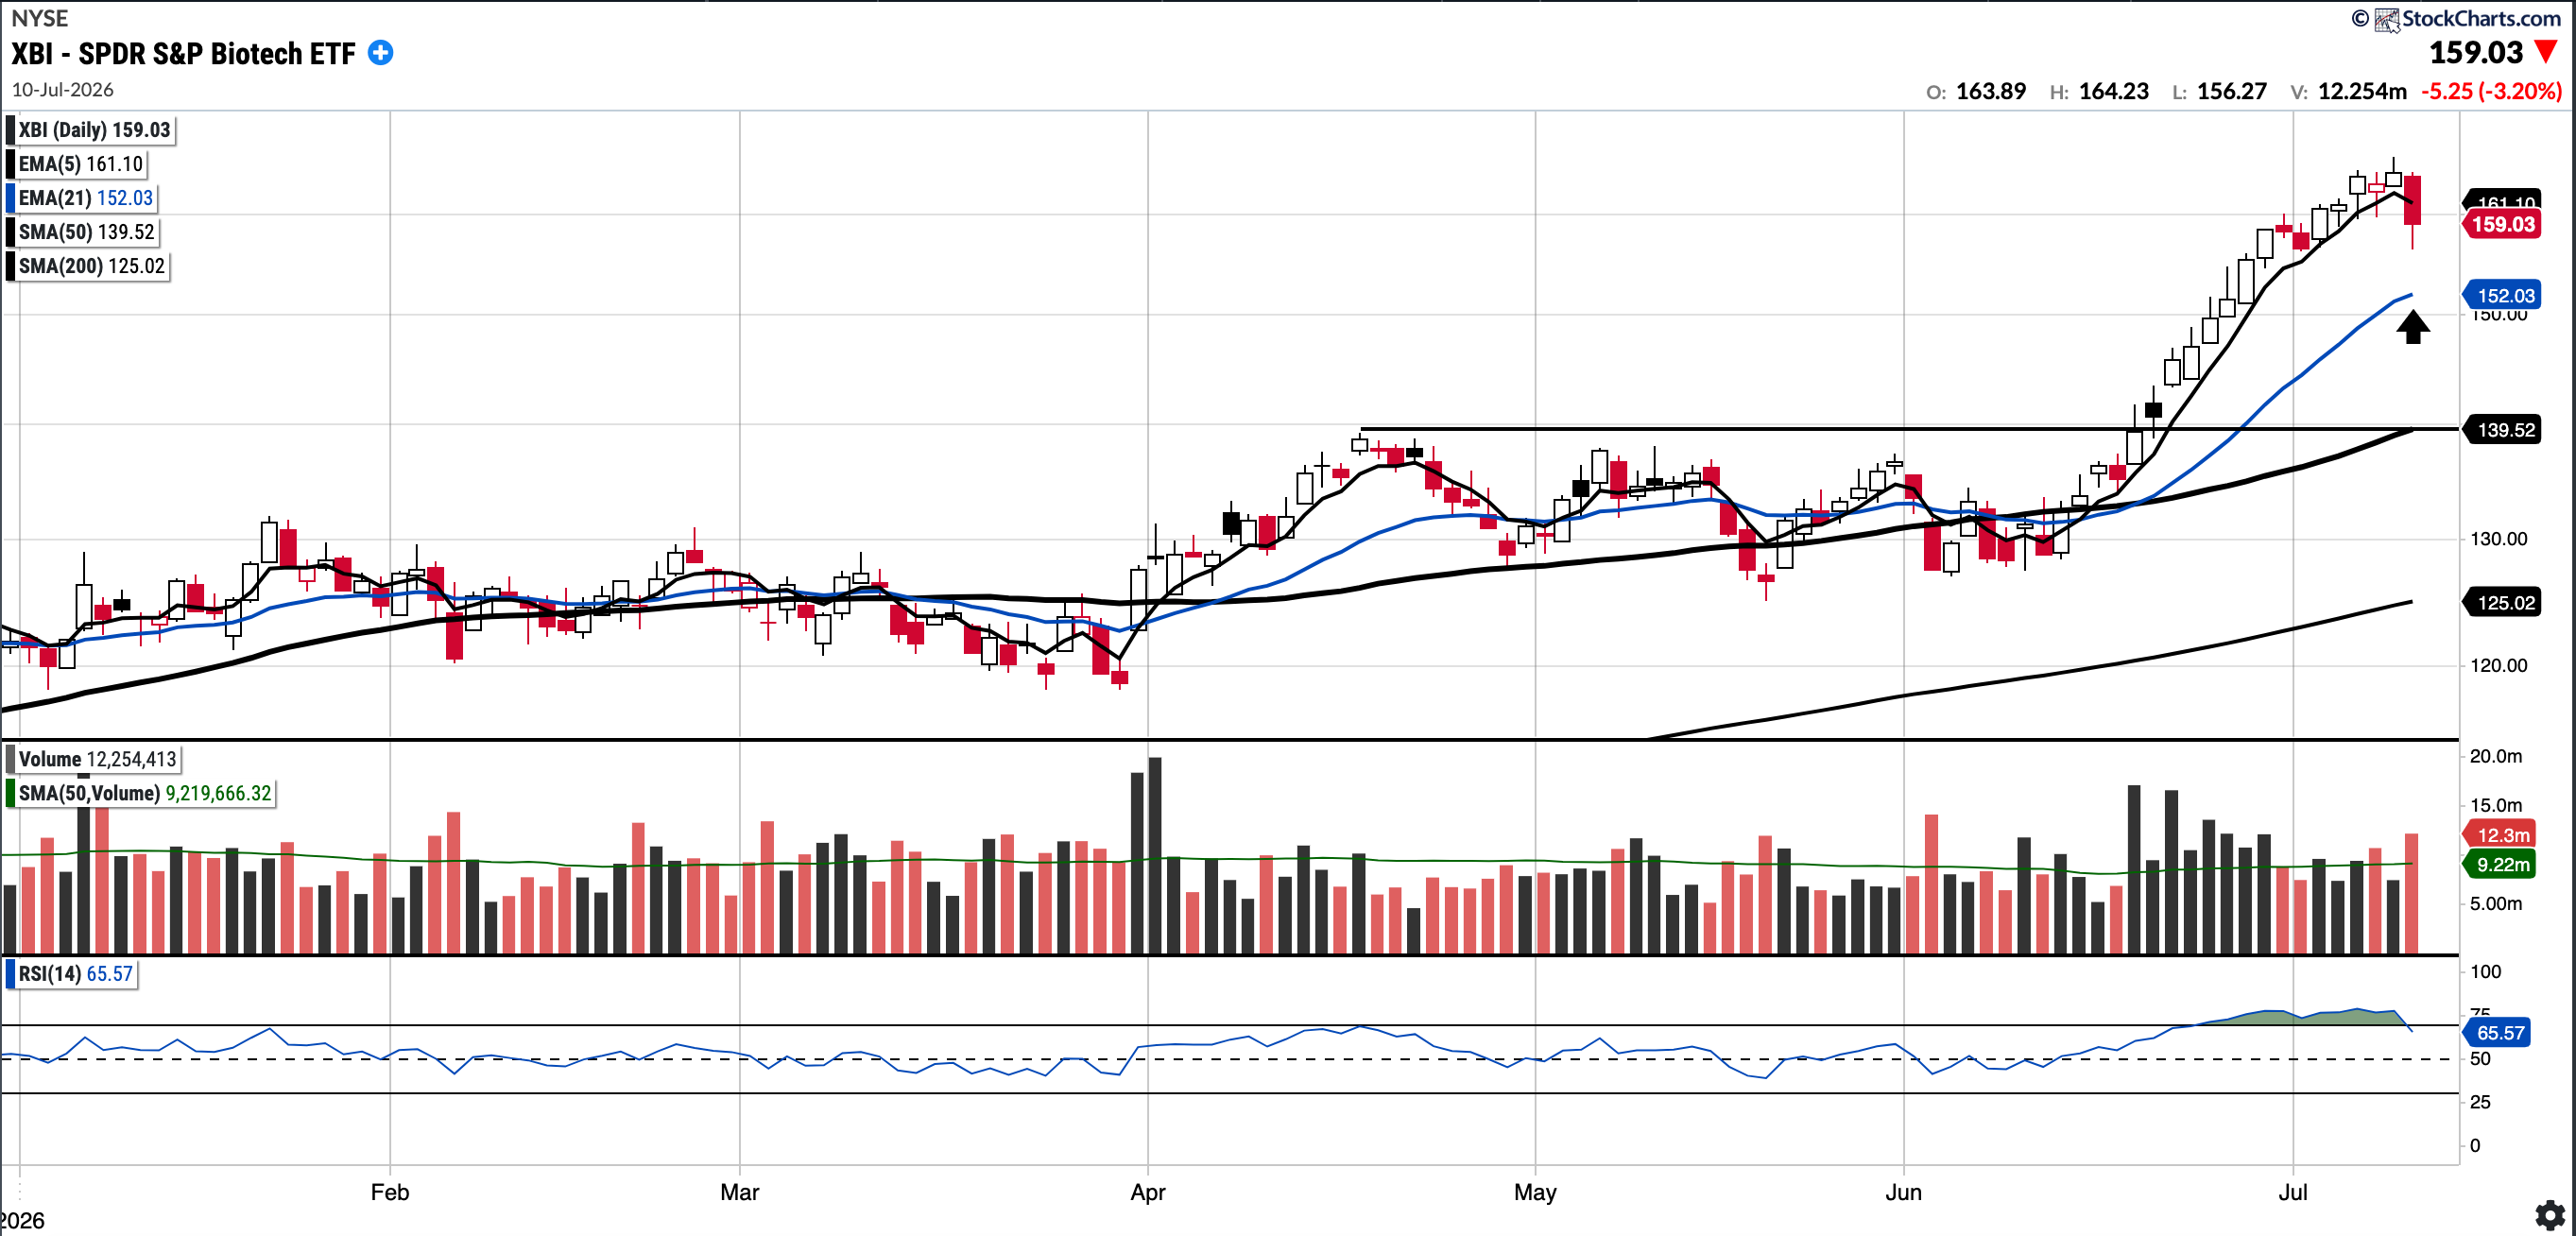
XBI
Currently trades at $159.03, 13.99% above the 50SMA and 27.2% above the 200SMA
RSI 65.57
31.0% YTD
The XBI (S&P Biotech ETF) has shown a lot of strength in recent weeks, though it has been in a bull market since last August. It has been too overbought to get long but an orderly pullback to the 21 EMA may give a chance to get in (see arrow)
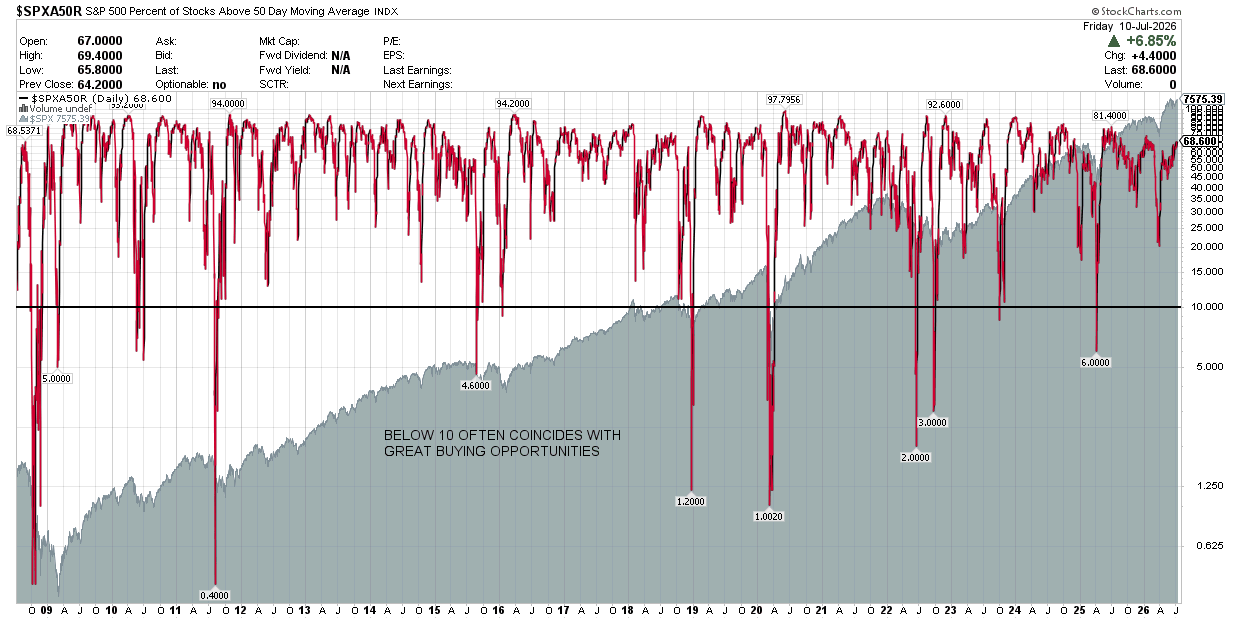
S&P 500 Percentage of Stocks Above the 50 Day Moving Average: Currently 68.6%
Breadth increased this week, with the percentage of stocks above the 50-day moving average now at 68.6%
Notable portfolio changes in previous week (all updated live in subscriber channels):
Nil
IMPORTANT: To familiarise yourself with the notification process, please read the following post regarding the notification system.
I have also included the link to the Live Updates thread on the Substack chat below, which is where I post all moves related to my investment account. Turn the notifications on. Live Updates Thread
Note that these updates are posted simultaneously on Discord as well.
Current Positions in Size Order with Cost Basis (Investment Account) as of July 12 2026
