
Preview of the Week Ahead: W/C June 29, 2026
SPX and Nasdaq Lose the 50-DMA: Rotation or Looming Correction?

Hope you all are having a good weekend. Below, we will be previewing the upcoming week’s events and providing a portfolio update as usual.
Format for what is covered in this weekly preview:
A Look at the Indices
Key Upcoming Economic Events
Upcoming Earnings Reports
Charts
Notable Portfolio Changes from the Previous Week
Current Portfolio Holdings
Position size, cost basis, and commentary on each holding regarding the intended holding period and any planned activity
Closing Thoughts
I recommend checking out the most recent Monthly Portfolio and Performance Update below:

Also, ensure to check out the post below regarding upcoming pricing changes plus feedback from our readers:

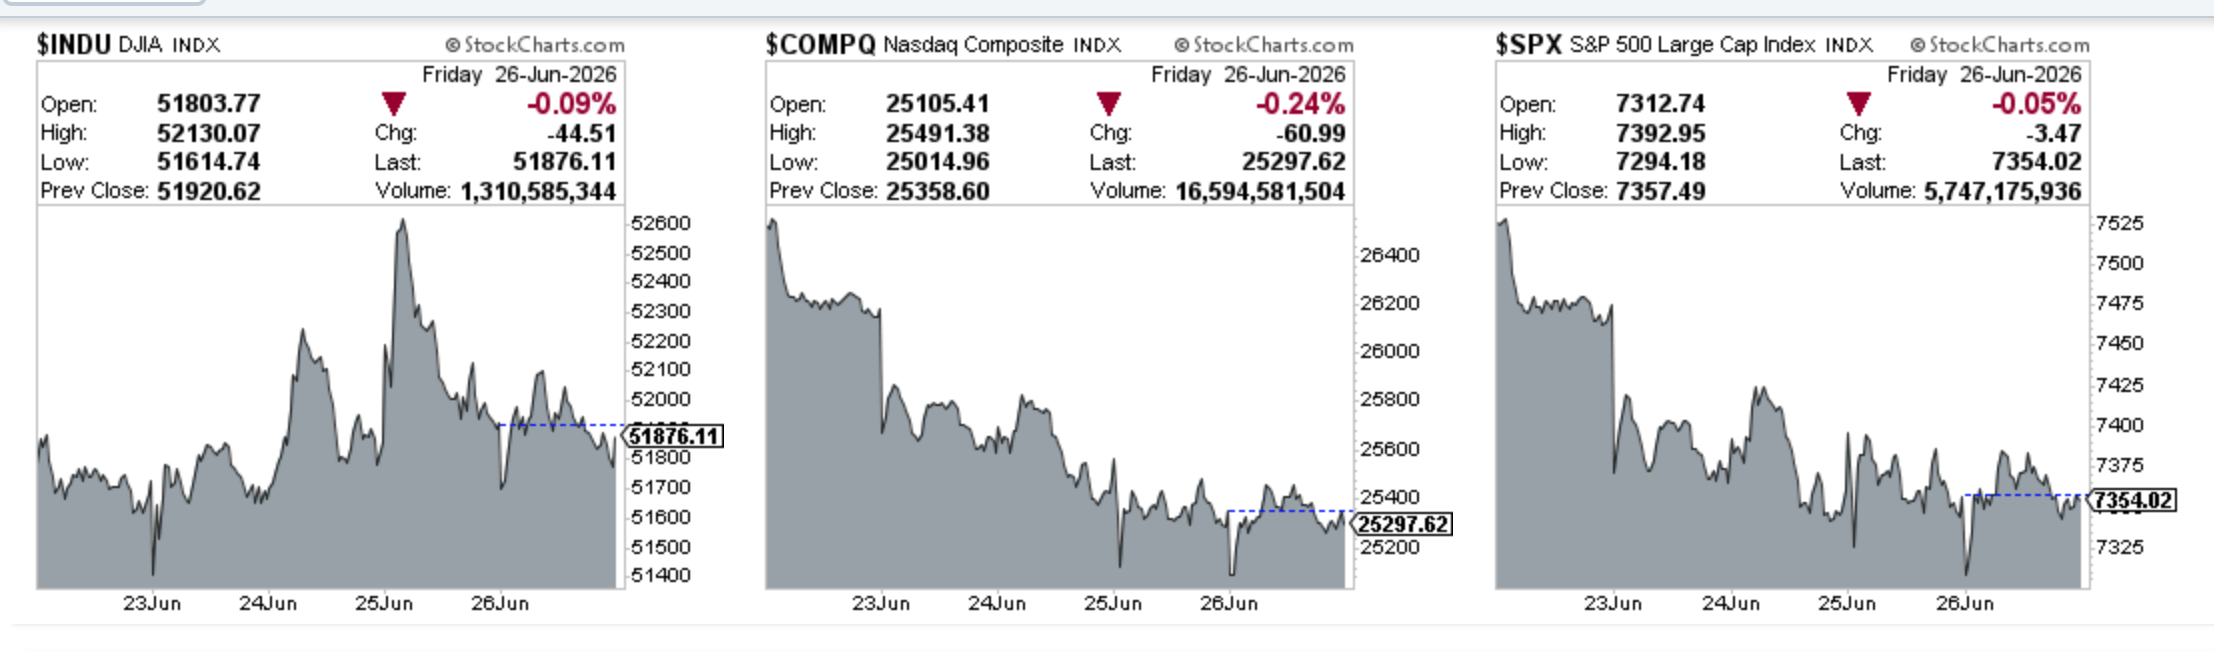
Indices
Dow Jones advanced 0.15% in the last week
S&P 500 declined 2.06% in the last week
Nasdaq Composite declined 4.33% in the last week
IWM advanced 0.53% in the last week
Key upcoming economic events
Monday, June 29
Dallas Fed Manufacturing Index (10:30 AM ET)
Tuesday, June 30
S&P/Case-Shiller Home Price Index (9:00 AM ET)
Chicago PMI (9:45 AM ET)
Consumer Confidence Index (10:00 AM ET)
JOLTS (Job Openings and Labor Turnover Survey) (10:00 AM ET)
Wednesday, July 1
ADP National Employment Report (8:15 AM ET)
ISM Manufacturing PMI (10:00 AM ET)
Construction Spending (10:00 AM ET)
Thursday, July 2
U.S. Employment Report / Non-Farm Payrolls (8:30 AM ET)
Initial Jobless Claims (8:30 AM ET)
Factory Orders (10:00 AM ET)
Friday, July 3
U.S. Markets Closed: Independence Day (Observed).
Upcoming Earnings
Below is the infographic by Earnings Whispers highlighting the schedule for this week:

Charts
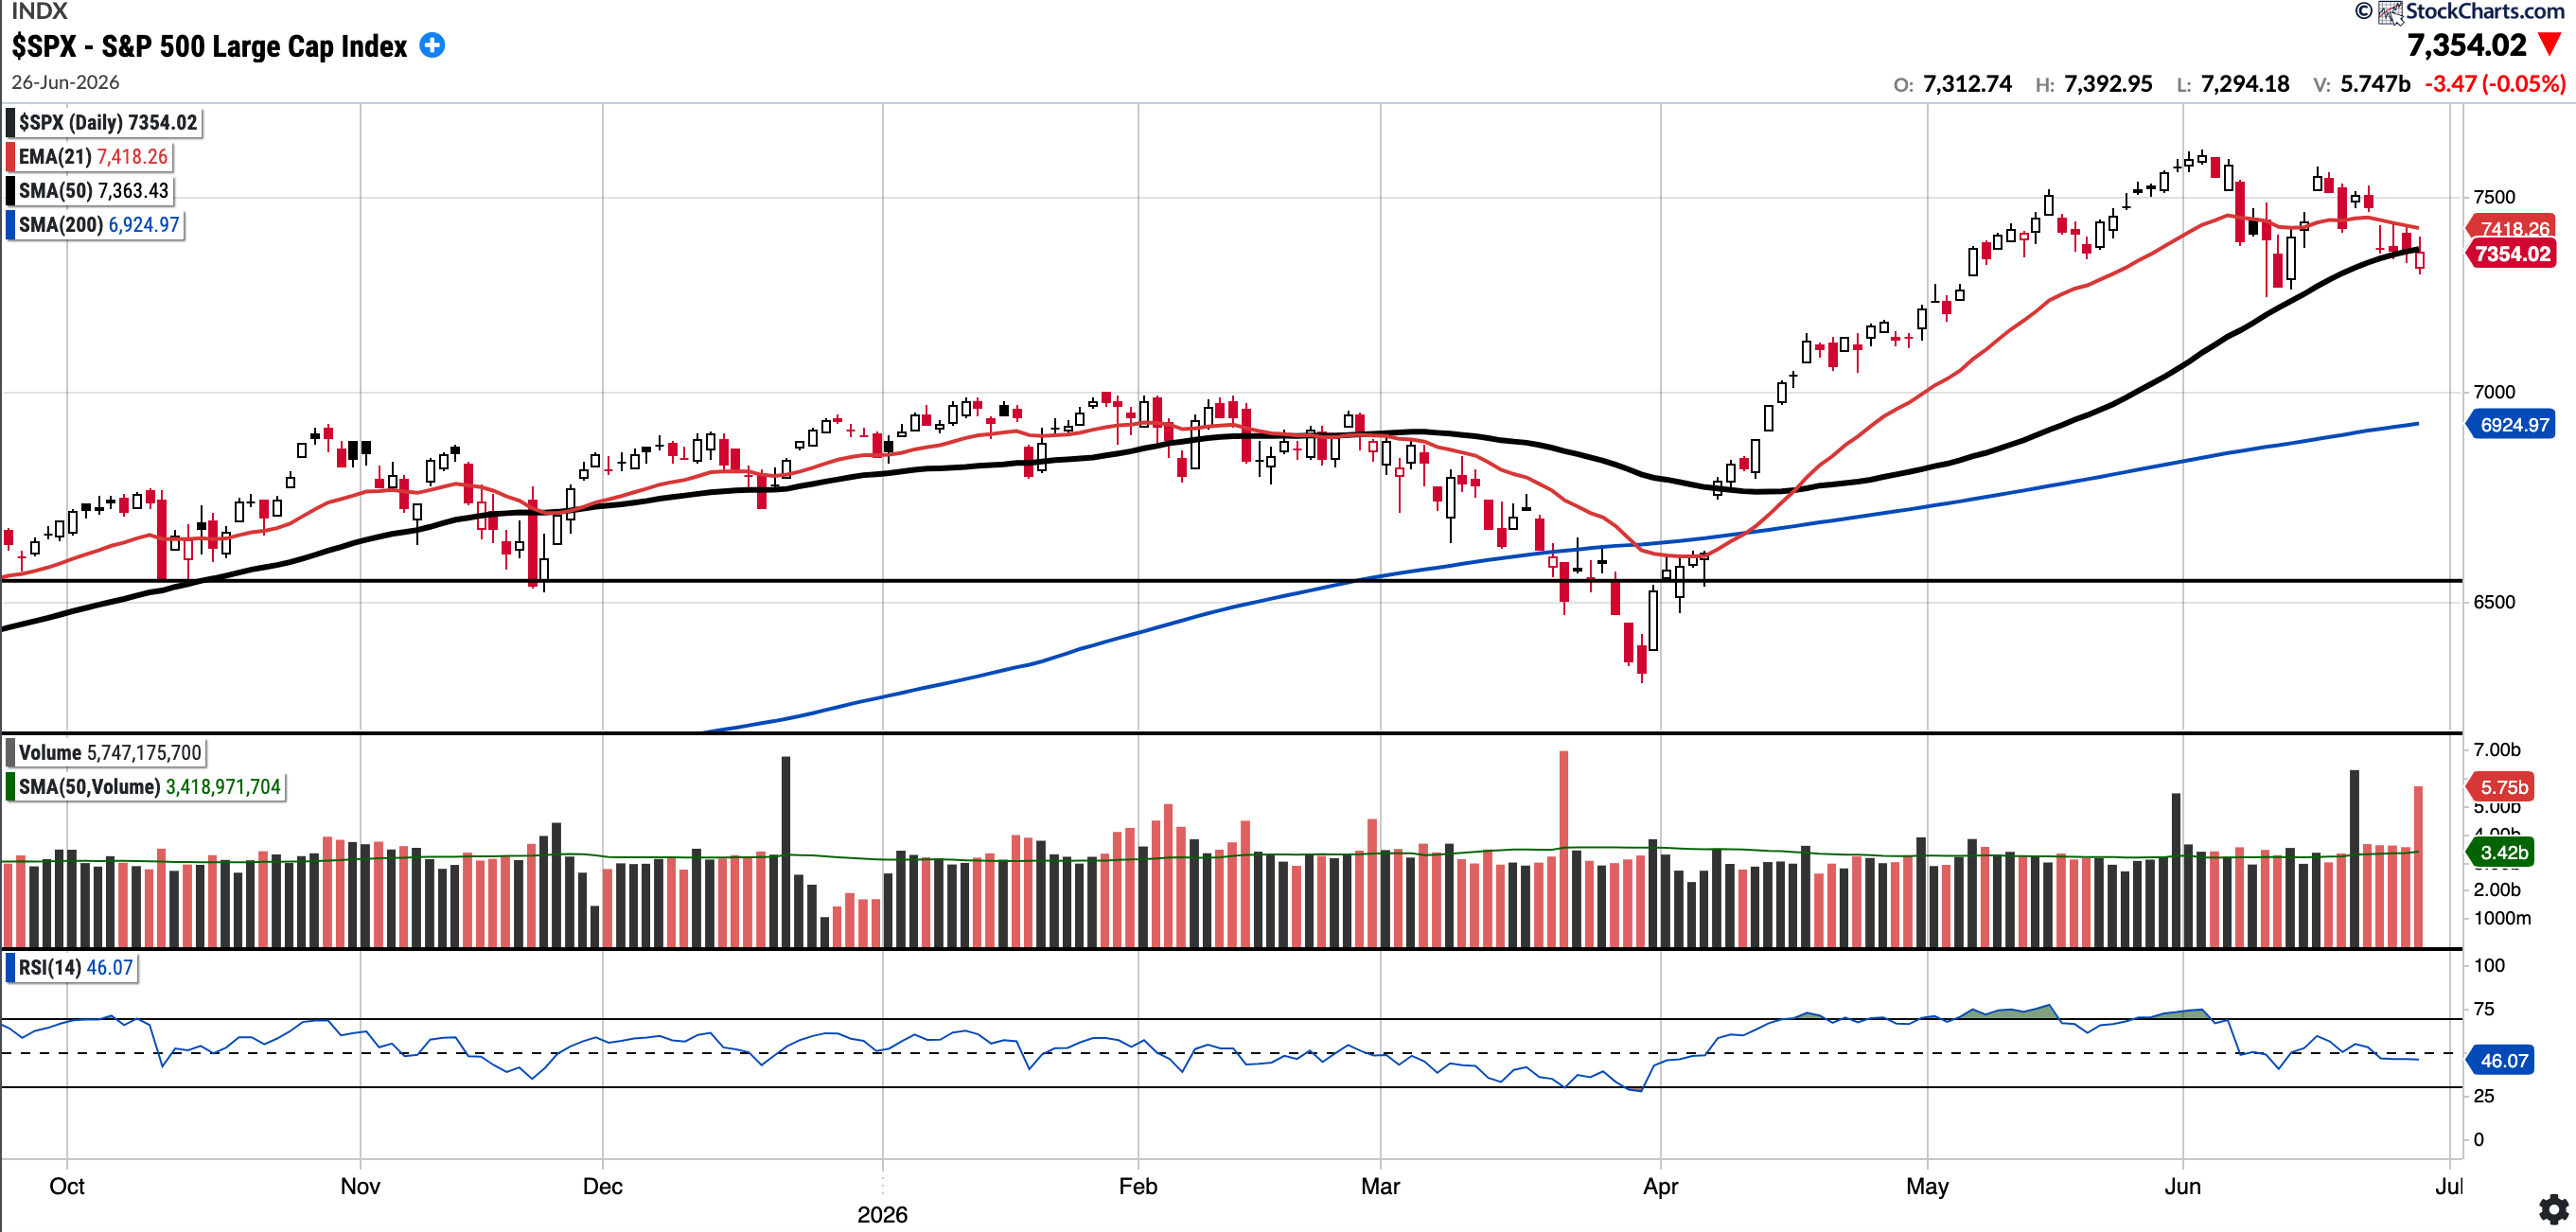
SPX
Currently trades at 7354.02, 0.13% below the 50SMA and 6.2% above the 200SMA.
RSI 46.07
7.23% YTD
Distribution days in the last week: 0 (though 5 red days on above average volume)
The S&P 500 had five consecutive red days this week, each on above-average volume, yet curiously, we did not meet the criteria for a distribution day on any of them!
The SPX closed below the 21 EMA and the 50 SMA.
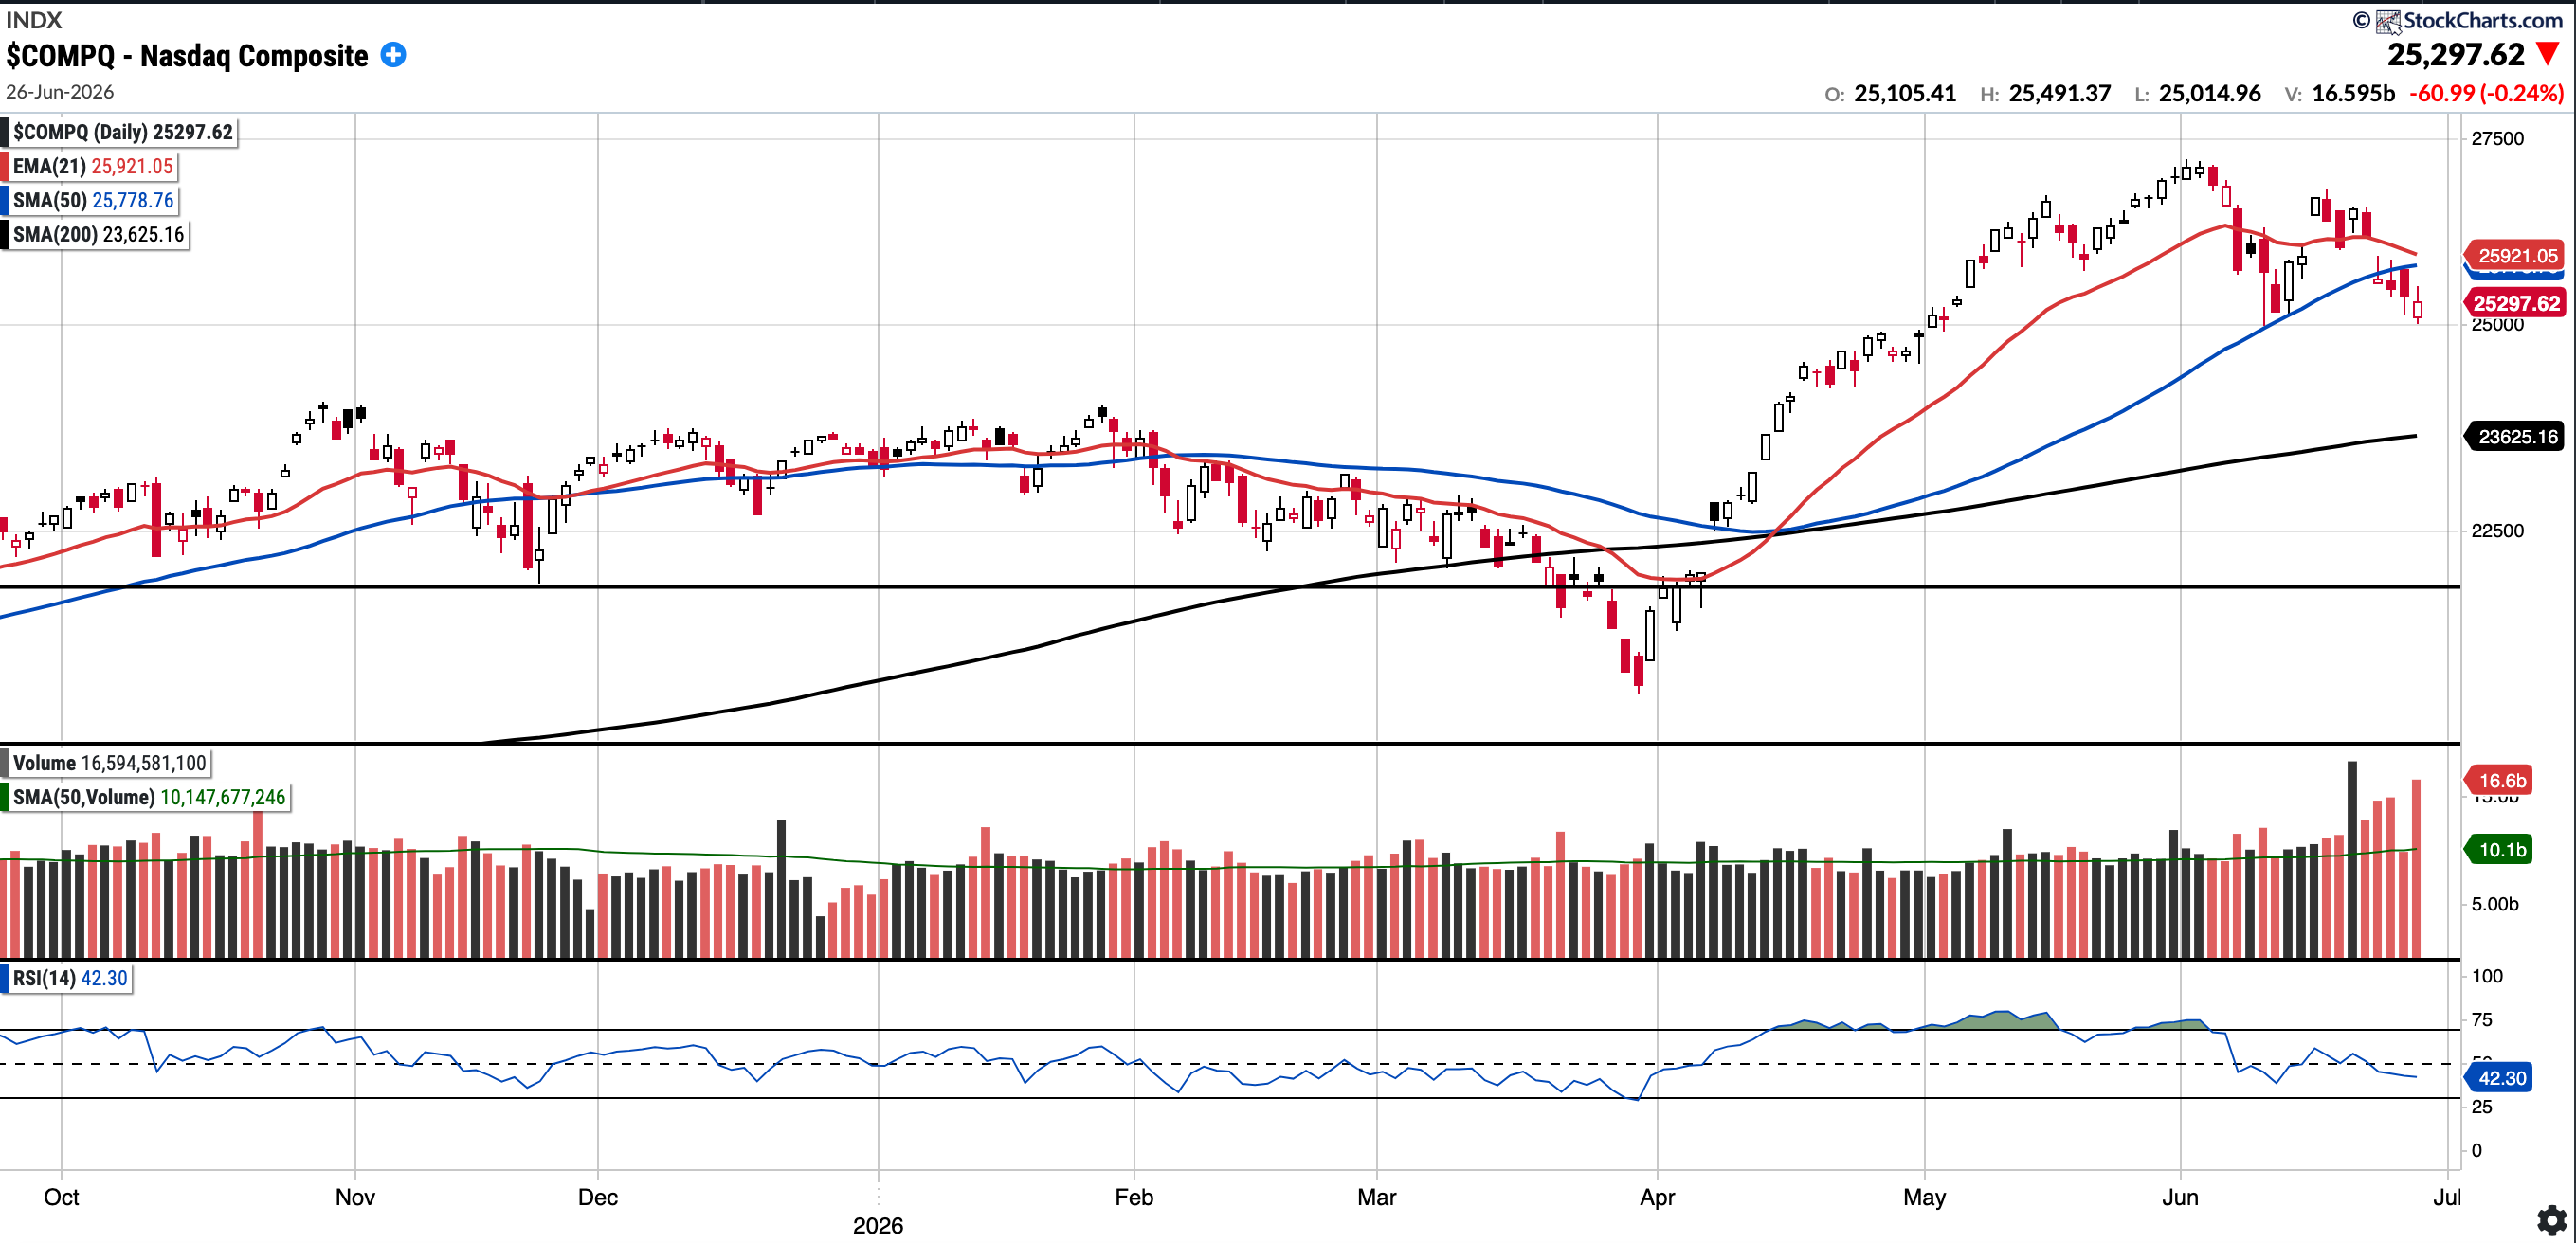
COMPQ
Currently trades at 25,297.62, 1.87% above the 50SMA and 7.08% above the 200SMA.
RSI 42.3
8.87% YTD
Distribution days in the last week: 3 (though 4 red days on above average volume)
The Nasdaq Composite closed the week below the 21-day EMA and the 50 SMA. There were three distribution days this week.
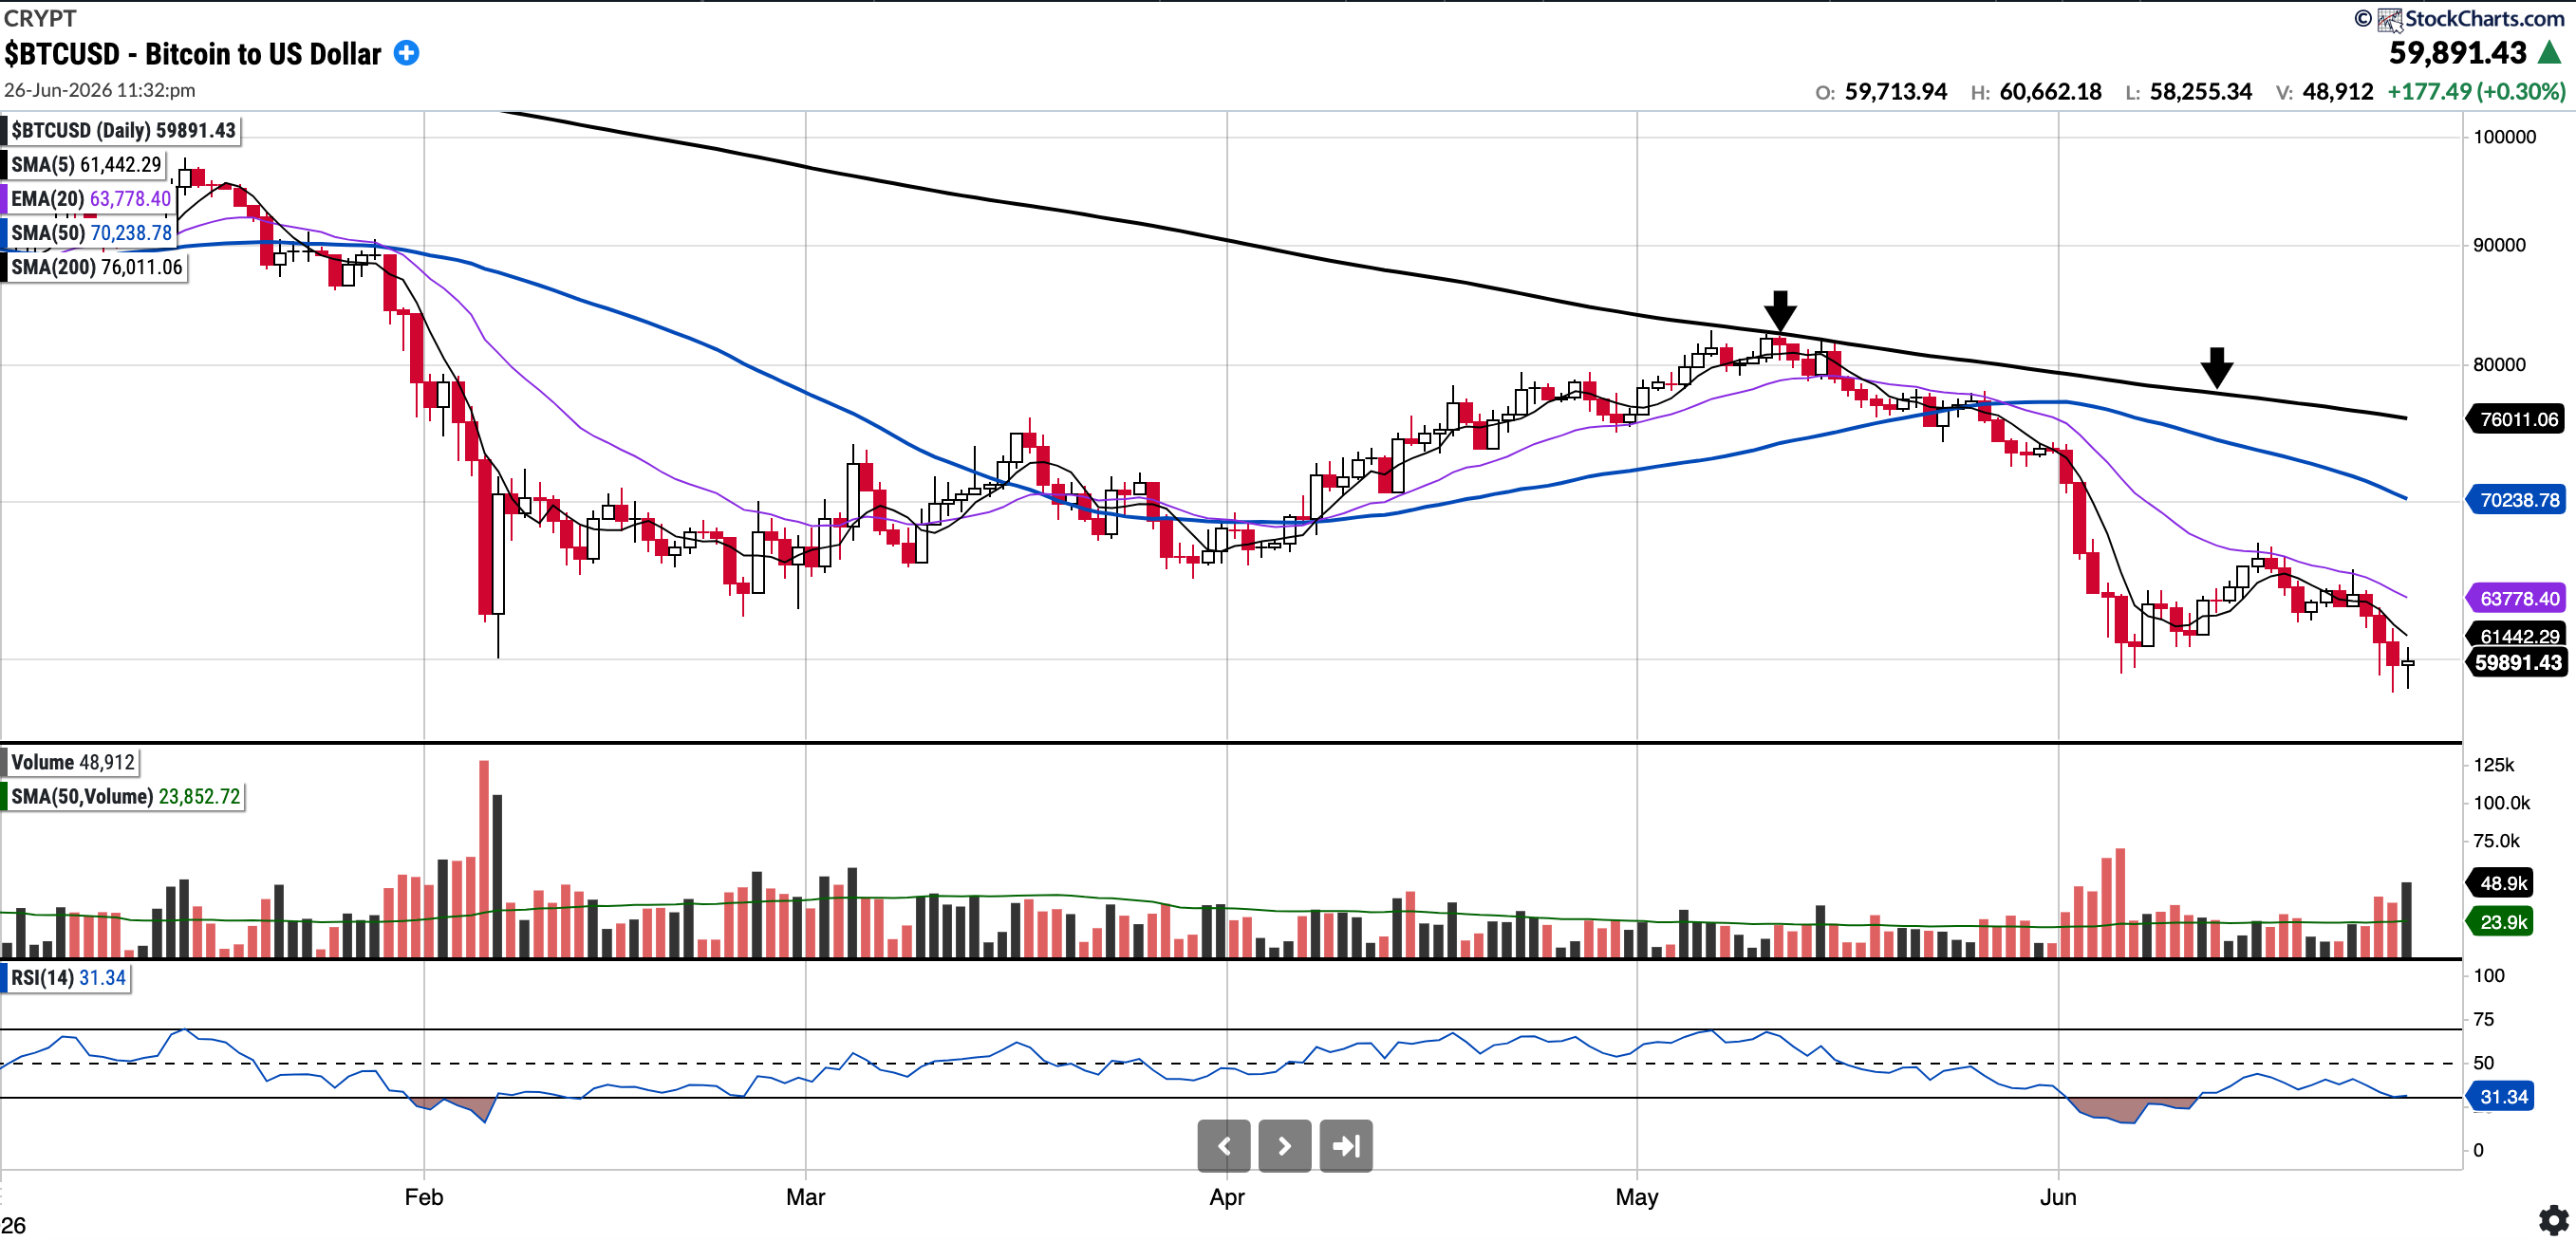
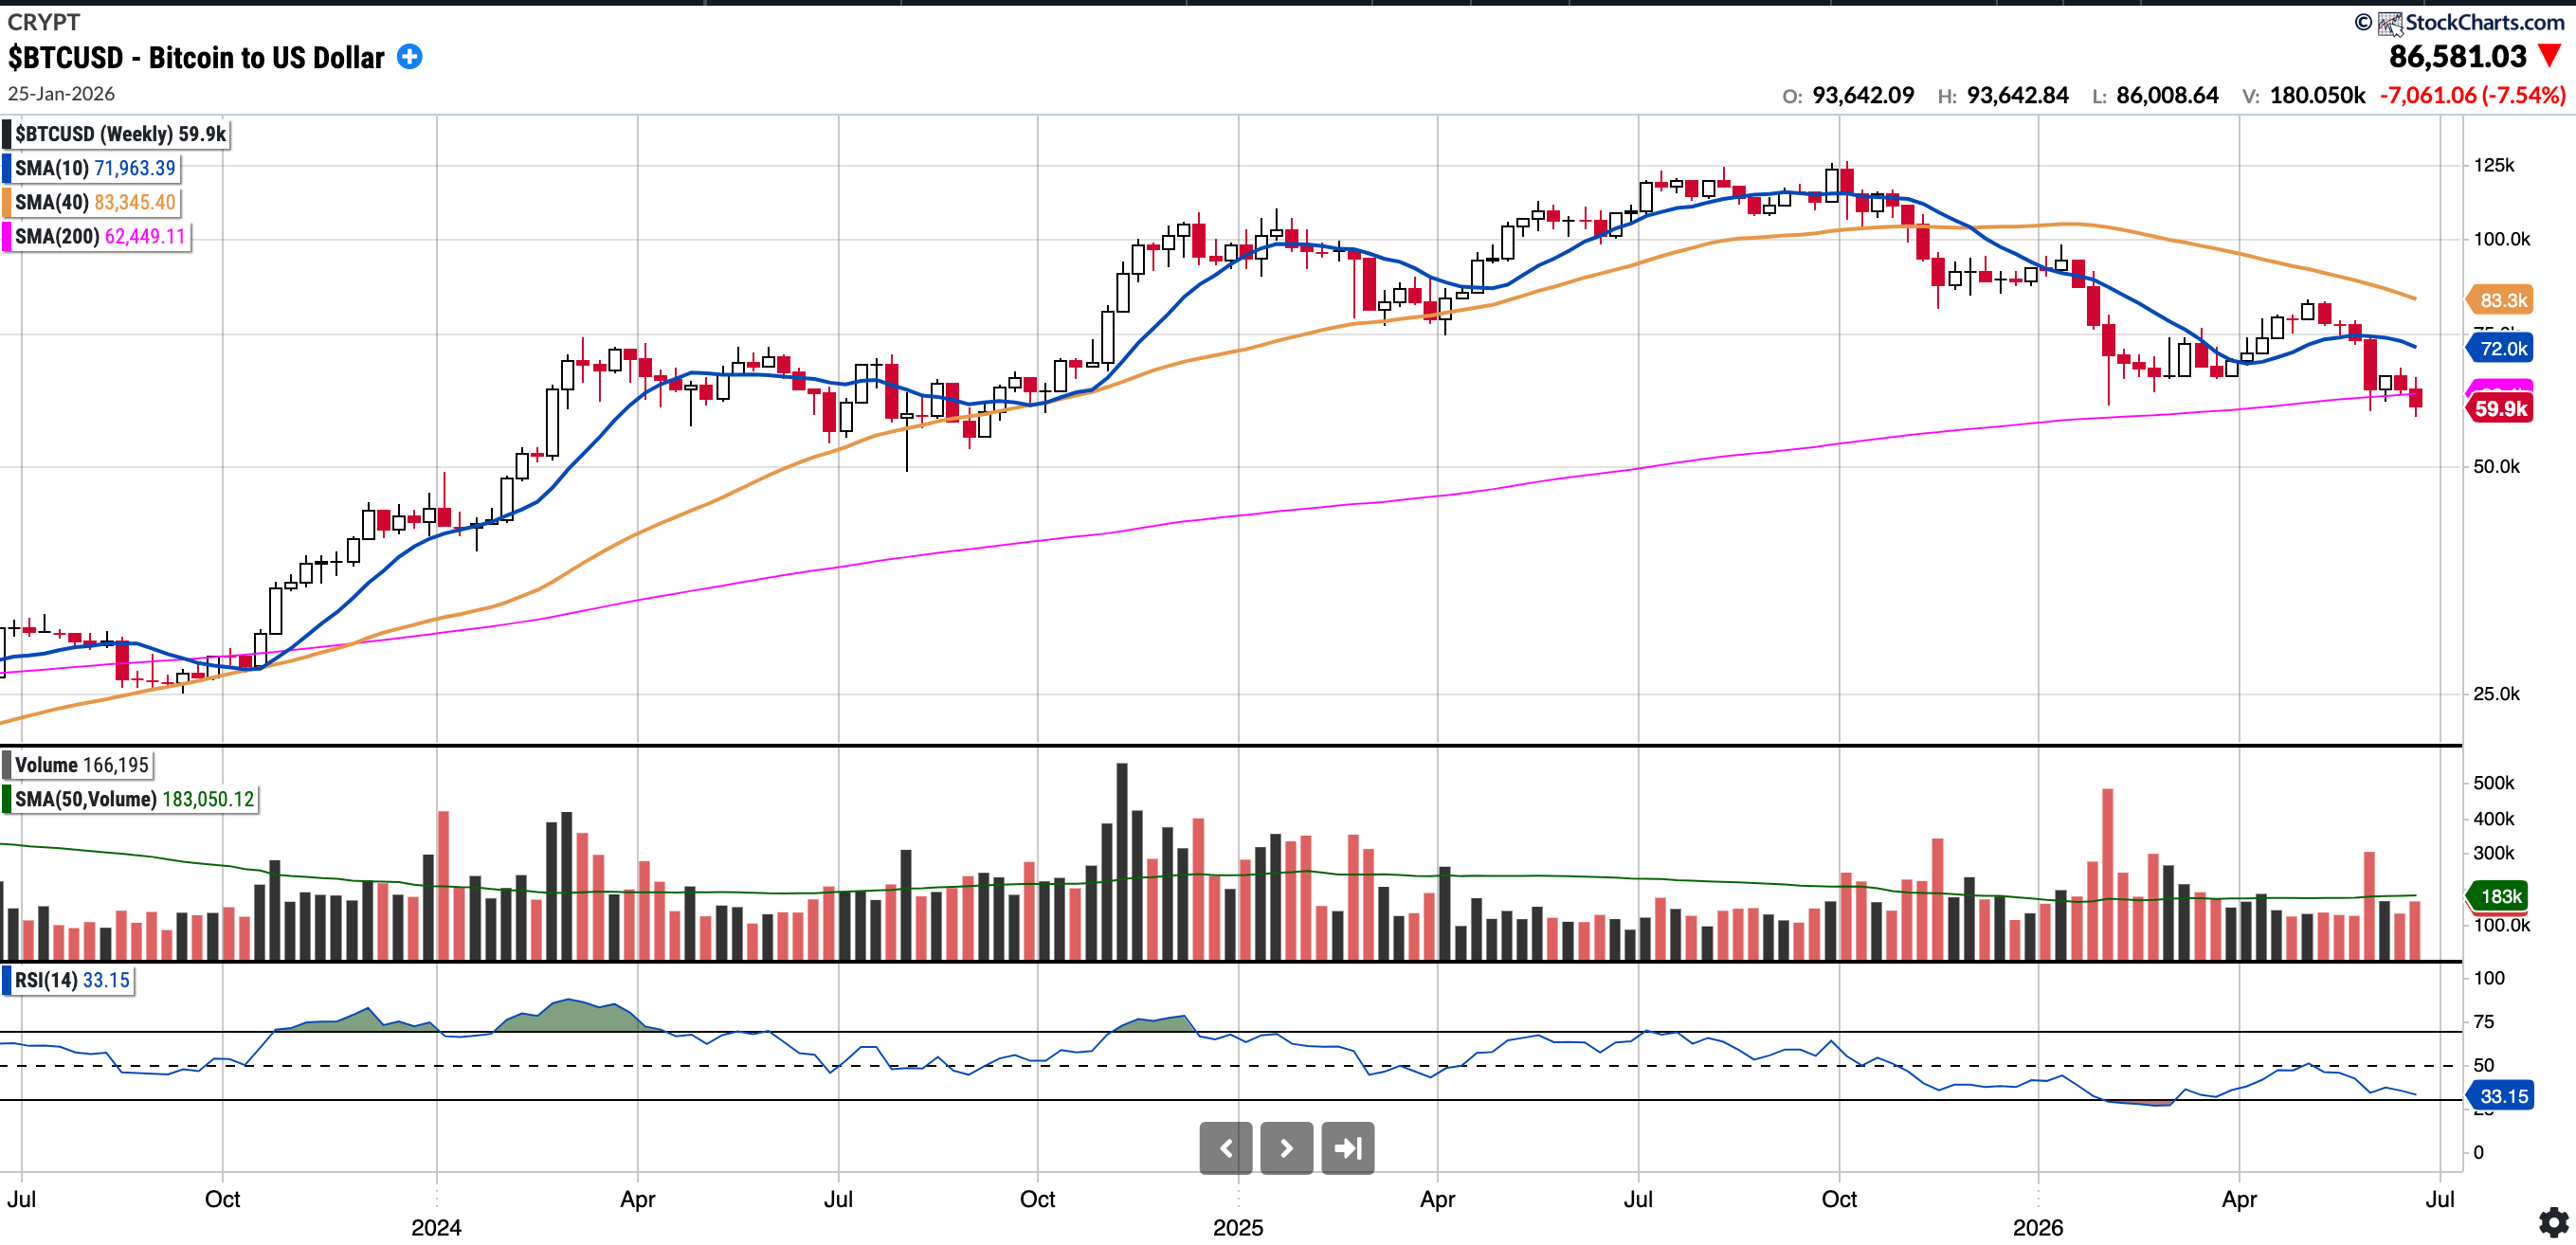
BTC (currently Long)
Currently trades at $59,891.43 14.73% below the 50SMA and 21.21% below the 200SMA.
RSI 31.34
-32.5% YTD.
The U.S. Senate Banking Committee advanced the Digital Asset Market Clarity Act to the full Senate in a bipartisan 15–9 vote a few weeks ago. Yet, despite this regulatory progress, BTC was firmly rejected at its 200-day moving average recently (twice) and is now below the 200-week moving average also.
As of Saturday, June 27th at 00:35 BST, BTC is trading below all key moving averages including the 5EMA. From a technical perspective, it remains technically weak. Bulls would want to see the 200-week MA hold, and then a reclaim of near-term moving averages. 74k above is a key level also and likely the 200 SMA will serve as resistance.
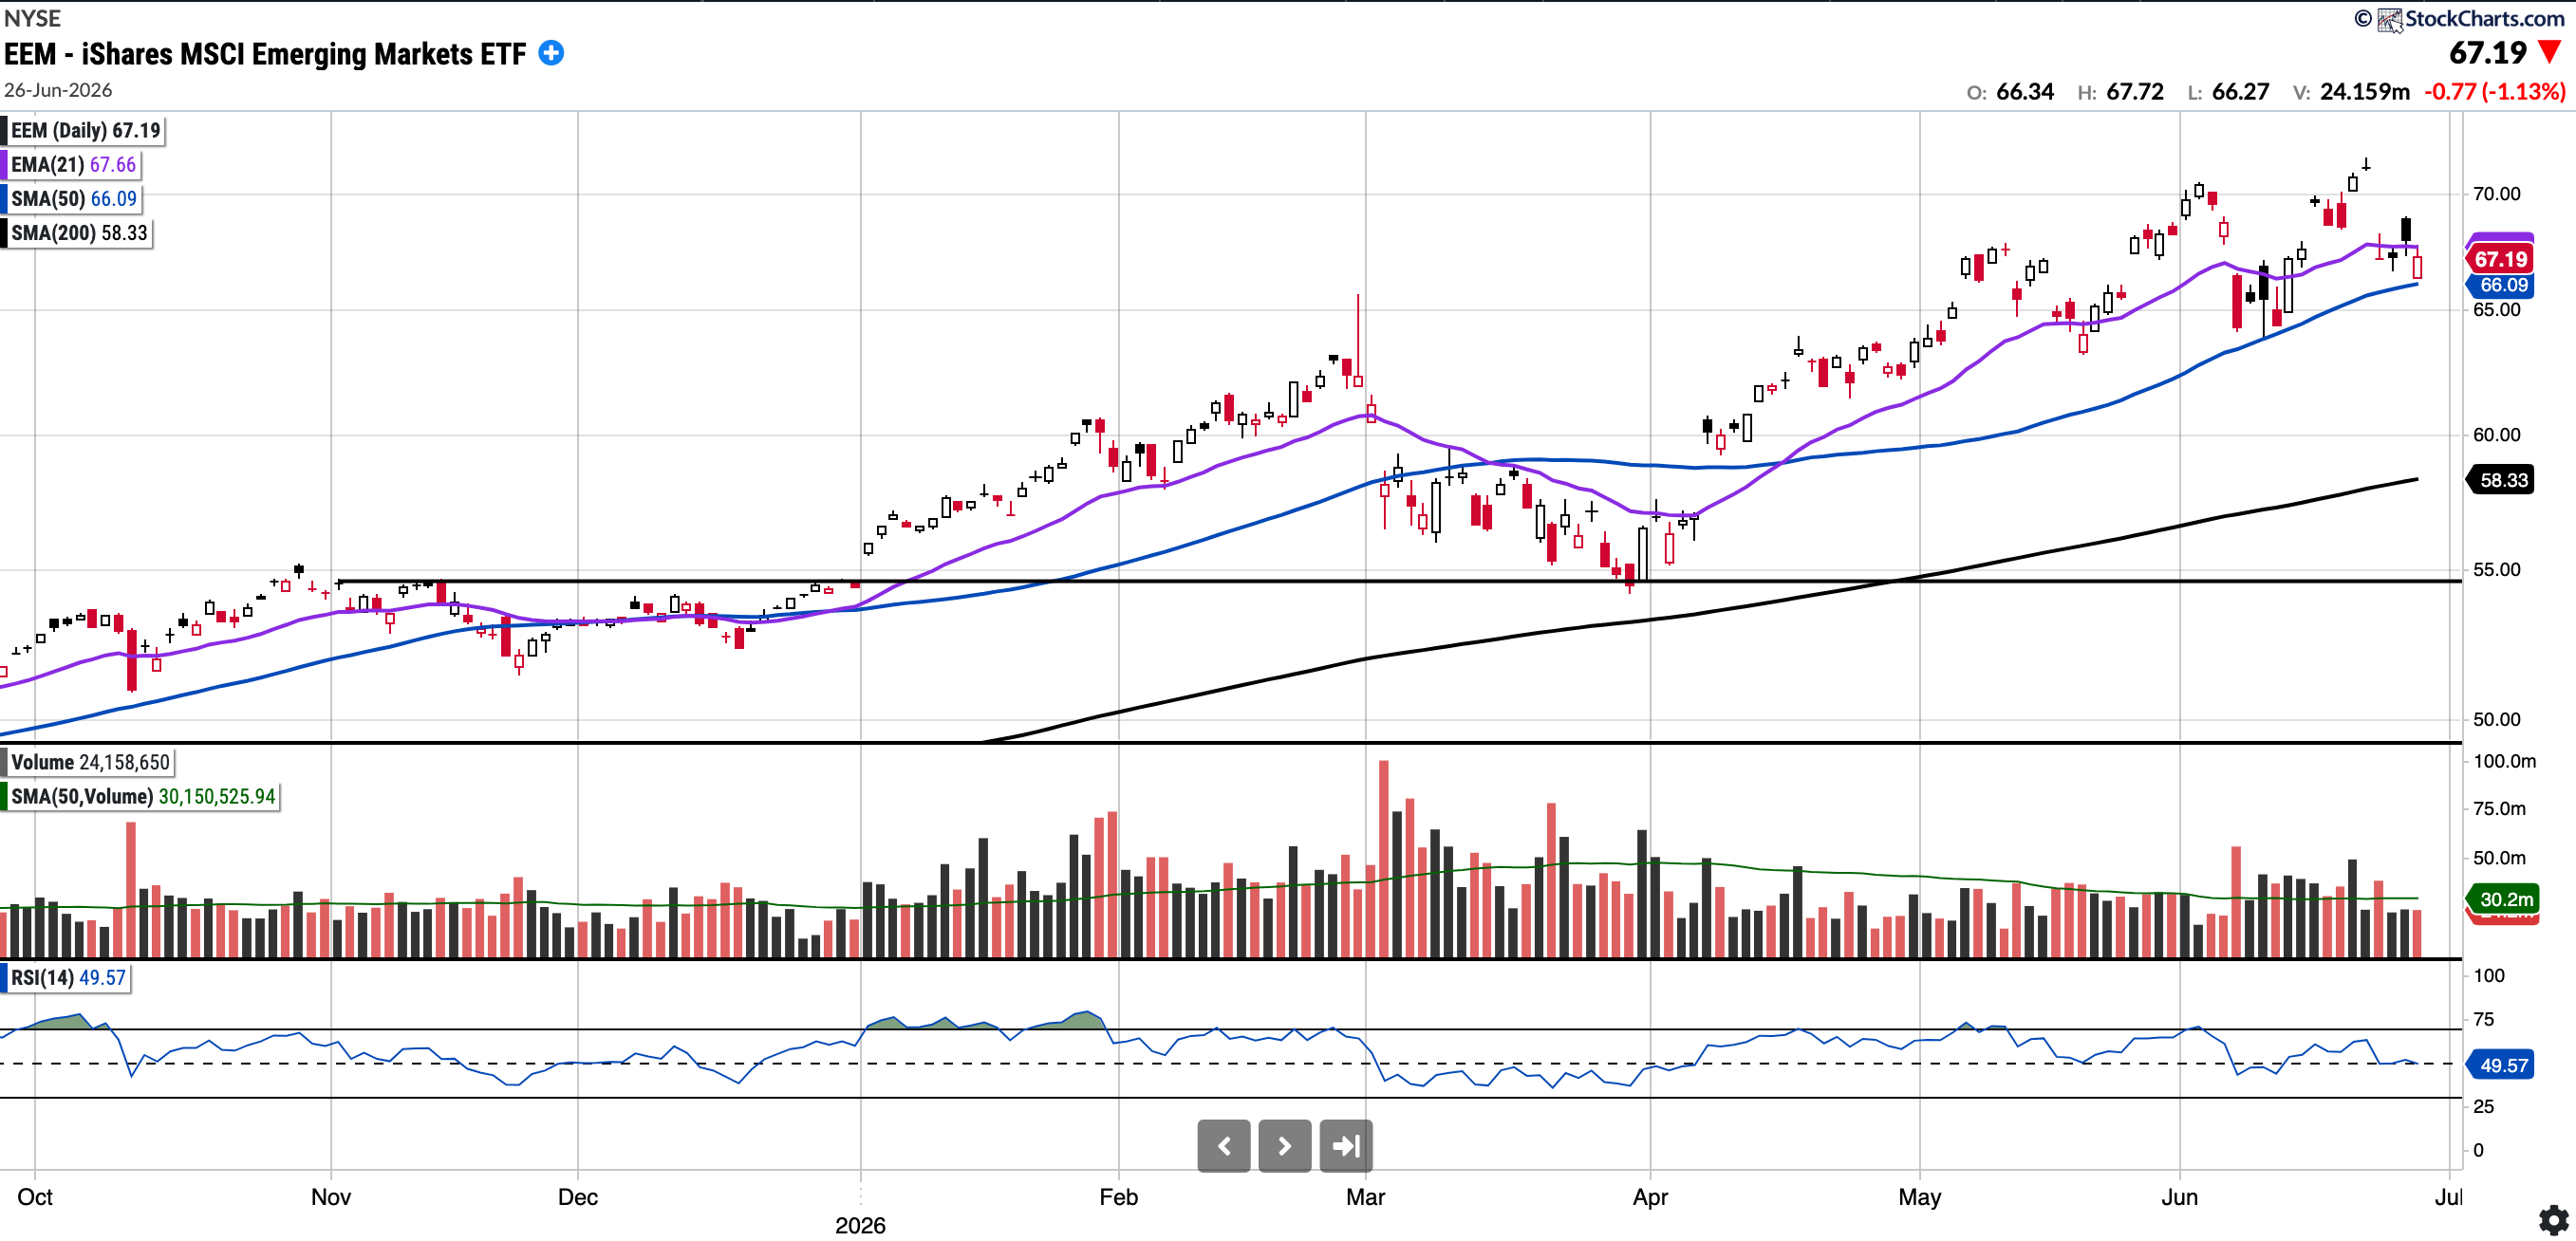
EEM
Currently trades at $67.19, 1.66% above the 50SMA and 15.19% above the 200SMA
RSI 49.57
+20.09% YTD
EEM remains in a strong uptrend and continues to comfortably outperform U.S. indices by more than 1250 bps year-to-date.
EEM closes the week below the 21 EMA but above the 50 SMA. After breaking to ATH’s on Monday, it is undergoing a shallow pullback. I do believe that the key levels to watch for pullback buys are here at the 50-day SMA (66.09), followed by the $55–$58 zone (horizontal support and 200-day SMA).
I believe EEM is setting up for multi-year outperformance; hence, I continue to watch it closely. If it can pull in further to the 200 day, I may be positioning long.
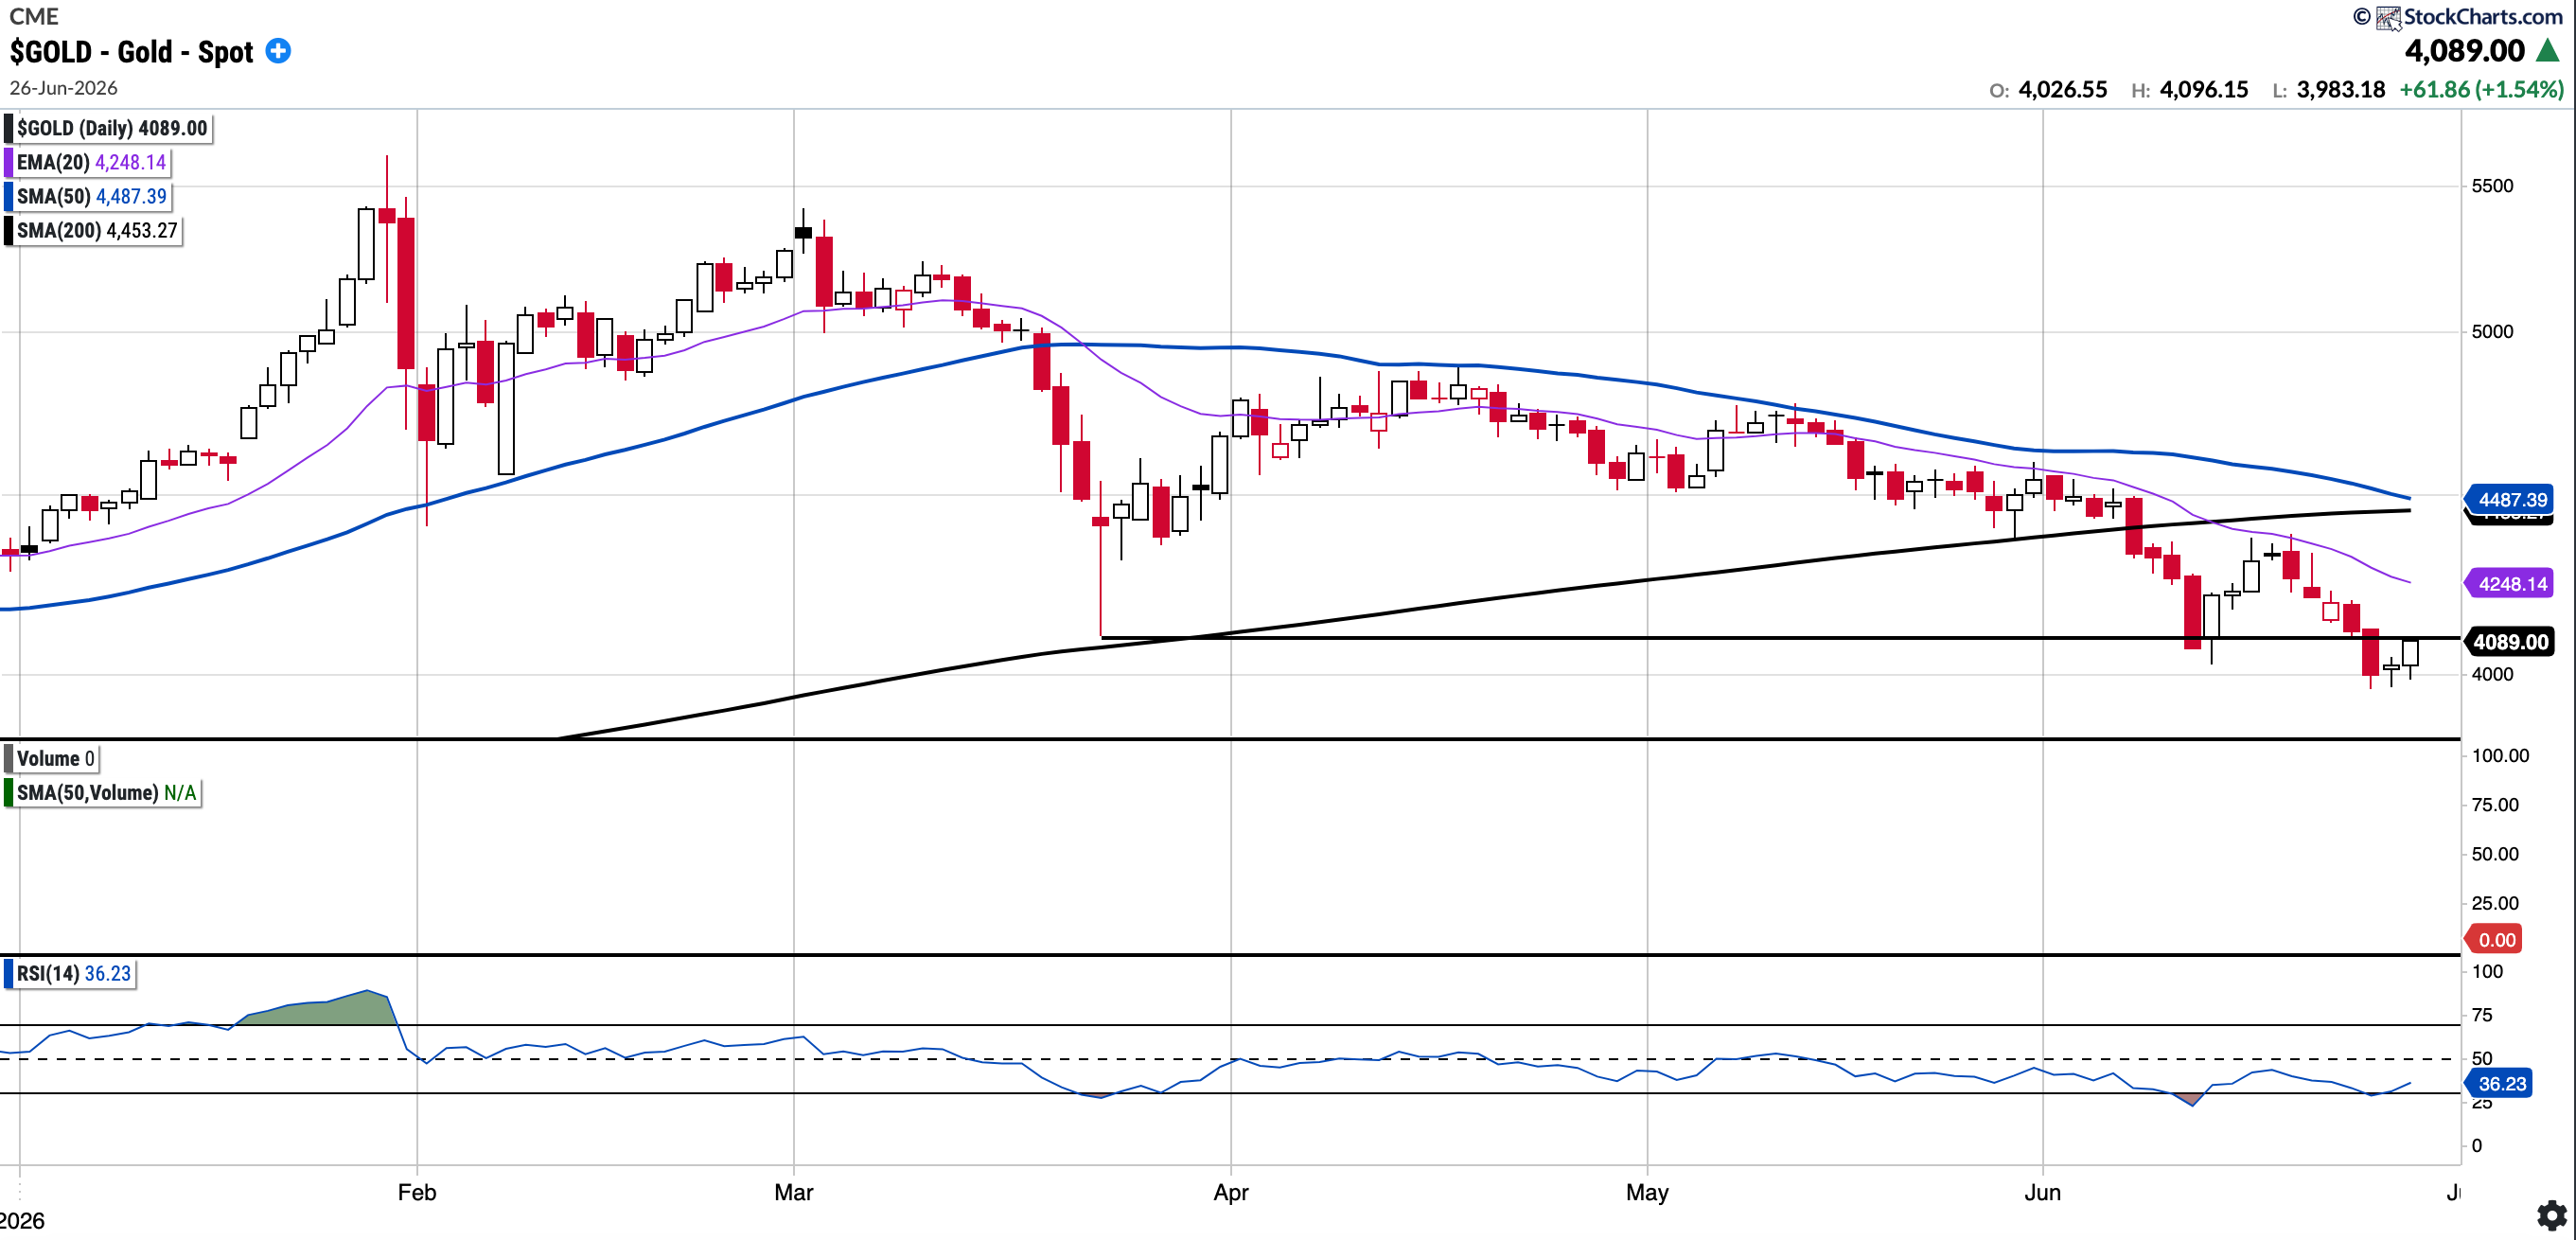
GOLD (Long Physical)
Currently trades at $4,089.00, 8.88% below the 50SMA and 8.18% below the 200SMA
RSI 36.23
-5.4% YTD
Gold lost its 200-day moving average recently for the first time since its bull run began in late 2023. That is notable and potentially concerning if not reclaimed.
Gold was rejected at the descending 21-day EMA last week and also has fallen below the 4,100 level of interest. Bulls would like to see the key overhead moving averages reclaimed, starting with the 200-day.
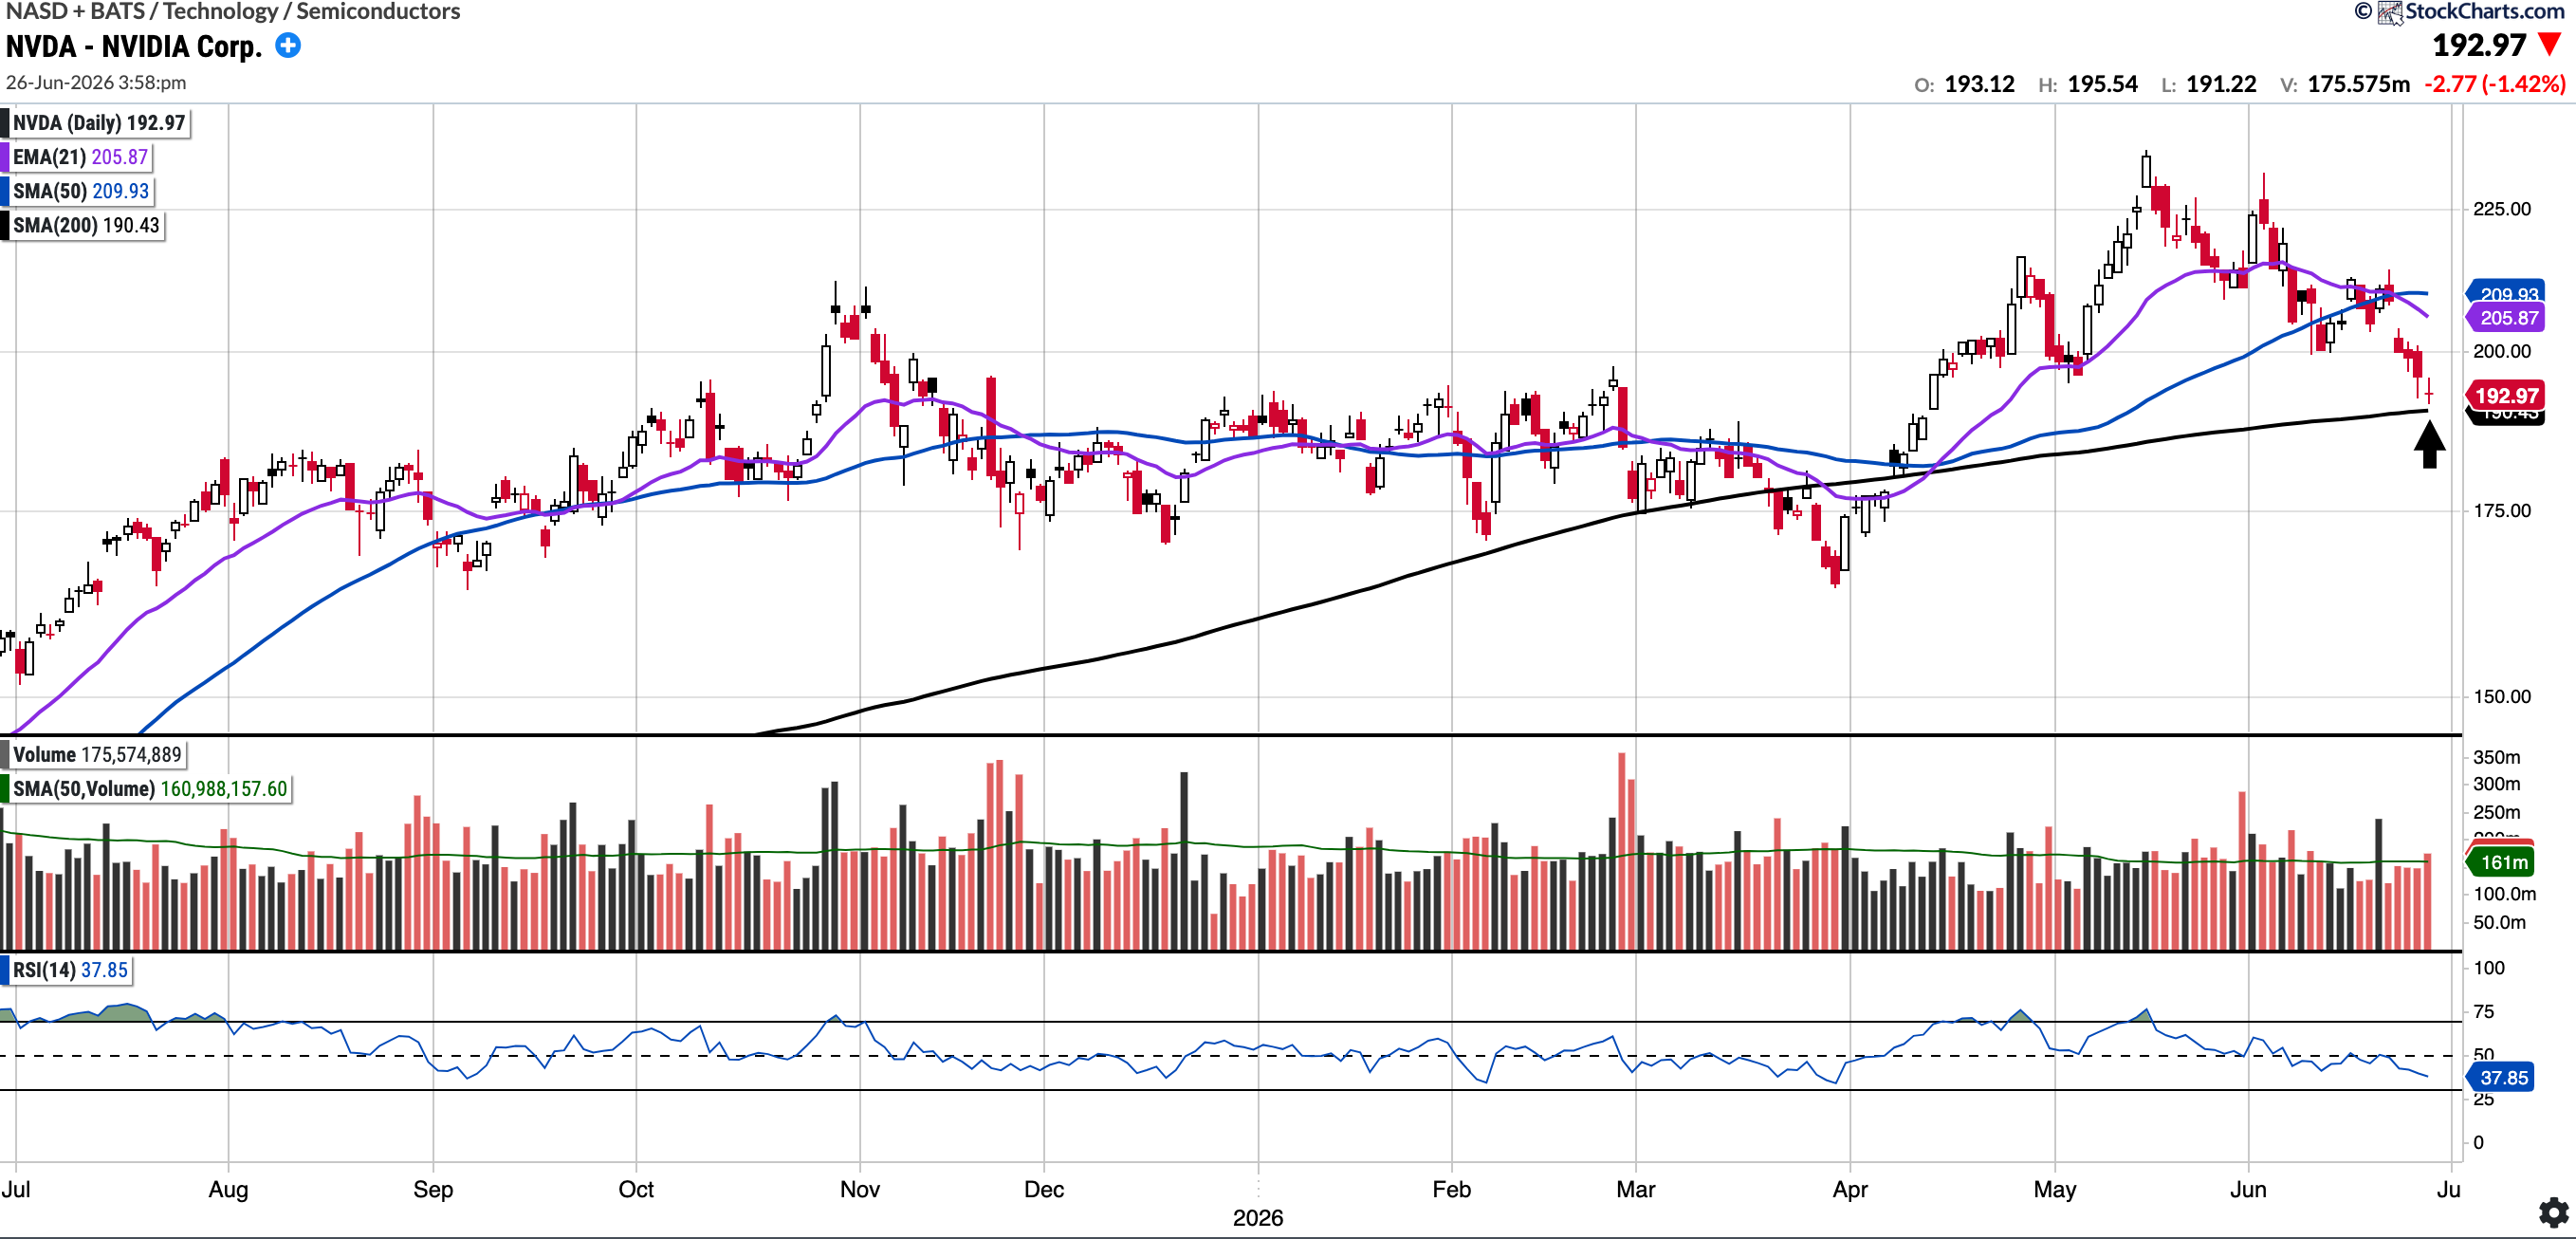
NVDA (Currently Long)
Currently trades at $192.53, 8.28% below the 50SMA and 1.1% above the 200SMA
RSI 37.85
2.07% YTD
NVDA traded as high as $240.00 a few weeks ago on Friday to complete the measured move post its breakout. However, since its Q1 print, NVDA has pulled back.
It is now trading just above its 200-day moving average. This will be an important level to hold because if it is lost, it is plausible that we retest the 170s, a level where it has often found support.
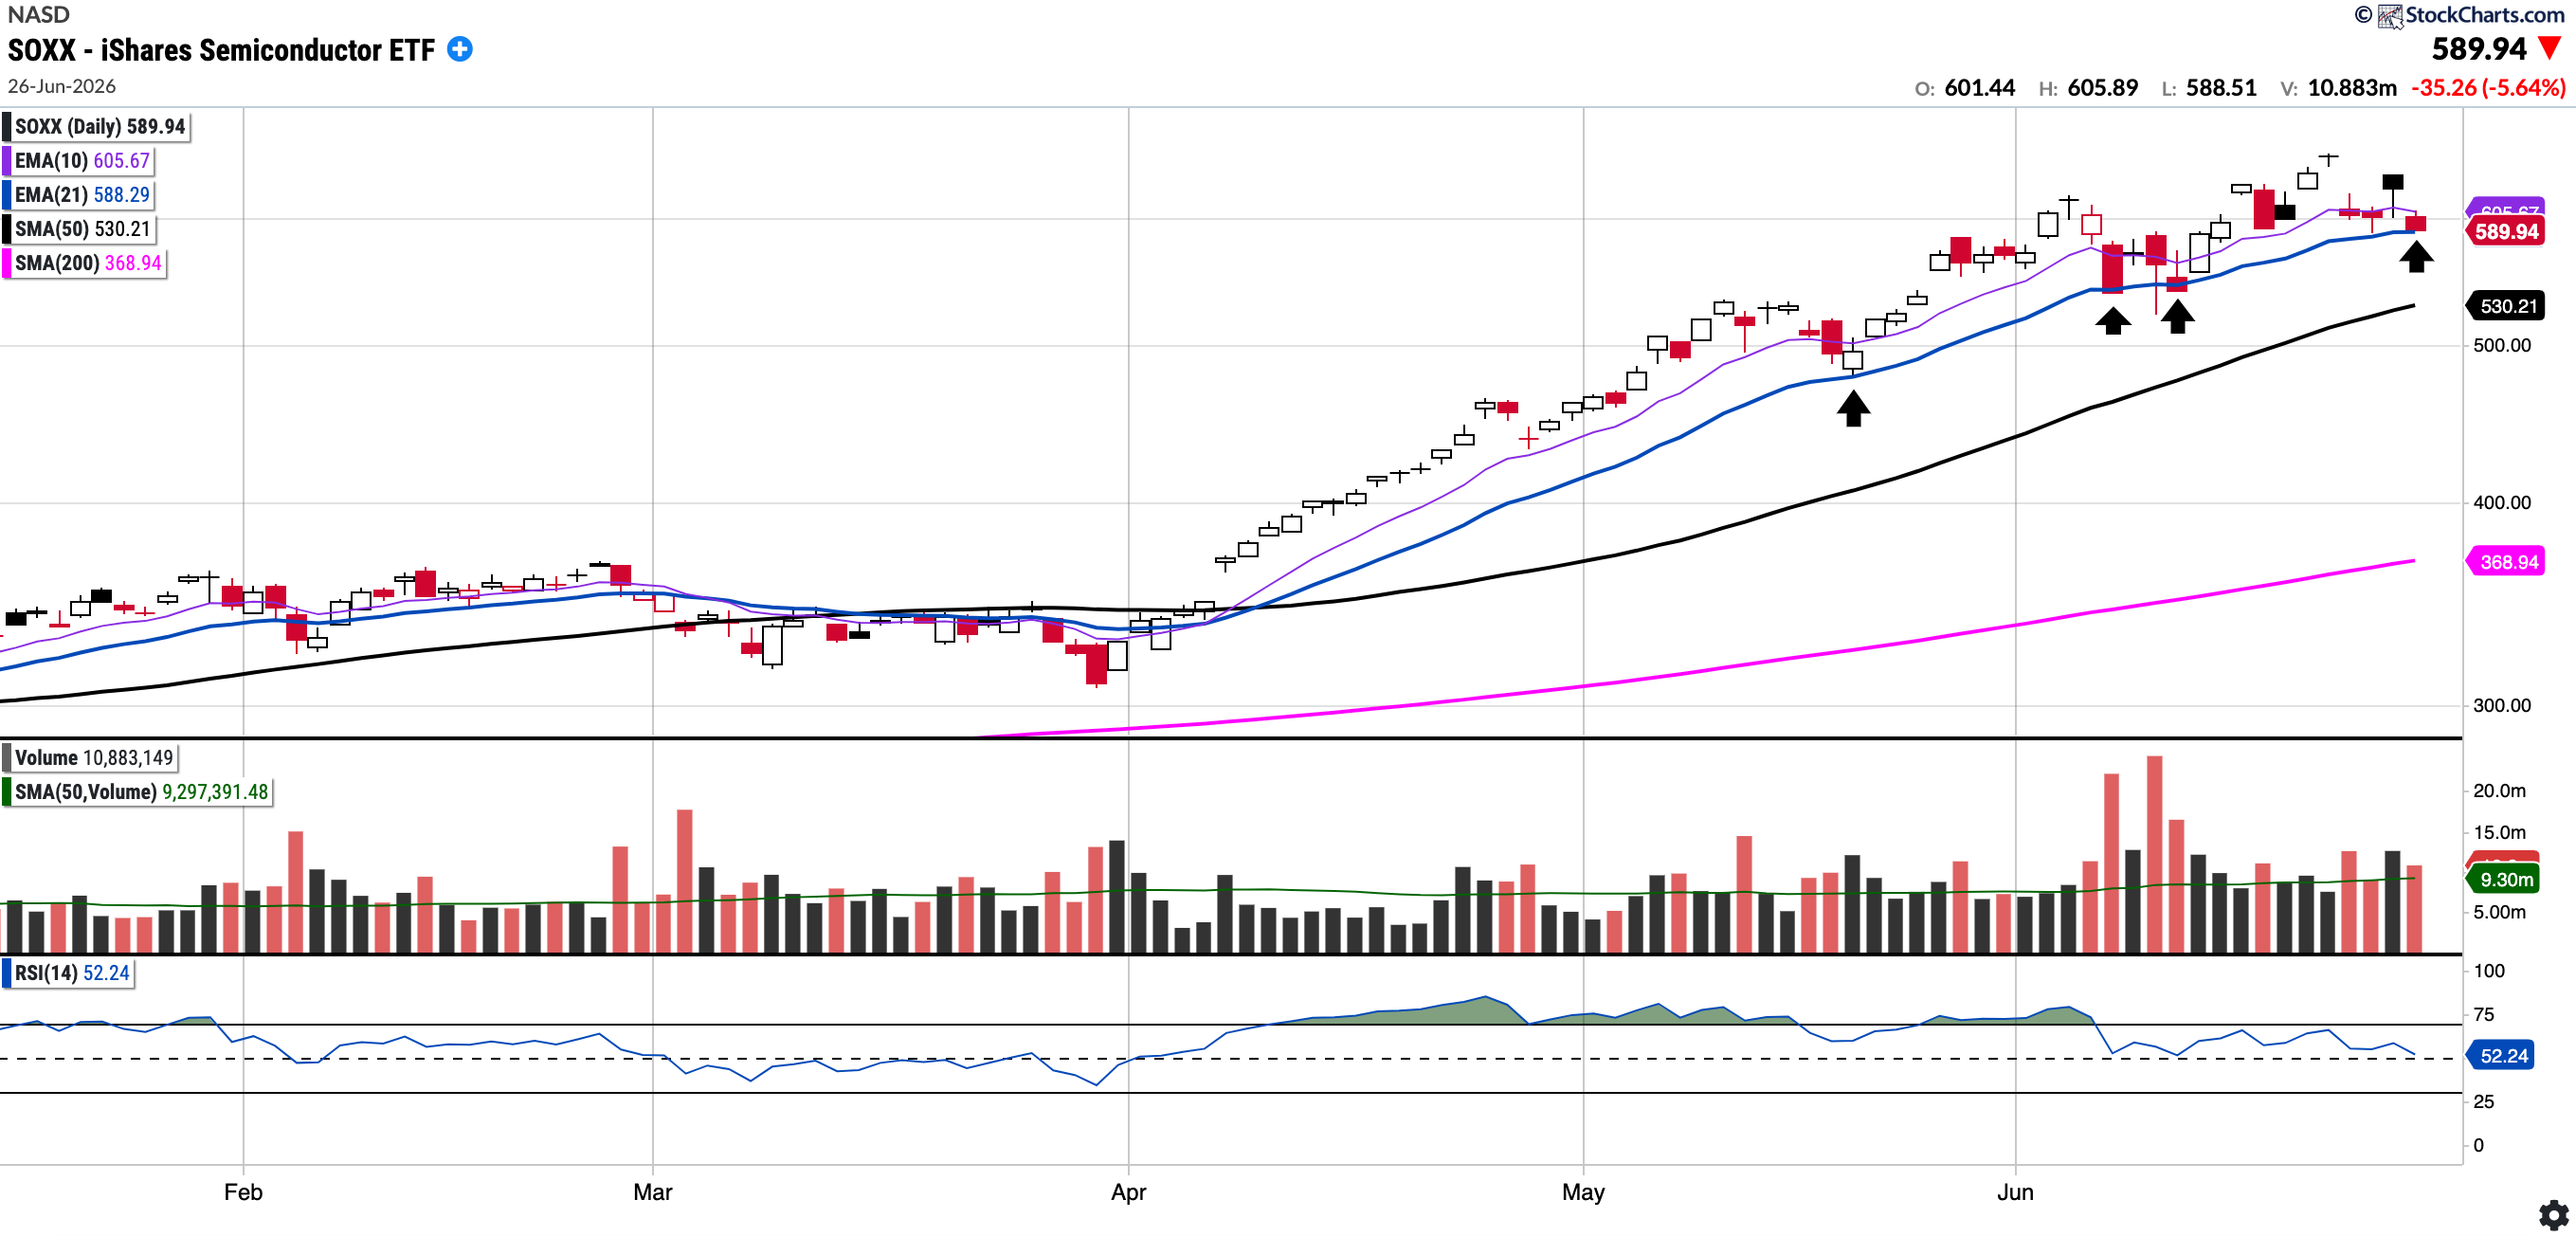
SOXX
Currently trades at $589.94, 11.27% above the 50SMA and 59.9% above the 200SMA
RSI 52.24
88.27% YTD
SOXX has pulled back to the 21-day moving average, a level it has only tested a few times since the move began in April (see arrows). It will be interesting to see if semis rest here or if they continue to run. A deeper pullback to the 50-day moving average may not be a bad thing, and I would be tempted to add there.
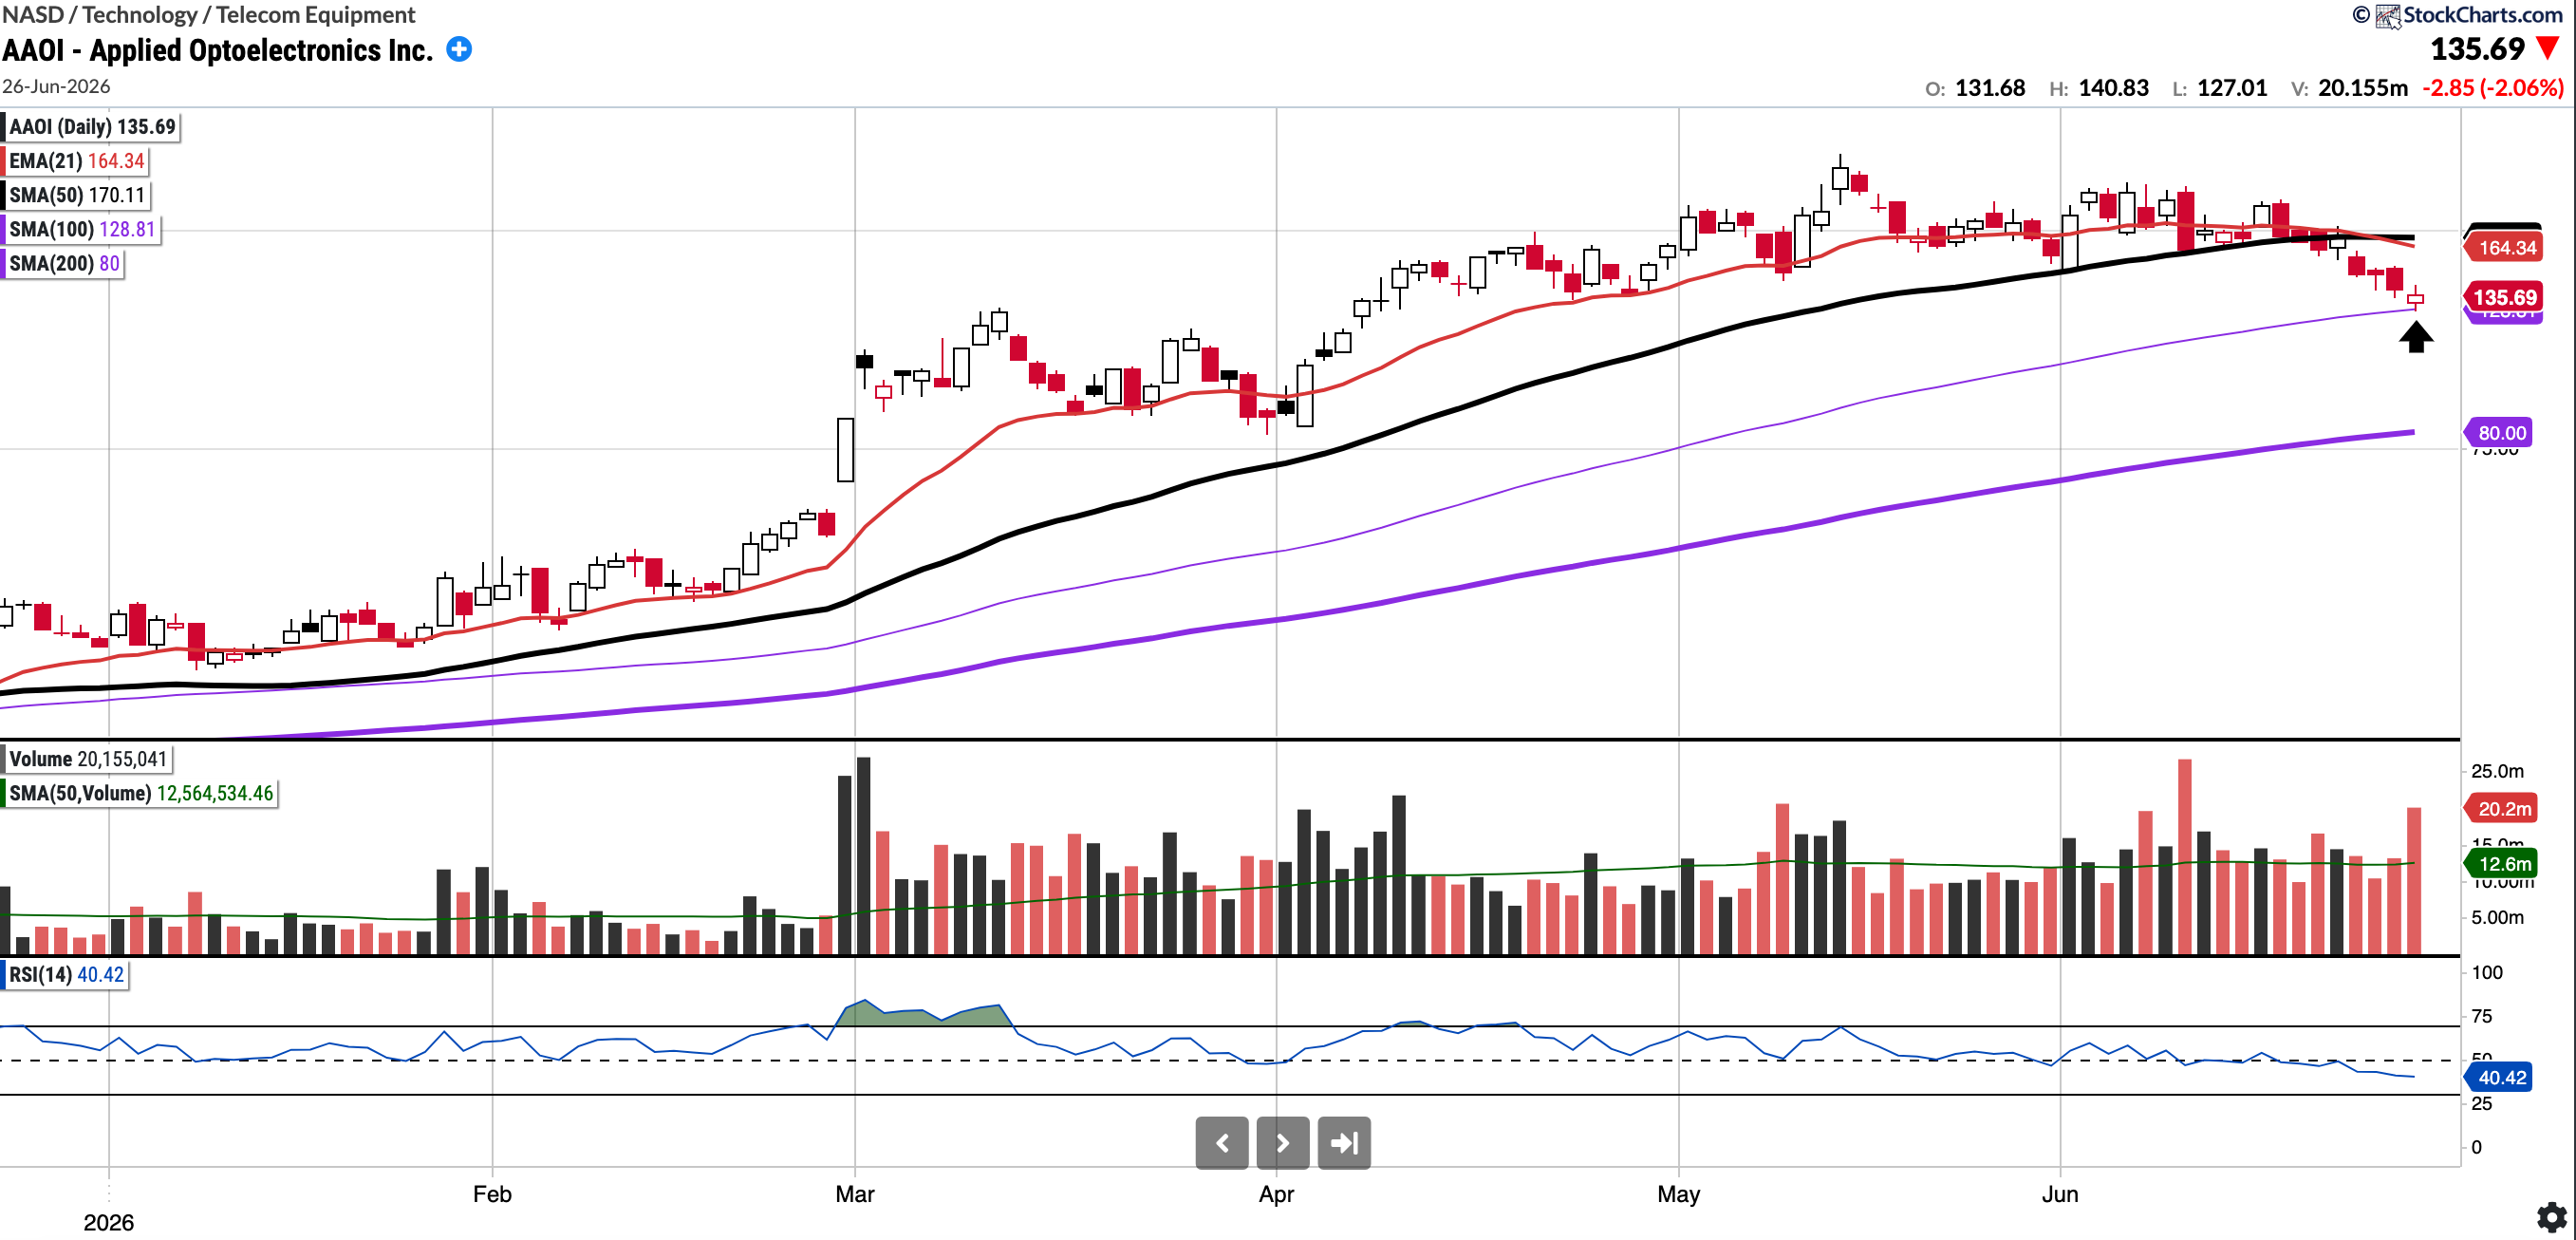
AAOI
Currently trades at $135.69, 20.23% below the 50SMA and 69.61% above the 200SMA
RSI 46.58
242.65% YTD
Last week I wrote on AAOI:
AAOI, a photonics and optical networking company, has been a leading performer this year, up more than 350%. I do note, however, that it has been making lower highs for some time and, more recently, lower lows as well. It has also been selling off on volume and has lost its 50-day Simple Moving Average (SMA 50). These are signs that it may be due for a consolidation or a pullback. We will see how it pans out, but these are interesting signs nonetheless.
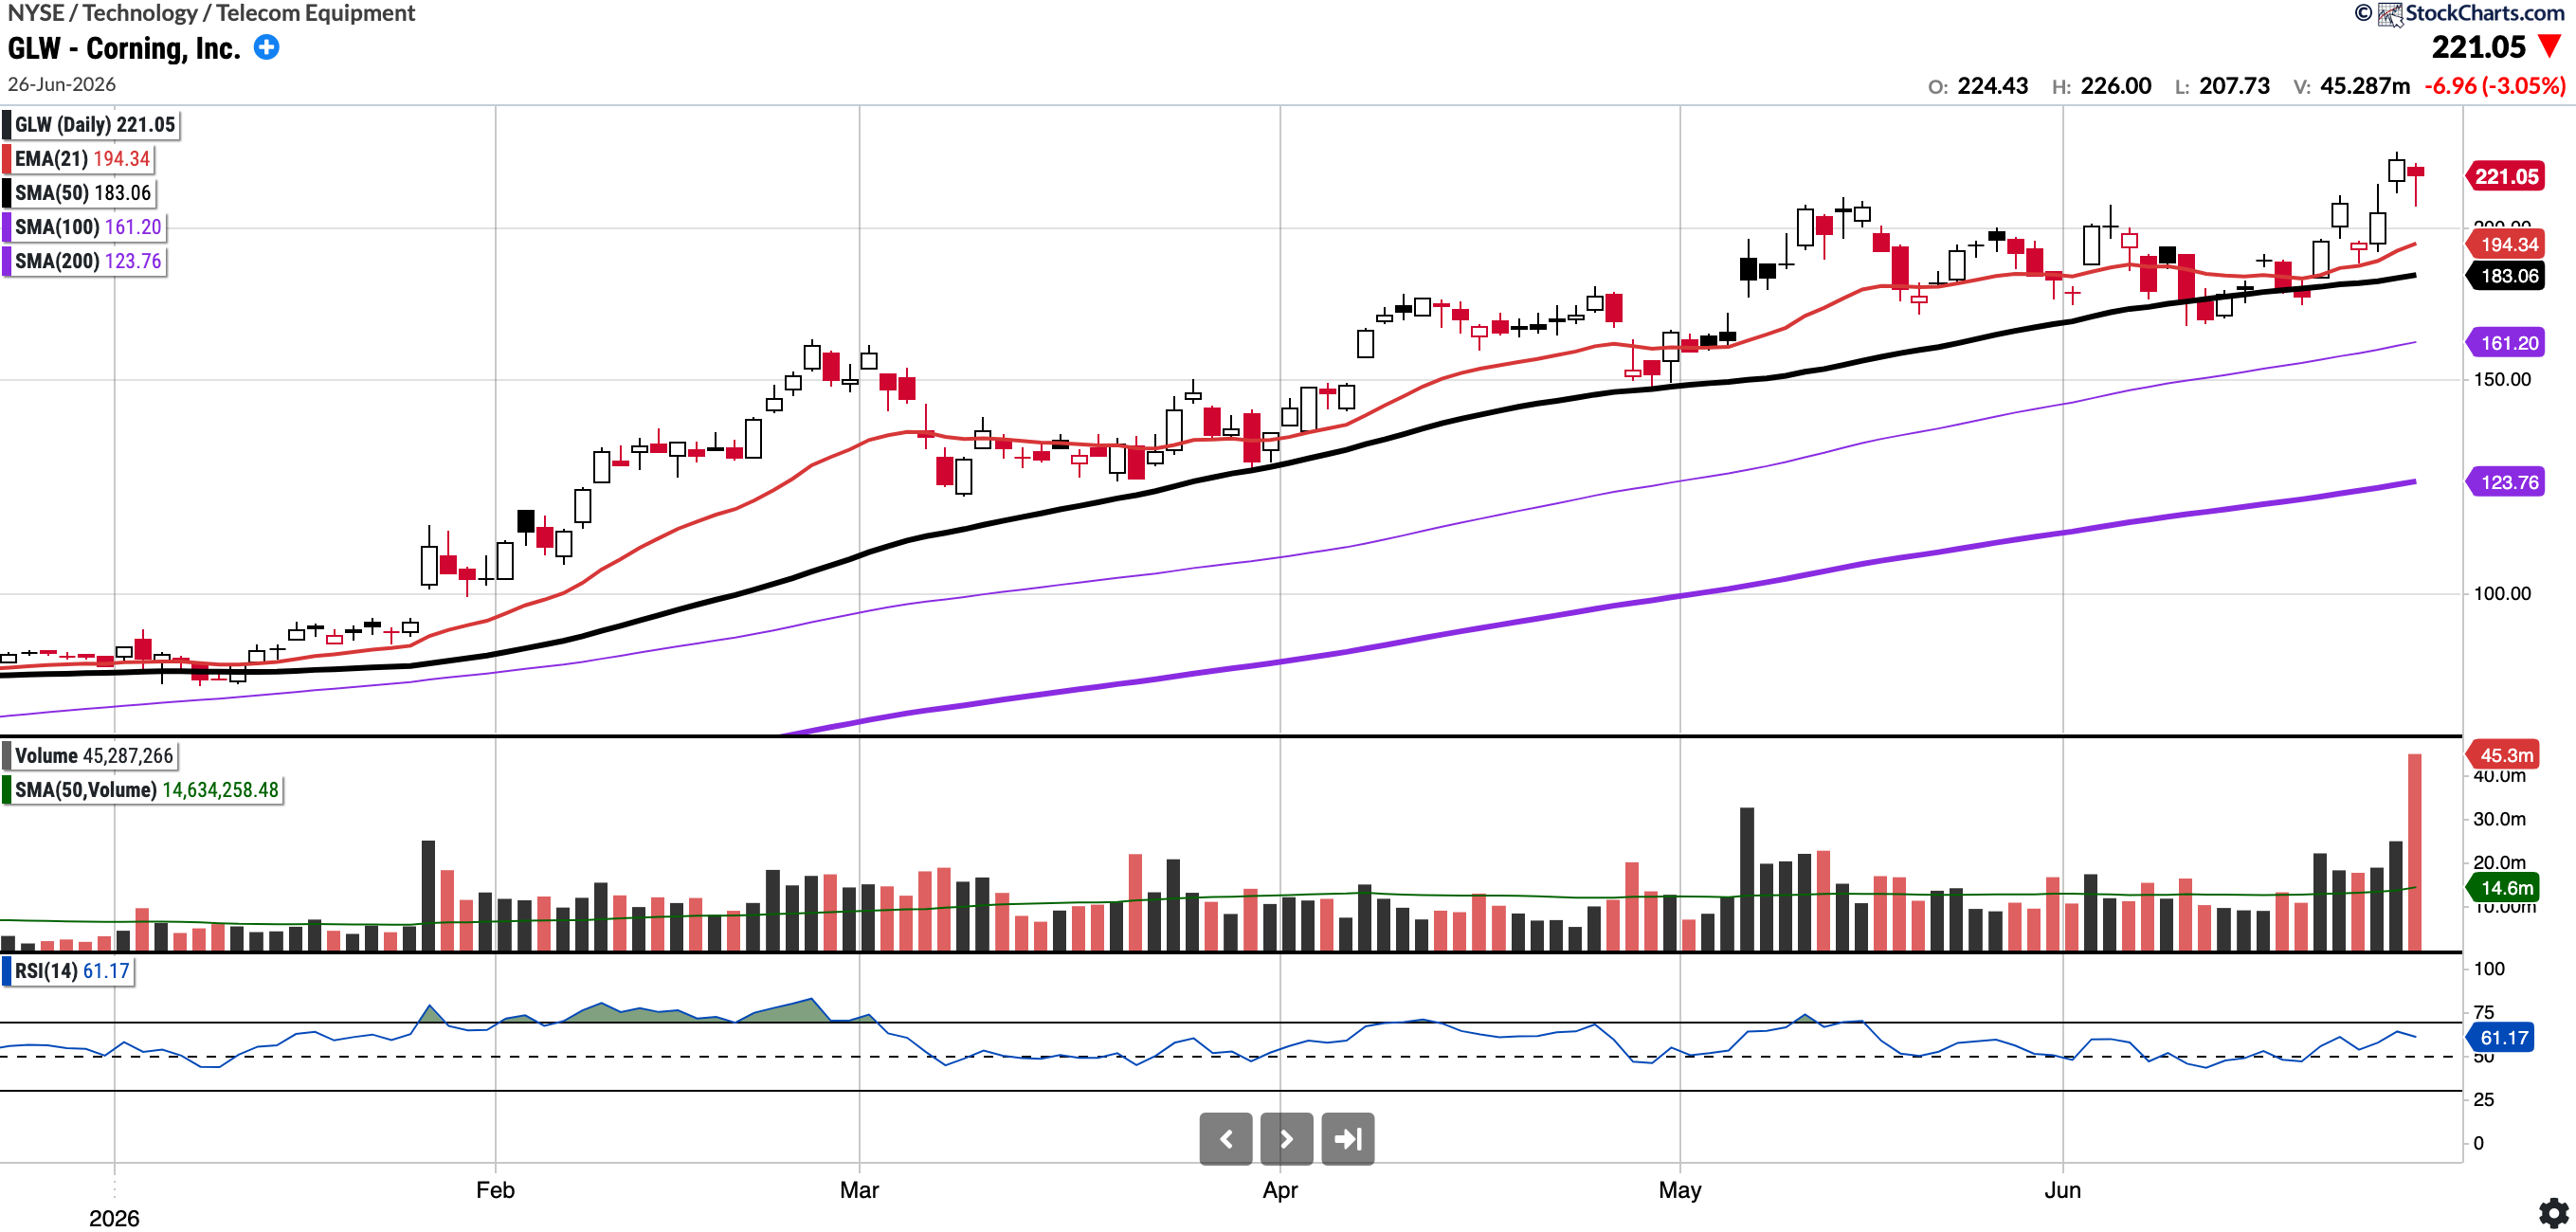
This week it has pulled back meaningfully, though I do note it found support at the 100-SMA. However, I don’t see AAOI as a leading name in its group and prefer COHR, LITE, and GLW. The GLW chart is included below, showing it is holding up much better.
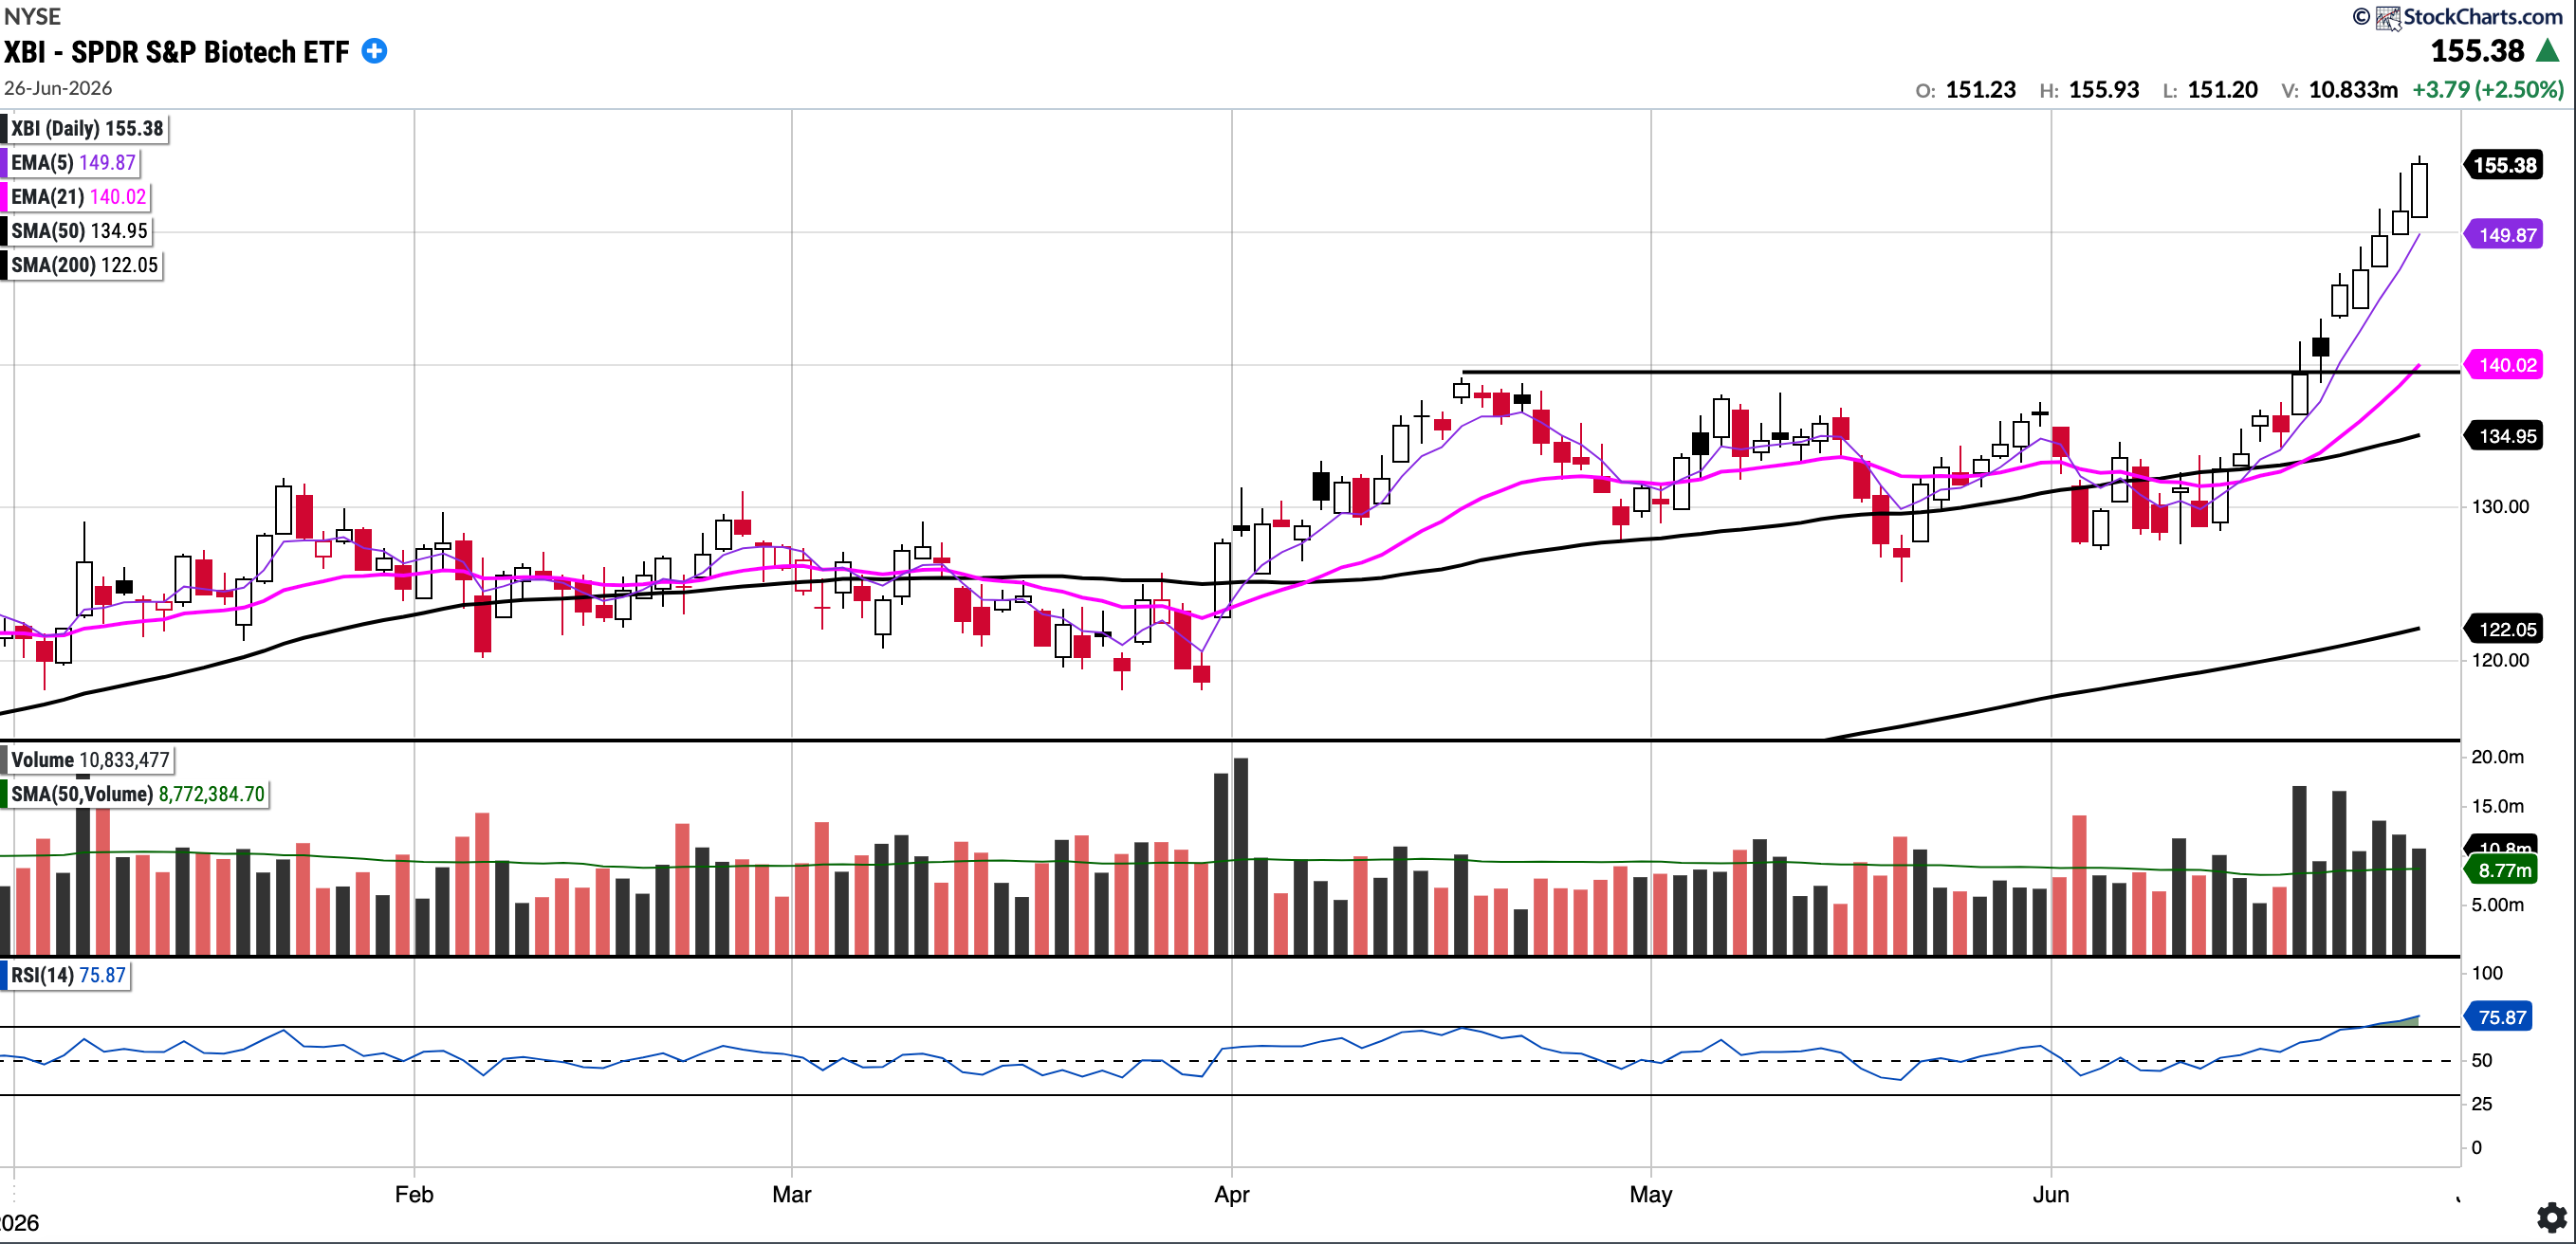
XBI
Currently trades at $155.38, 15.13% above the 50SMA and 27.31% above the 200SMA
RSI 75.87
27.99% YTD
The XBI (S&P Biotech ETF) has shown a lot of strength in recent weeks, but frankly, it has been in a bull market since last August. It is overbought in the near term but is definitely one to keep on the watchlist. A chart is included below, along with screengrabs of the top 20 performers within this ETF.


Important: I will feature several other Trading ideas in the Watchlist Snapshot post, so keep a look out for that post later. It will also include my Trading Account holdings.
Recent weeks post (link below) have had countless positions responding to key levels and running sharply such as:
ASTS 74 to 130
FLY 32 to 62
NOK 12.4 to 16
RBRK 60 to 78
CIFR 18 to 25
USAR 19 to 30
ORCL 160 to 225

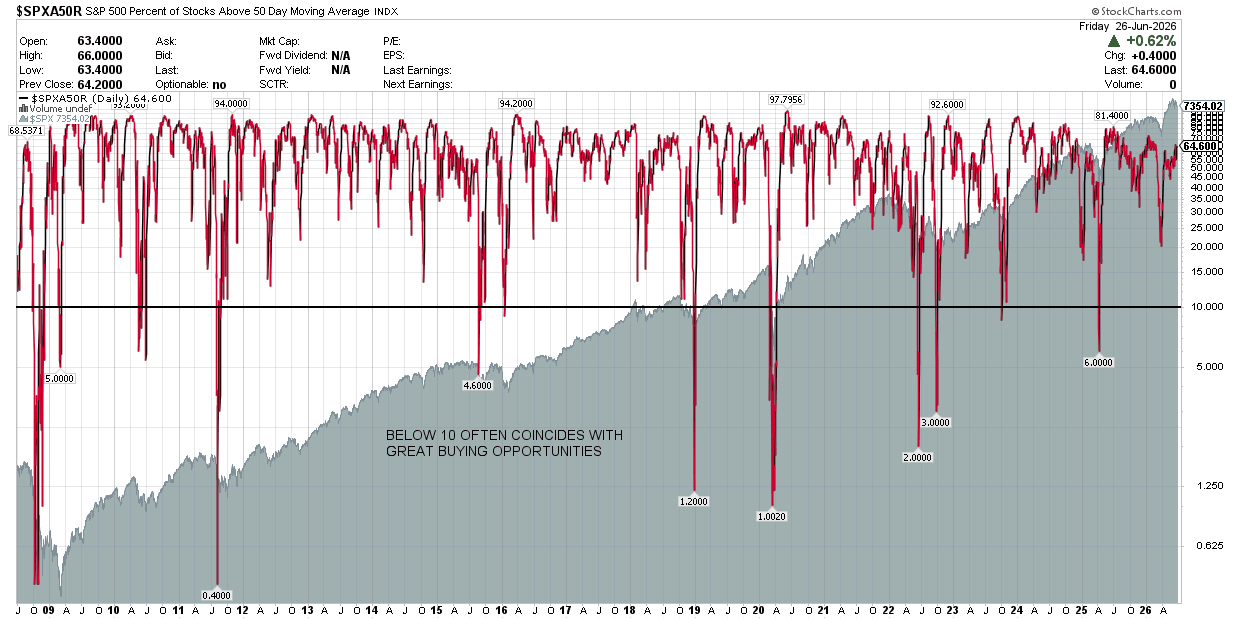
S&P 500 Percentage of Stocks Above the 50 Day Moving Average: Currently 64.6%
Breadth increased this week, with the percentage of stocks above the 50-day moving average now at 64.6%
Notable portfolio changes in previous week (all updated live in subscriber channels):
