
Preview of the Week Ahead: W/C June 22, 2026
SPX Back Above the 21-Day, Semiconductors Leading, and Megacaps Remain Weak

Hope you all are having a good weekend. Below, we will be previewing the upcoming week’s events and providing a portfolio update as usual.
Format for what is covered in this weekly preview:
A Look at the Indices
Key Upcoming Economic Events
Upcoming Earnings Reports
Charts
Notable Portfolio Changes from the Previous Week
Current Portfolio Holdings
Position size, cost basis, and commentary on each holding regarding the intended holding period and any planned activity
Closing Thoughts
I recommend checking out the most recent Monthly Portfolio and Performance Update below:

Also, ensure to check out the post below regarding upcoming pricing changes plus feedback from our readers:

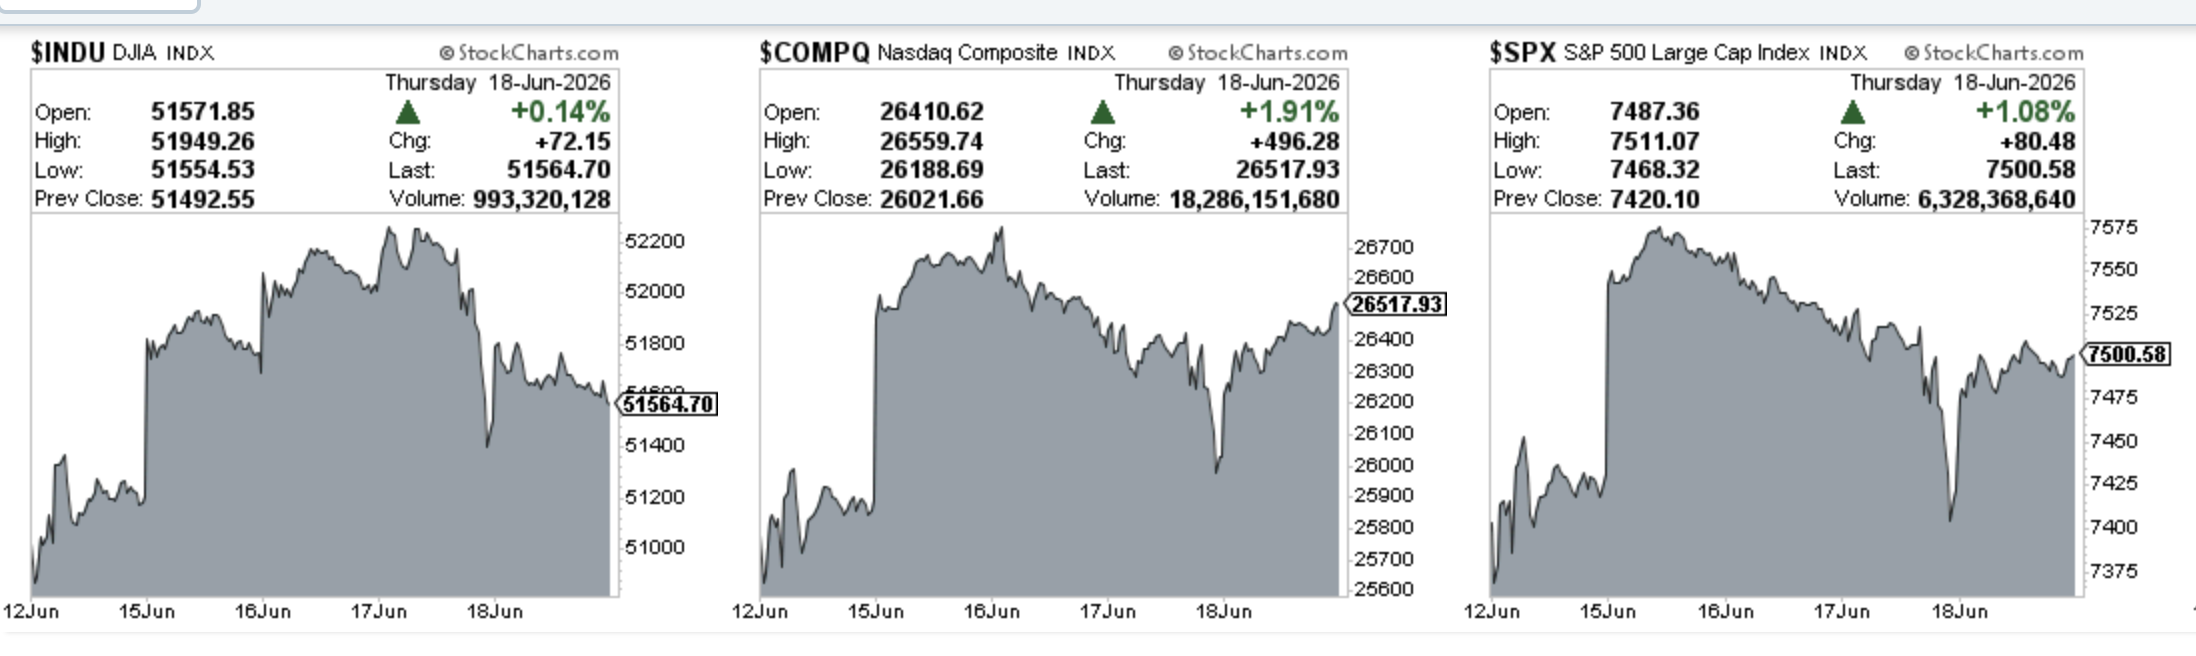
Indices
Dow Jones advanced 0.86% in the last week
S&P 500 advanced 1.41% in the last week
Nasdaq Composite advanced 3.14% in the last week
IWM advanced 1.24% in the last week
Key upcoming economic events
Monday, June 22
Fed Governor Christopher Waller Speaks (8:00 AM ET)
Chicago Fed National Activity Index
Tuesday, June 23
S&P Global Flash U.S. PMIs (June)
CB Consumer Confidence (10:00 AM ET)
Richmond Fed Manufacturing Index (10:00 AM ET)
Wednesday, June 24
New Residential Sales (10:00 AM ET)
Federal Reserve Bank Stress Test Results
Thursday, June 25
PCE Price Index & Personal Income/Spending (May)
Q1 GDP (Third & Final Estimate) (8:30 AM ET)
Advance Durable Goods Orders (May) (8:30 AM ET)
Initial Jobless Claims (8:30 AM ET)
Friday, June 26
University of Michigan Consumer Sentiment Index (Final) (10:00 AM ET)
Upcoming Earnings
Below is the infographic by Earnings Whispers highlighting the schedule for this week:

Charts
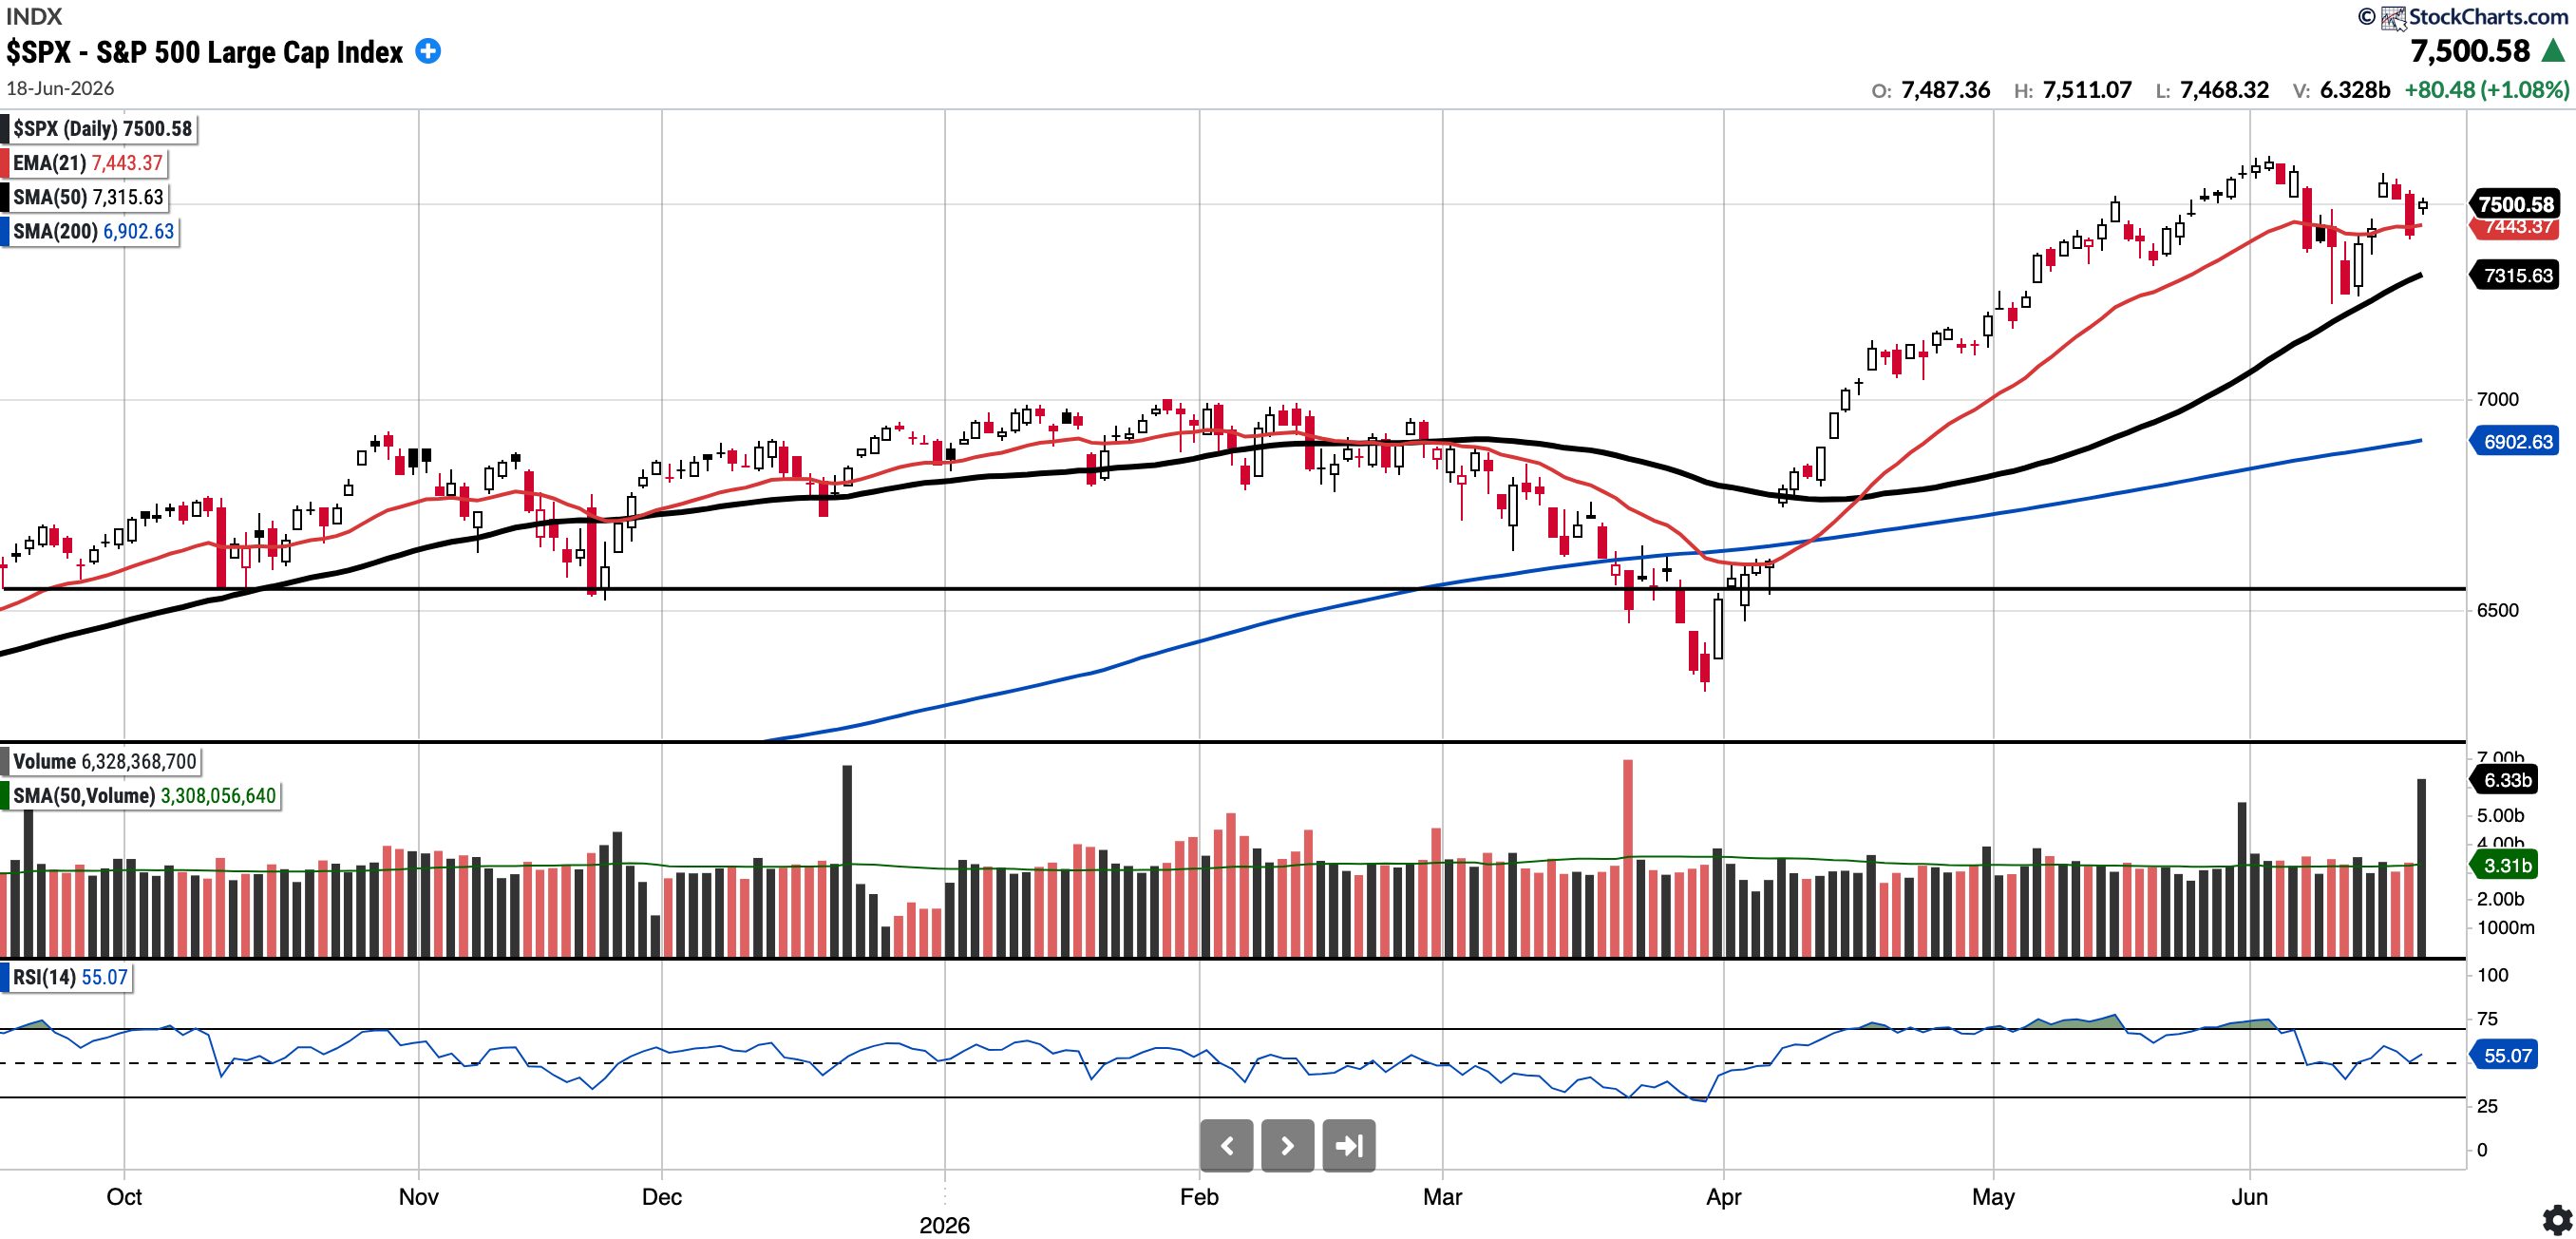
SPX
Currently trades at 7500.58, 2.53% above the 50SMA and 8.66% above the 200SMA.
RSI 55.07
9.36% YTD
Distribution days in the last week: 1
The S&P 500 had a volatile week following Monday's gap up, though it did manage to close above the 21-day EMA. There was one distribution day this week.
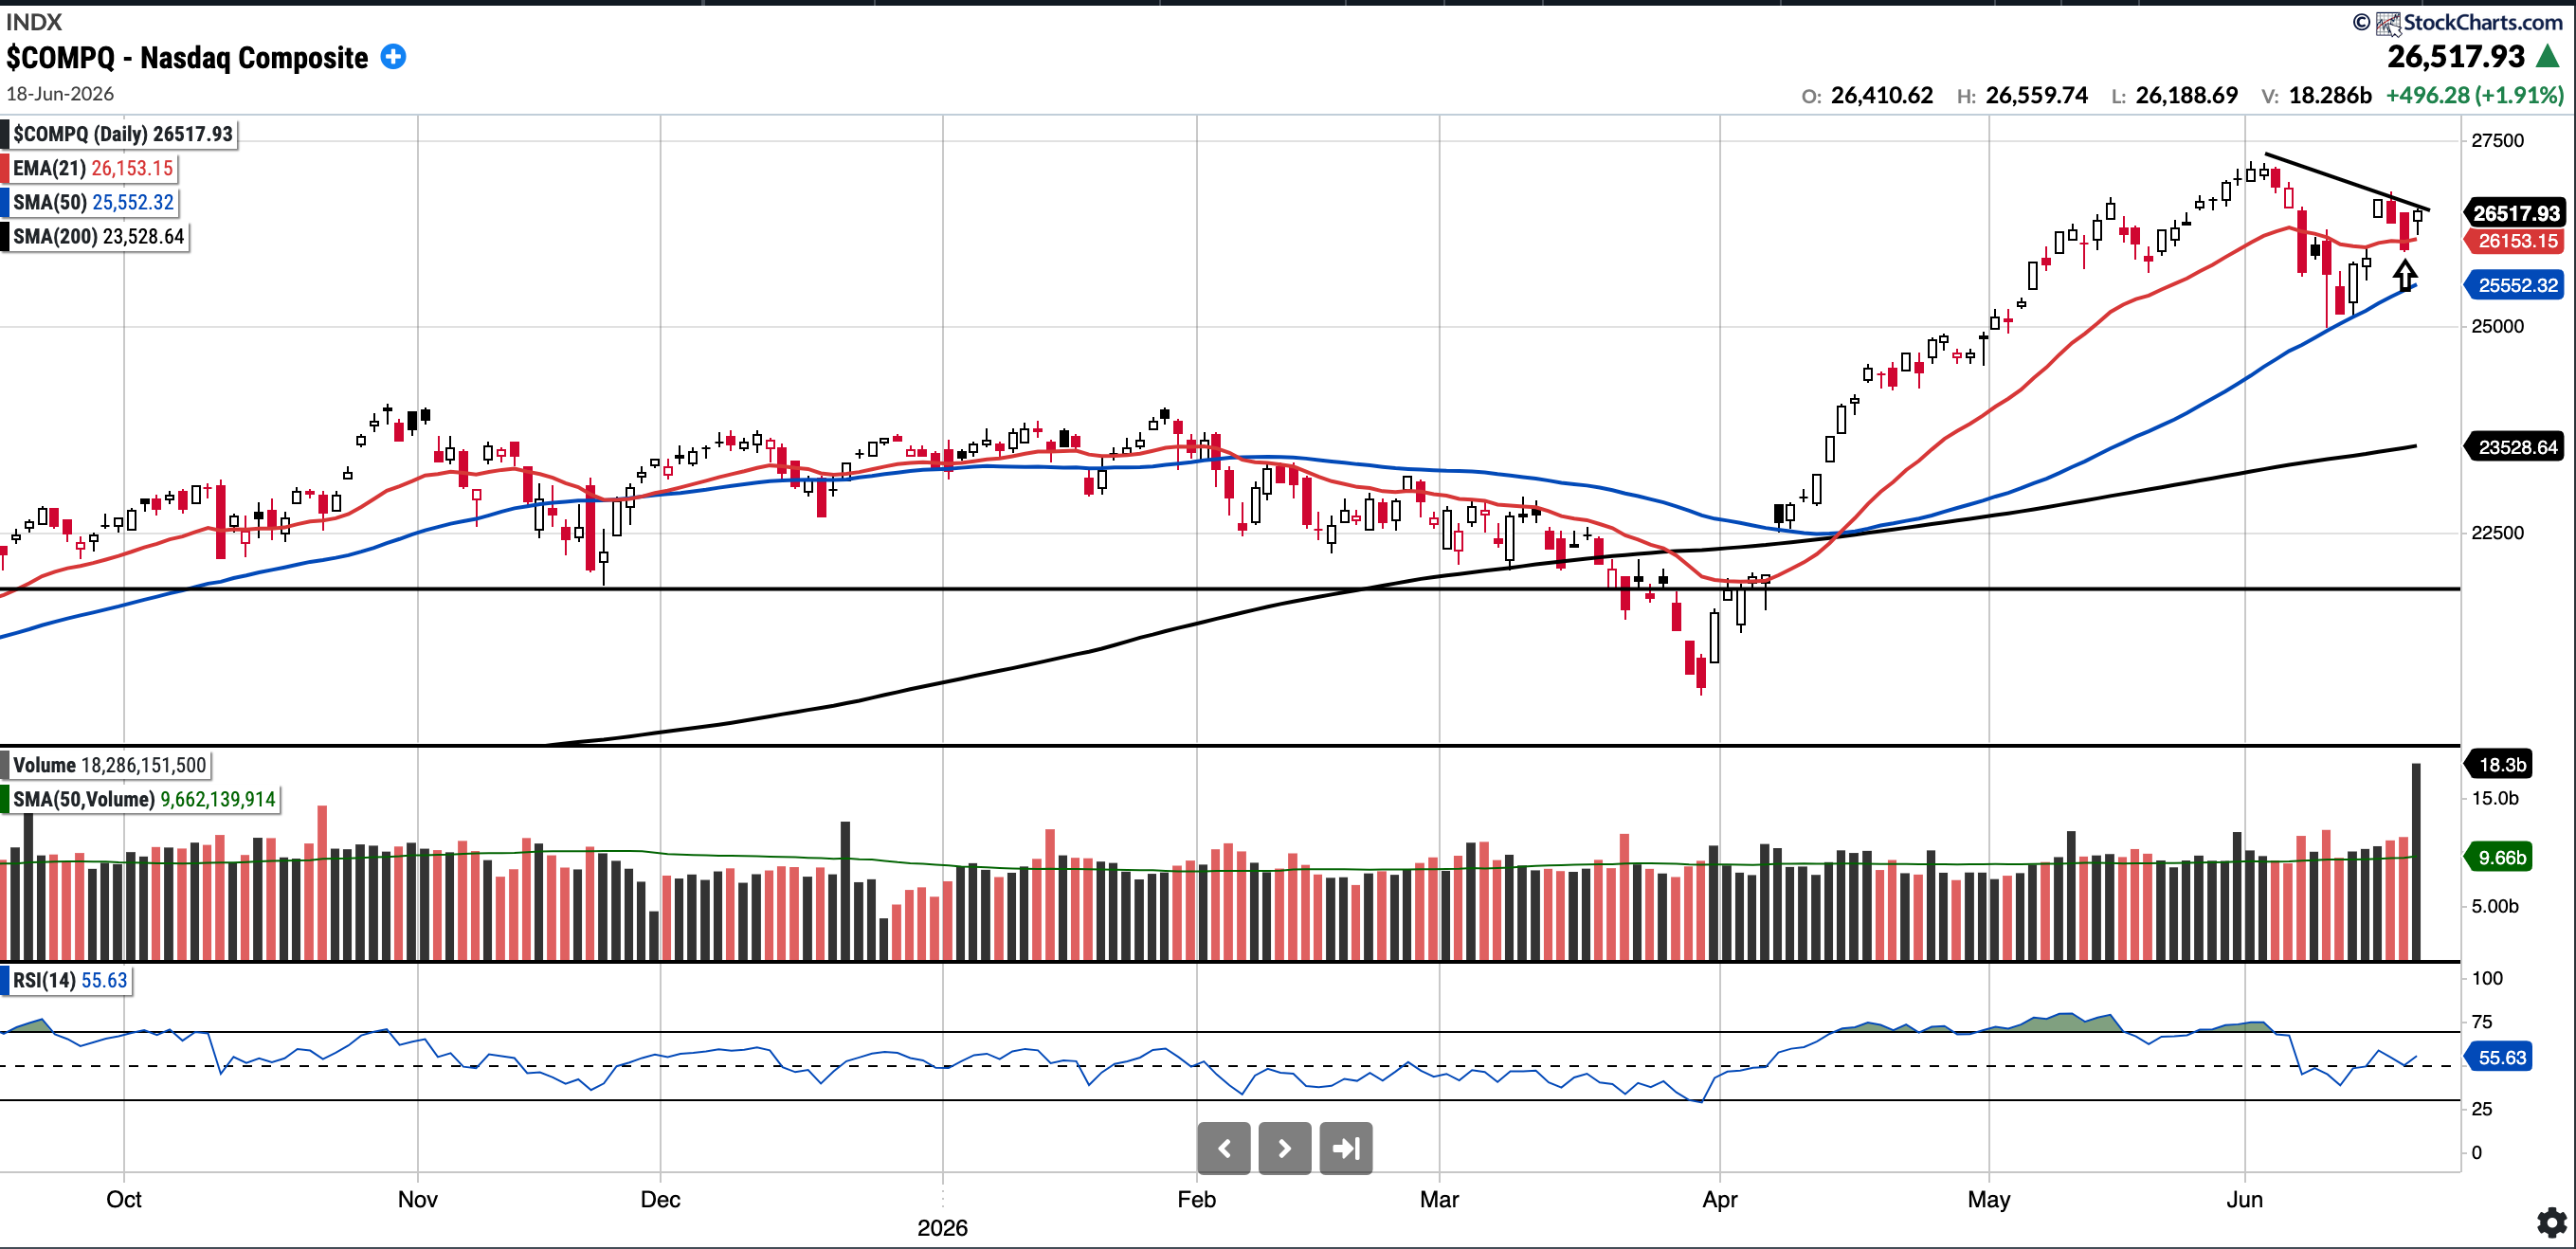
COMPQ
Currently trades at 26,517.93, 3.78% above the 50SMA and 12.7% above the 200SMA.
RSI 55.63
14.13% YTD
Distribution days in the last week: 2
The Nasdaq Composite closed the week above the 21-day EMA, which was re-tested on Wednesday. Notably, there was one distribution day this week.
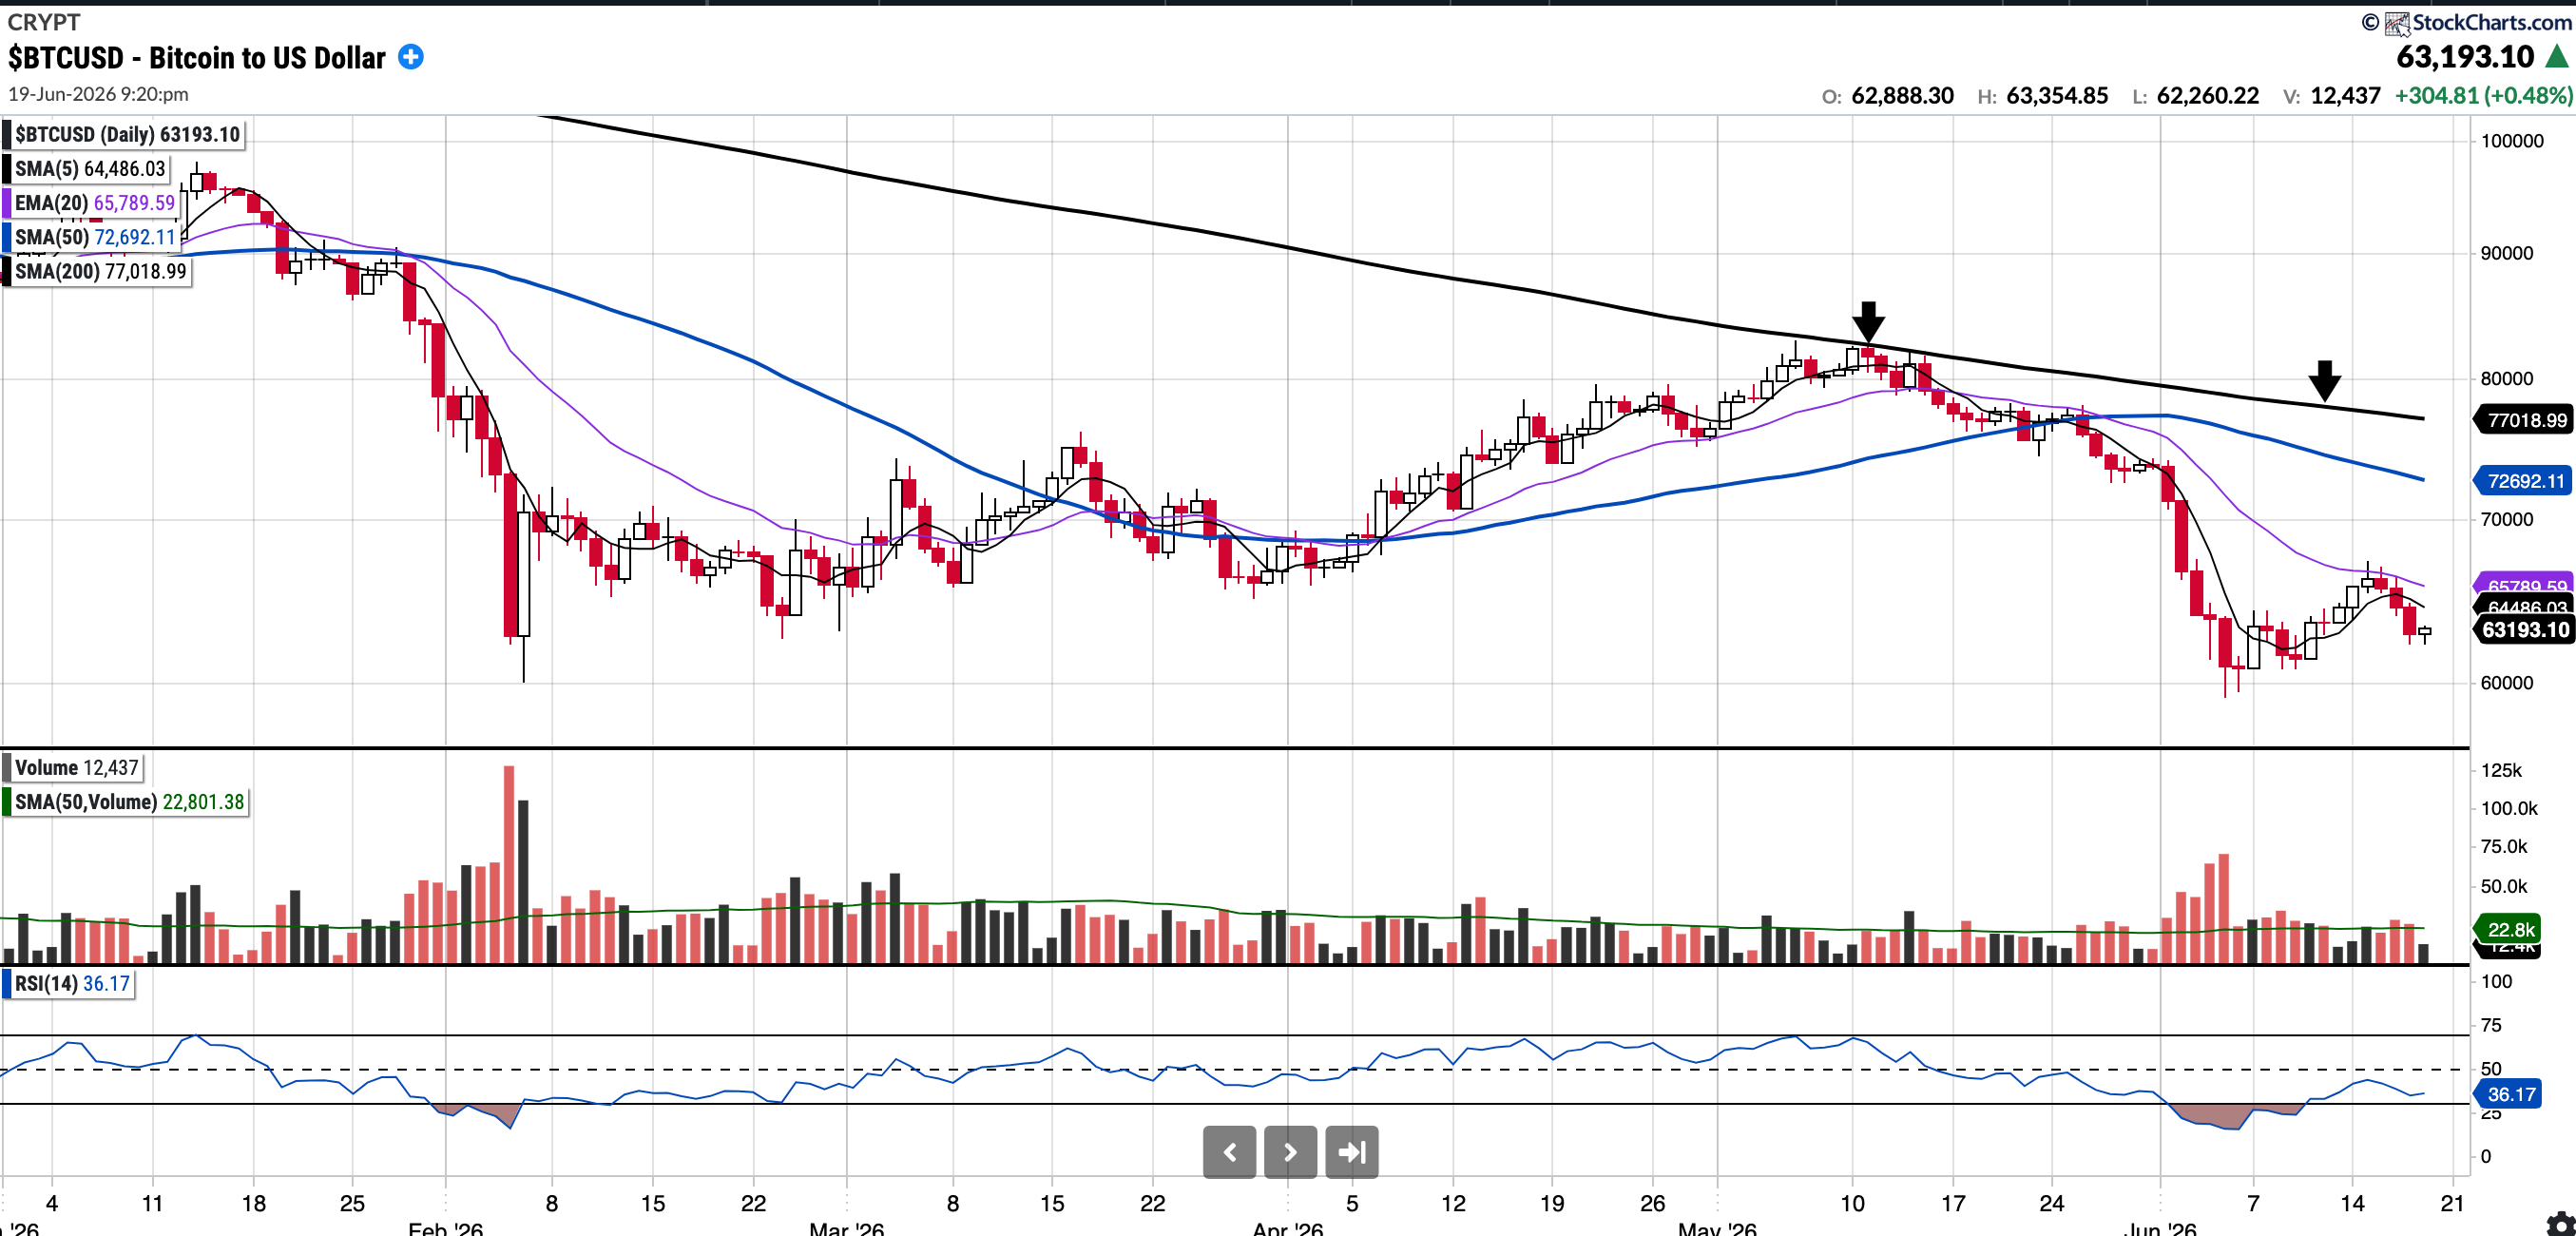
BTC (currently Long)
Currently trades at $63,552.44, 13.07% below the 50SMA and 17.95% below the 200SMA.
RSI 36.17
-28.8% YTD.
The U.S. Senate Banking Committee advanced the Digital Asset Market Clarity Act to the full Senate in a bipartisan 15–9 vote a few weeks ago. Yet, despite this regulatory progress, BTC was firmly rejected at its 200-day moving average recently (twice) and is now back at the 200-week moving average. It is currently holding that level at least.
As of Friday, June 19th at 22:22 BST, BTC is trading below all key moving averages including the 5EMA. From a technical perspective, it remains technically weak. Bulls would want to see the 200-week MA hold, and then a reclaim of near-term moving averages. 74k above is a key level also and likely the 200 SMA will serve as resistance (see arrows)
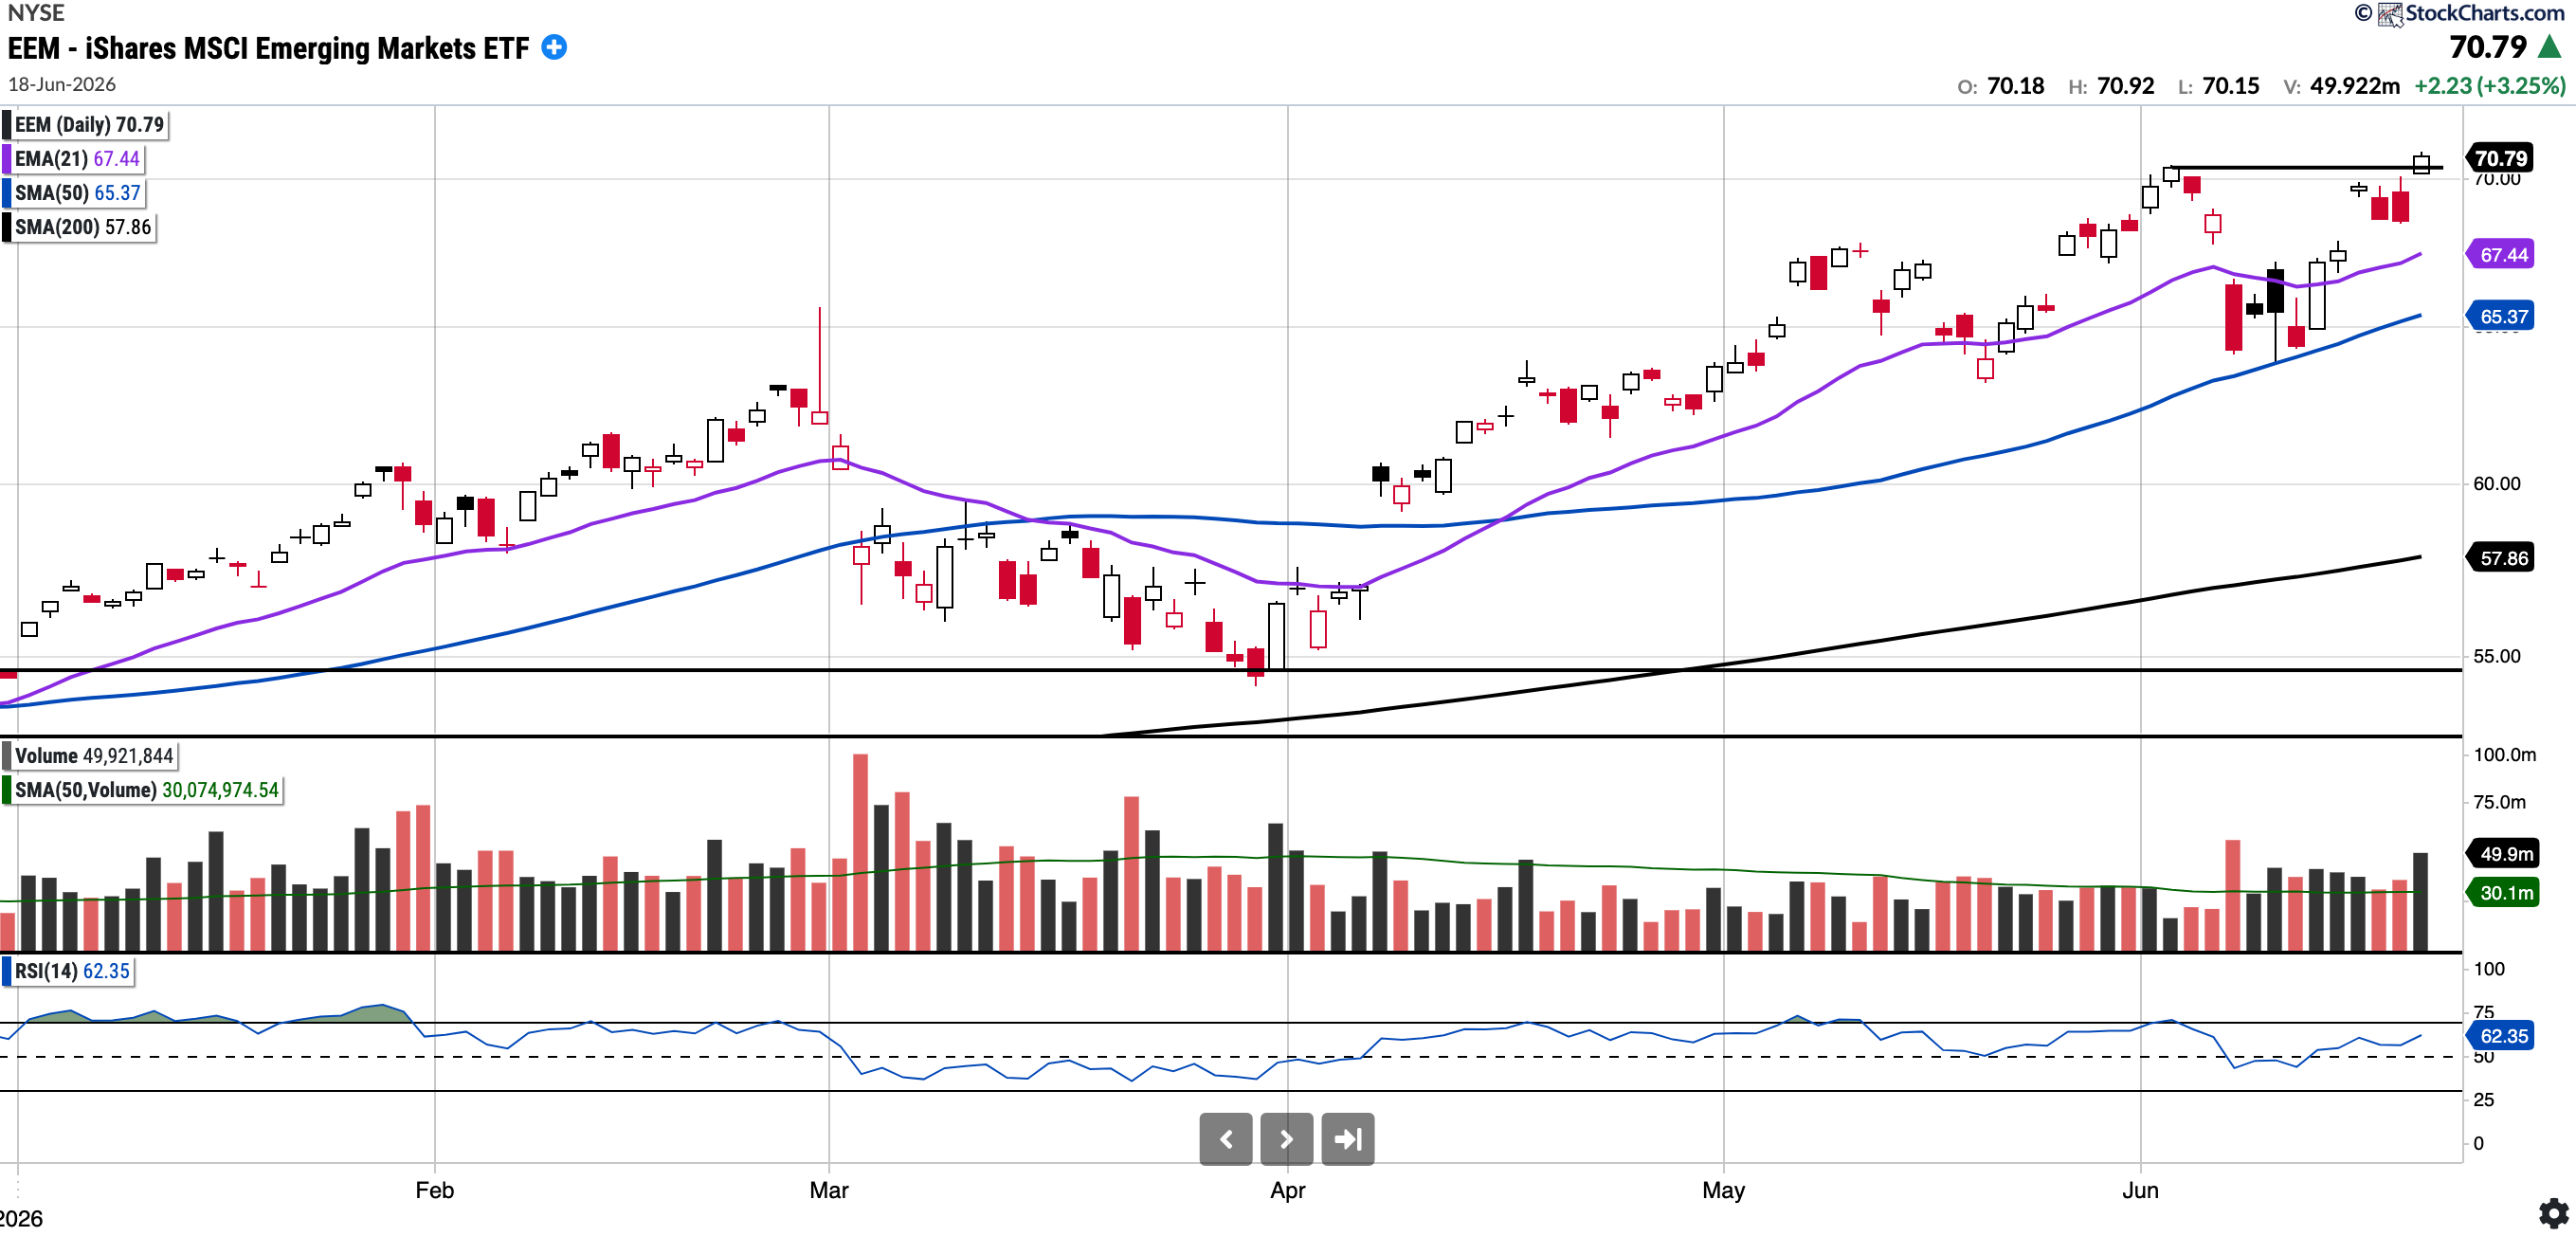
EEM
Currently trades at $70.79, 8.29% above the 50SMA and 22.34% above the 200SMA
RSI 62.35
+30.06% YTD
EEM remains in a strong uptrend and continues to comfortably outperform U.S. indices by more than 2000 bps year-to-date.
EEM closes the week above all key moving averages and in fact on Friday broke out to new ATH’s! Pullbacks have been few and far between however, the key levels to watch for pullback buys will be the 50-day SMA (65.37), followed by the $55–$57 zone (where horizontal support aligns with the 200-day SMA).
I believe EEM could be setting up for multi-year outperformance; hence, I continue to watch it closely.
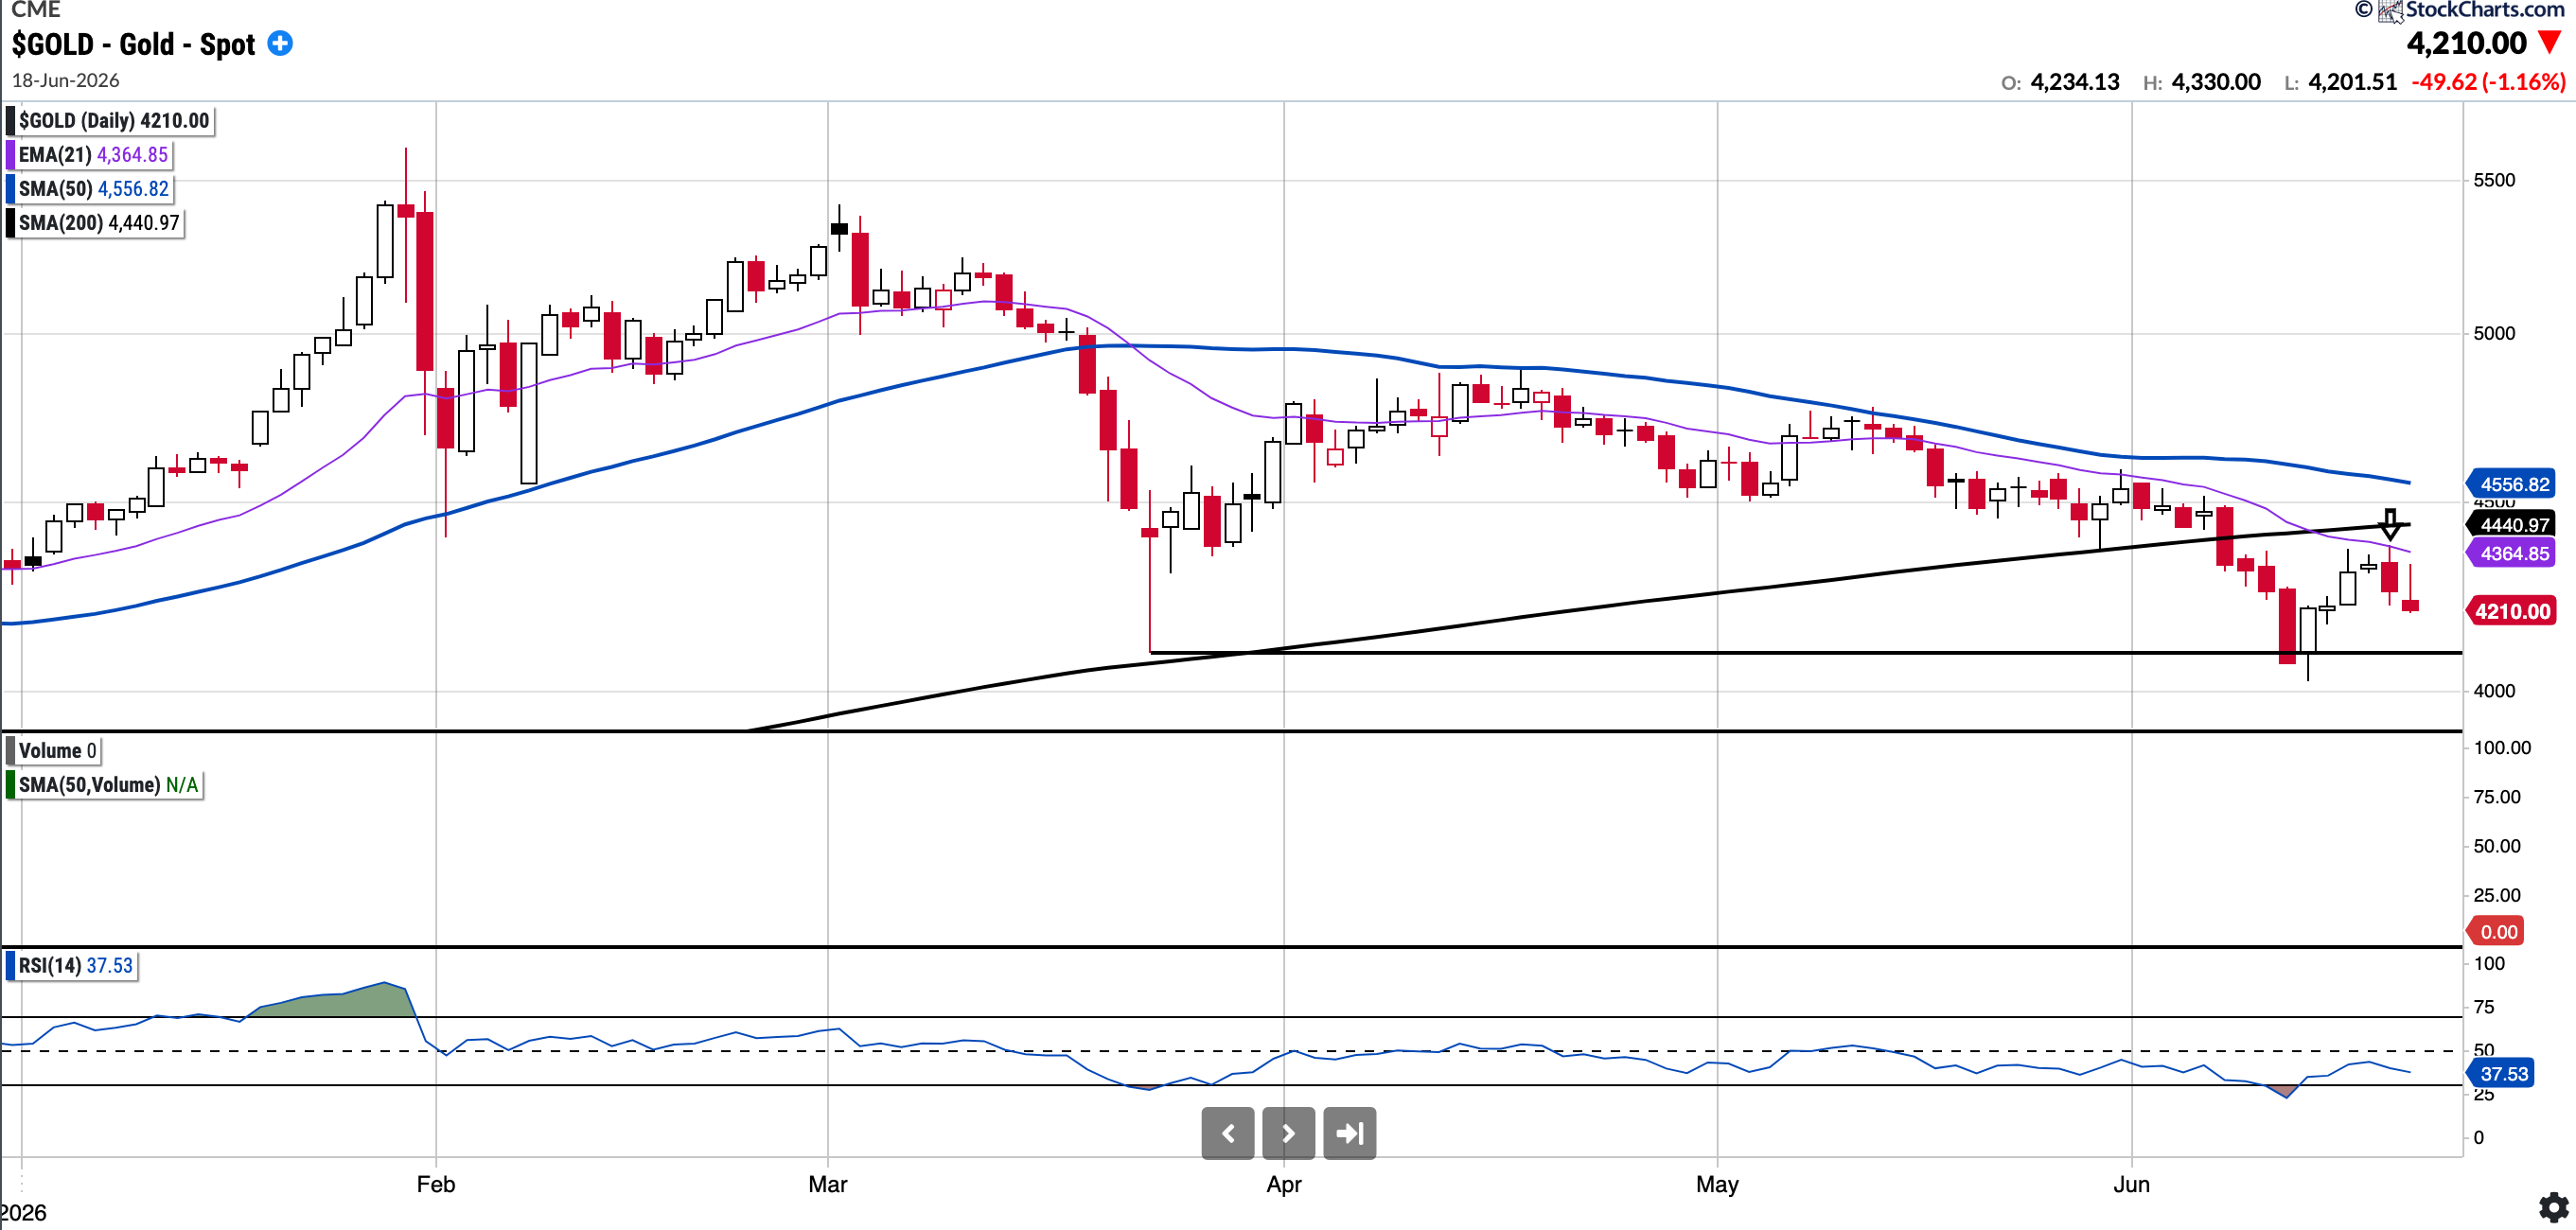
GOLD (Long Physical)
Currently trades at $4,120.85, 7.61% below the 50SMA and 5.2% below the 200SMA
RSI 37.53
-2.61% YTD
Gold lost its 200-day moving average recently for the first time since its bull run began in late 2023. That is notable and potentially concerning if not reclaimed.
Gold was rejected at the descending 21-day EMA on Wednesday, though it is holding the 4,100 level of interest. Bulls would like to see the key overhead moving averages reclaimed, starting with the 200-day.
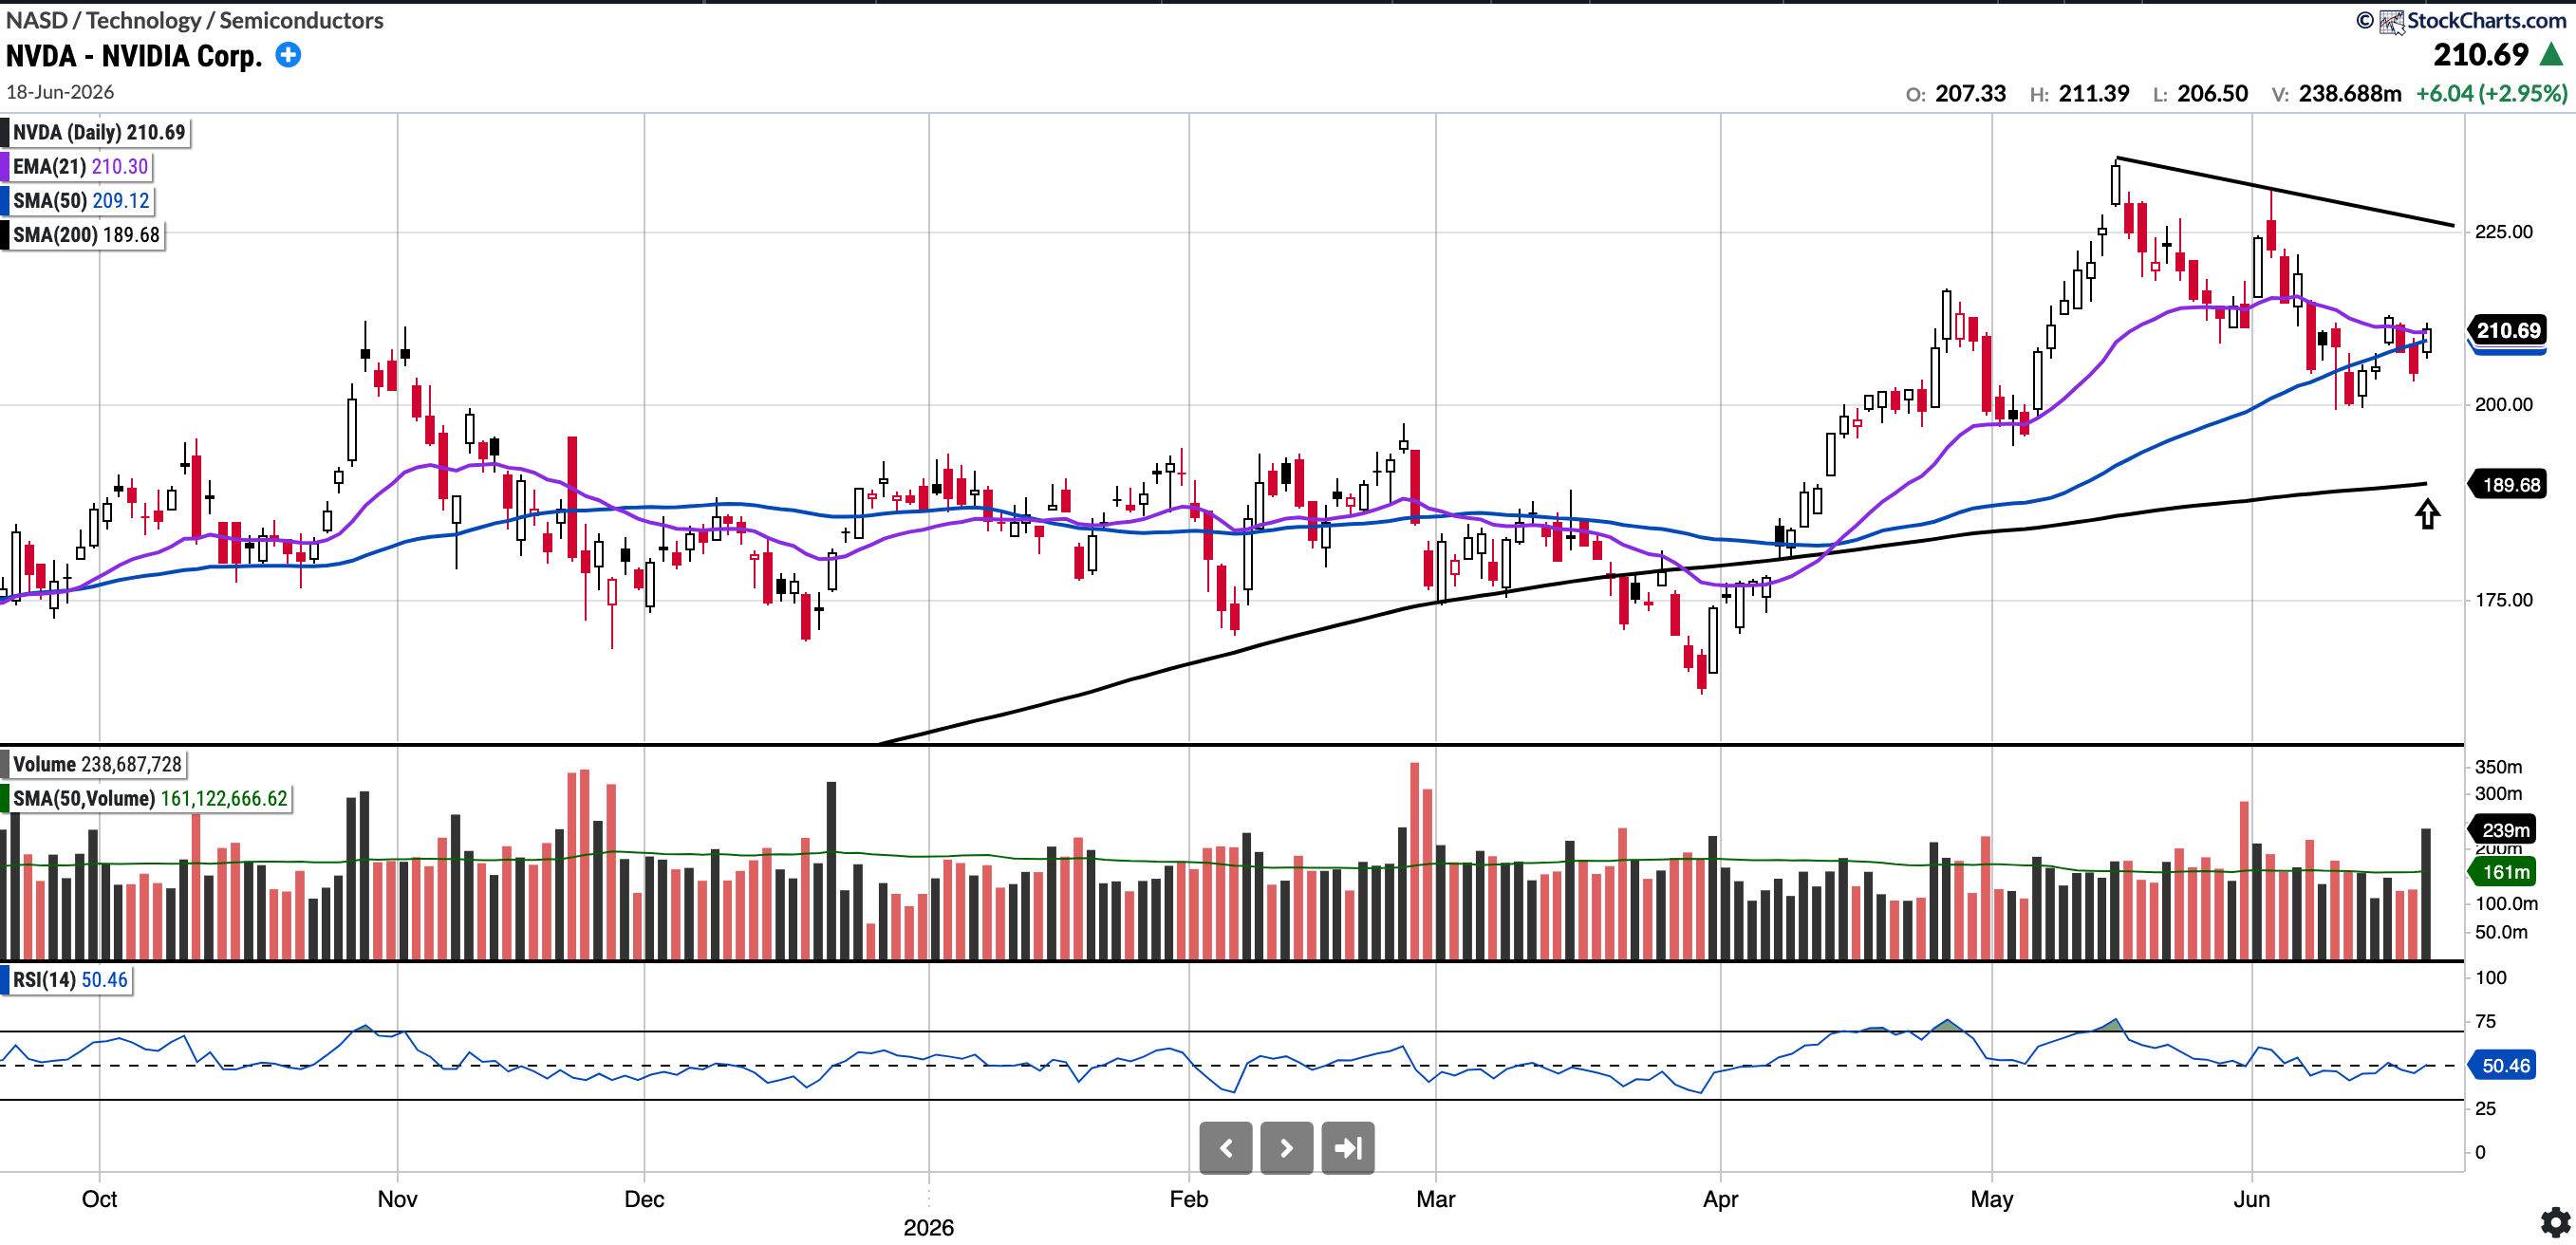
NVDA (Currently Long)
Currently trades at $210.69, 0.75% below the 50SMA and 11.07% above the 200SMA
RSI 50.46
11.56% YTD
NVDA traded as high as $240.00 two weeks ago on Friday to complete the measured move post its breakout.
However, since its Q1 print, NVDA has pulled back.
It is currently trading above all key moving averages again, reclaiming both its 21-day EMA and 50-day SMA on Friday. To the upside, $225 may be a near-term level NVDA can reach; on weakness, however, we could see the stock test its 200-day SMA at $189.68. This area may serve as a compelling risk-reward level to add exposure, given that the forward P/E would drop below 14x at that price.
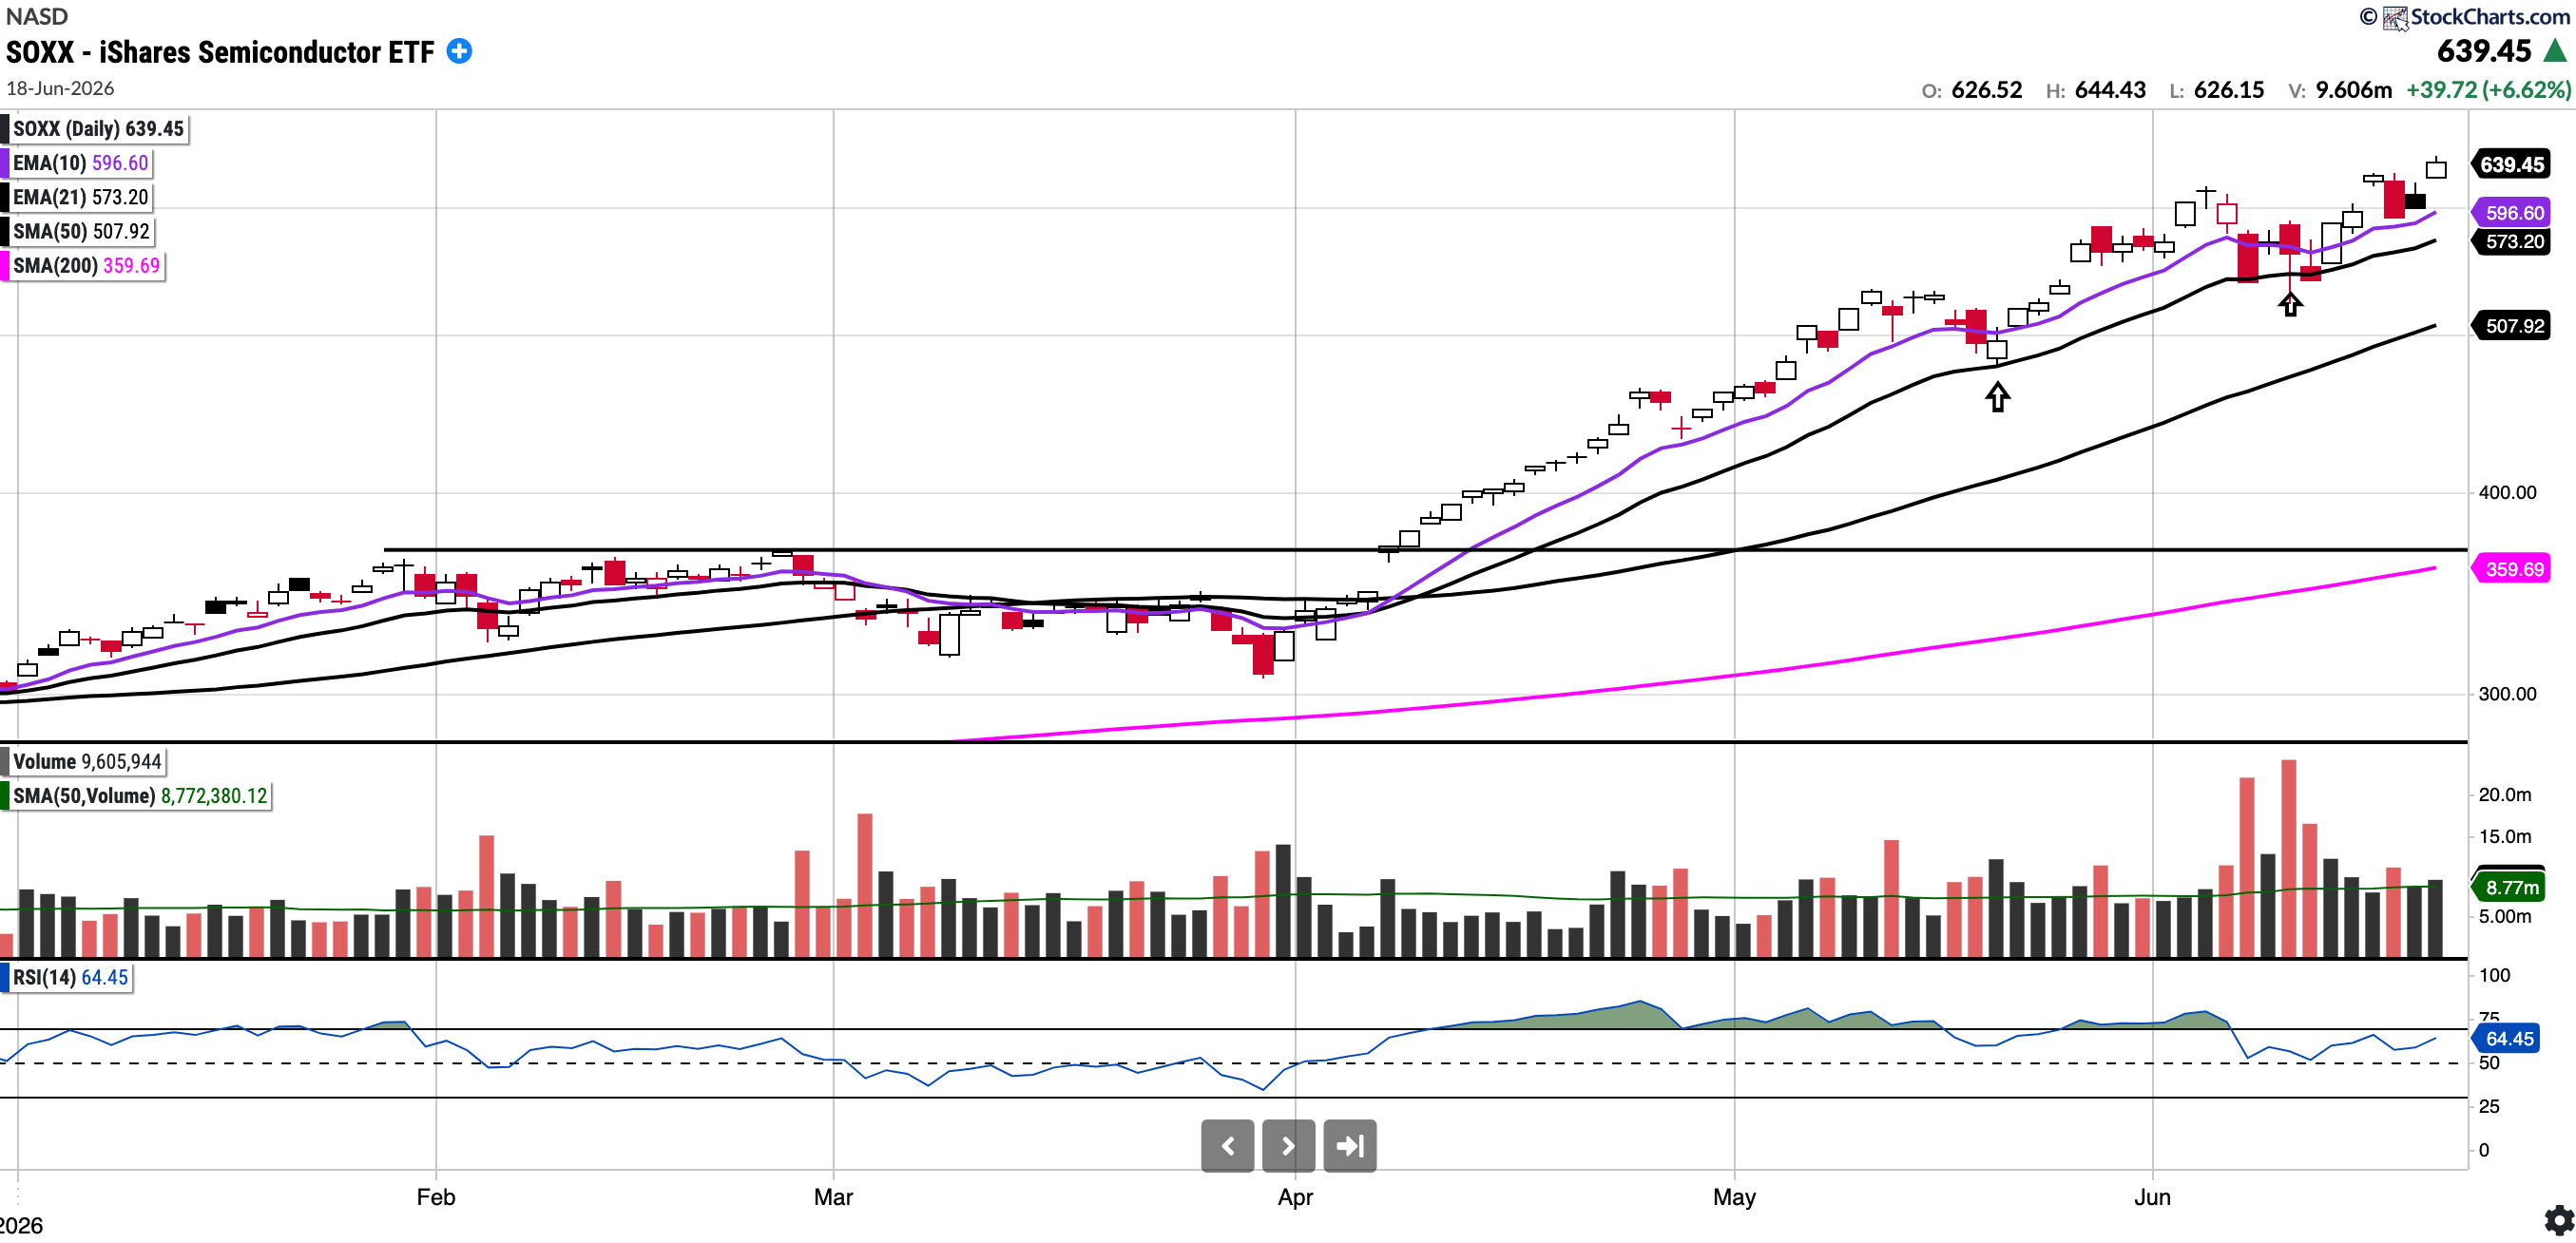
SOXX
Currently trades at $639.45, 25.9% above the 50SMA and 77.78% above the 200SMA
RSI 64.45
112.57% YTD
A couple of weeks ago I had written:
SOXX sold off on almost three times its normal volume on Friday. Interestingly, the last time this level of selling occurred for the SOXX was on October 10th, which marked the beginning of the correction for many AI stocks. Bulls would want to see the 21 day regained.
SOXX has in fact reclaimed all key moving averages, bounced back very sharply and now sits at fresh ATH’s! It has bounced 100 points in 9 sessions, remarkable strength.

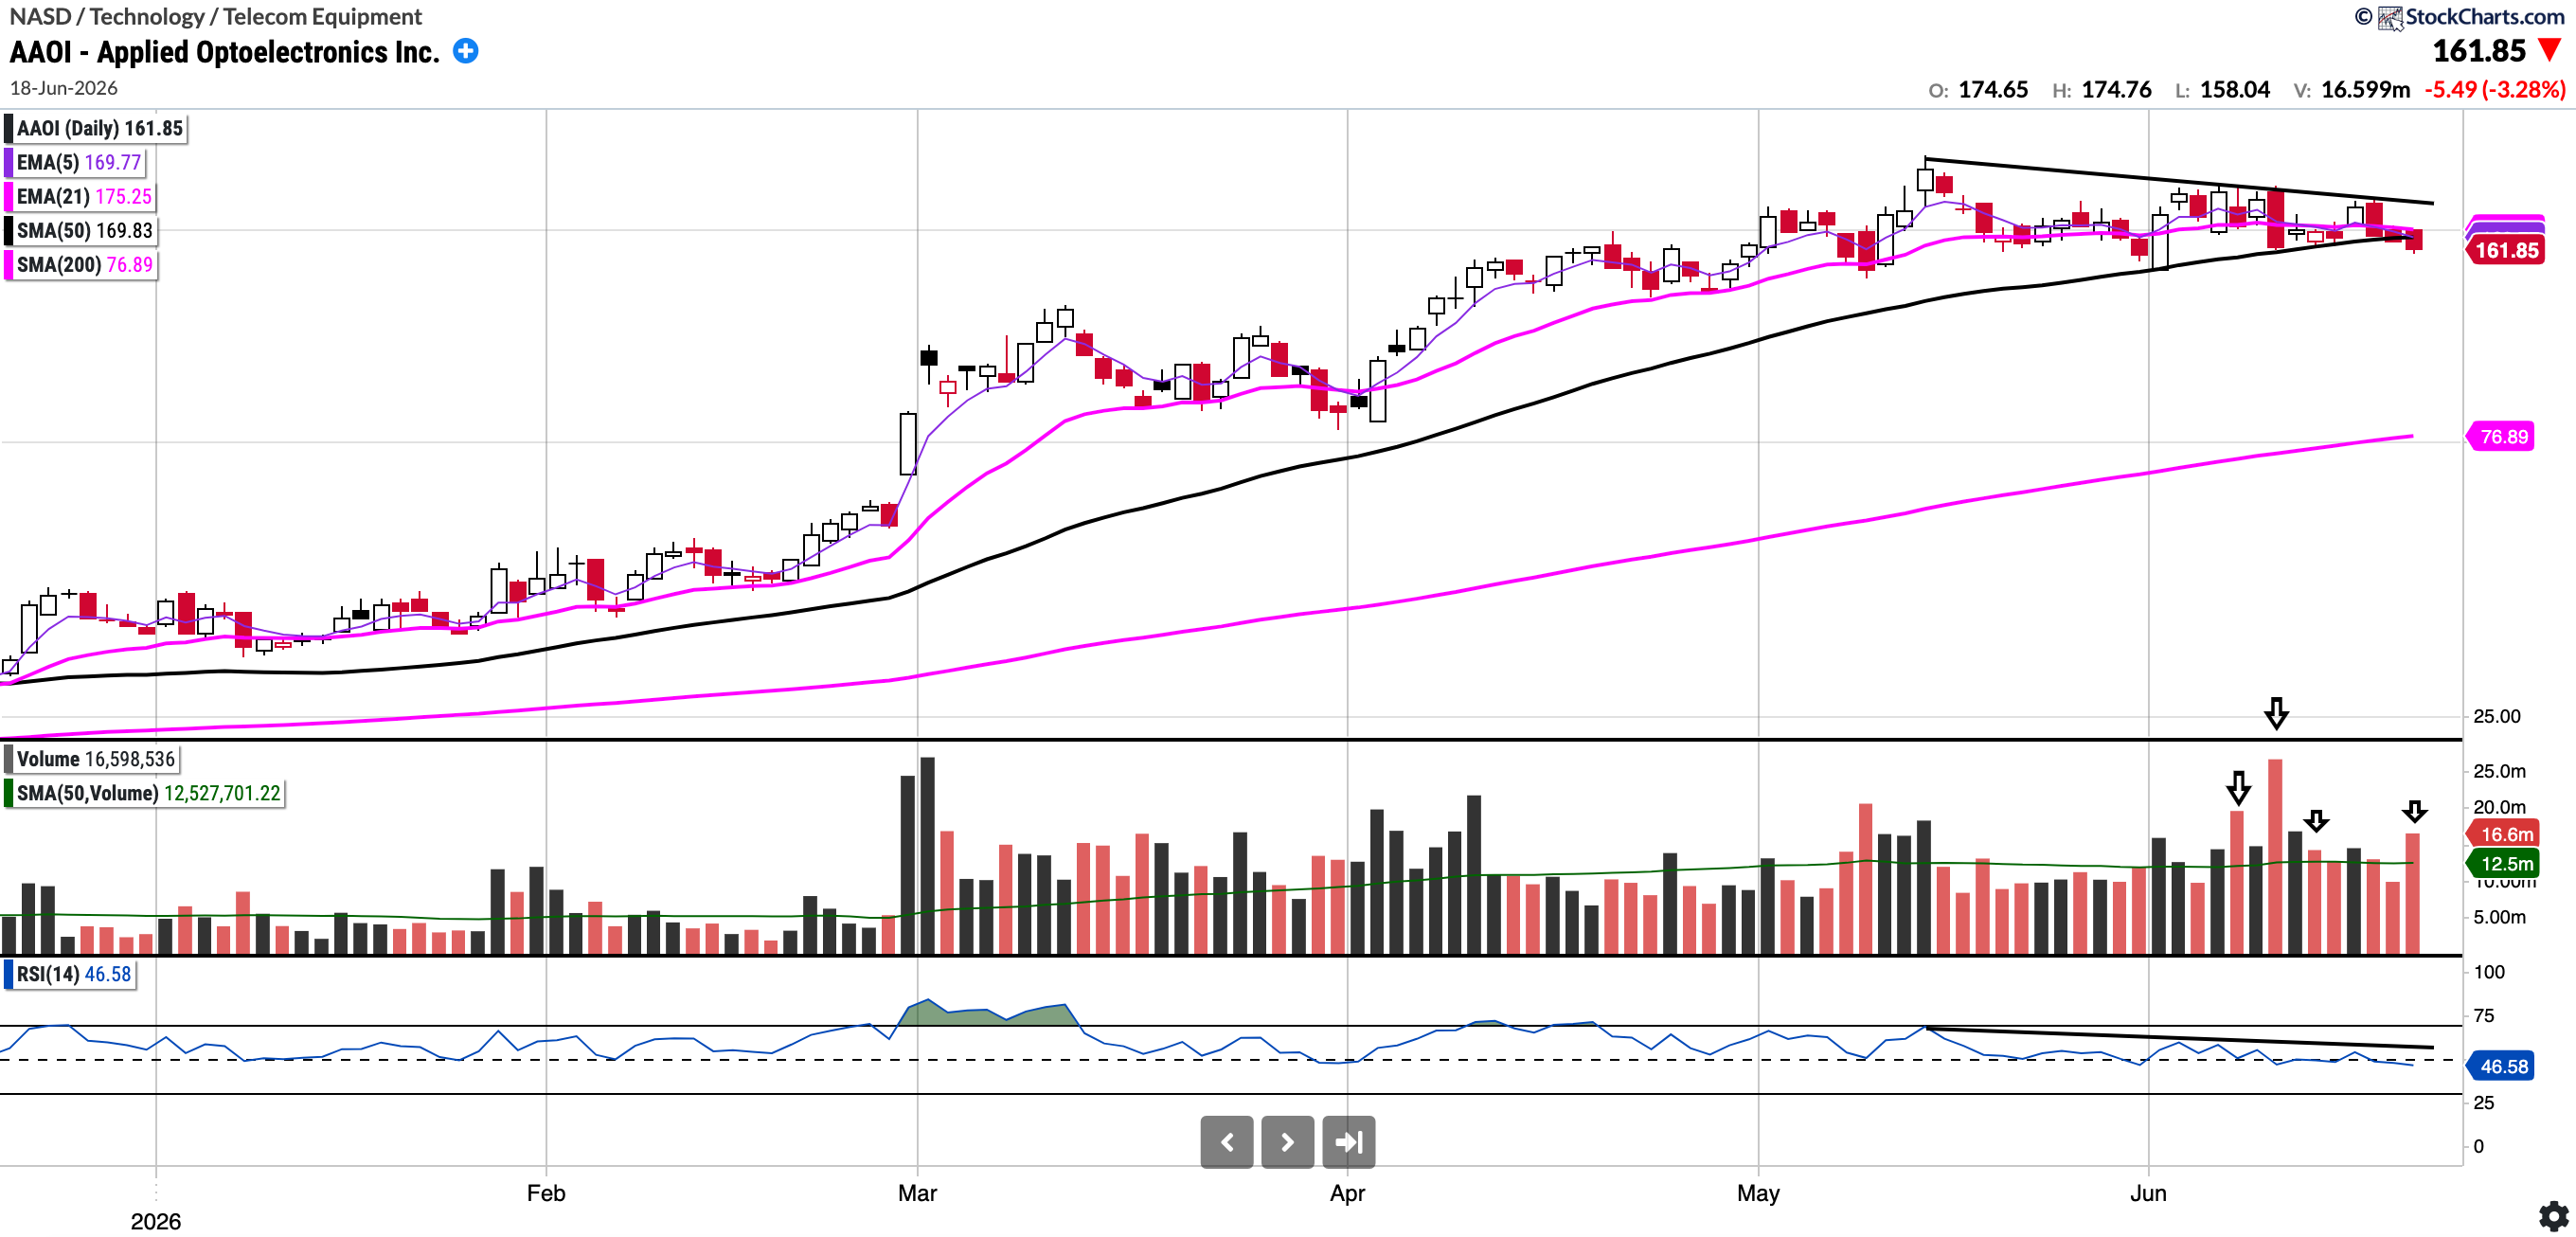
AAOI
Currently trades at $161.85, 4.7% below the 50SMA and 110.5% above the 200SMA
RSI 46.58
364.29% YTD
AAOI, a photonics and optical networking company, has been a leading performer this year, up more than 350%. I do note, however, that it has been making lower highs for some time and, more recently, lower lows as well. It has also been selling off on volume and has lost its 50-day Simple Moving Average (SMA 50). These are signs that it may be due for a consolidation or a pullback. We will see how it pans out, but these are interesting signs nonetheless.
Important: I will feature several other Trading ideas in the Watchlist Snapshot post, so keep a look out for that post later. It will also include my Trading Account holdings.
Recent weeks post (link below) have had countless positions responding to key levels and running sharply such as:
ASTS 74 to 130
FLY 32 to 62
NOK 12.4 to 16
RBRK 60 to 78
CIFR 18 to 25
USAR 19 to 30
ORCL 160 to 225

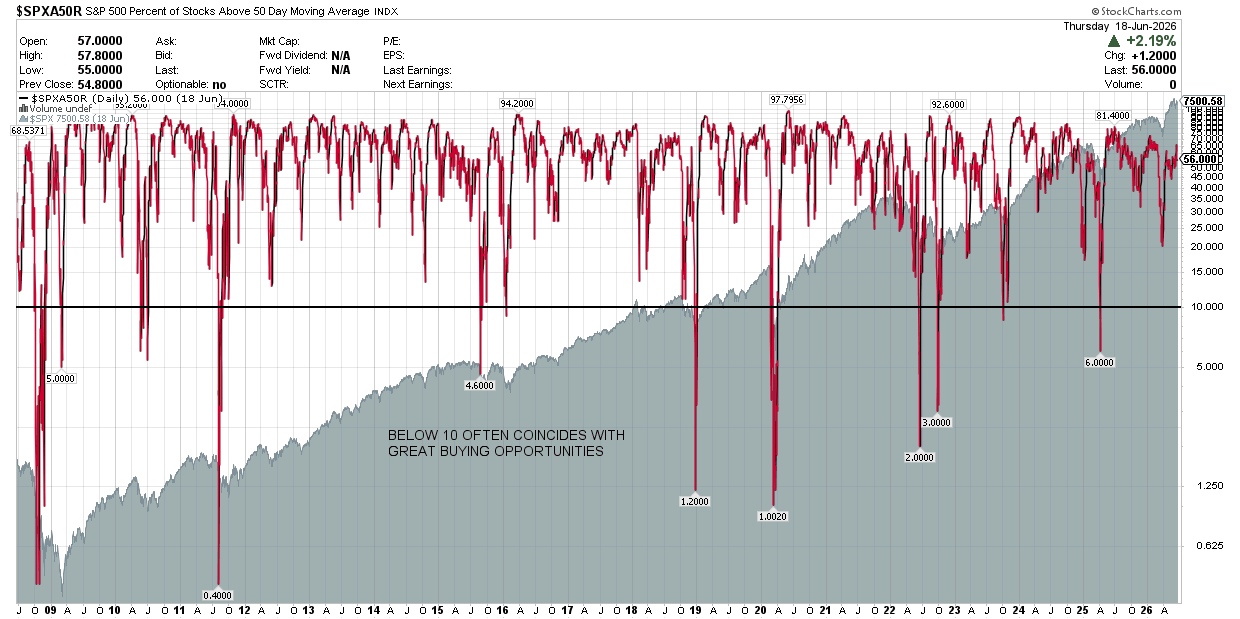
S&P 500 Percentage of Stocks Above the 50 Day Moving Average: Currently 56%
Breadth declined slightly this week, with the percentage of stocks above the 50-day moving average down to 56%..
Notable portfolio changes in previous week (all updated live in subscriber channels):
Nil notable changes this week.
IMPORTANT: To familiarise yourself with the notification process, please read the following post regarding the notification system.
I have also included the link to the Live Updates thread on the Substack chat below, which is where I post all moves related to my investment account. Turn the notifications on. Live Updates Thread
Note that these updates are posted simultaneously on Discord as well.
Current Positions in Size Order with Cost Basis (Investment Account) as of June 12 2026:
