
Preview of the Week Ahead: W/C June 15, 2026
SPX returns to winning ways amid the volatility

Hope you all are having a good weekend. Below, we will be previewing the upcoming week’s events and providing a portfolio update as usual.
Format for what is covered in this weekly preview:
A Look at the Indices
Key Upcoming Economic Events
Upcoming Earnings Reports
Charts
Notable Portfolio Changes from the Previous Week
Current Portfolio Holdings
Position size, cost basis, and commentary on each holding regarding the intended holding period and any planned activity
Closing Thoughts
I recommend checking out the most recent Monthly Portfolio and Performance Update below:

Also, ensure to check out the post below regarding upcoming pricing changes plus feedback from our readers:

Indices
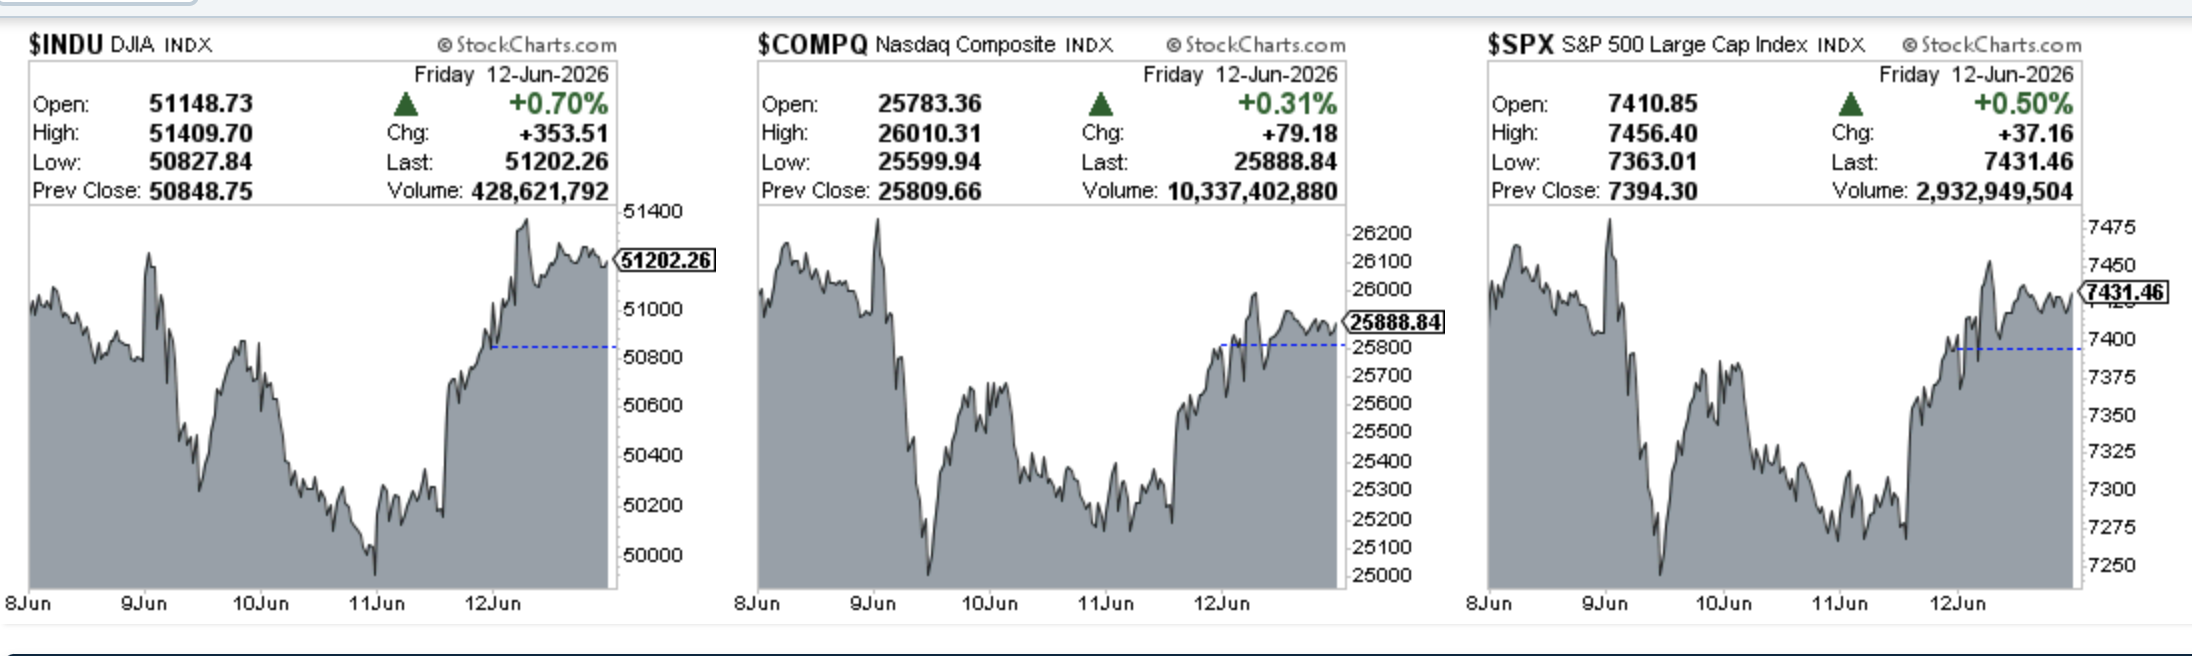
Dow Jones advanced 0.17% in the last week
S&P 500 declined 0.04% in the last week
Nasdaq Composite declined 0.32% in the last week
IWM advanced 3.05% in the last week
Key upcoming economic events
Tuesday, June 16
FOMC Meeting Begins
Wednesday, June 17
Fed Interest Rate Decision:
The central bank will release its policy statement. Markets widely expect the Fed to hold rates steady in the 3.50% to 3.75% range.
Fed Press Conference
Thursday, June 18
Initial Jobless Claims
Global Macro Context
Friday, June 19
US Market Holiday (Juneteenth): All US equity, options, and fixed-income markets are closed.
Upcoming Earnings
Below is the infographic by Earnings Whispers highlighting the schedule for this week:

Charts
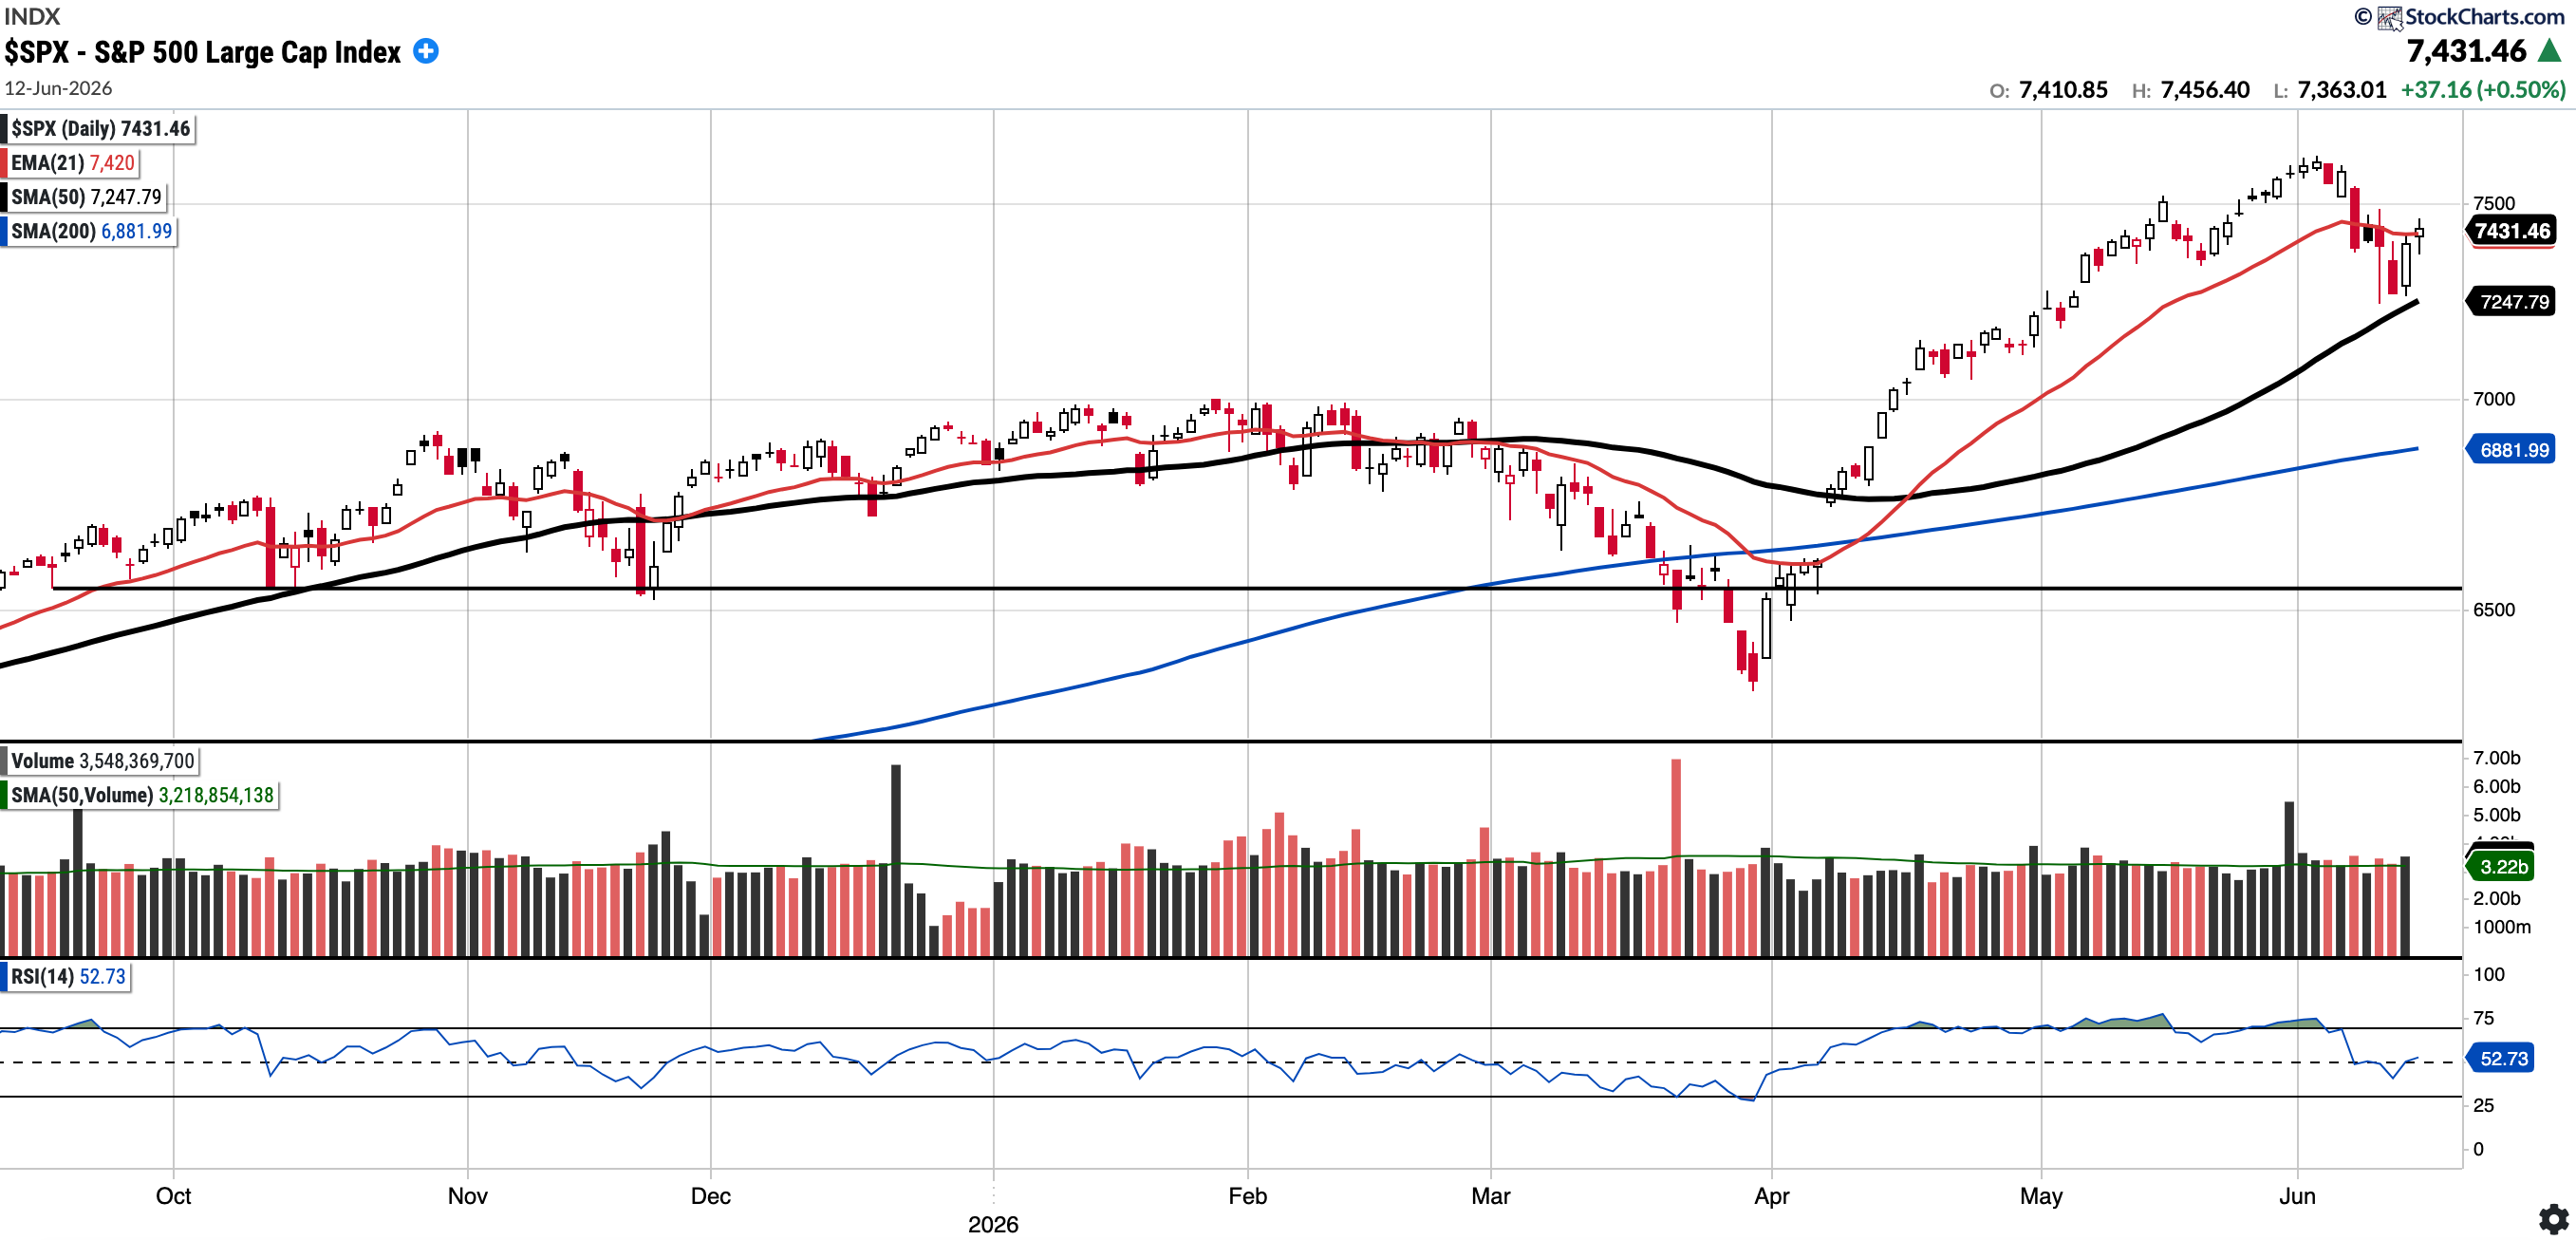
SPX
Currently trades at 7417.73, 2.35% above the 50SMA and 7.79% above the 200SMA.
RSI 52.73
8.15% YTD
Distribution days in the last week: 1
The SPX had a volatile week, coming close to touching the 50-day SMA before reclaiming the 21-day EMA by the close. There was one distribution day this week, following two last week.
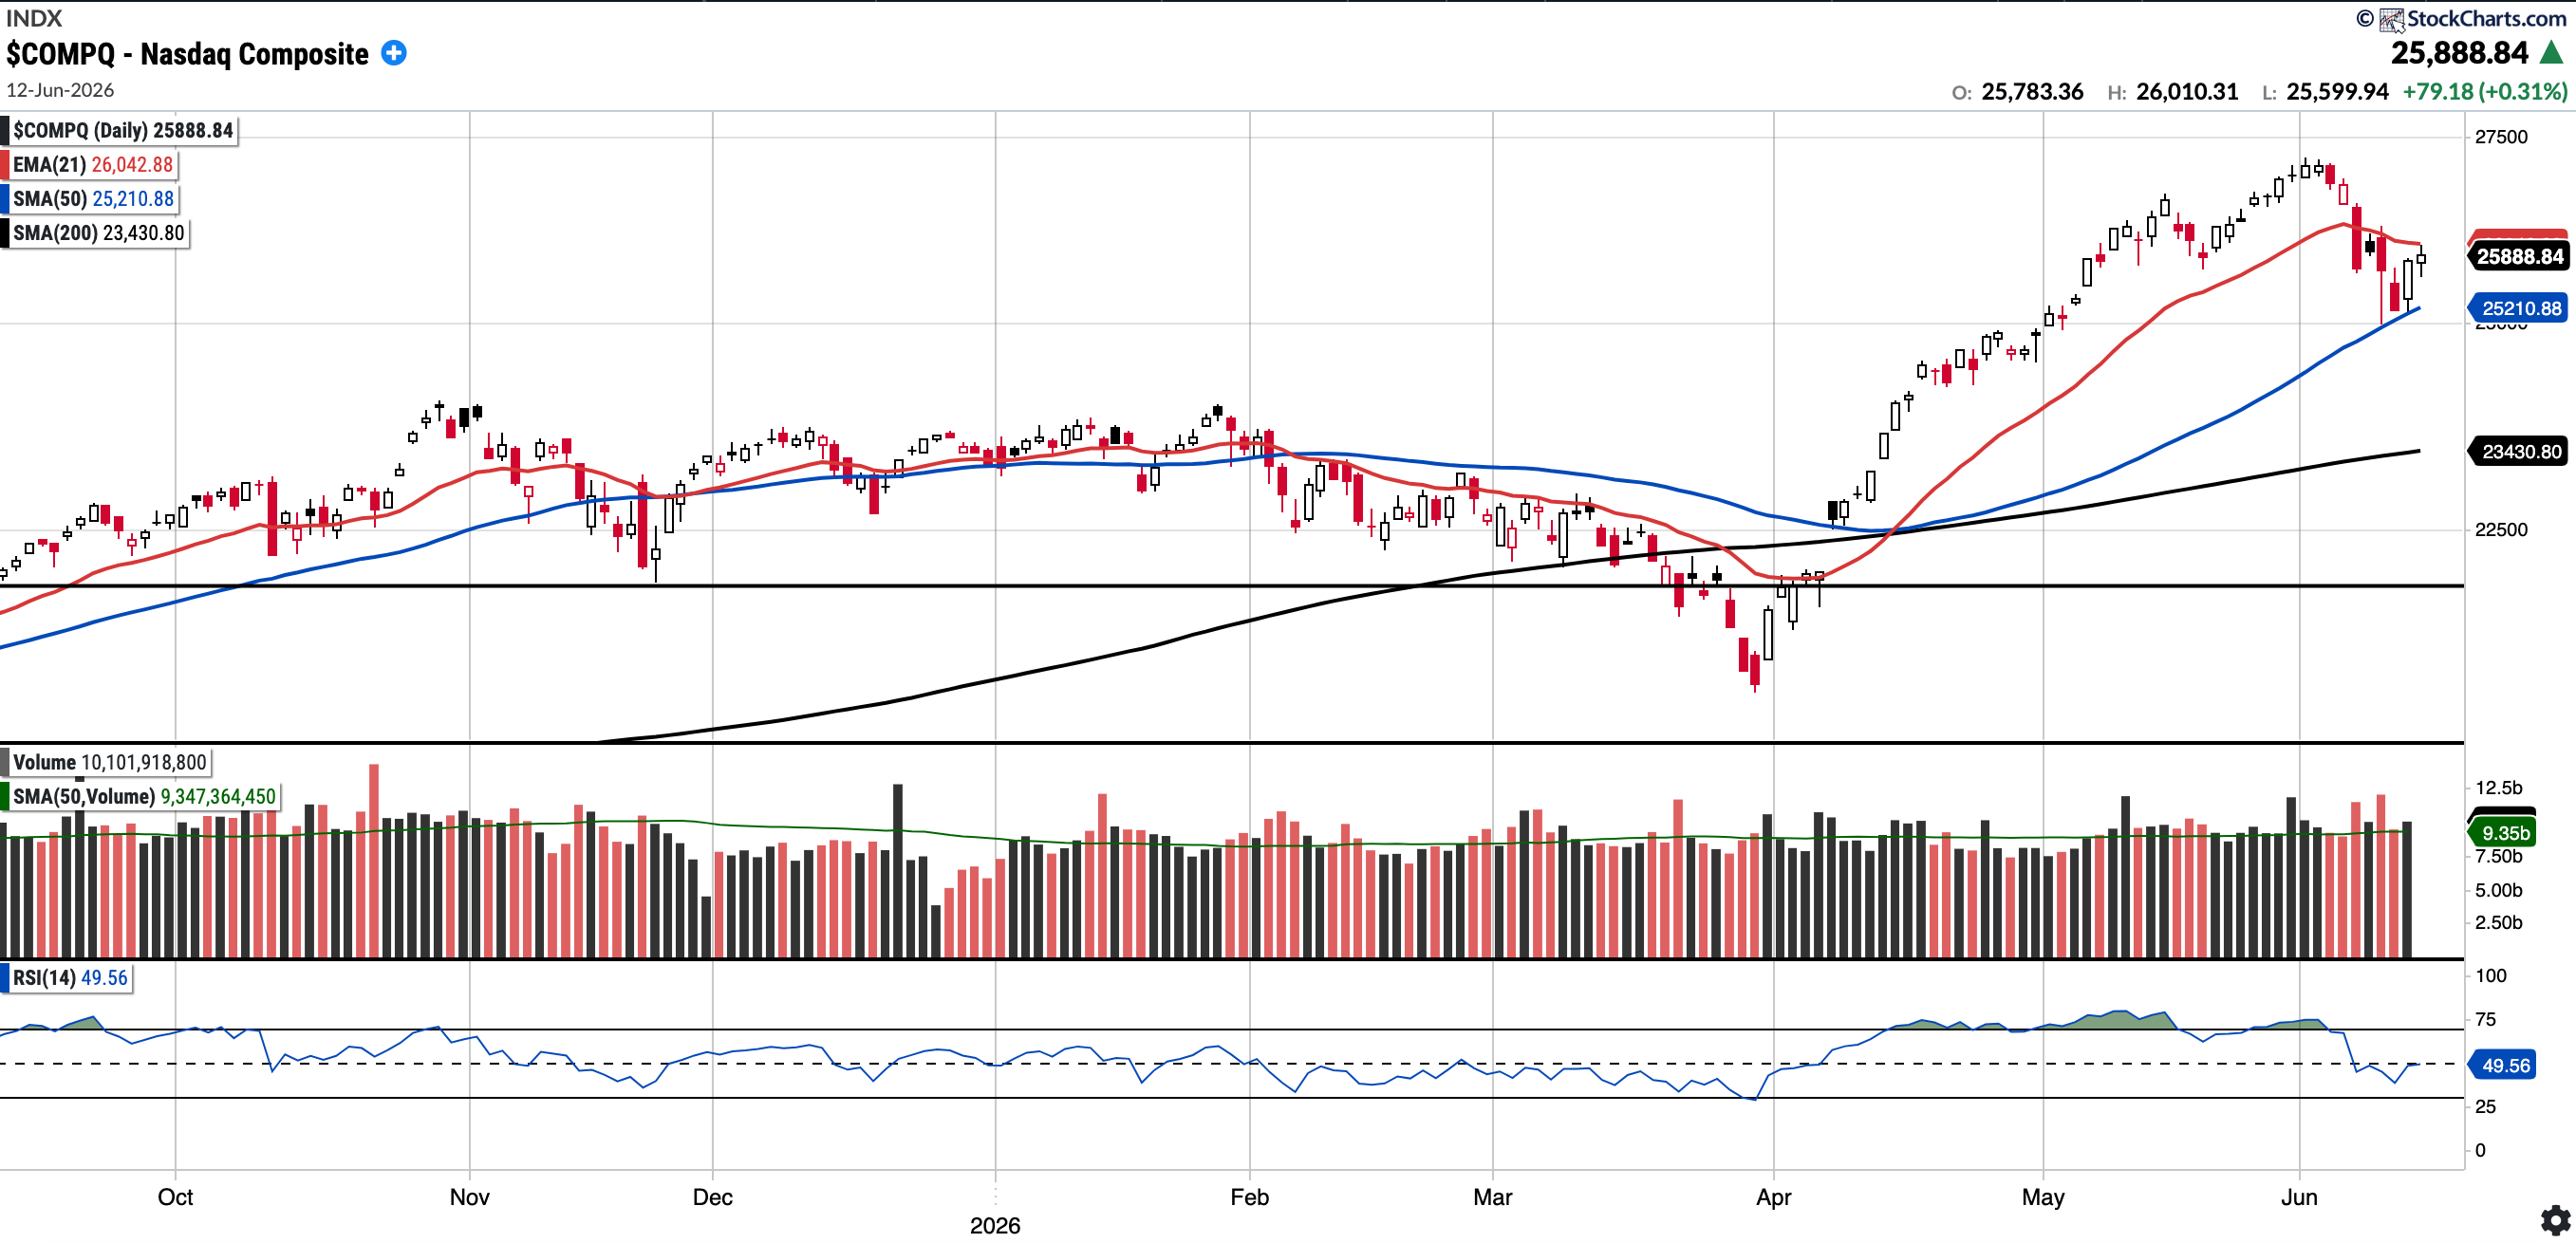
COMPQ
Currently trades at 25,888.84, 2.69% above the 50SMA and 10.49% above the 200SMA.
RSI 49.56
11.42% YTD
Distribution days in the last week: 1
The Nasdaq Composite tested the 50-day SMA twice this week, but unlike the S&P 500, it closed below its 21-day EMA. There was one distribution day this week.
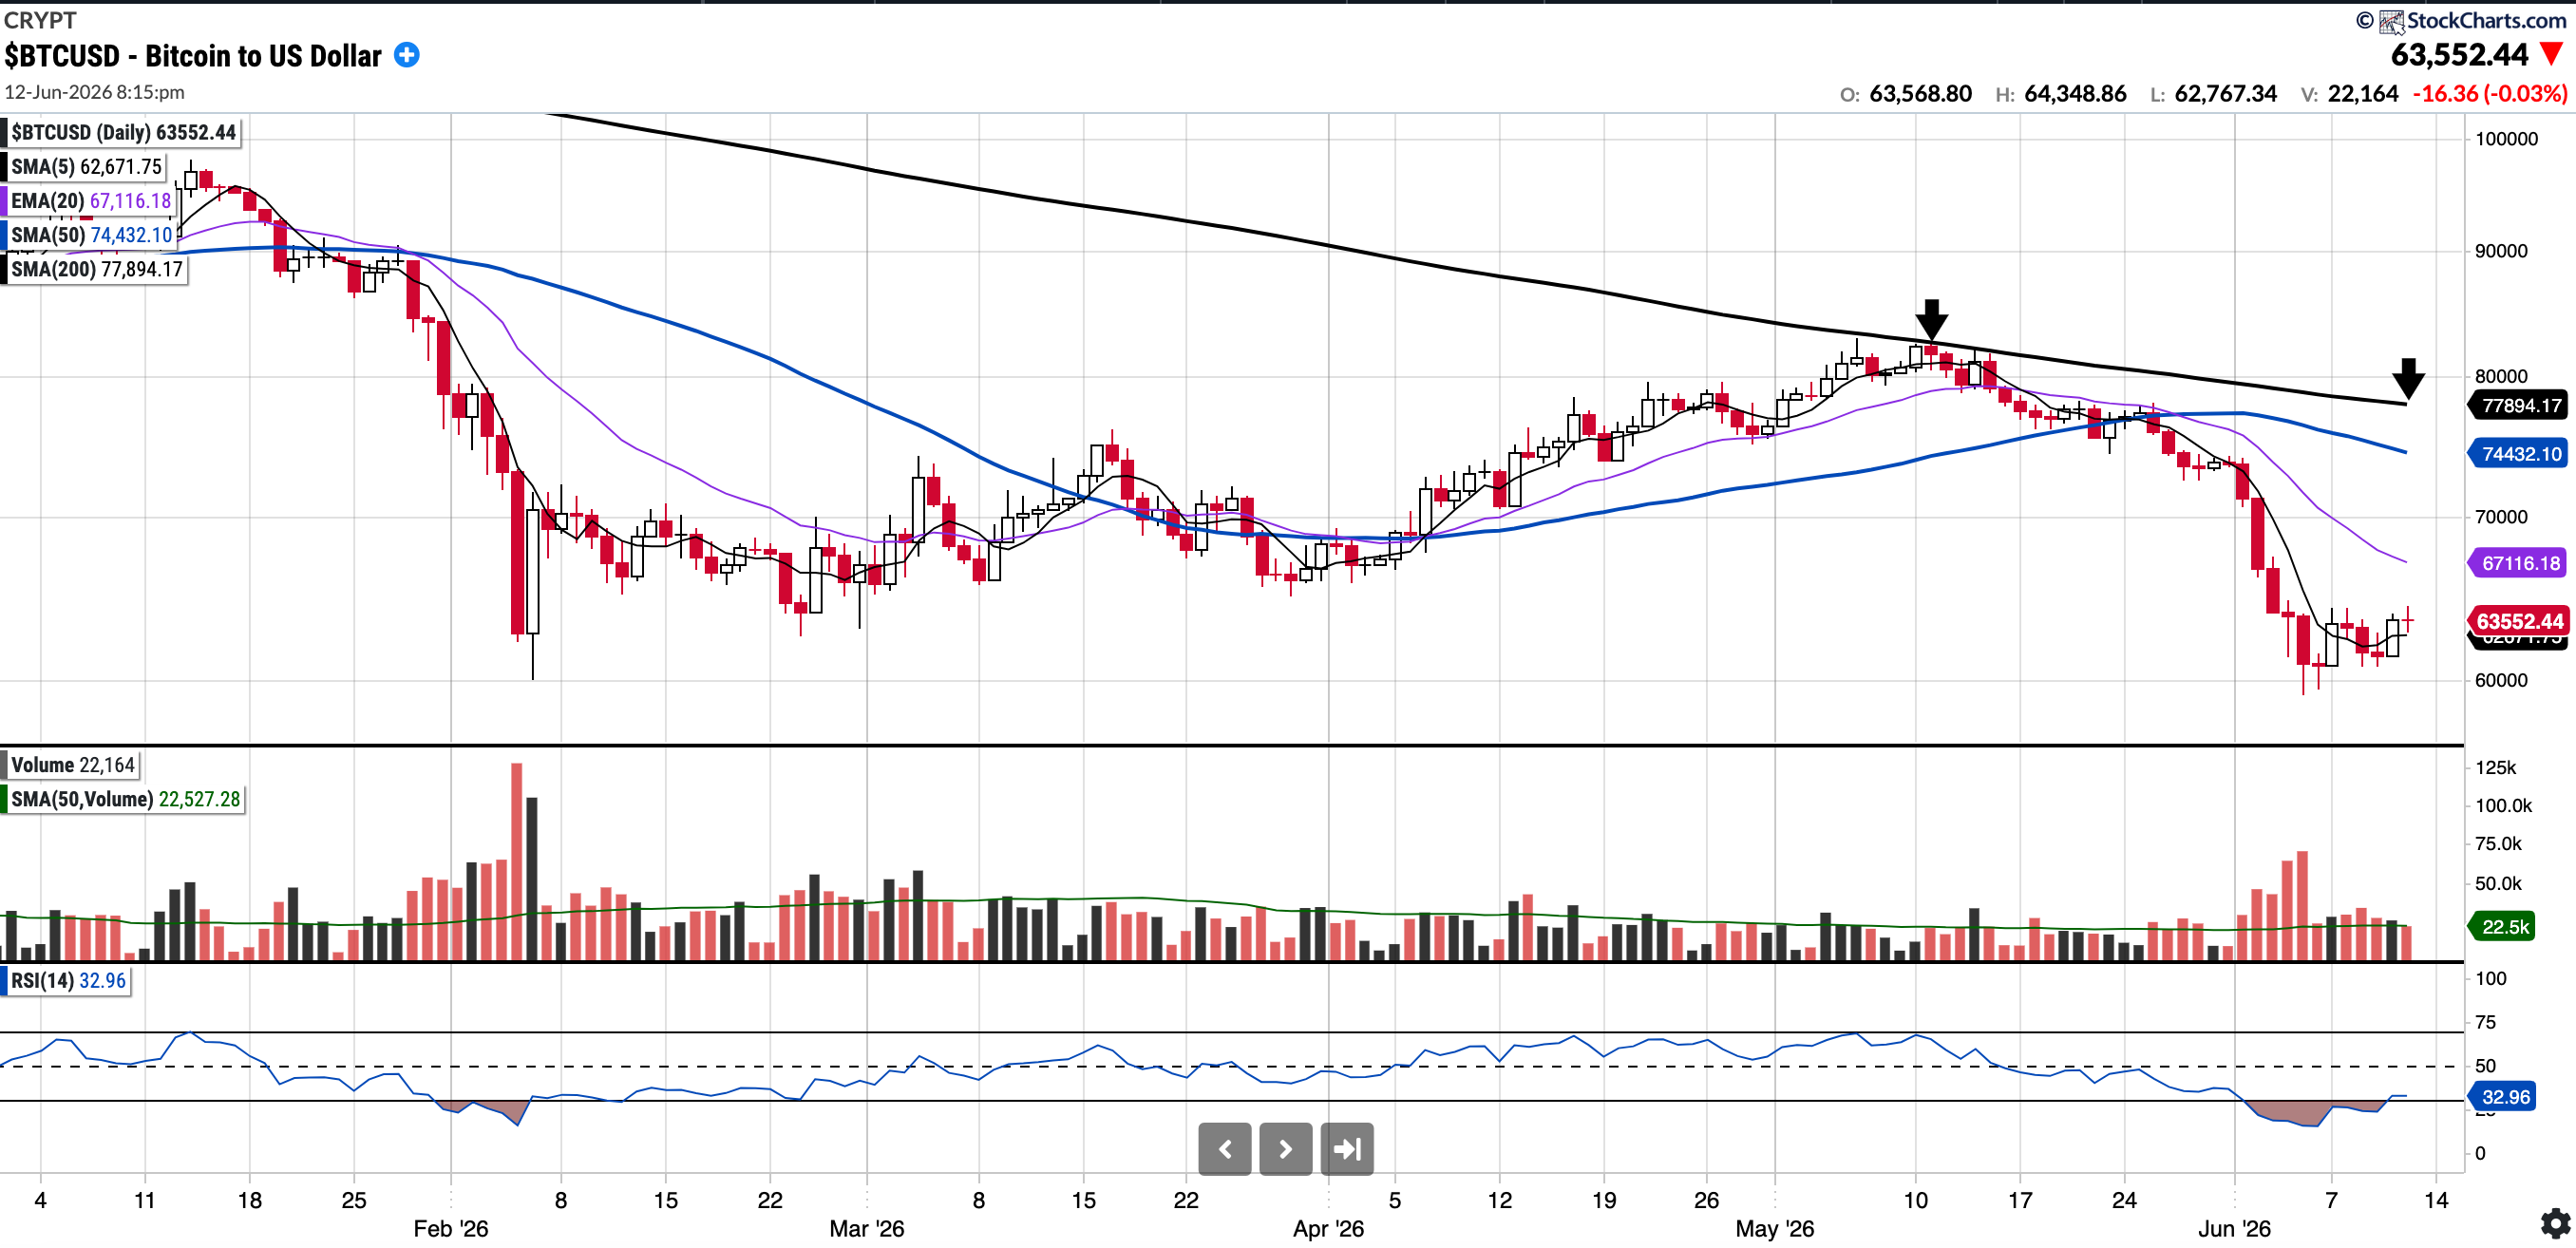
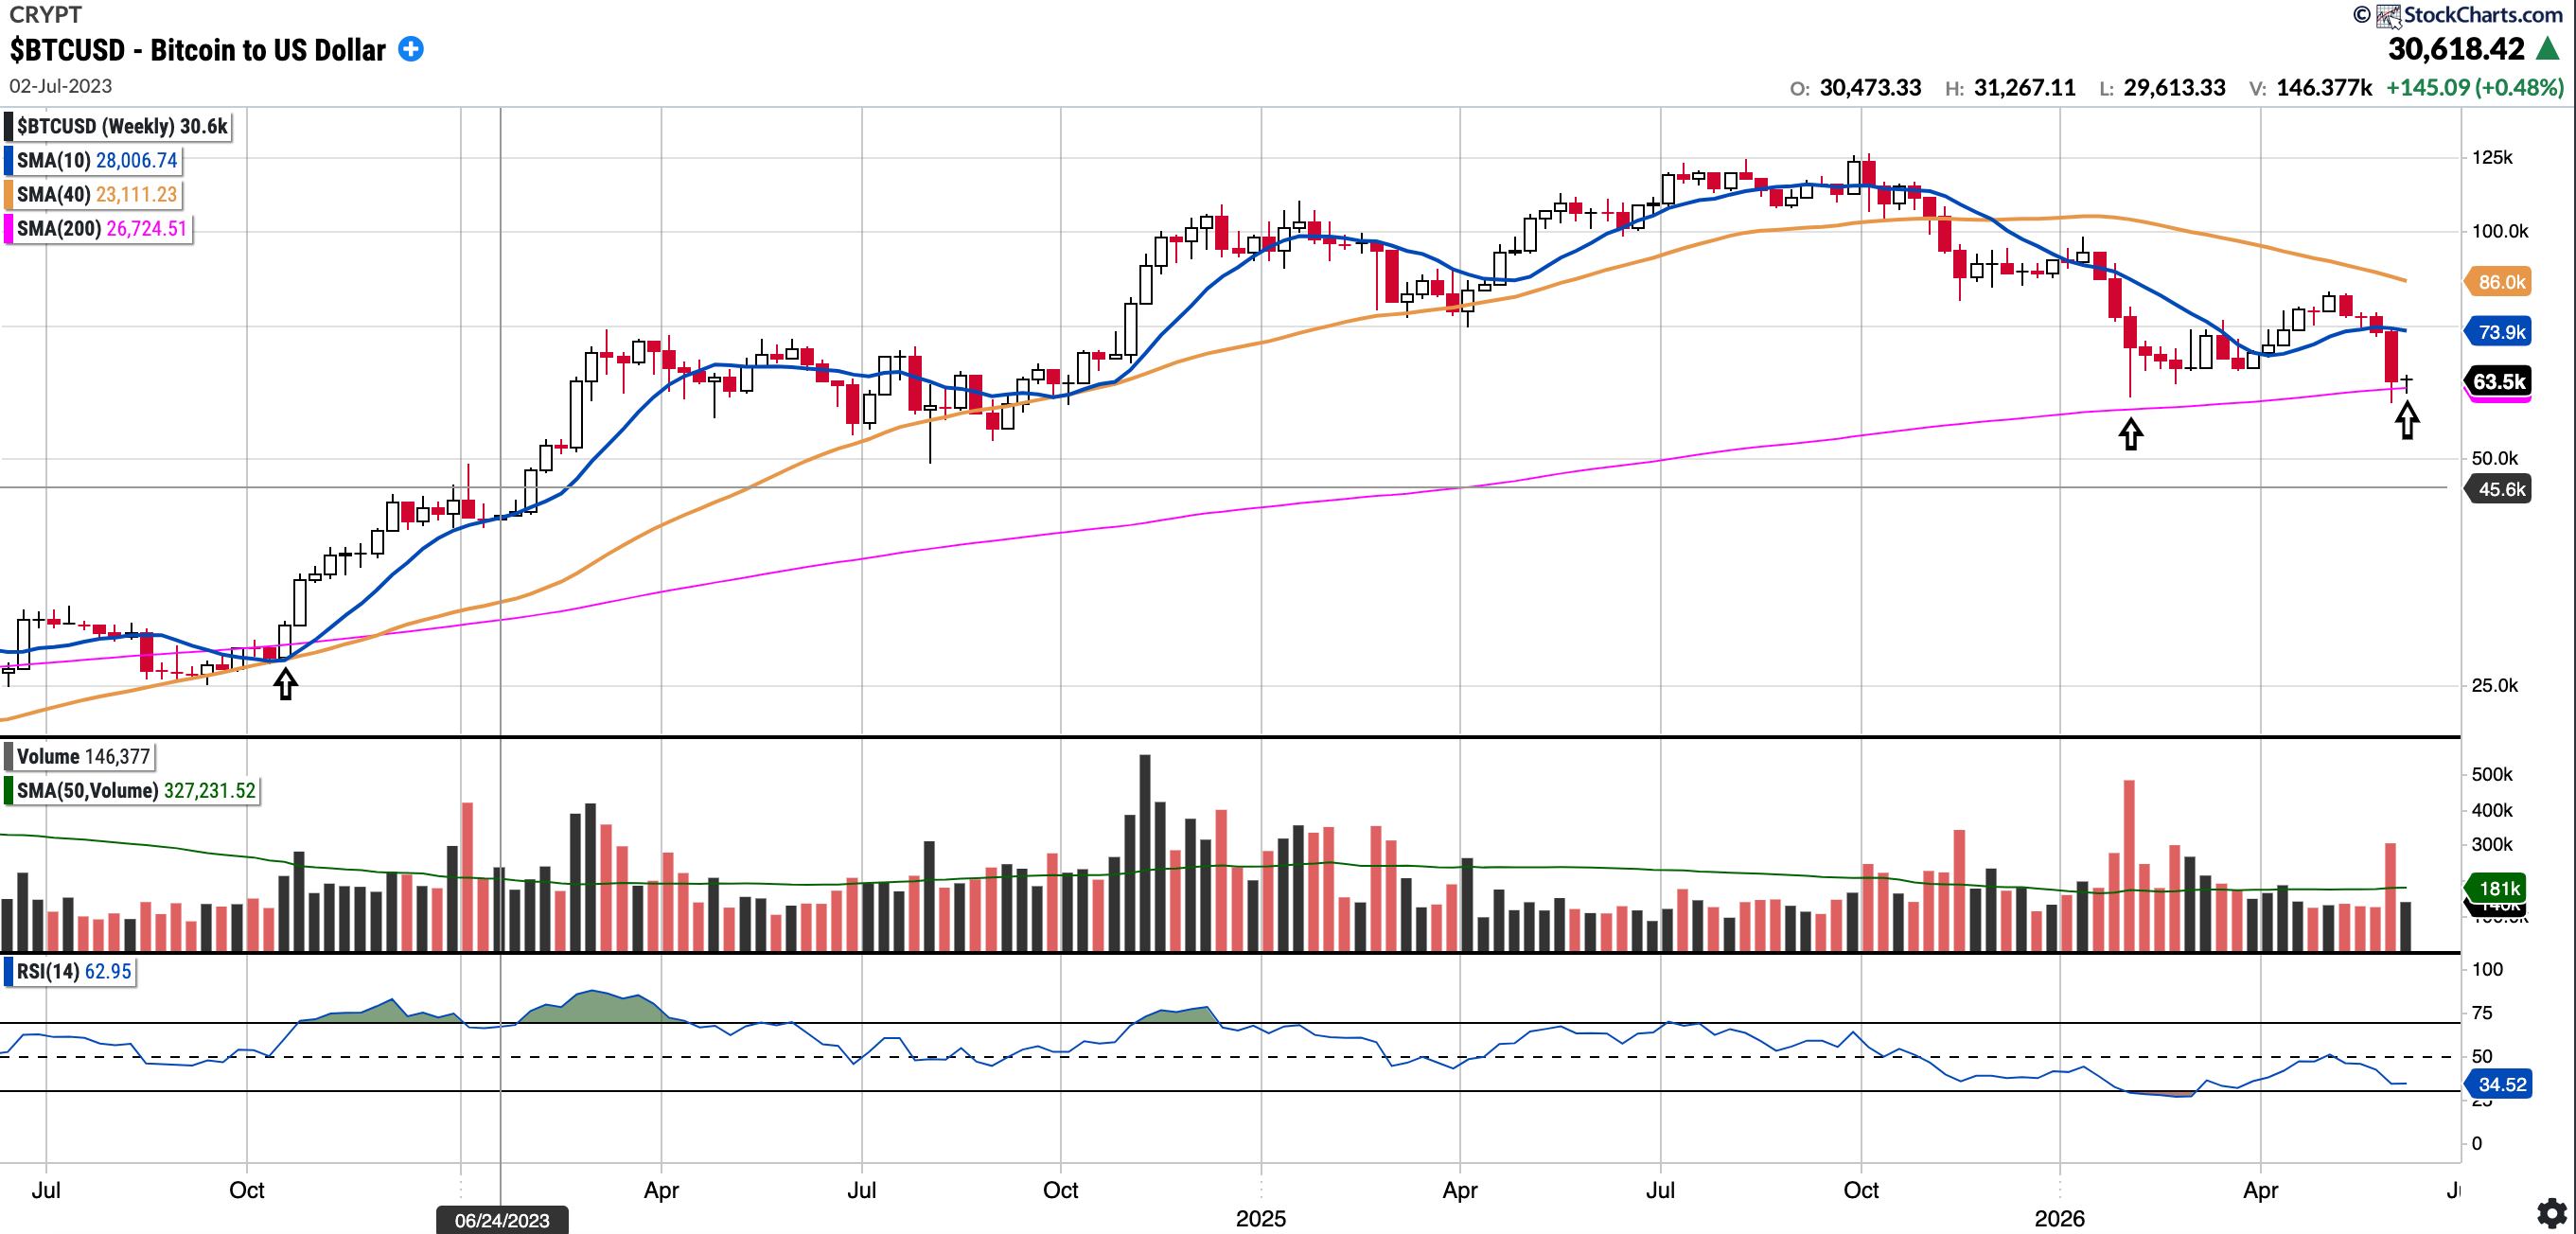
BTC (currently Long)
Currently trades at $63,552.44, 14.62% below the 50SMA and 18.41% below the 200SMA.
RSI 32.96
-28.4% YTD.
The U.S. Senate Banking Committee advanced the Digital Asset Market Clarity Act to the full Senate in a bipartisan 15–9 vote a few weeks ago. Yet, despite this regulatory progress, BTC was firmly rejected at its 200-day moving average and is now back at the 200-week moving average. It is currently holding that level (See chart)
As of Friday, June 12th at 21:17 BST, BTC is trading below all key moving averages except the 5EMA. From a technical perspective, it remains technically weak. Bulls would want to see the 200-week MA hold, and then a reclaim of near-term moving averages. 74k above is a key level also and likely the 200 SMA will serve as resistance (see arrows)
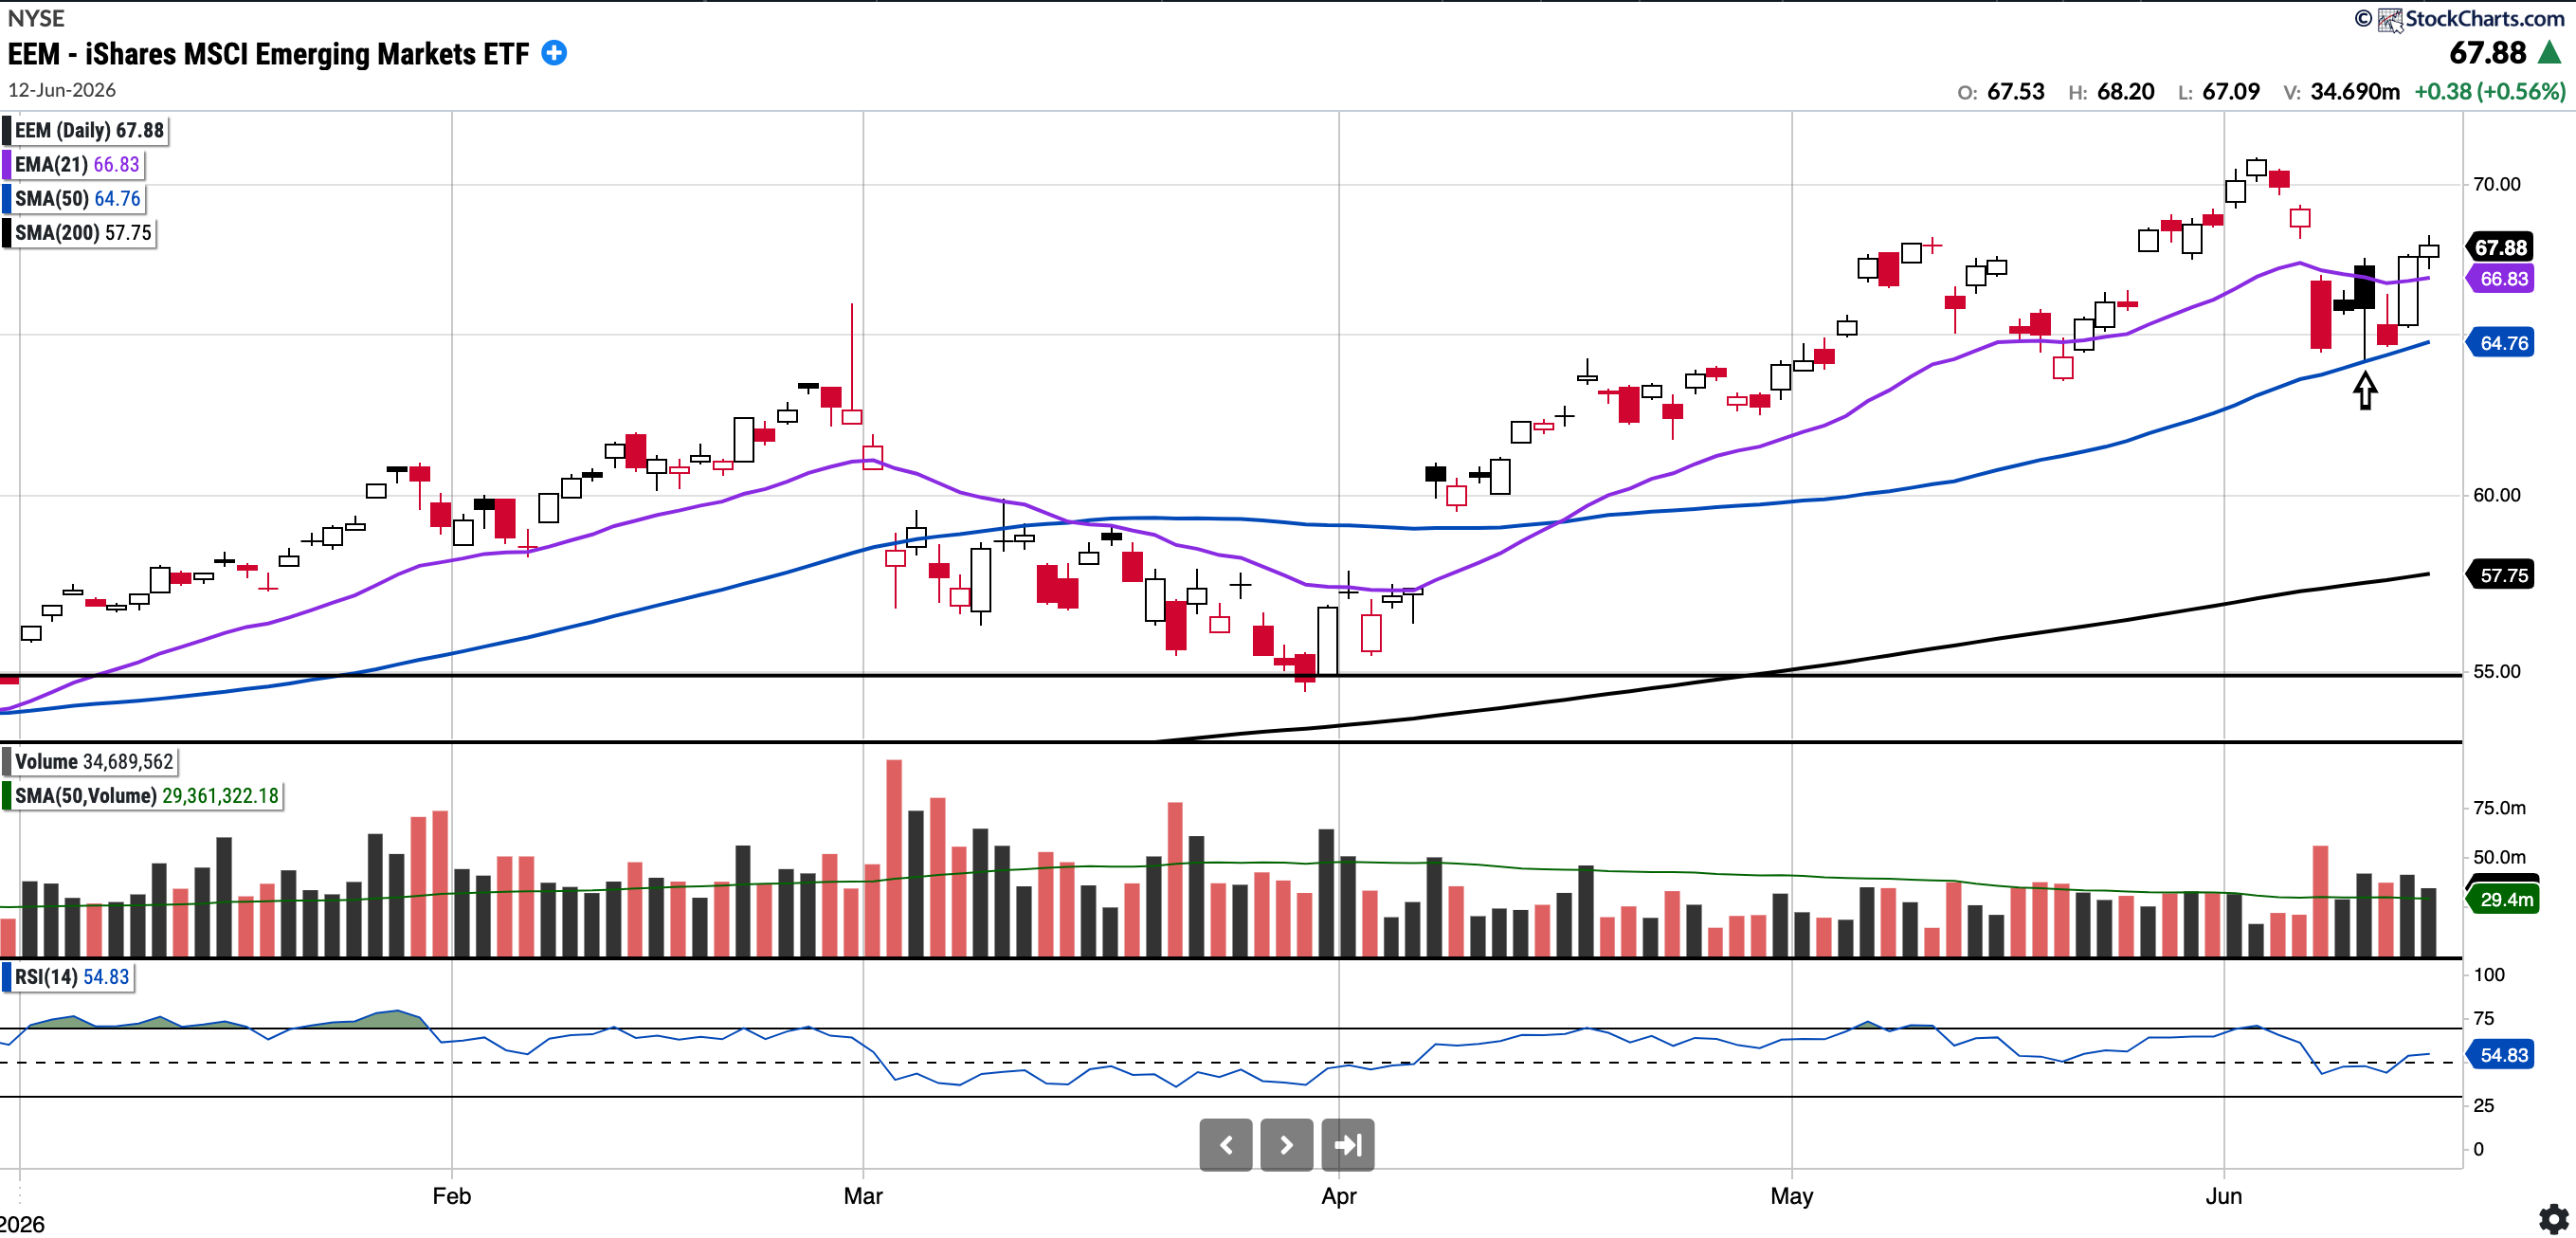
EEM
Currently trades at $67.88, 4.84% above the 50SMA and 17.56% above the 200SMA
RSI 54.83
+20.71% YTD
EEM remains in a strong uptrend and continues to comfortably outperform U.S. indices by more than 1200 bps year-to-date.
While it did lose the 21-day EMA last week and tested the 50-day SMA earlier this week, the stock ends the week above all key moving averages. The key levels to watch for pullback buys will be the 50-day SMA, followed by the $55–$57 zone (where horizontal support aligns with the 200-day SMA).
I believe EEM could be setting up for multi-year outperformance; hence, I continue to watch it closely.
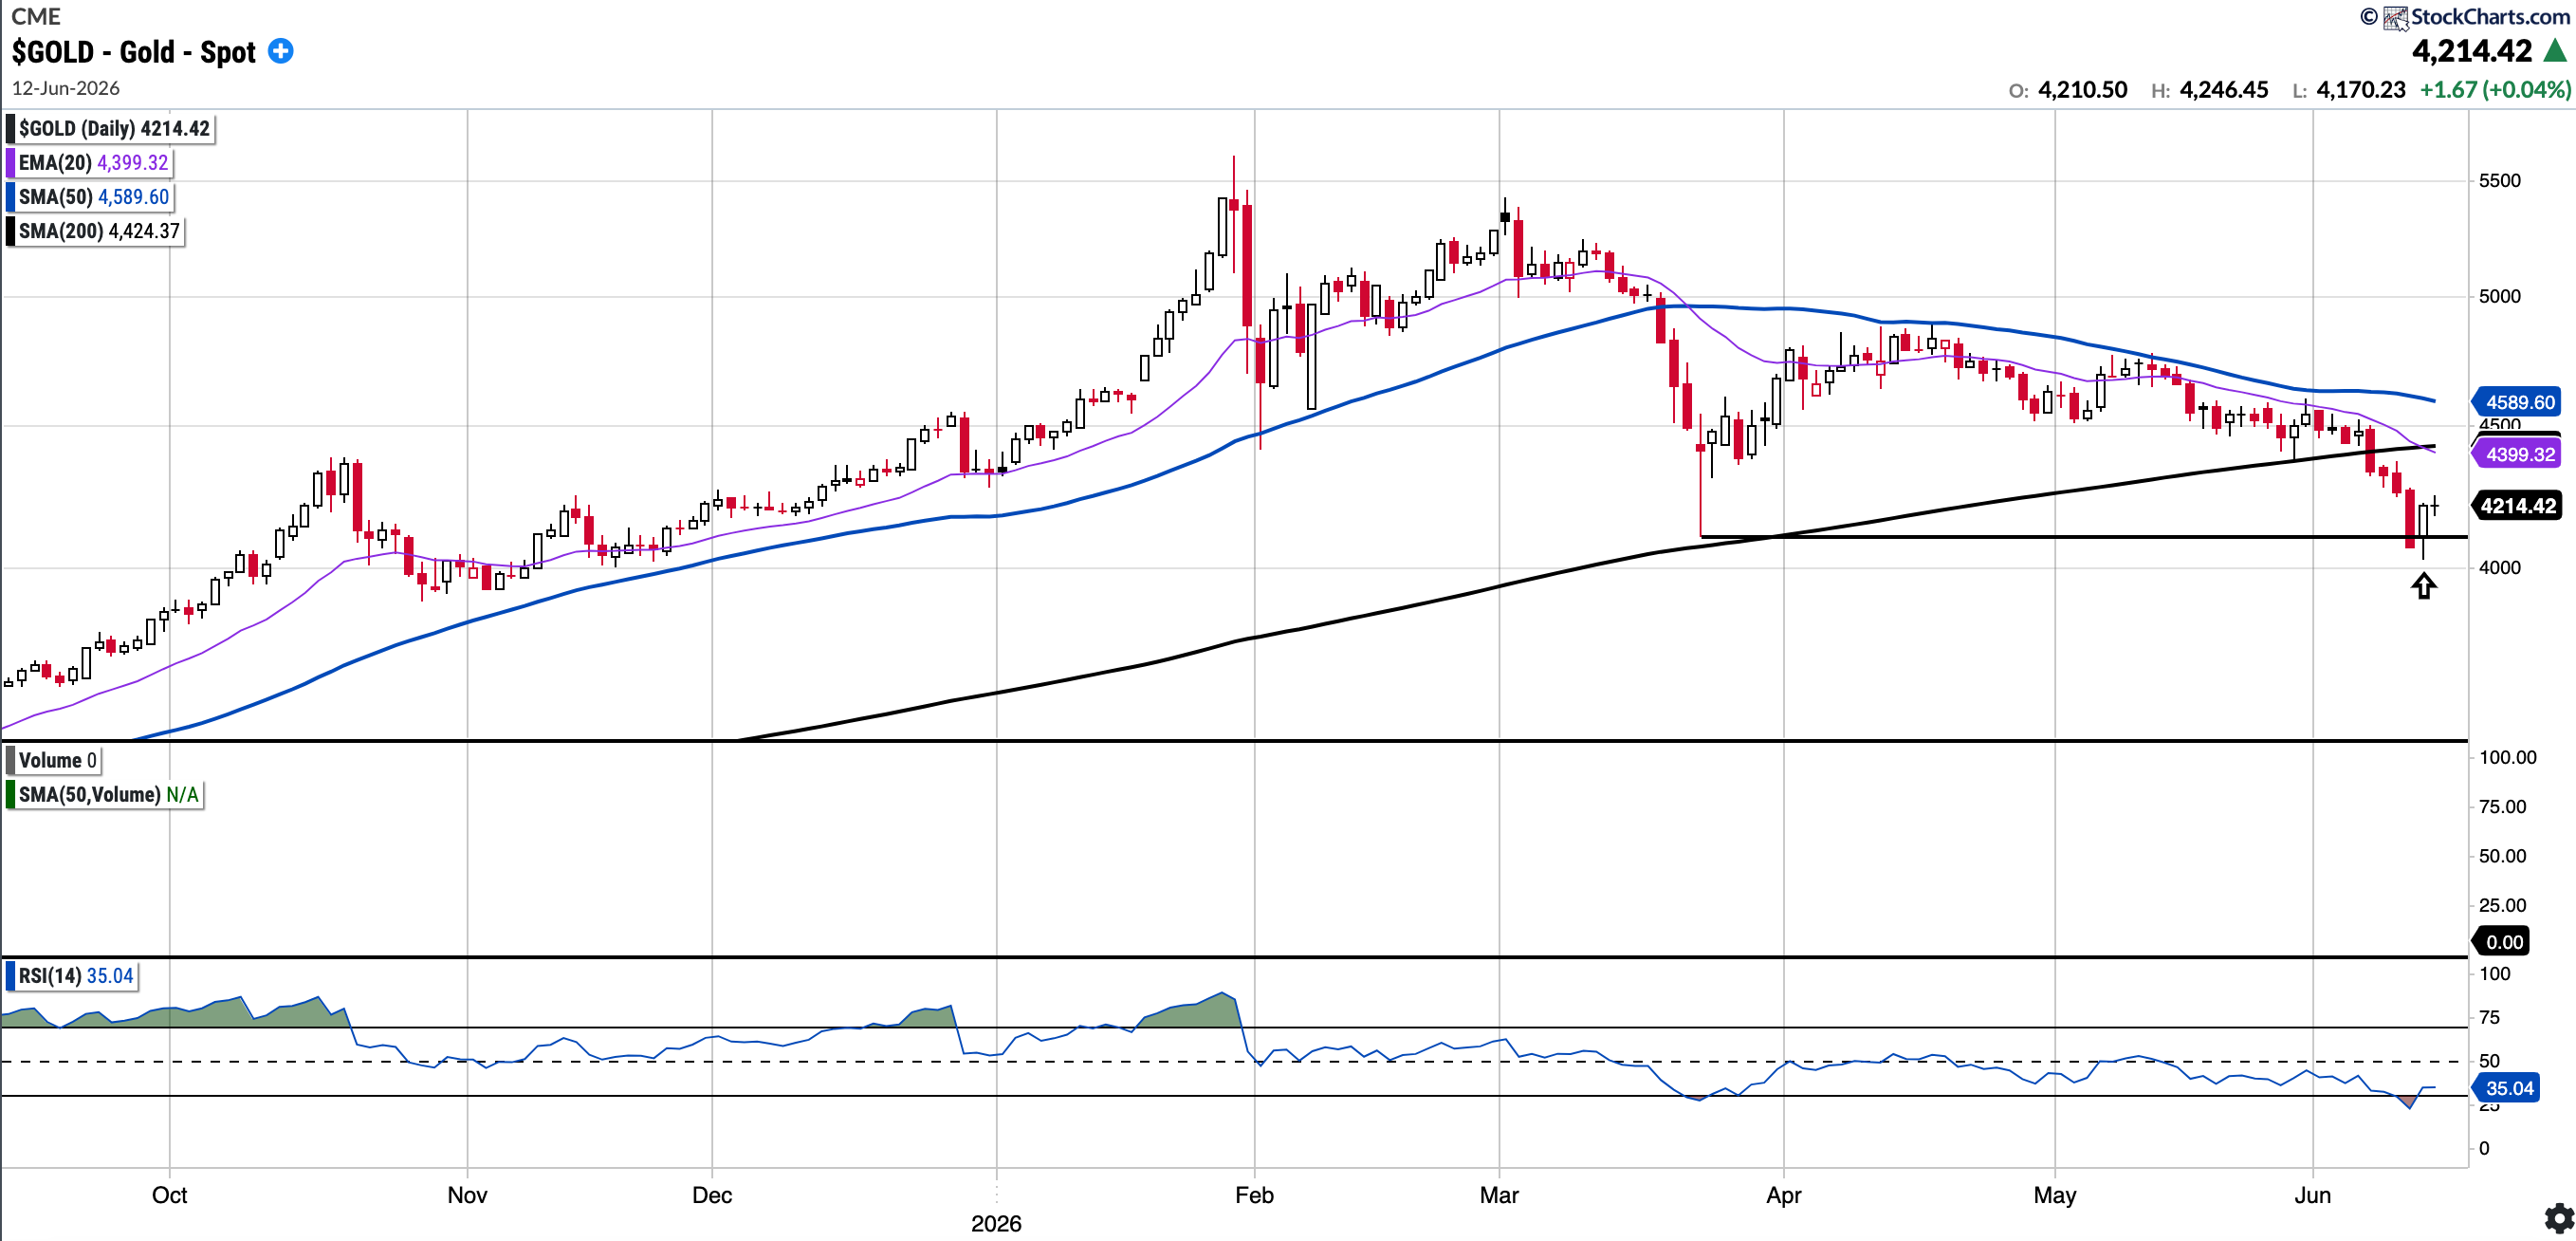
GOLD (Long Physical)
Currently trades at $4,214.42, 8.18% below the 50SMA and 4.75% below the 200SMA
RSI 35.02
-2.51% YTD
Gold lost its 200-day moving average last week for the first time since its bull run began in late 2023. That is notable and potentially concerning if not reclaimed.
I mentioned last week that the 4100 level below becomes an area of interest, and while it was undercut, gold has since reclaimed that level (see arrow). Bulls would like to see the key moving averages above reclaimed, starting with the 200 day.
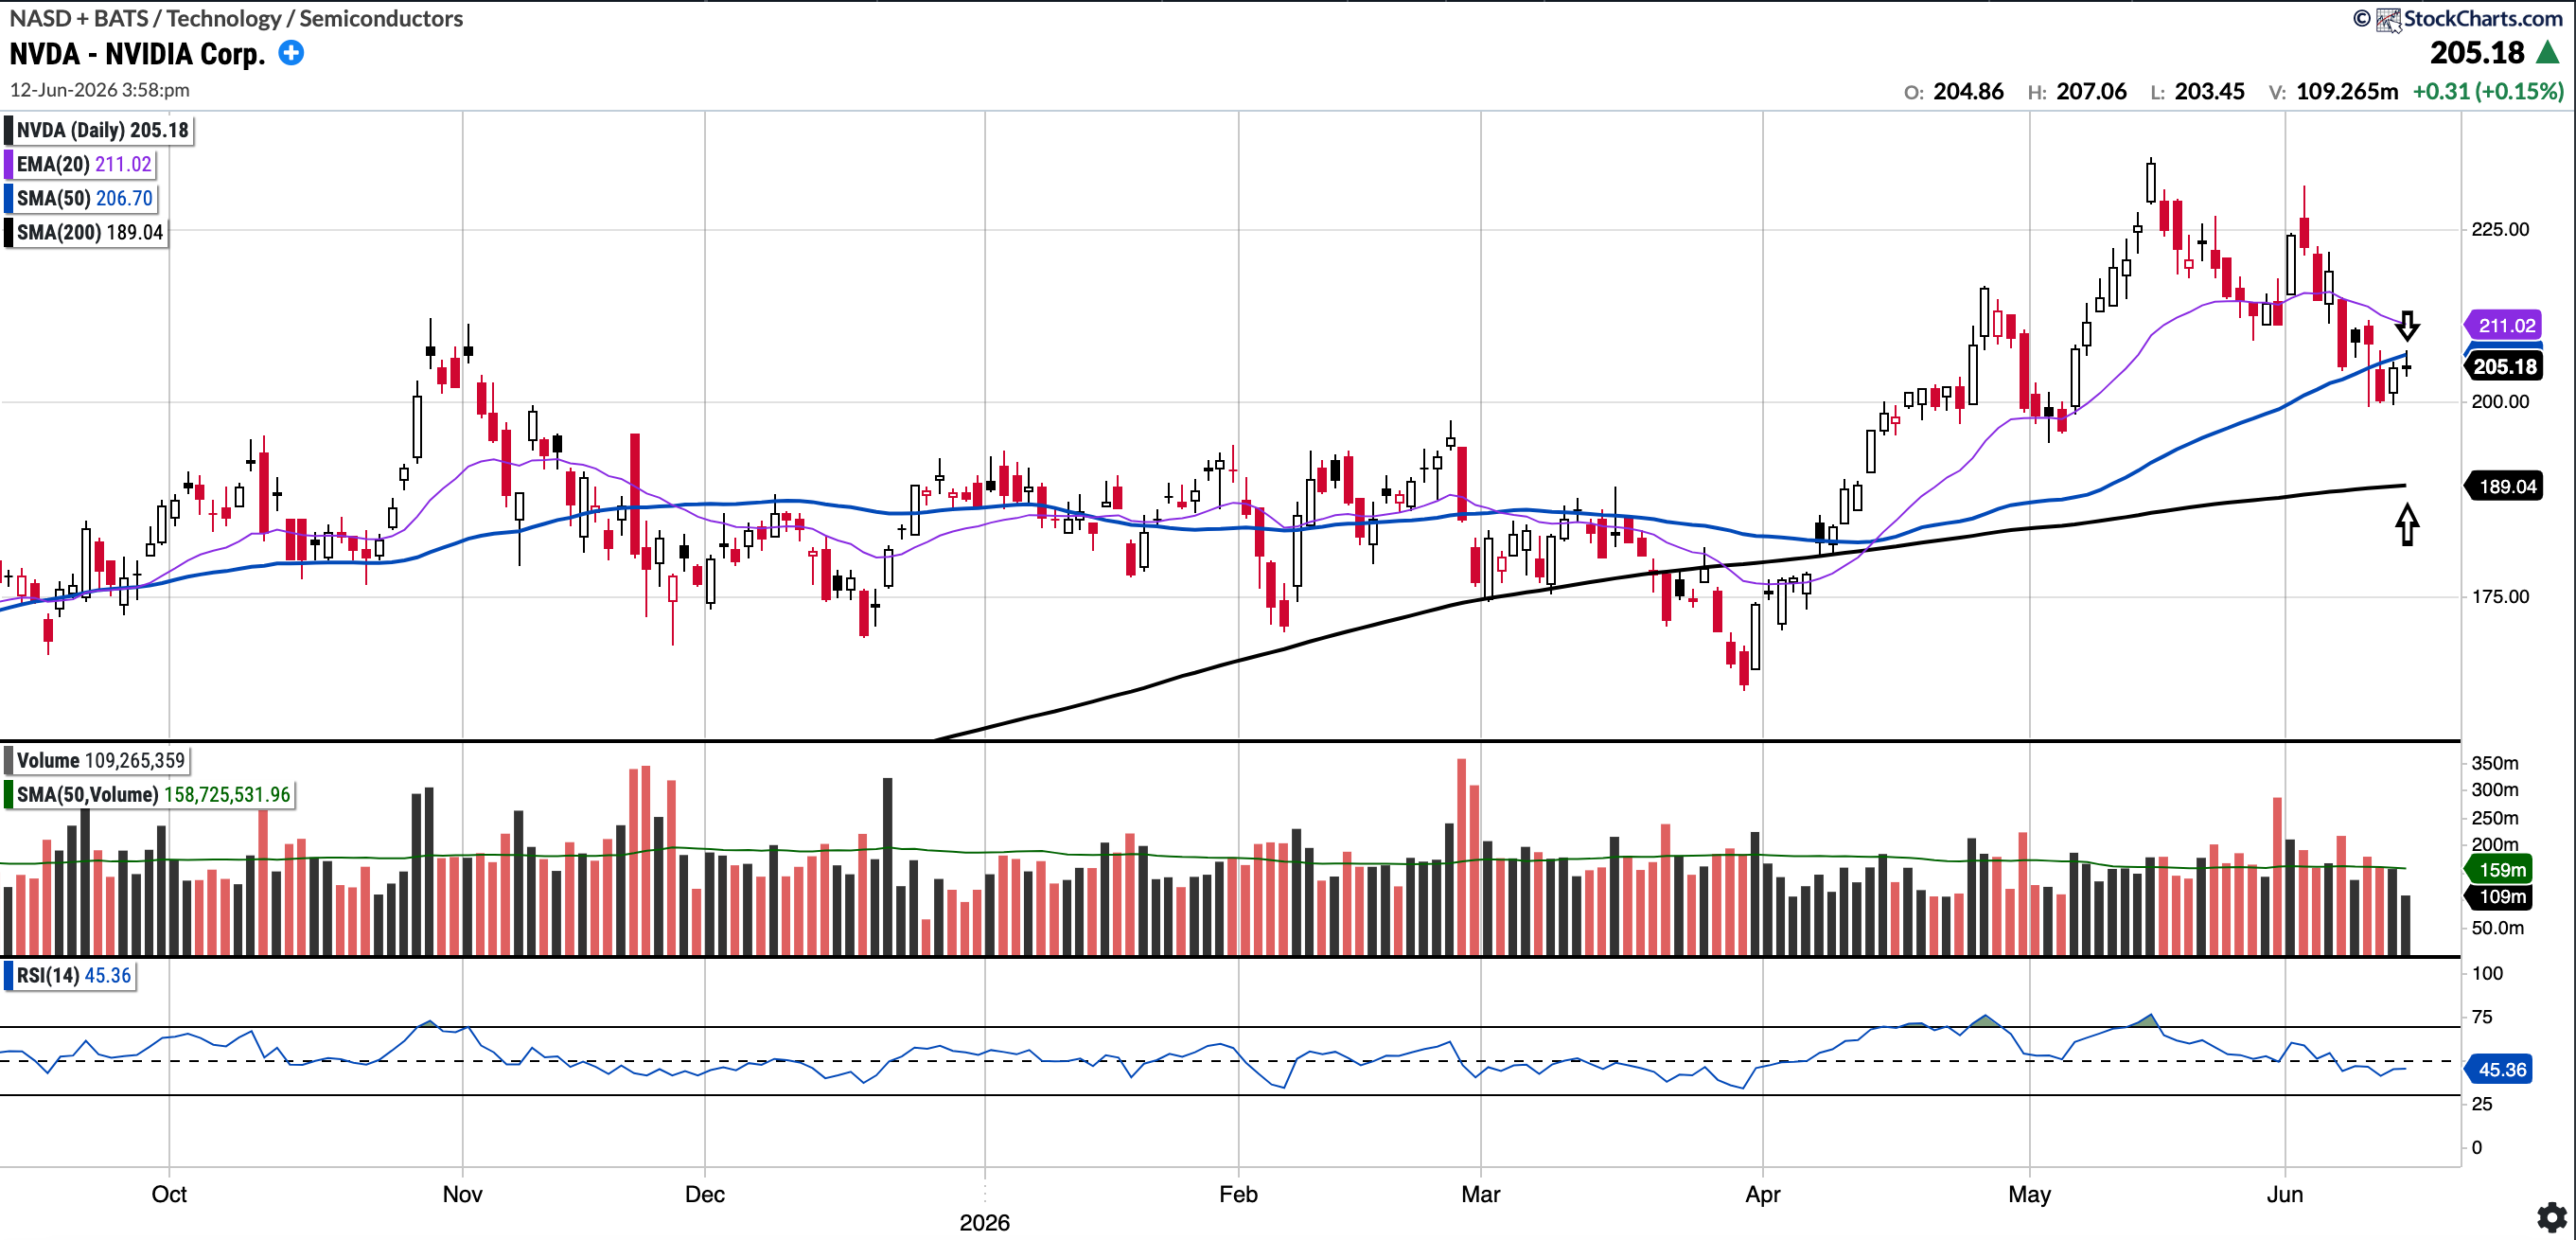
NVDA (Currently Long)
Currently trades at $205.18, 0.73% below the 50SMA and 8.54% above the 200SMA
RSI 45.36
8.74% YTD
NVDA did trade as high as $240.00 two weeks ago on Friday to complete the measured move post its breakout.
However, since its Q1 print, NVDA has pulled back and is currently trading below its 50-day moving average. If that level is not reclaimed, we could see NVDA test the 200-day SMA at $189.04. This may serve as a compelling risk-reward level to add exposure, given that the forward P/E would drop below 14x at that price.
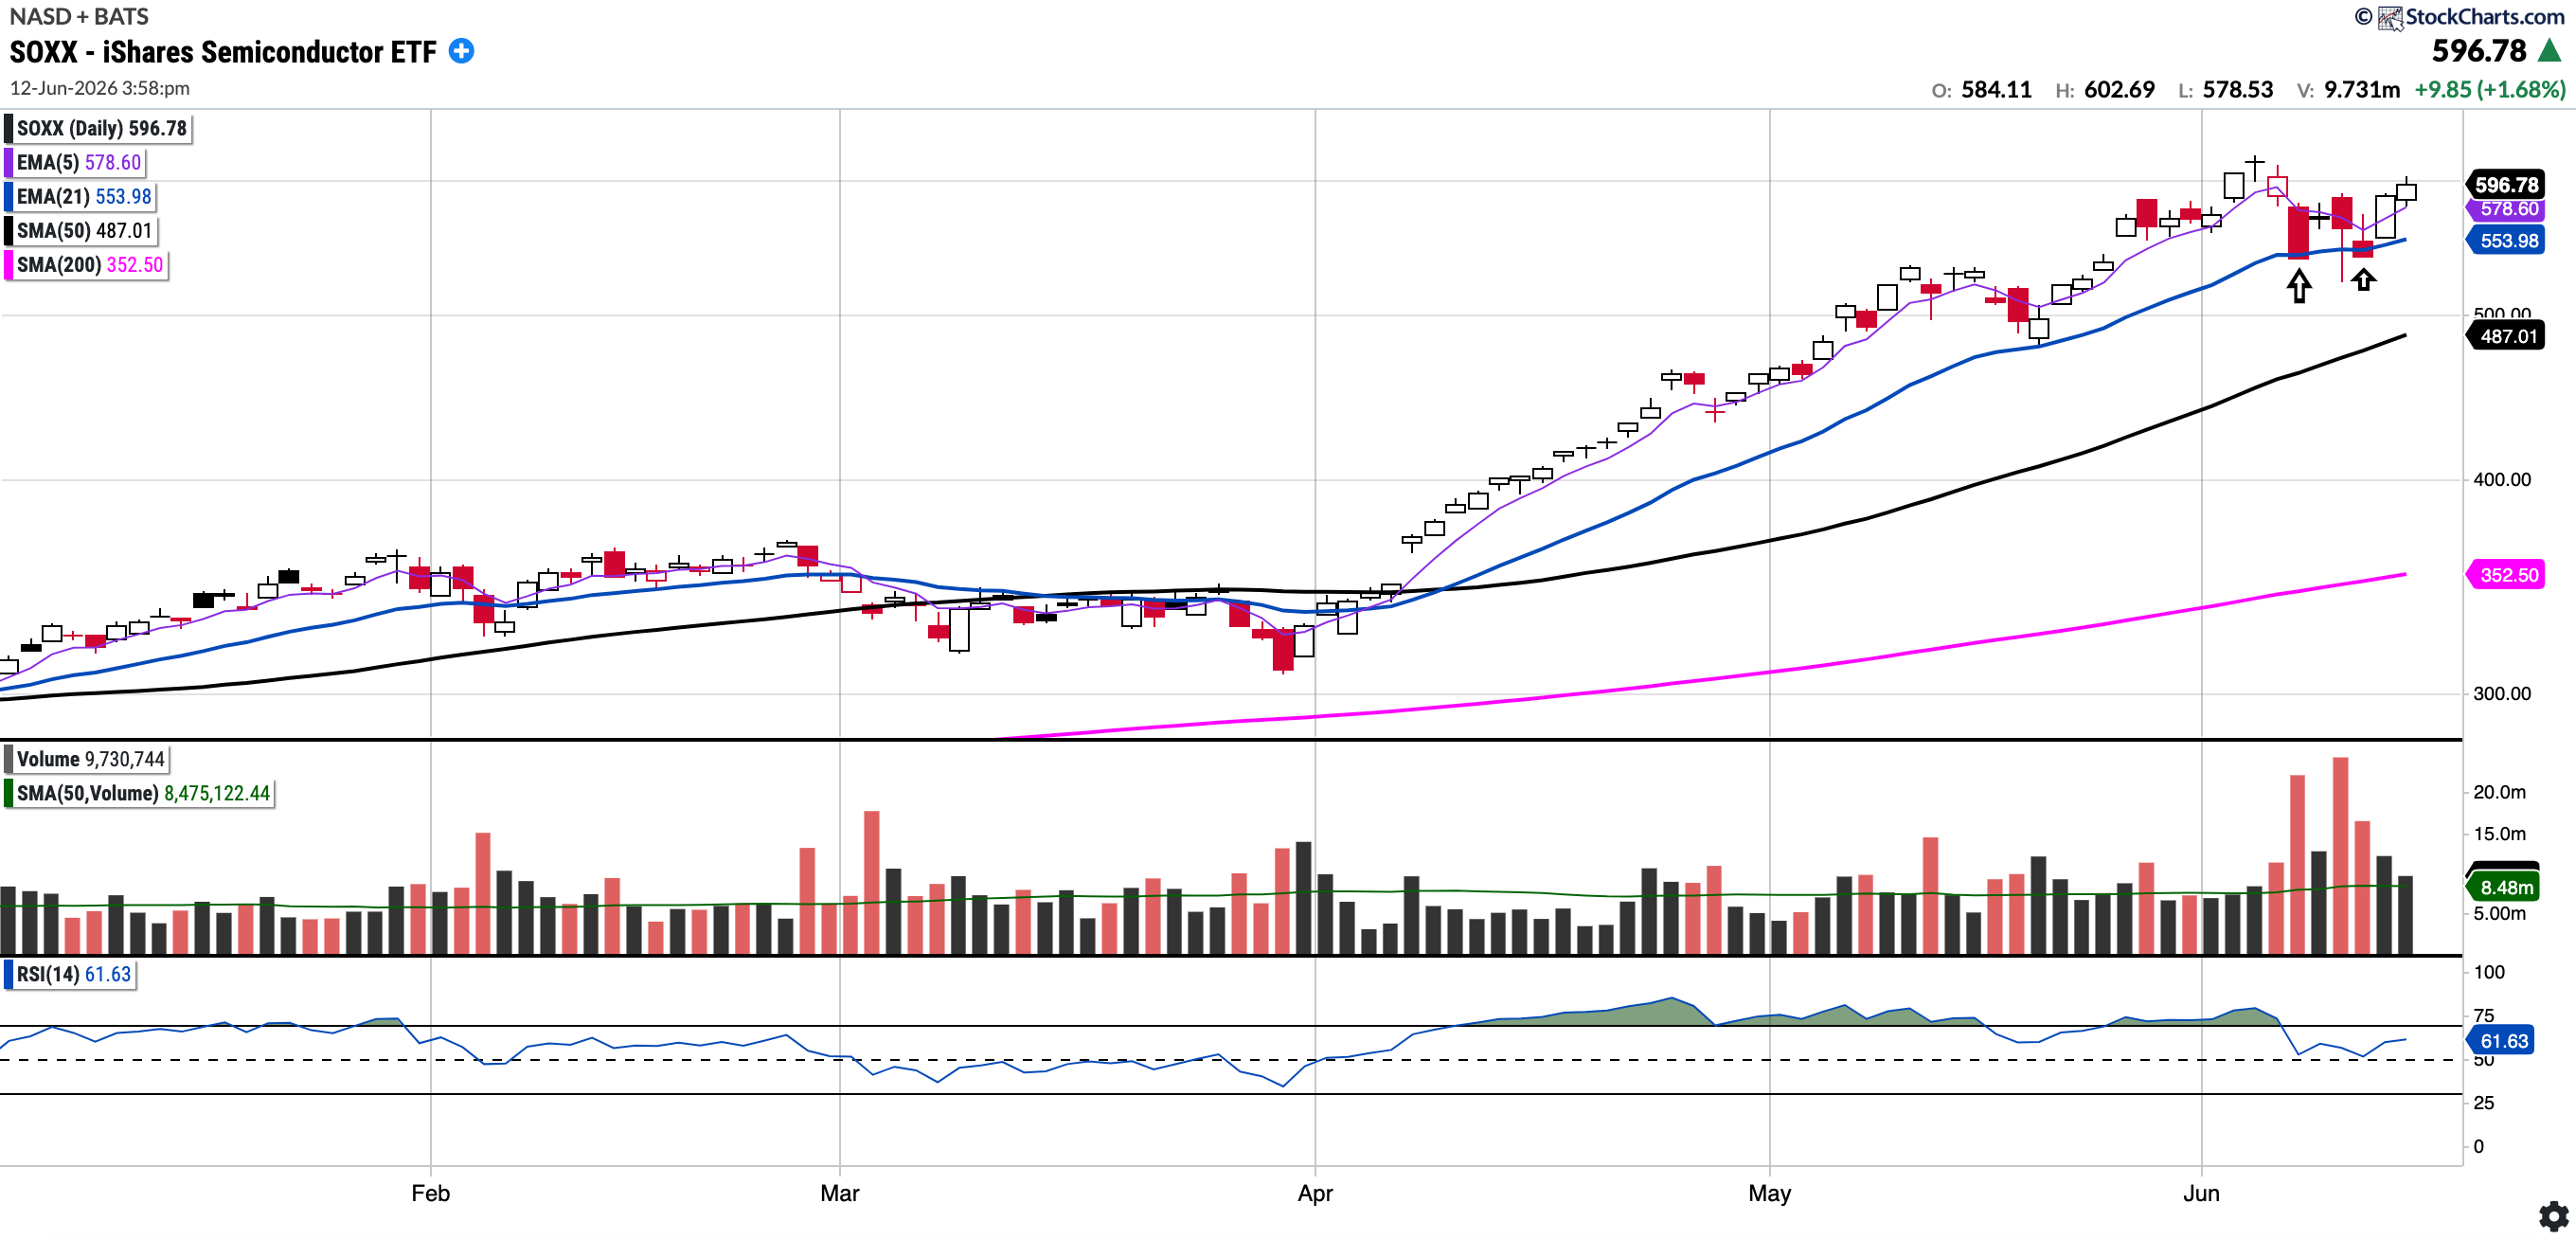
SOXX
Currently trades at $596.78, 22.43% above the 50SMA and 69.15% above the 200SMA
RSI 61.63
90.19% YTD
Last week I had written:
SOXX sold off on almost three times its normal volume on Friday. Interestingly, the last time this level of selling occurred for the SOXX was on October 10th, which marked the beginning of the correction for many AI stocks. Bulls would want to see the 21 day regained.
This week, while SOXX did undercut last Friday's lows, it has bounced back very sharply and is now trading close to 600 (charts from this week and last week included below). What a difference a week makes!

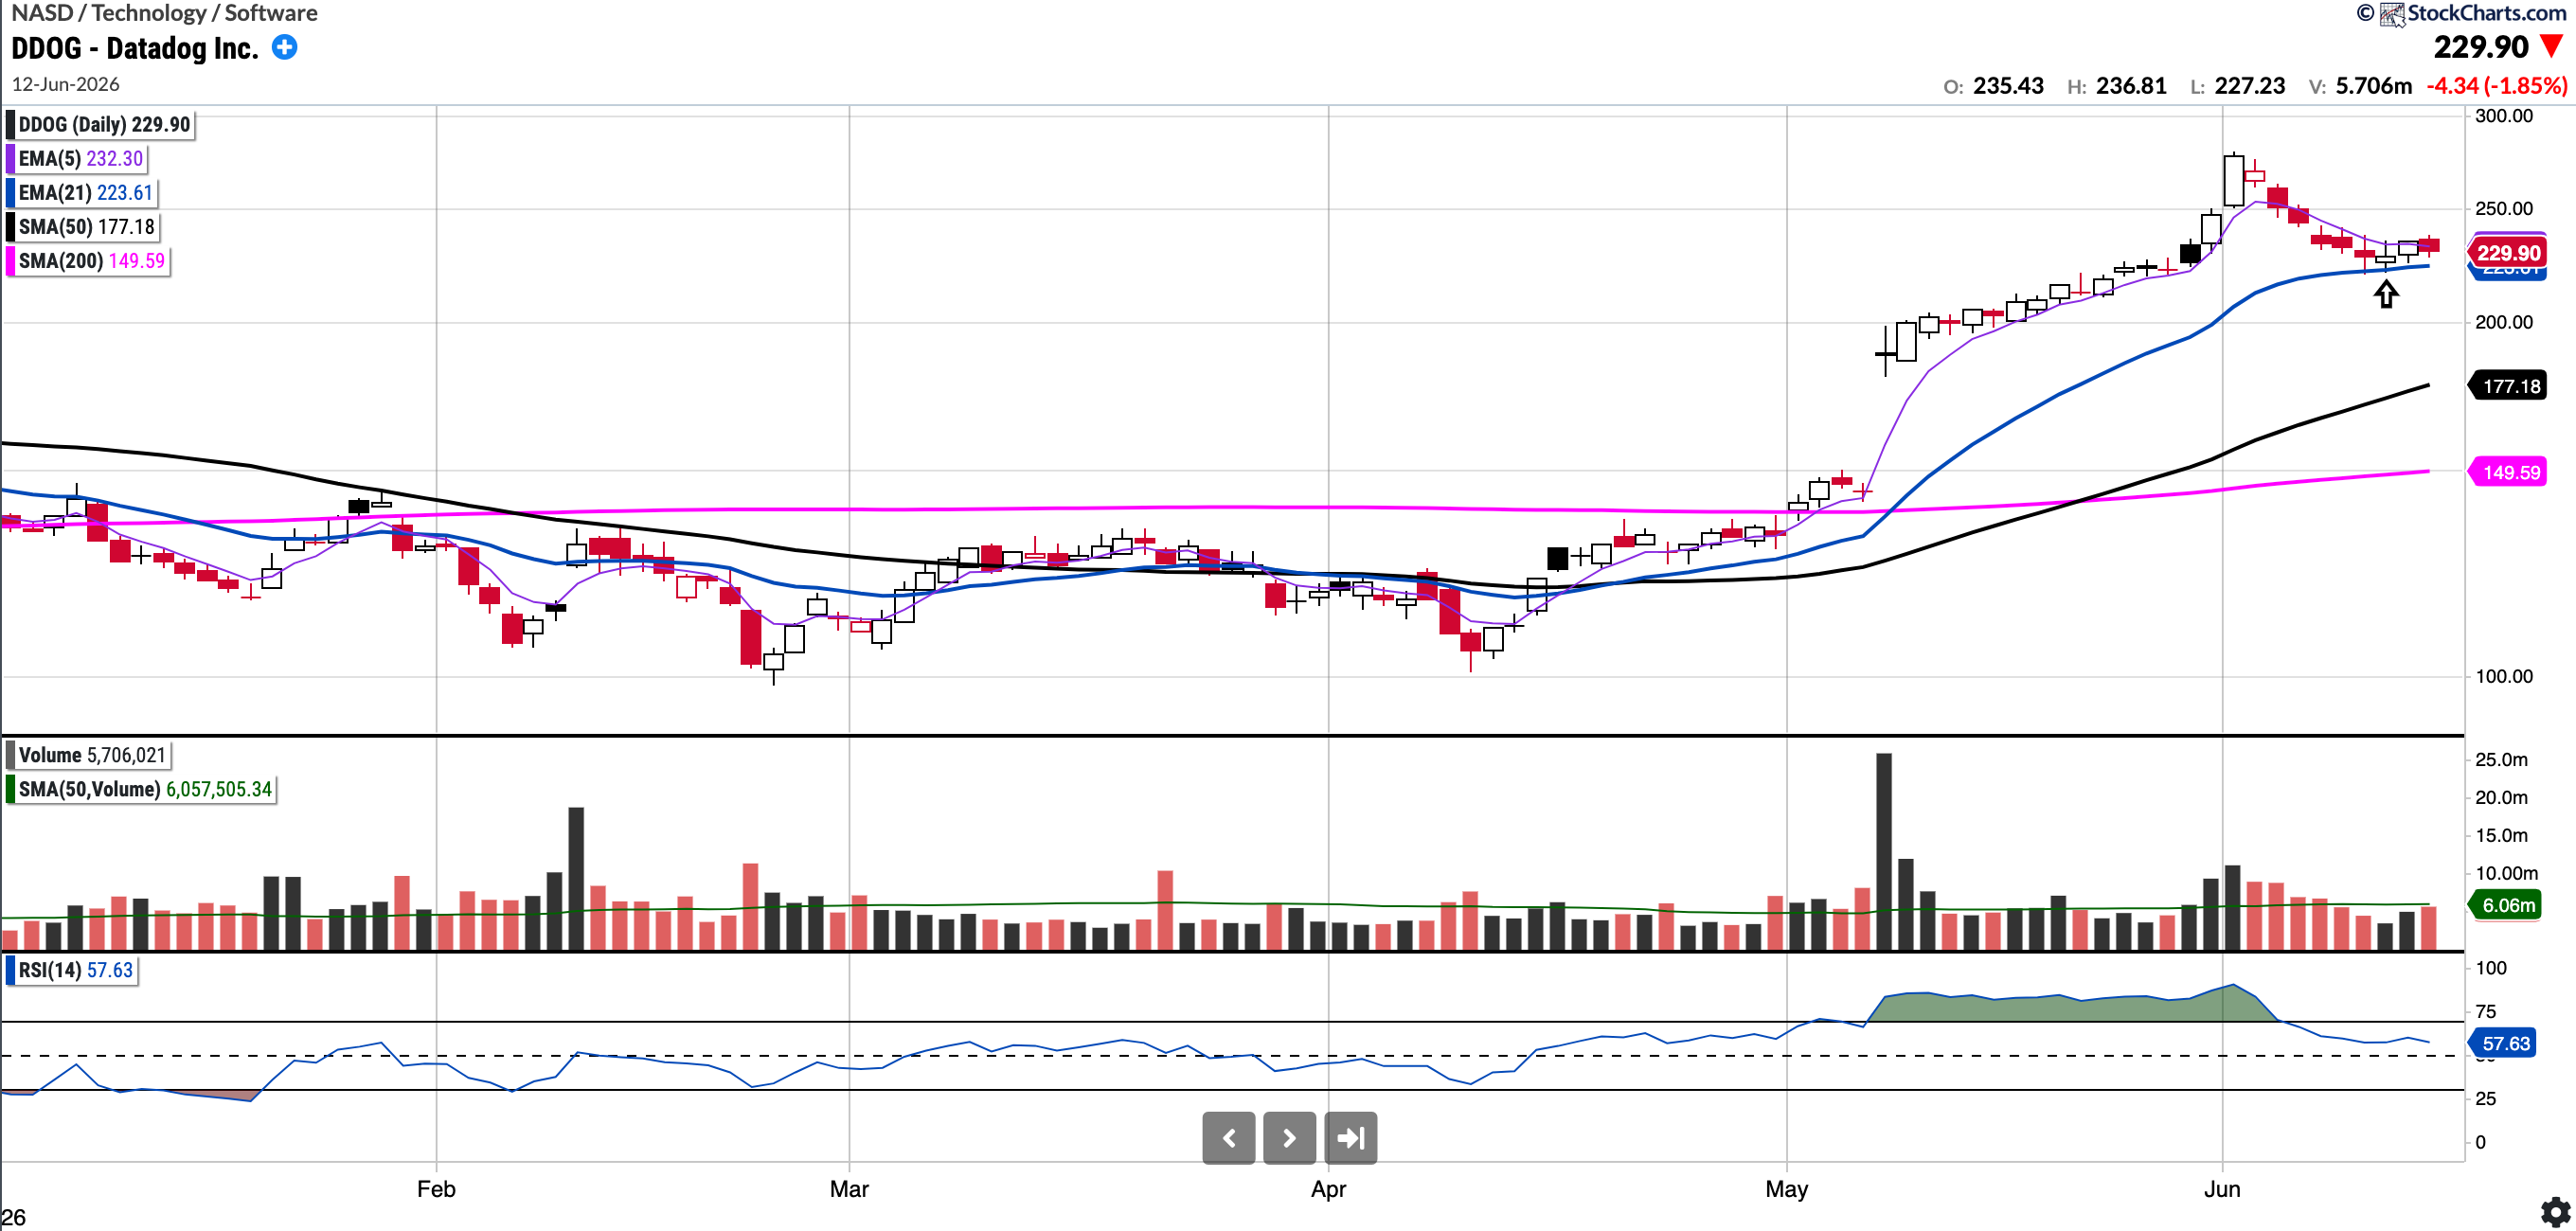
DDOG (Currently Long)
Currently trades at $229.9, 29.76% above the 50SMA and 53.68% above the 200SMA
RSI 44.01
71.86% YTD
DDOG had a large gap up post its recent quarterly earnings, qualifying as a power earnings gap (PEG). The stock ran as high as $280 and is now forming a base. It currently sits at the 21-day moving average and may be an interesting place to go long. My suspicion is it will need strength in IGV before this can get it’s next leg up.
Important: I will feature several other Trading ideas in the Watchlist Snapshot post, so keep a look out for that post later. It will also include my Trading Account holdings.
Recent weeks post (link below) have had countless positions responding to key levels and running sharply such as:
ASTS 74 to 130
FLY 32 to 62
NOK 12.4 to 16
RBRK 60 to 78
CIFR 18 to 25
USAR 19 to 30
ORCL 160 to 225

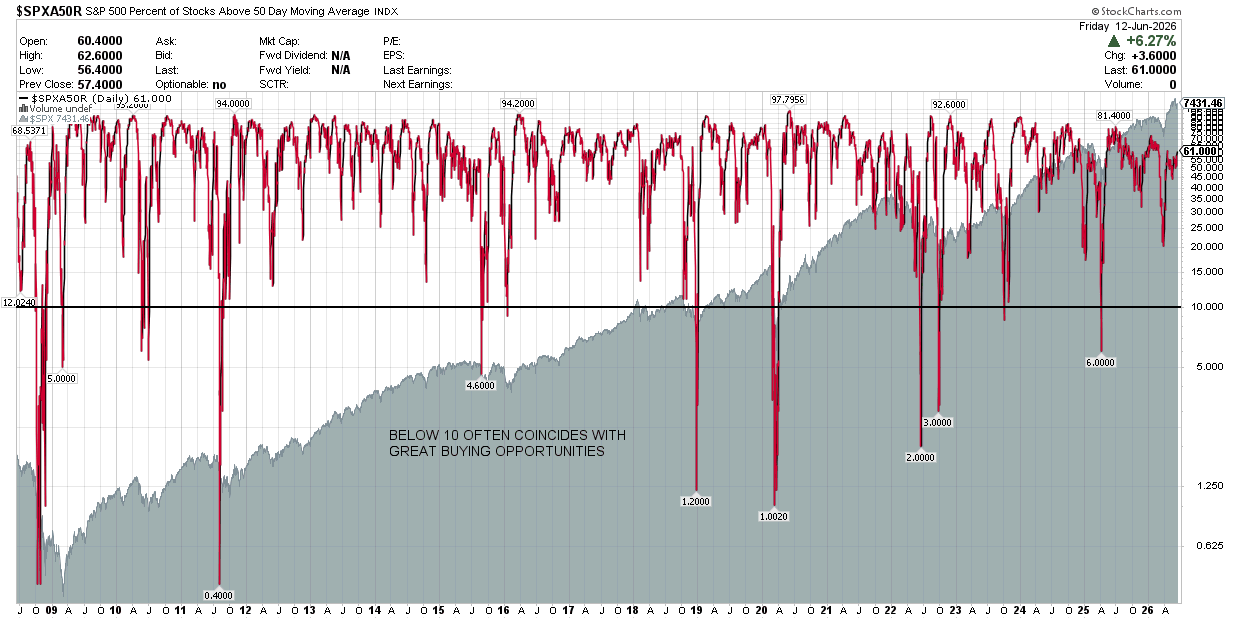
S&P 500 Percentage of Stocks Above the 50 Day Moving Average: Currently 61%
Breadth improved this week, with the percentage of stocks above the 50-day moving average increasing to 61%.
Notable portfolio changes in previous week (all updated live in subscriber channels):
Re-entered STM at 68
