
Preview of the Week Ahead: W/C March 23, 2026
Markets at the Brink...

Hope you all are having a good weekend. Below, we will be previewing the upcoming week's events and providing a portfolio update as usual.
Format for what is covered in this weekly preview:
A Look at the Indices
Key Upcoming Economic Events
Upcoming Earnings Reports
Charts
Notable Portfolio Changes from the Previous Week
Current Portfolio Holdings
Position size, cost basis, and commentary on each holding regarding the intended holding period and any planned activity
Closing Thoughts
I recommend checking out the latest Monthly Portfolio and Performance Update below:

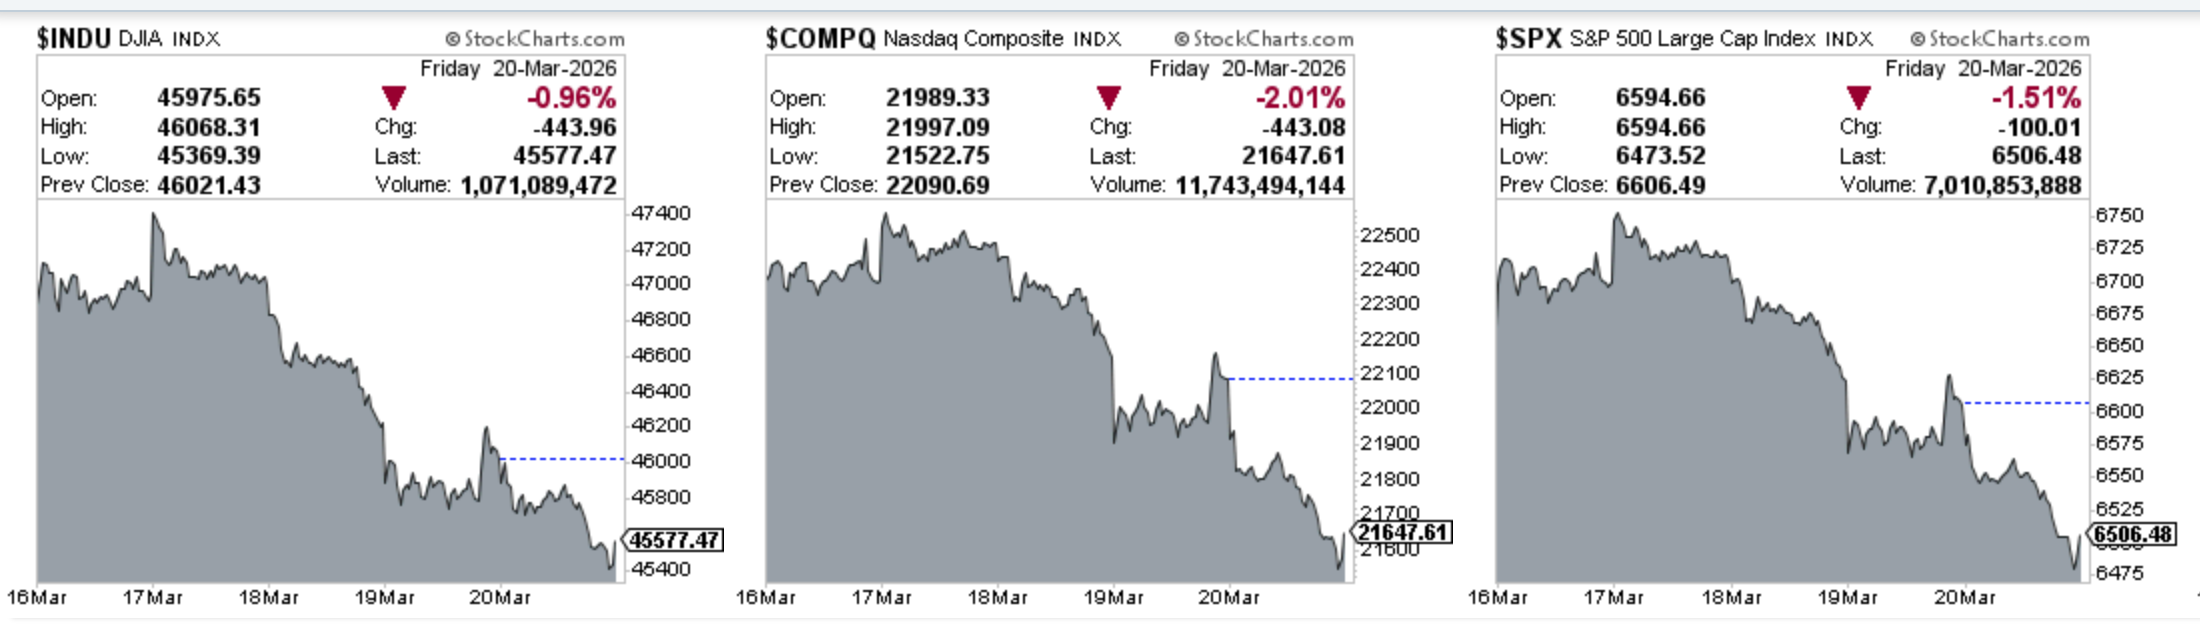
Indices
Dow Jones declined 2.81% in the last week
S&P 500 declined 2.81% in the last week
Nasdaq Composite declined 3.22% in the last week
IWM declined 3.19% in the last week
Key upcoming economic events
Monday, March 23
Chicago Fed National Activity Index (February)
Construction Spending (January)
Atlanta Fed GDPNow Estimate (Q1 2026):
The model is currently tracking at roughly 2.1% as the quarter nears its end.
Tuesday, March 24
S&P Global Flash Manufacturing PMI (March):
Expected to land around 51.2, indicating modest expansion despite the recent surge in energy input costs.
S&P Global Flash Services PMI (March):
Expected to hold steady near 52.8. Pay attention for signs as to whether high gasoline prices are beginning to curb discretionary service spending.
New Home Sales (February)
Fed Governor Michael Barr Speech
Wednesday, March 25
Durable Goods Orders (February)
U.S. Import and Export Price Indexes (February)
Thursday, March 26
Initial Jobless Claims:
Expected to remain rangebound between 212k and 216k; a softening job market.
Federal Reserve Speaker Block:
Commentary from Vice Chair Philip Jefferson and Governors Lisa Cook and Stephen Miran.
Friday, March 27
University of Michigan Consumer Sentiment (Final March)
Regional Fed President Speeches: Mary Daly and Anna Paulson.
Upcoming Earnings
The schedule for this week is below. This week is a lighter one relative to recent ones. I have no portfolio companies reporting. Below is the infographic by Earnings Whispers:

Charts
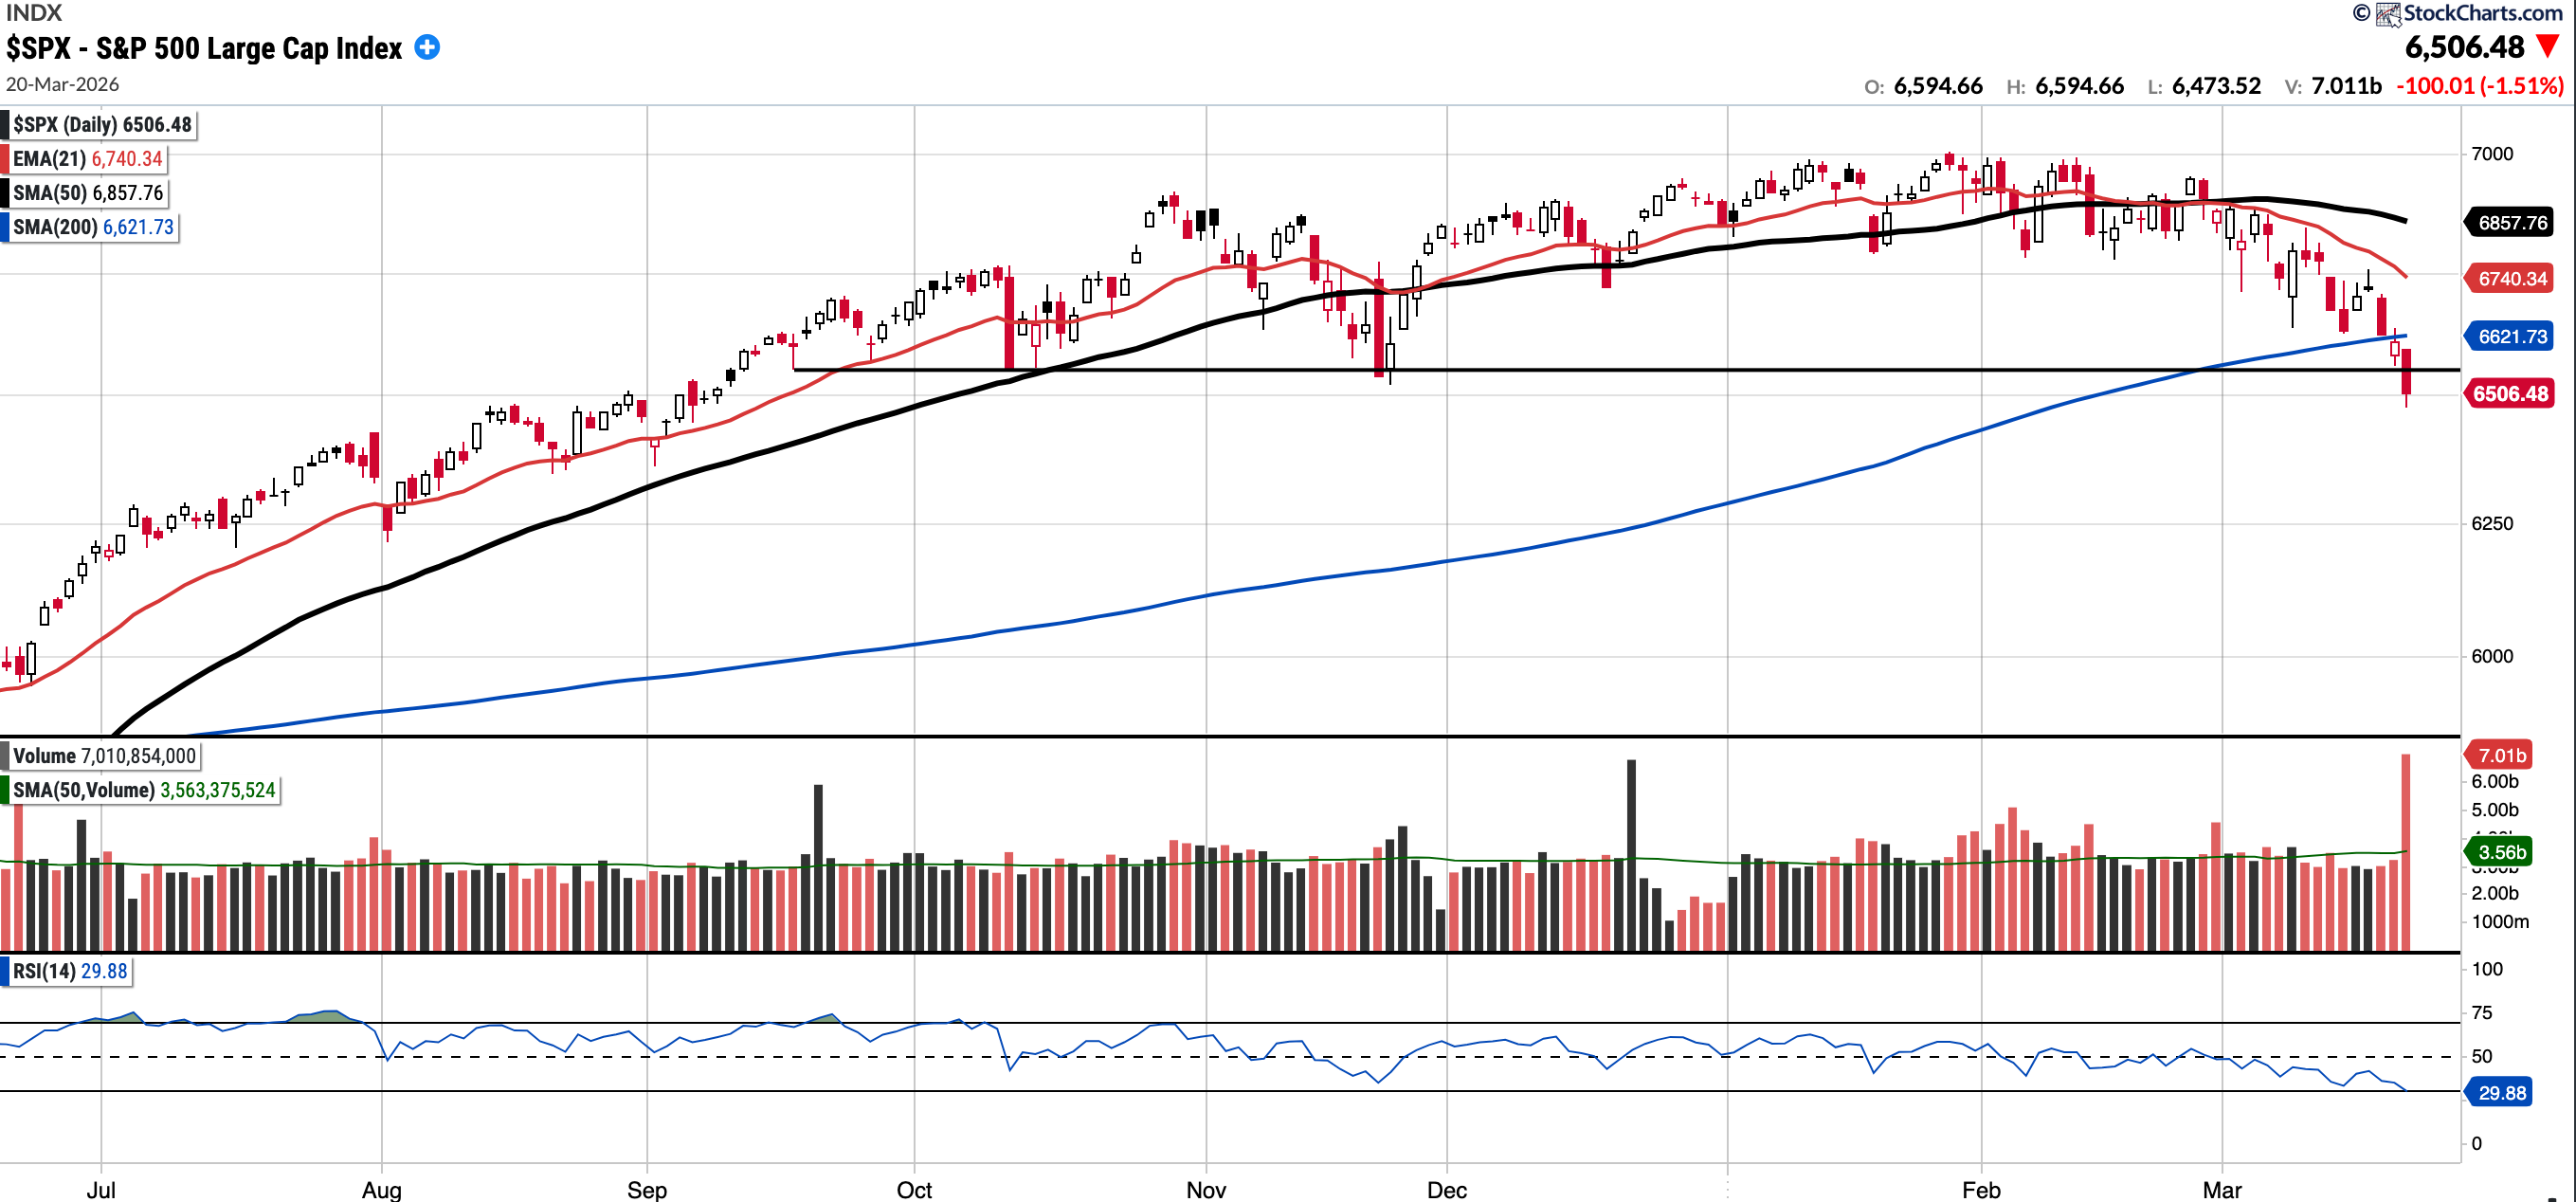
SPX
Currently trades at 6,506.48, 5.12% below the 50SMA and 1.74% below the 200SMA.
RSI 29.88
-5.13% YTD
Distribution days in the last week: 3
There were three distribution days this week, which follows last week where there were also three sessions in total where the index was down more than 0.2%. The SPX remains firmly below all key moving averages now.
Last week I said:
“I suspect we will retest the 6550–6580 level, likely as soon as Monday, which represents the Oct/Nov support and the 200-day SMA. For bulls, this is a very important level to hold.”
That level was finally breached on Friday and so becomes an important level to pay attention to. Furthermore, as nothing good happens below the 200-day moving average, bulls would want that to be reclaimed sooner rather than later.
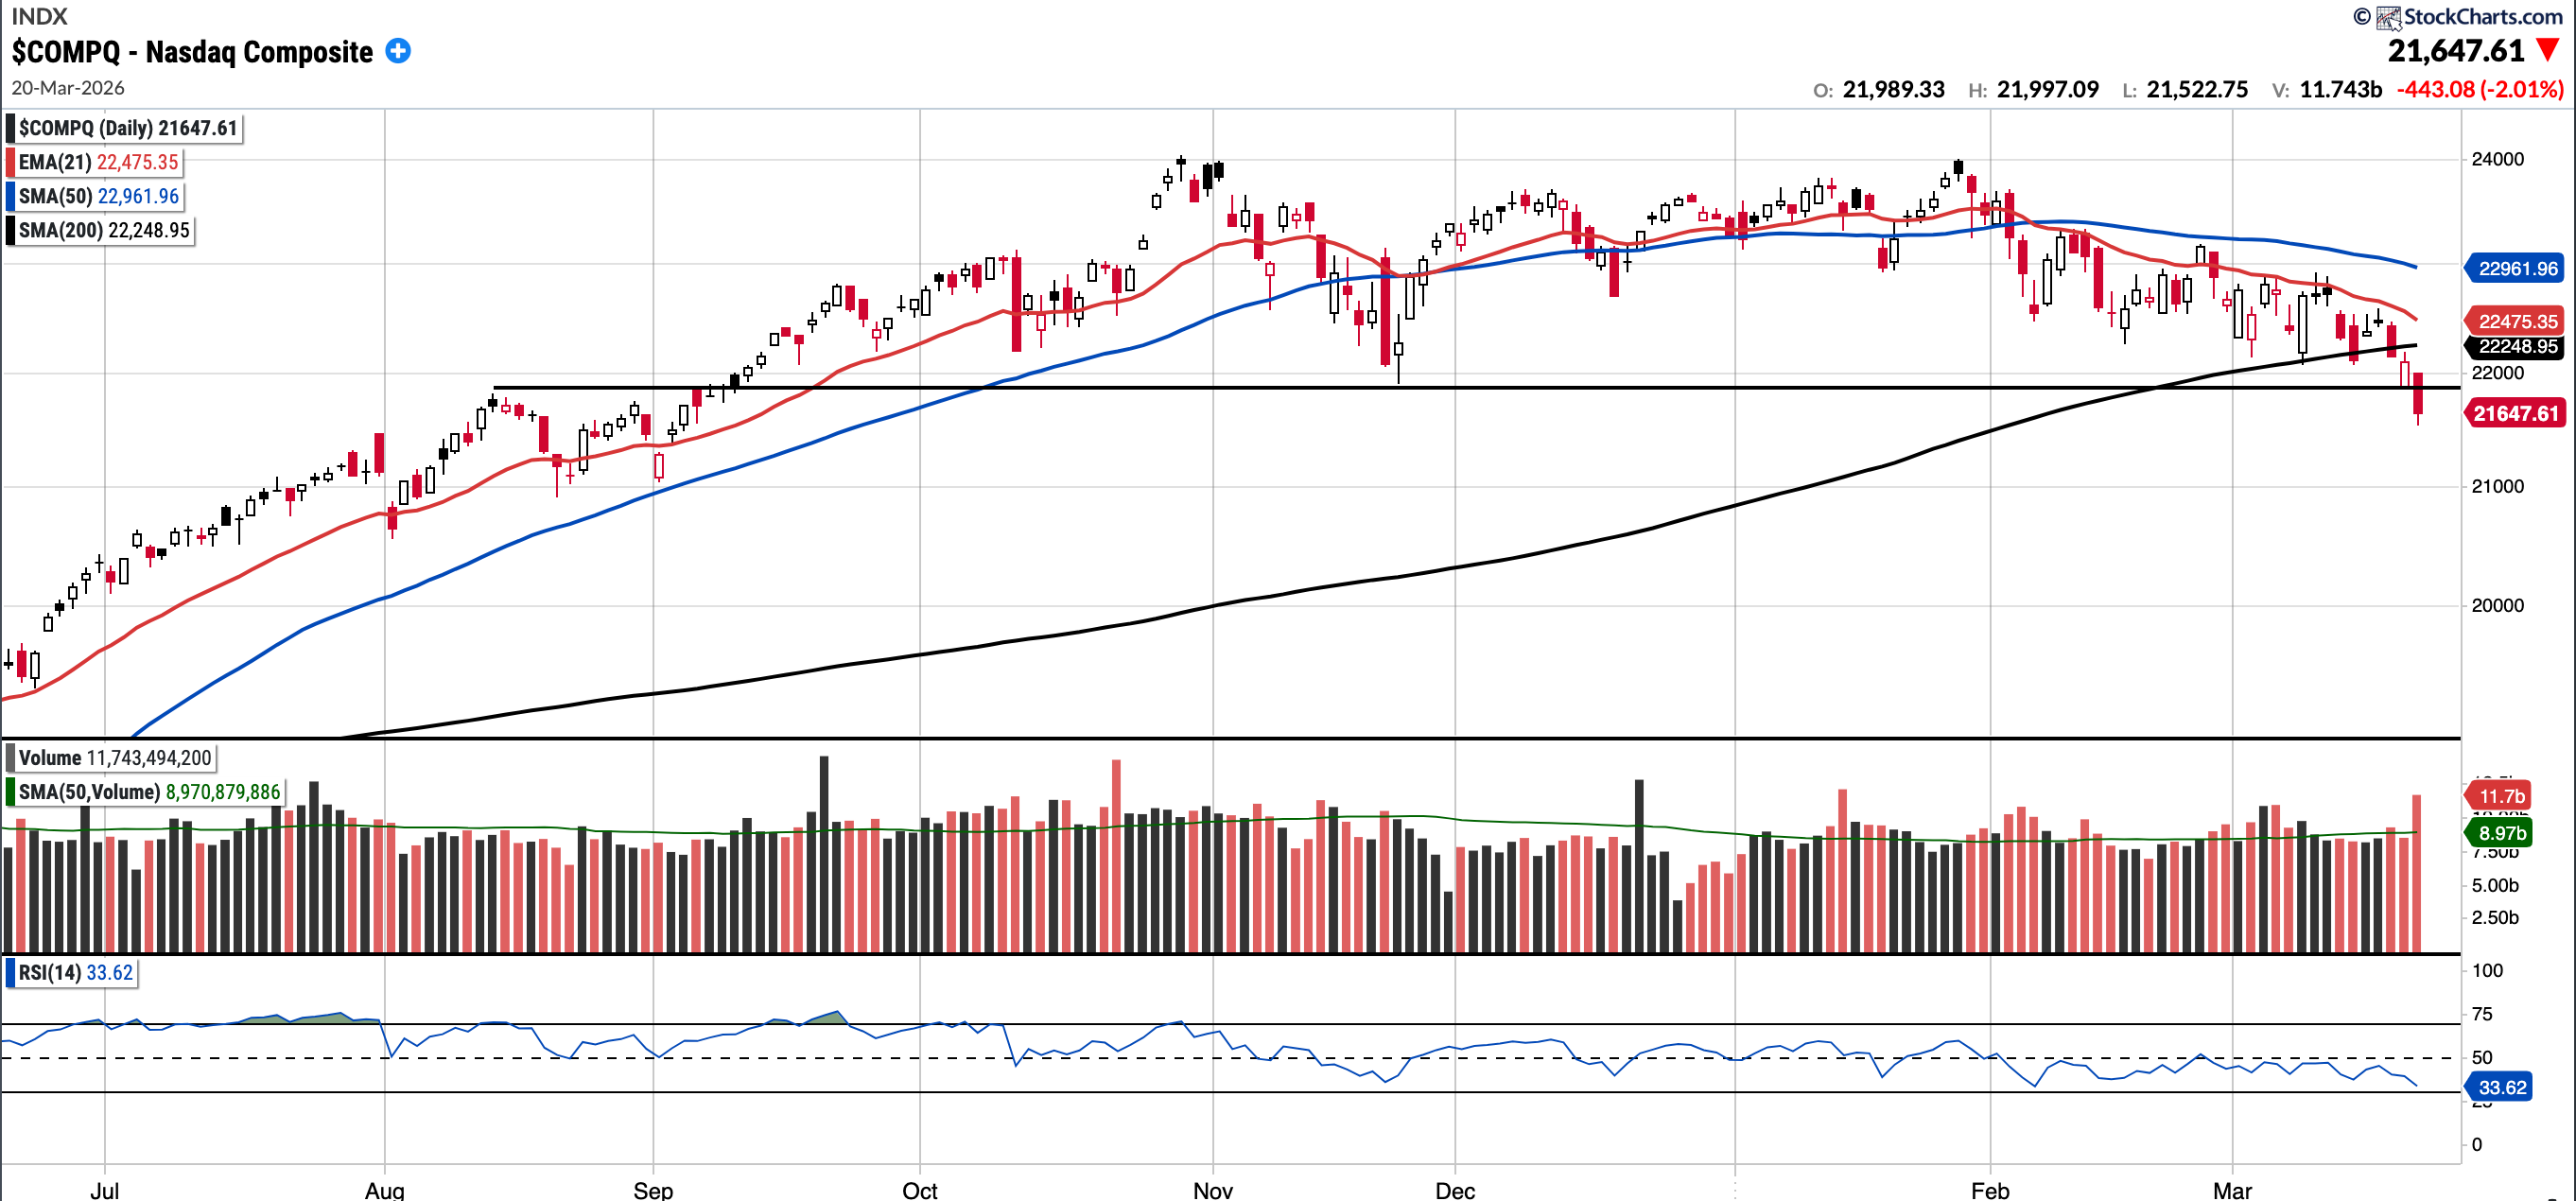
COMPQ
Currently trades at 21,647.61, 5.72% below the 50SMA and 2.7% below the 200SMA.
RSI 33.62
-6.83% YTD
Distribution days in the last week: 1
There were two distribution days this week but three days where the index was down days down 0.2% or more. The Nasdaq Composite remains firmly below all key moving averages.
Last week I stated:
“Downturn probability remains quite high. The 200-day SMA is also within touching distance below. We are now below the 200-day SMA, and the next level of note is 21,850, which served as the November low and also the August high. Bulls would want this level to hold and for the 200-day SMA to be reclaimed. Caution is advised”
We broke the 21,850 level comfortably on Friday with above-average volume, and now with distribution days stacking up, caution is still warranted.
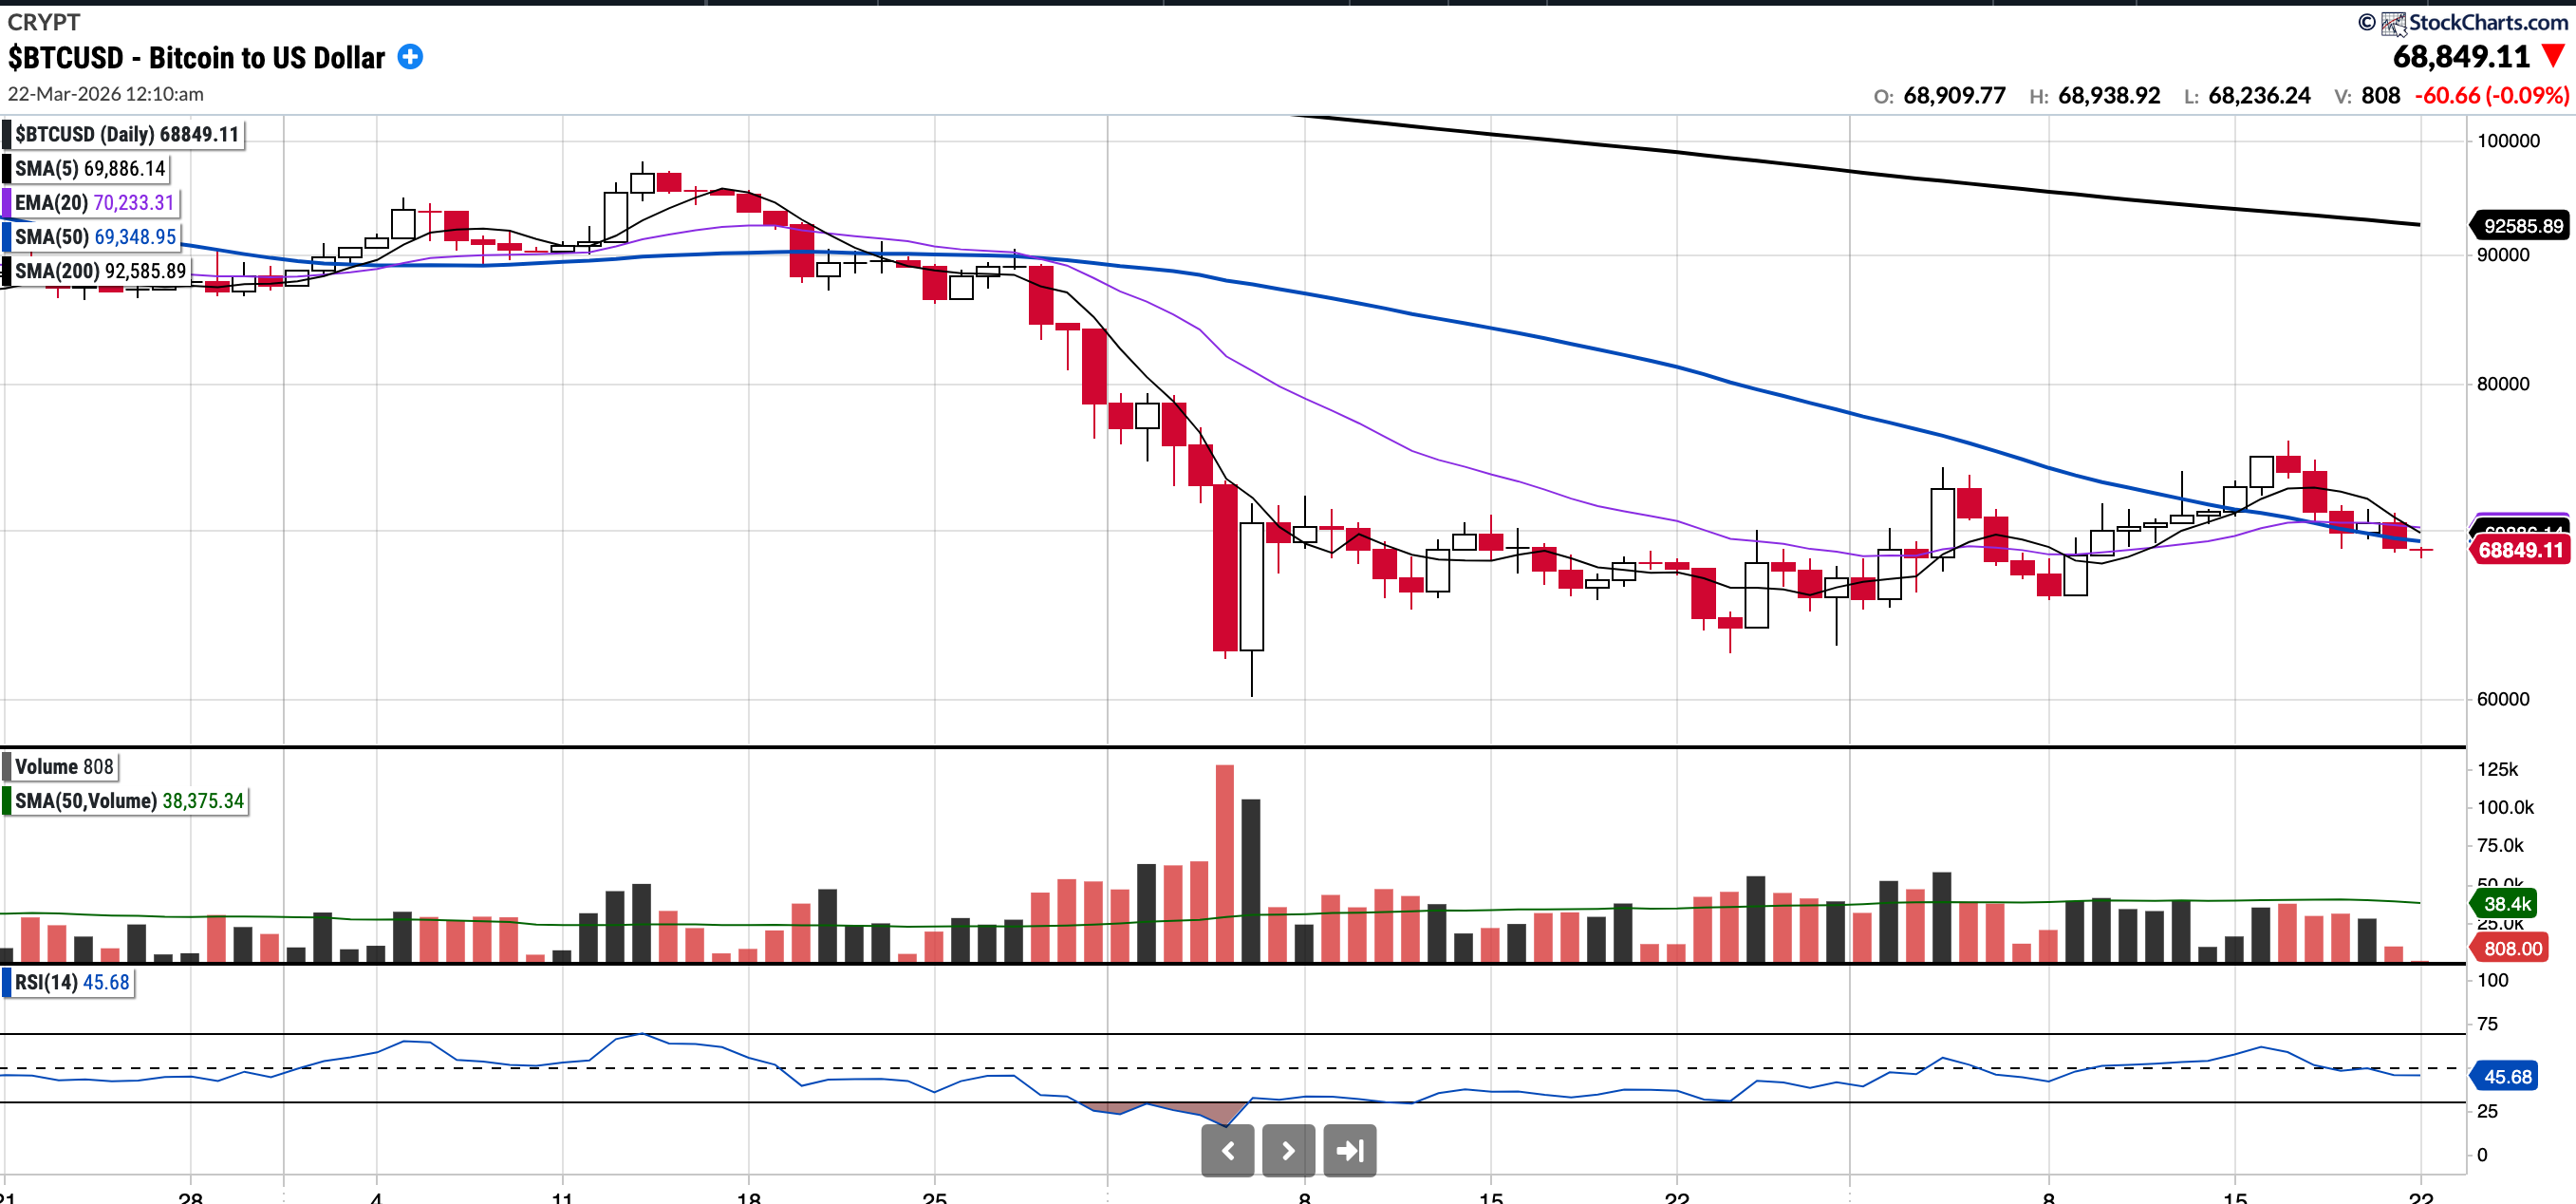
BTC (currently Long)
Currently trades at $68,849.11, 0.72% below the 50SMA and 25.64% below the 200SMA.
RSI 45.68
-22.3% YTD.
Since testing the 200-week moving average on Thursday, February 5th, Bitcoin has traded primarily within the $63,000–$70,000 range.
In March, BTC has exhibited some strength recently, putting together a string of 8 green days in a row and trading as high as $76,000 for a moment, though it is again some way off those levels. $74,000 remains an important resistance level.
As of Sunday 00:20 GMT, BTC has lost all key MAs after a steep decline in the last few minutes (liquidation of levered longs post a Trump tweet). So, we remain in a position where significant technical work is required before the chart looks constructive.
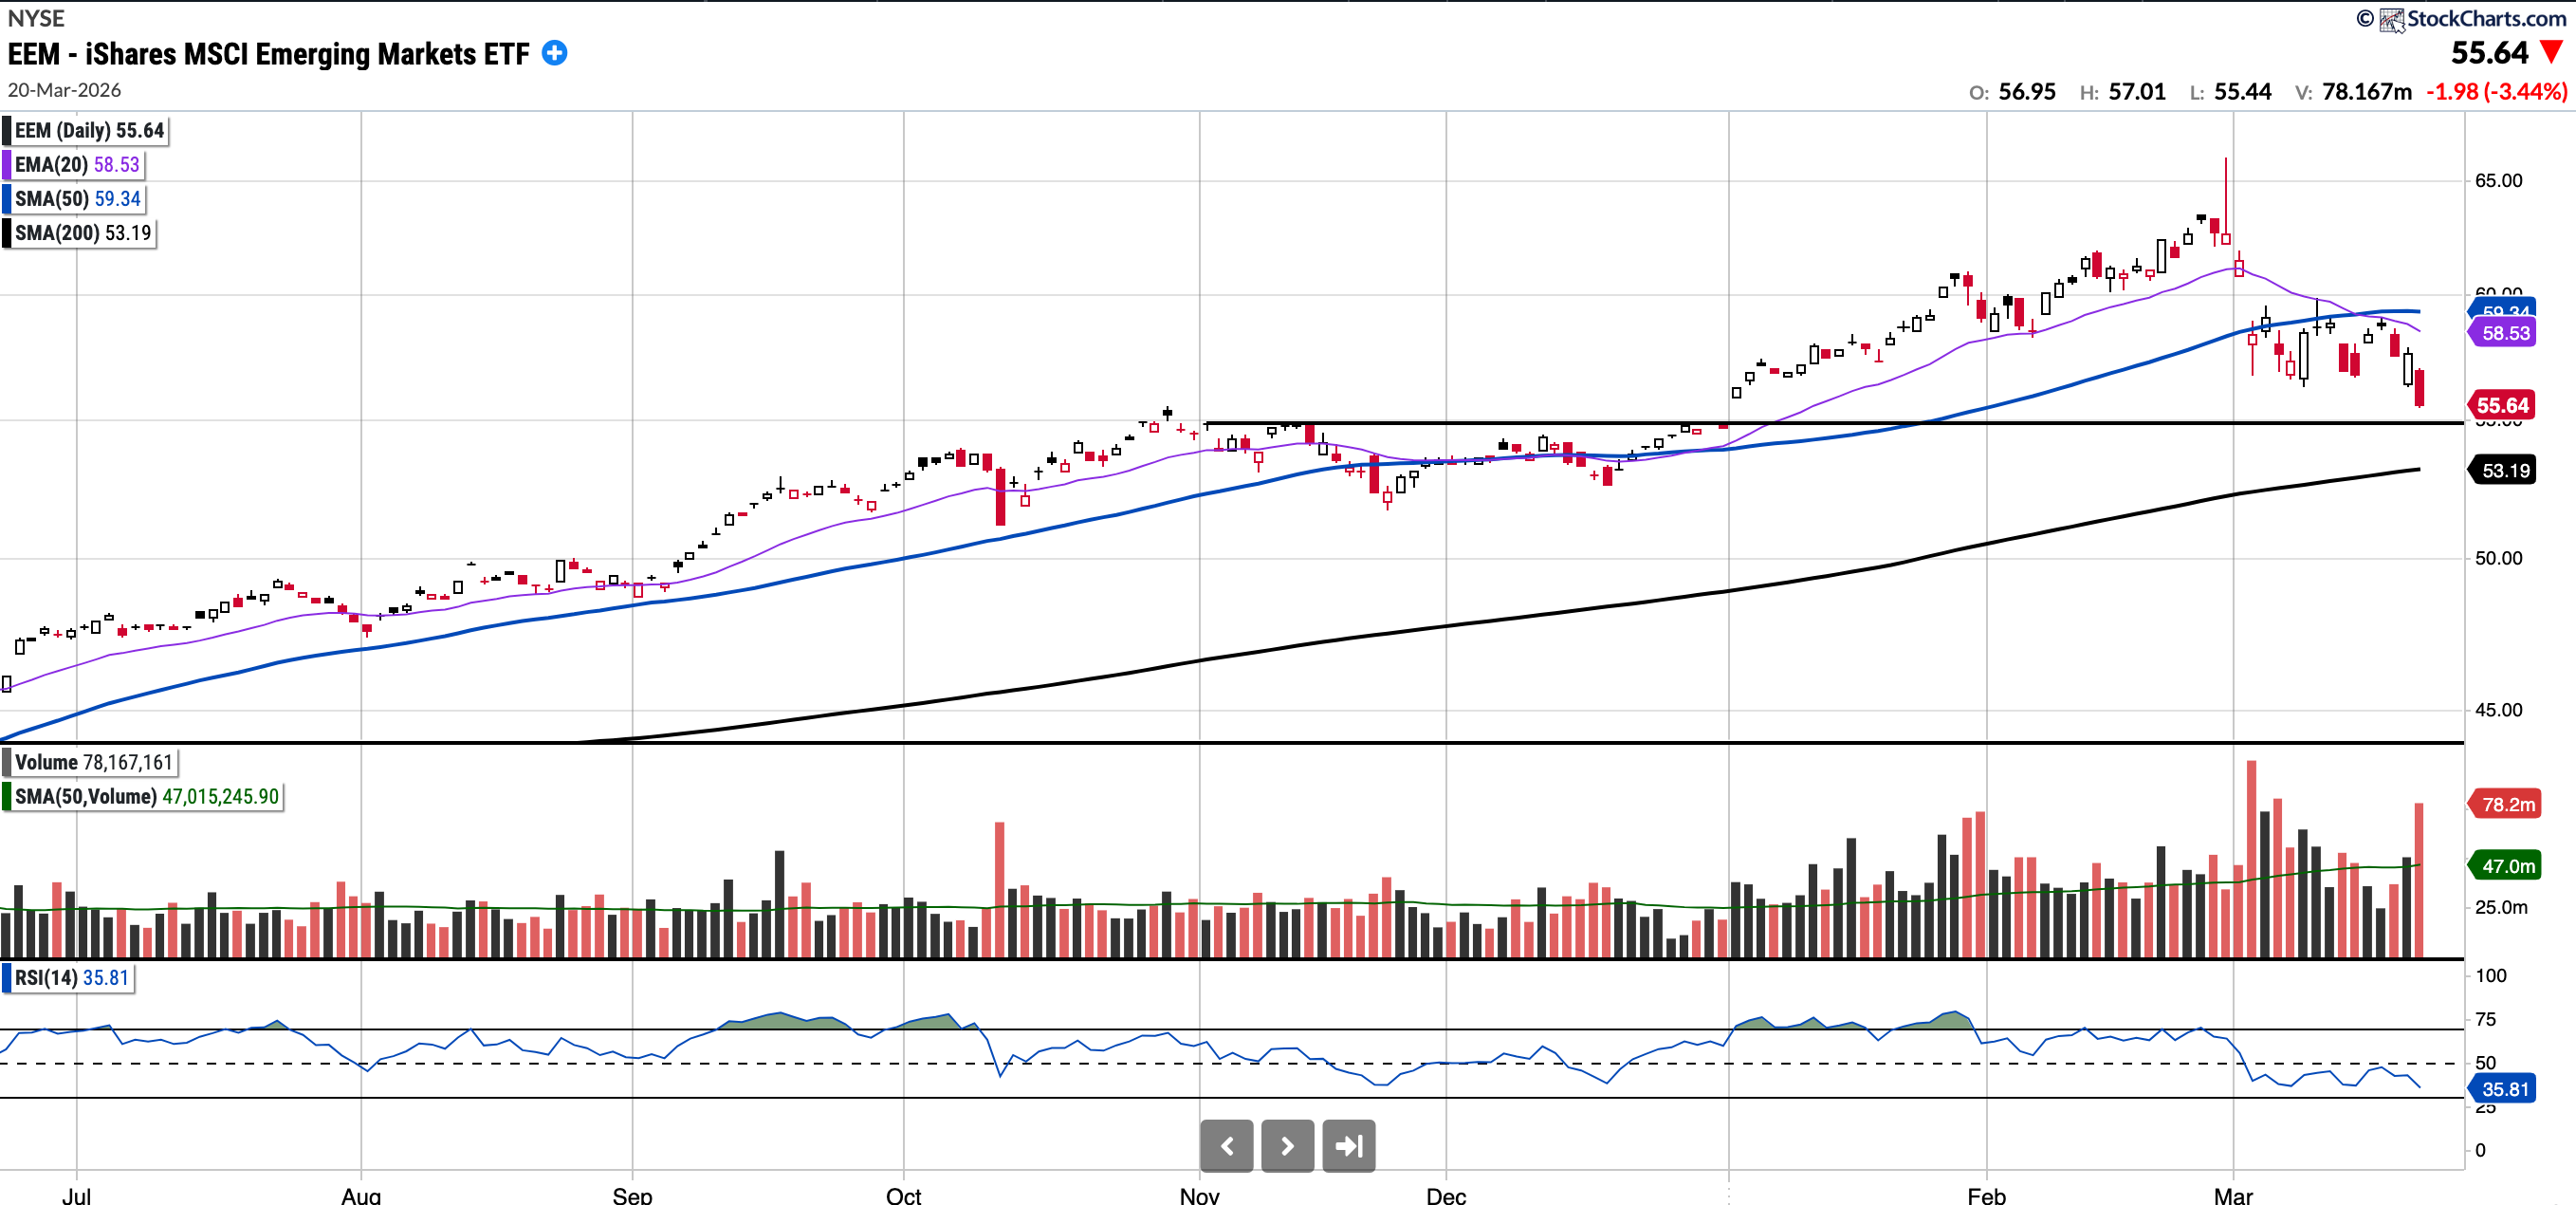
EEM
Currently trades at $55.64, 6.24% below the 50SMA and 4.6% above the 200SMA
RSI 35.81
1.07% YTD
$EEM continues to outperform the U.S. indices comfortably year-to-date, but it has pulled back sharply over the last couple of weeks amid events in the Middle East. It remains in an uptrend; however, the levels to watch for pullback buys are $55.00 and, below that, the ascending 200-day SMA at $52.58. I suspect these levels may be tested soon.
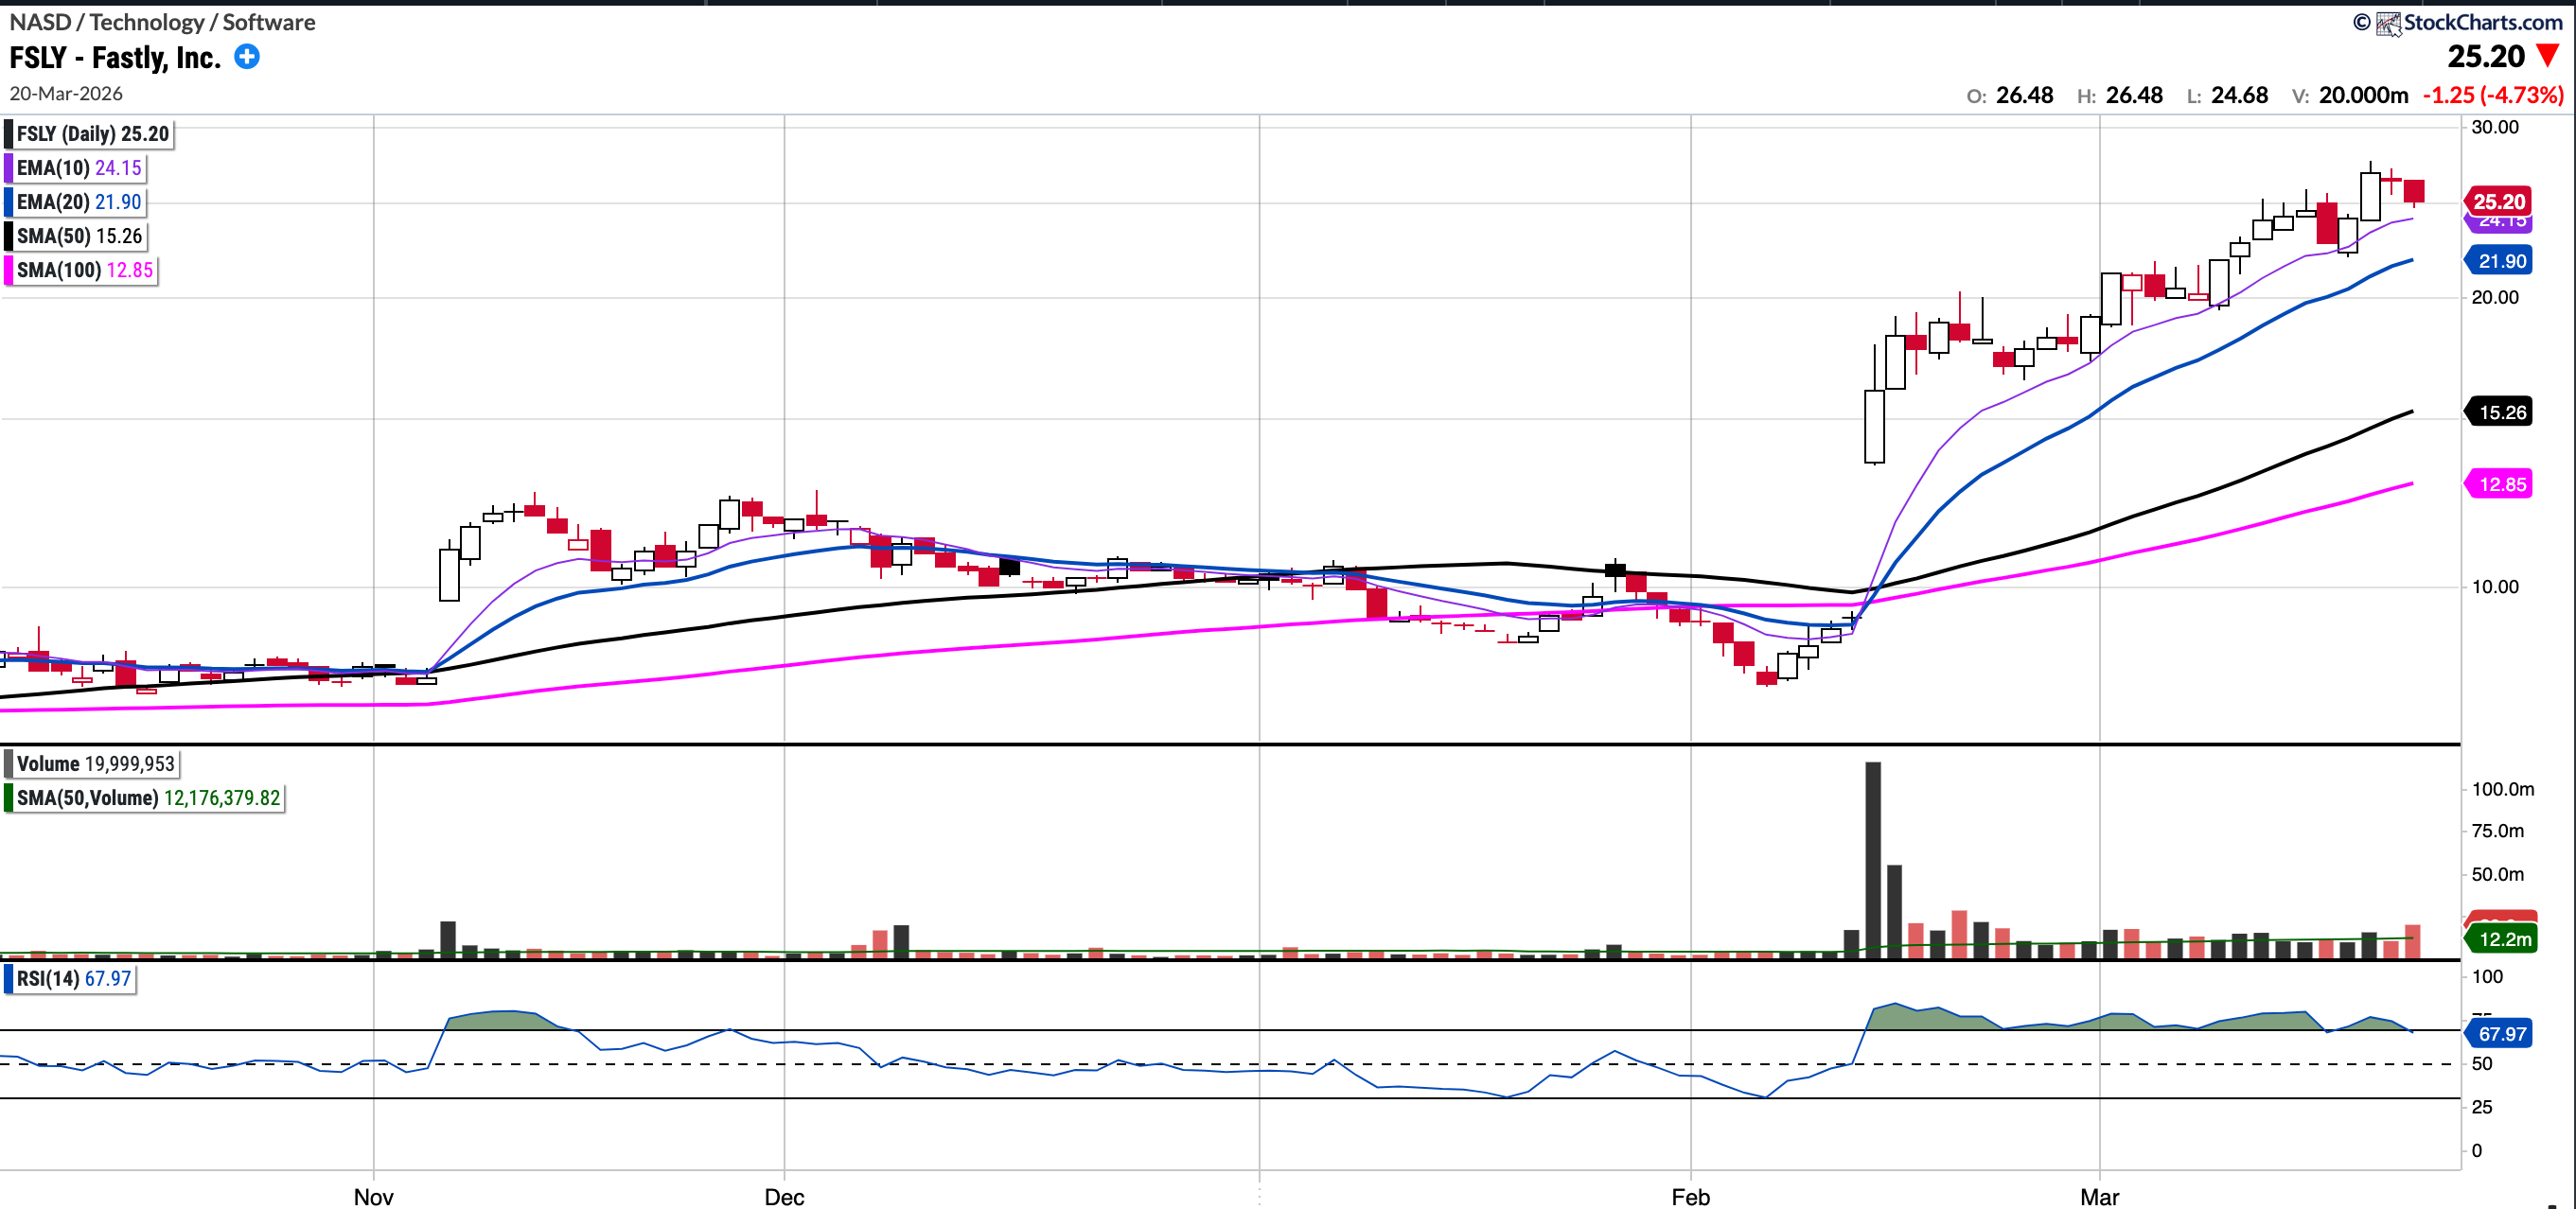
FSLY (currently Long, Trading)
Currently trades at $25.2, 65.1% above the 50SMA and 147.06% above the 200SMA.
RSI 67.97
147.3% YTD.
I featured FSLY initially at 17, and it is up >40% since then. I ultimately did not get positioned that low but have put on a position more recently plus booked a little profits close to $27. Whilst it is undoubtedly extended in the near term, the strength it has shown proves it is a leading stock in the market right now. A close below the EMA 20 (and arguably even the EMA 10) would be a character change; until then, it remains a long.
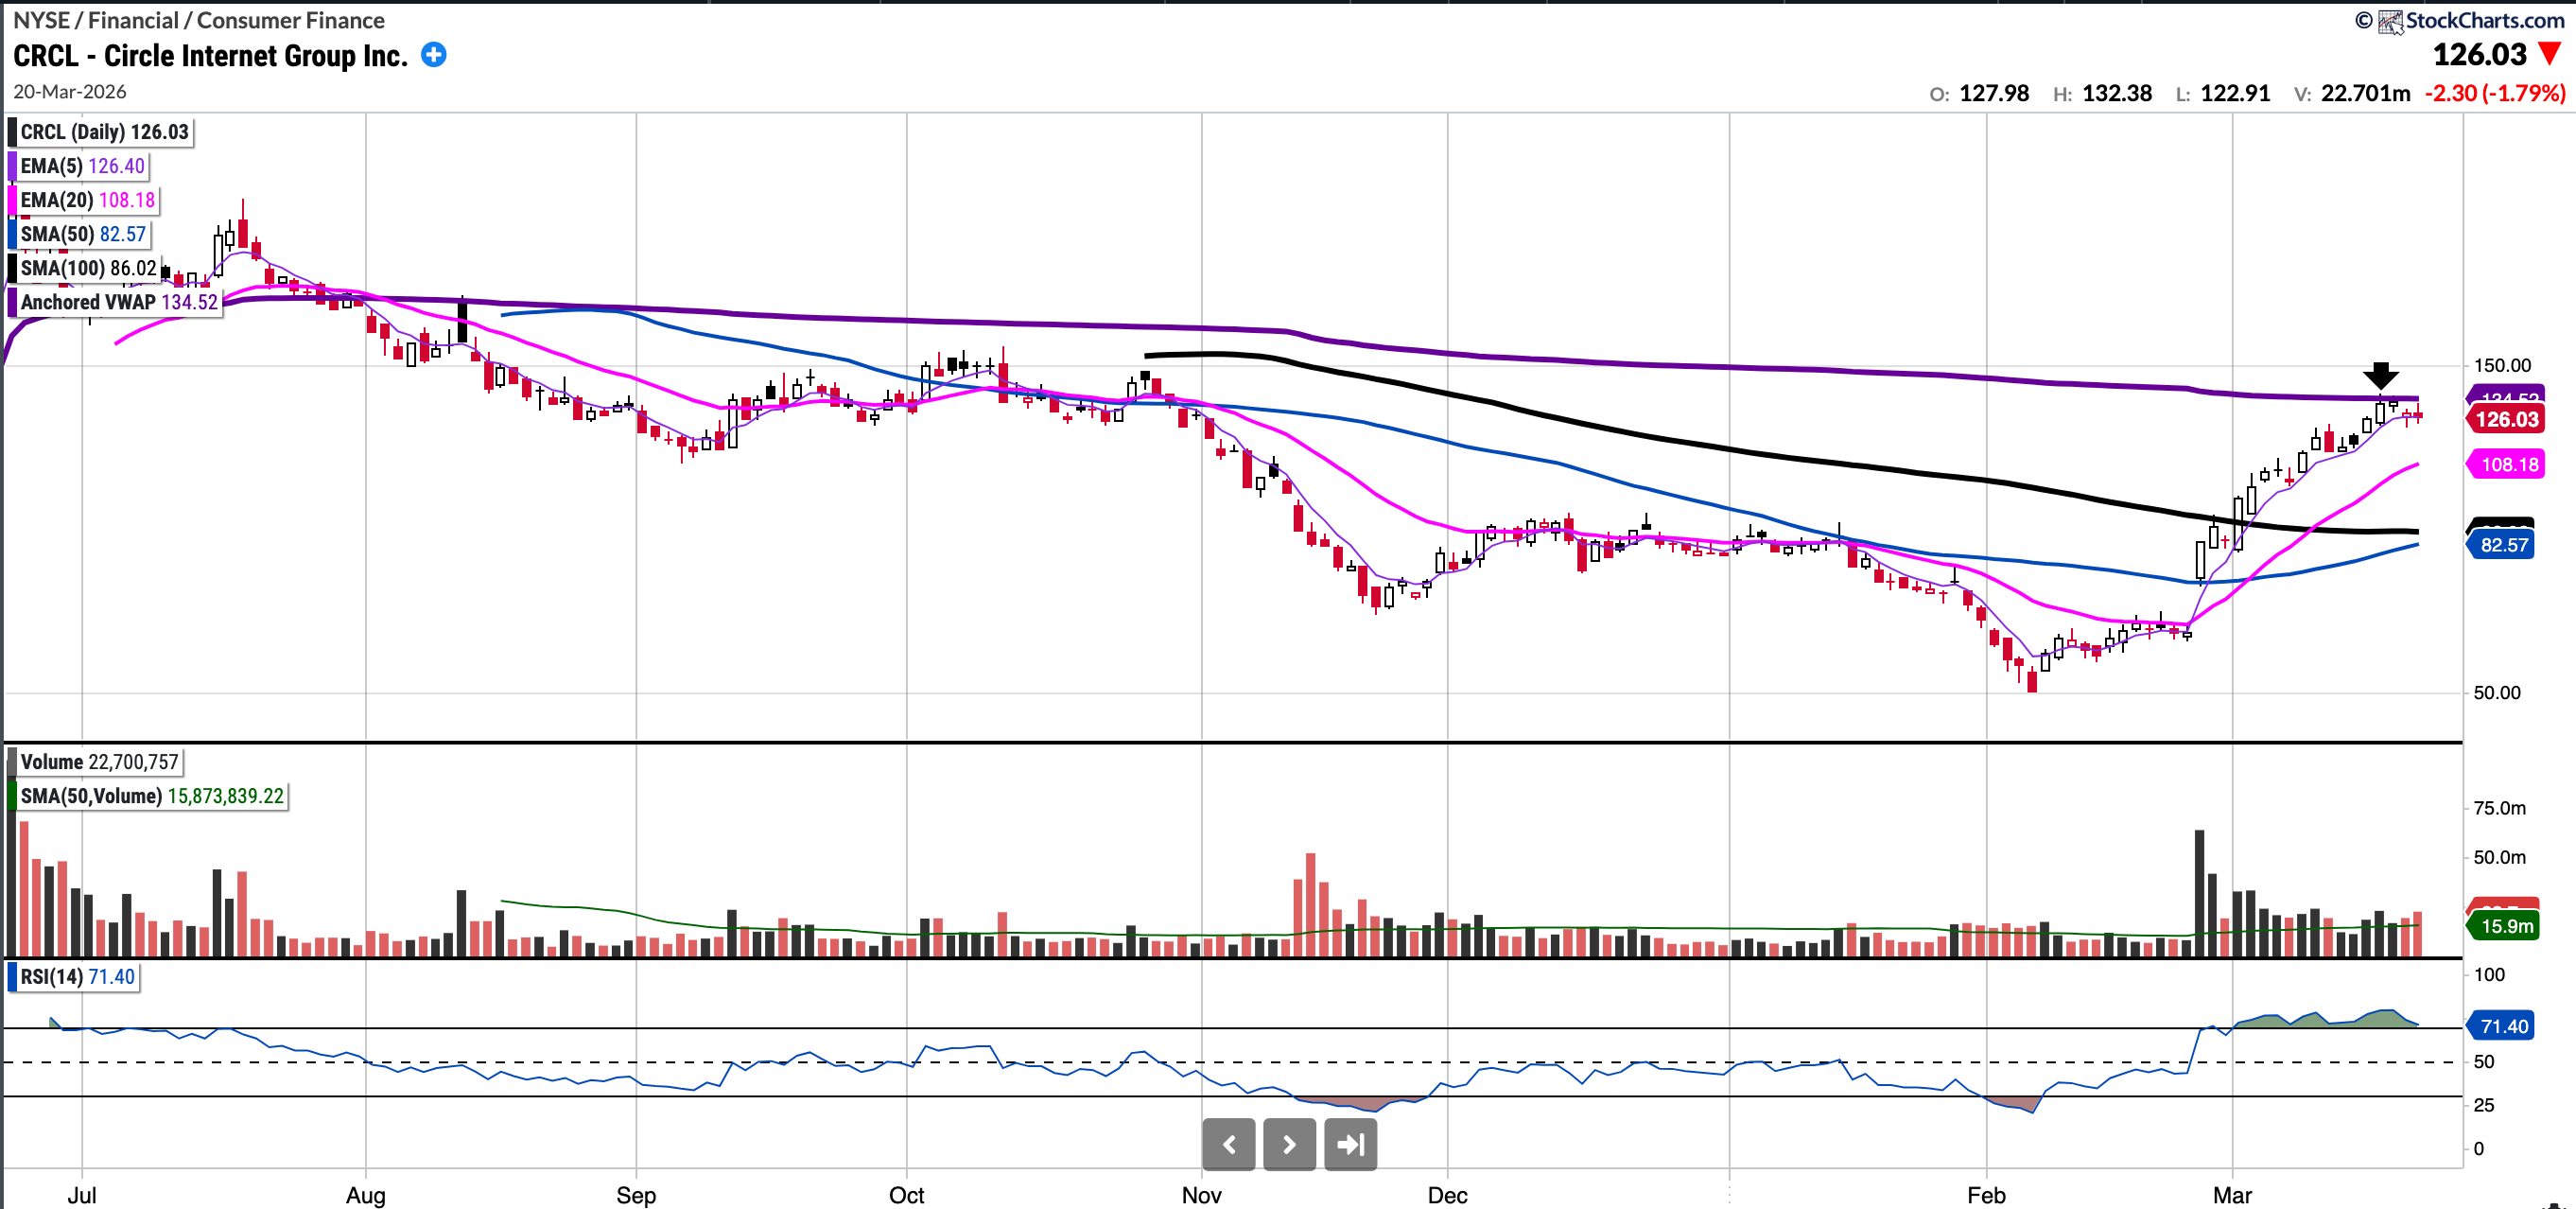
CRCL
Currently trades at $126.03, 52.64% above the 50SMA
RSI 73.37
50.99% YTD
$CRCL has surged ~100% over the past month, demonstrating tremendous strength despite broader market weakness. In my view, the stock is being recognised as a beneficiary of the current inflationary environment (as rate cuts are negative for Circle’s business model), a potential pure play on ‘agentic money’ and is being rewarded for its impressive earnings beats.
The stock is currently trading above all key moving averages and has been riding the 5SMA on its recent rise. Notably, it has not even tested the 10EMA on this run-up, which shows just how strong it has been.
Last week I stated: “The $135 level, which represents the AVWAP from its IPO, will be a significant technical level that may act as resistance”
We can see as per the arrow on the chart, CRCL found resistance almost to the penny at the AVWAP, which is not a coincidence.
That being said, one would expect that to flip if it continues to show strength. One to have on the watchlist.
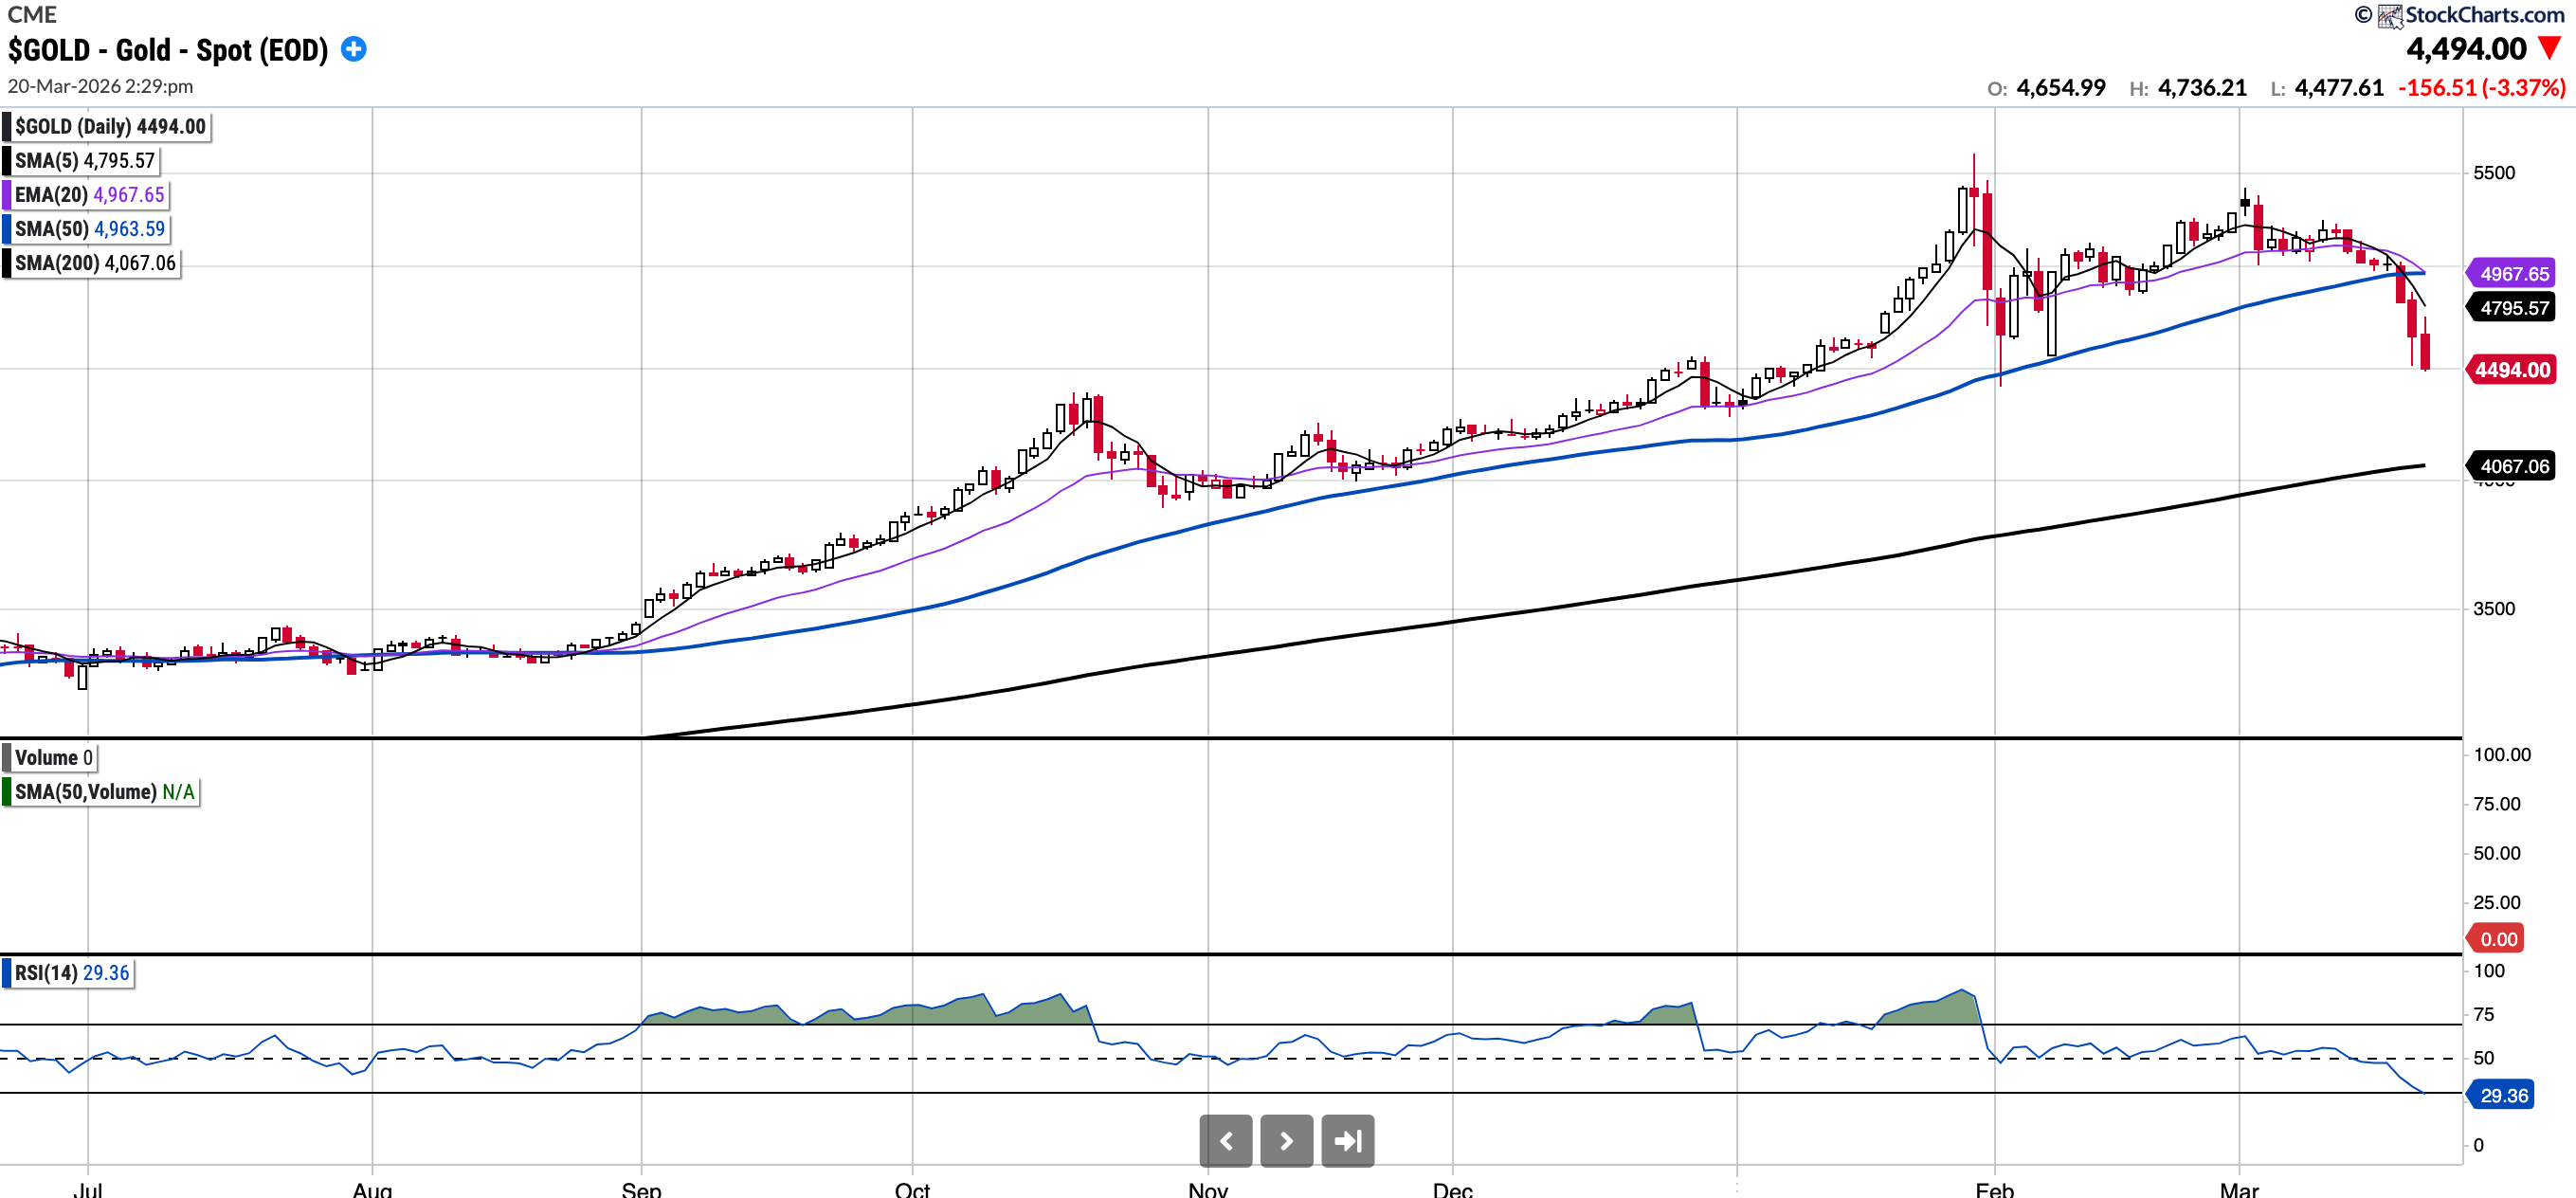
GOLD (Long Physical)
Currently trades at $4494, 9.46% below the 50SMA and 10.5% above the 200SMA
RSI 29.36
3.96% YTD
Gold has been showing weakness amidst the geopolitical uncertainty, which has surprised some. As of Friday's close, it is down 10.52% over the last five days and is below both the EMA 20 and SMA 50. The SMA 200 is below at 4,067, which will be an interesting level to watch.
Notable portfolio changes in previous week (all updated live in subscriber channels):
