
Preview of the Week Ahead: W/C March 30, 2026
6,400 Support Broken: What’s Next?

Hope you all are having a good weekend. Below, we will be previewing the upcoming week’s events and providing a portfolio update as usual.
Format for what is covered in this weekly preview:
A Look at the Indices
Key Upcoming Economic Events
Upcoming Earnings Reports
Charts
Notable Portfolio Changes from the Previous Week
Current Portfolio Holdings
Position size, cost basis, and commentary on each holding regarding the intended holding period and any planned activity
Closing Thoughts

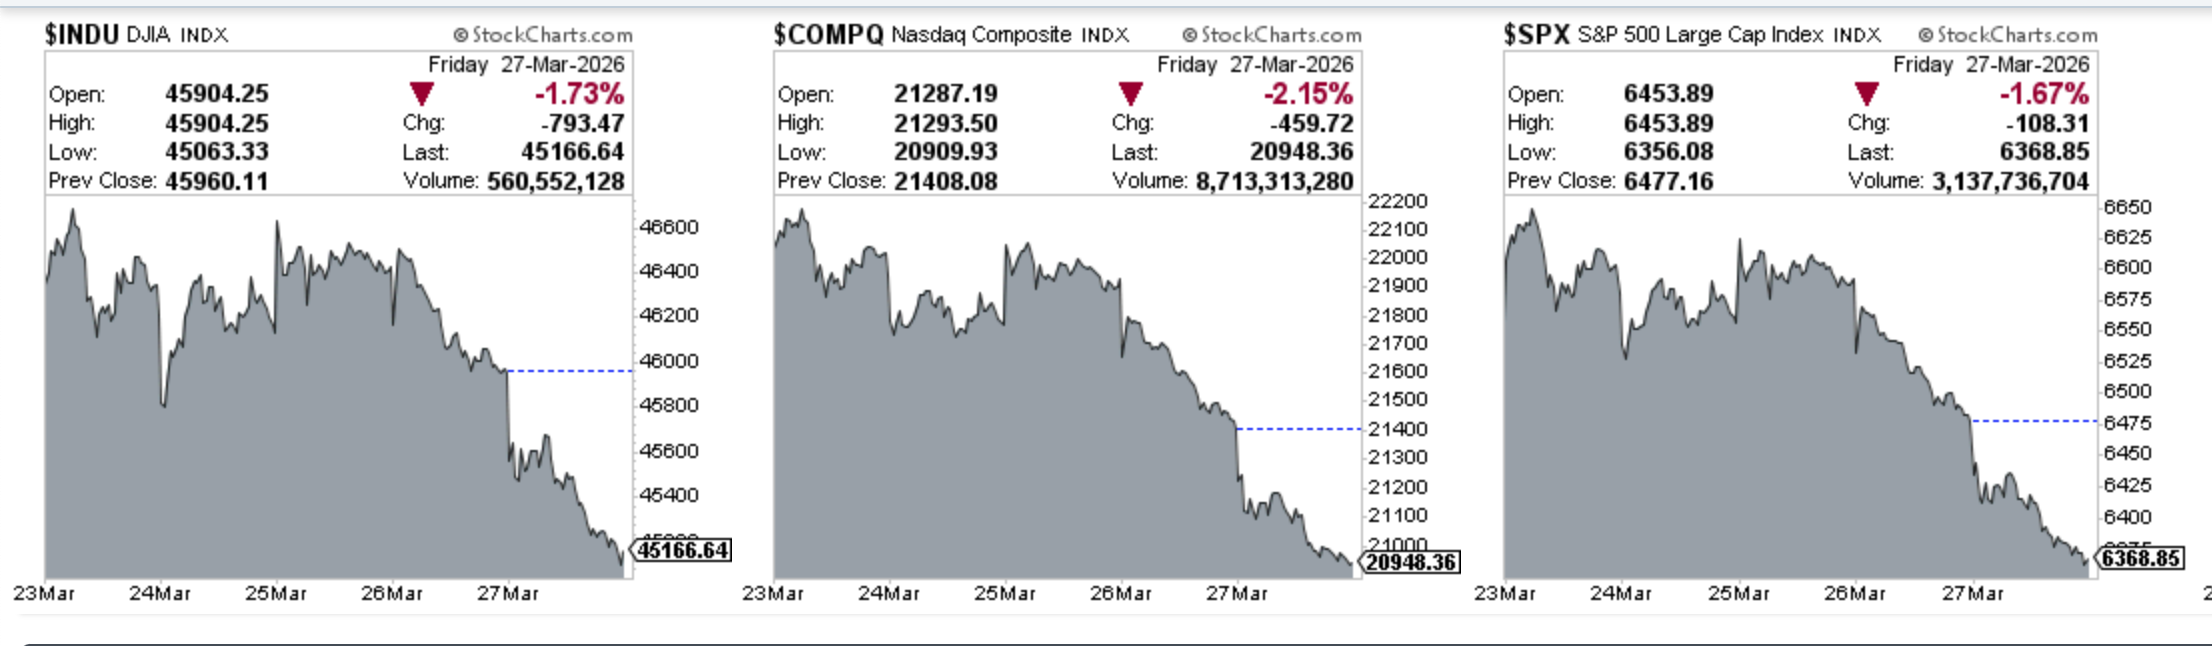
Indices
Dow Jones declined 2.31% in the last week
S&P 500 declined 3.39% in the last week
Nasdaq Composite declined 4.71% in the last week
IWM declined 1.34% in the last week
Key upcoming economic events
Monday, March 30
Dallas Fed Manufacturing Index (March)
Speech by Fed Chair Jerome Powell
Speech by John Williams (NY Fed President)
Tuesday, March 31
S&P CoreLogic Case-Shiller Home Price Index:
Tracks monthly changes in the value of residential real estate in 20 metropolitan areas.
JOLTS Job Openings (February):
Markets are watching for a further cooling toward the 6.85 million level.
Chicago PMI (March):
Manufacturing health in the Midwest.
Consumer Confidence (CB)
Wednesday, April 1
ADP Non-Farm Employment Change
ISM Manufacturing PMI (March):
Markets are looking to see if the recent expansion continues despite higher energy costs.
ISM Manufacturing Prices:
Are input costs continuing to spike due to Middle East tensions?
Construction Spending
Thursday, April 2
Weekly Initial Jobless Claims
U.S. Trade Balance:
Difference between the value of exported and imported goods and services.
Friday, April 3 (Good Friday - Markets Closed)
Non-Farm Employment Change (March Jobs Report):
Expectations are for a recovery of ~48k–50k jobs following the decline in February.
Unemployment Rate: Forecast to edge up slightly toward 4.5%.
Average Hourly Earnings: Markets expect a 0.4% M/M increase
ISM Services PMI (March):
Measures Services sector health, which has recently shown signs of softening to an 11-month low.
Upcoming Earnings
The schedule for this week is below. This week is a light one though I do have one portfolio company reporting. Below is the infographic by Earnings Whispers:

Charts
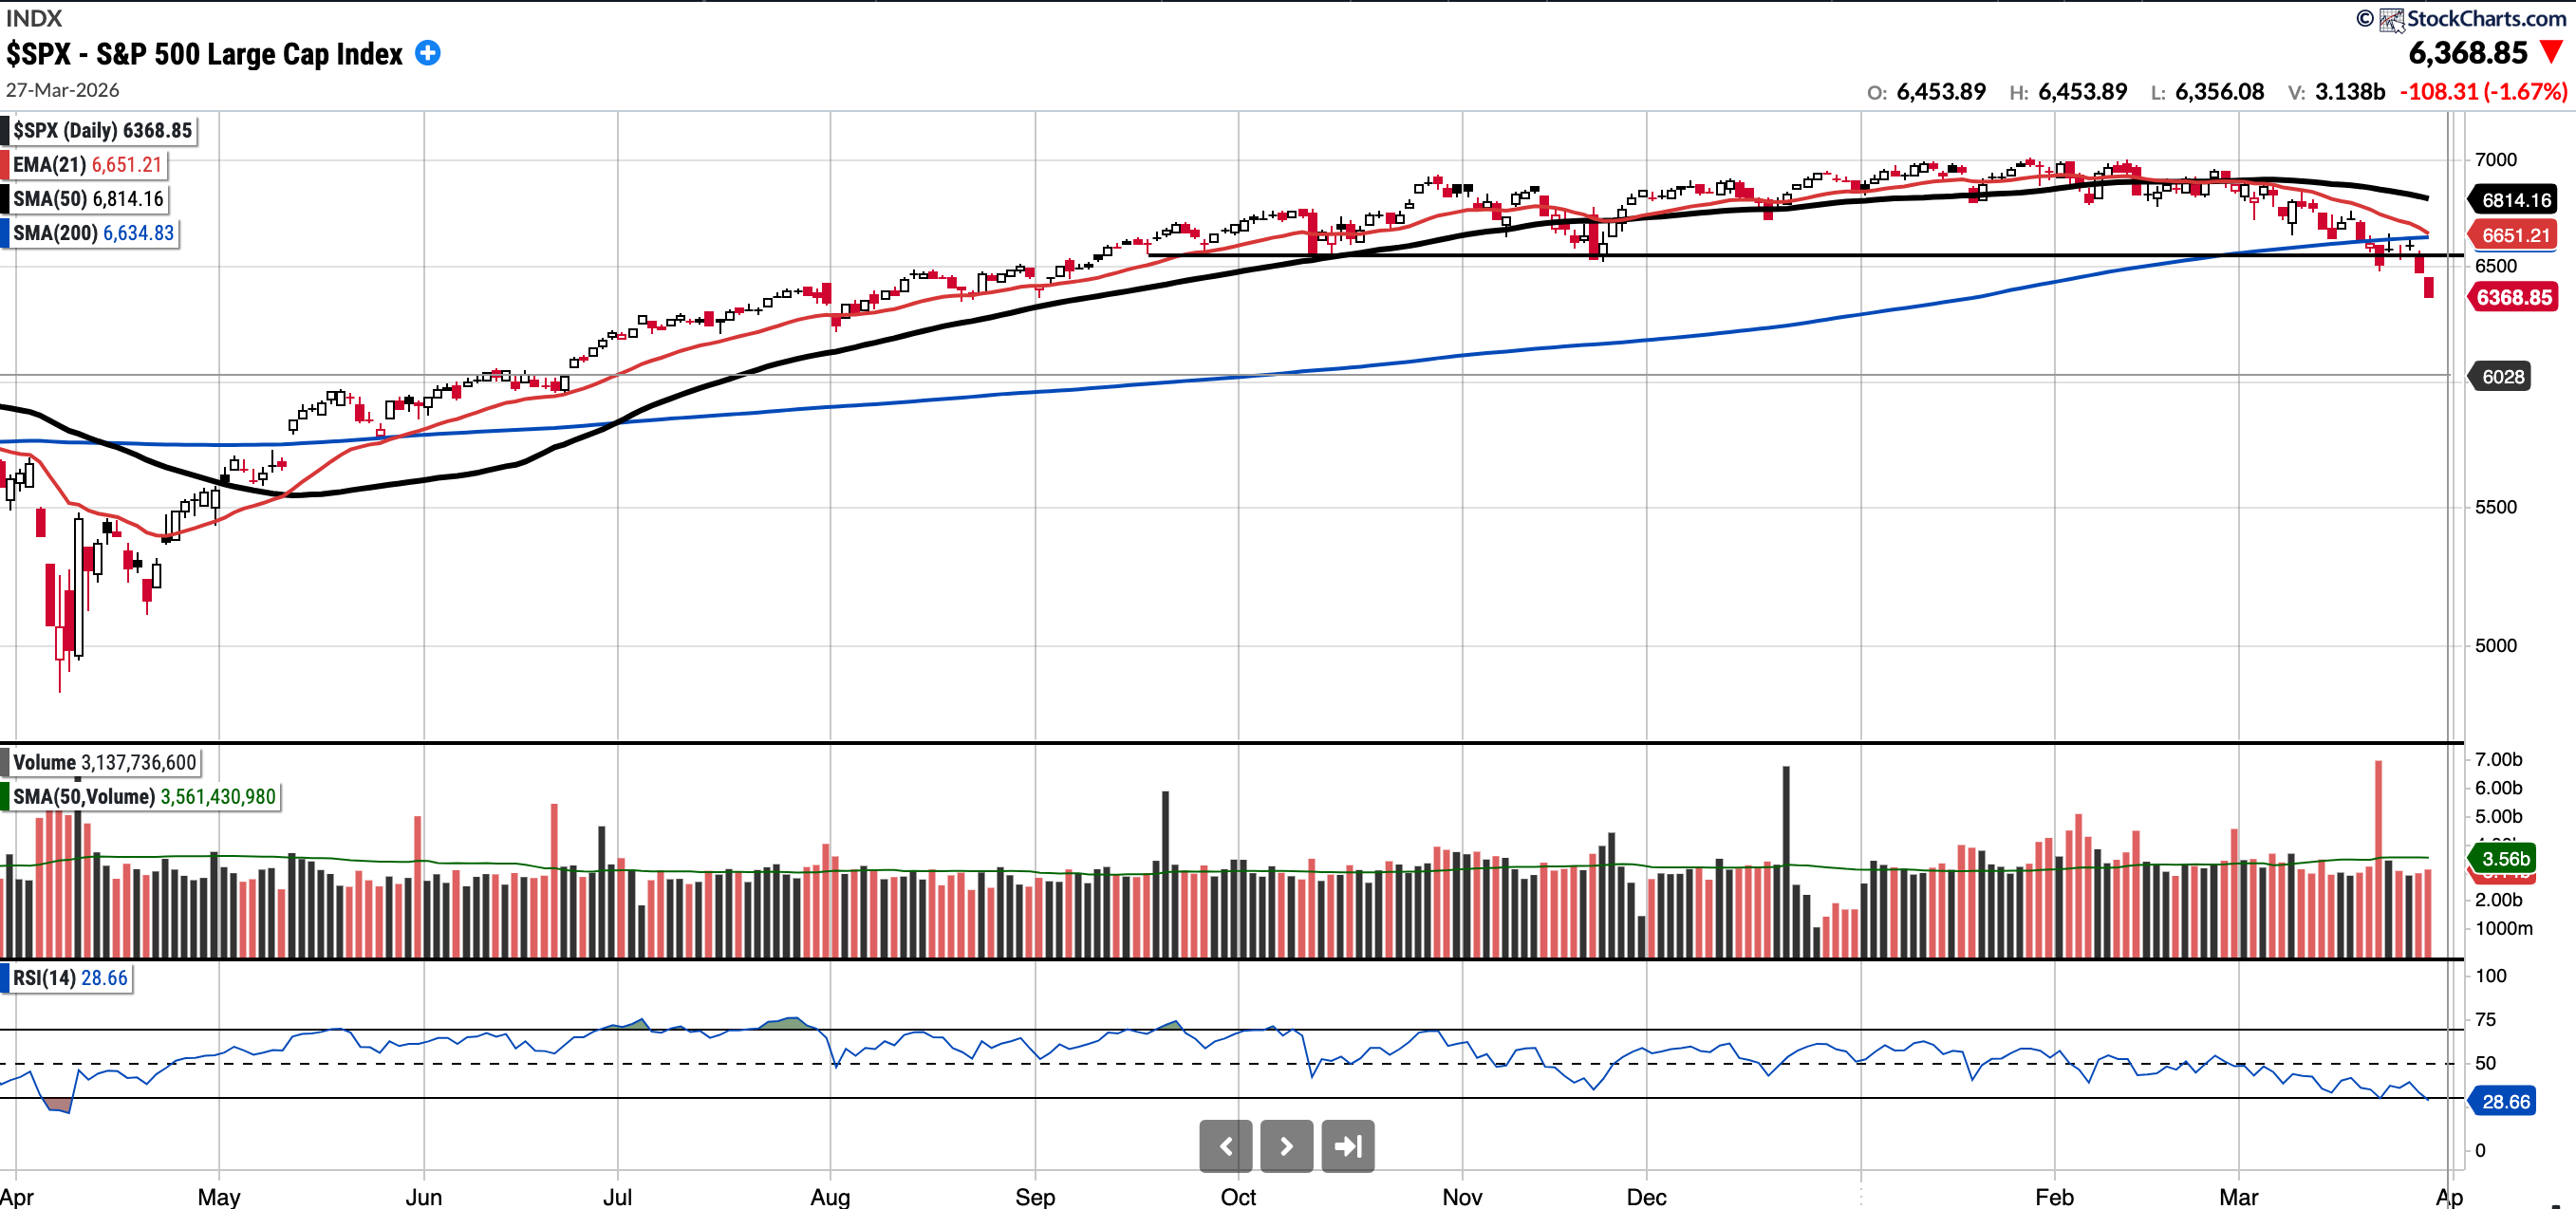
SPX
Currently trades at 6,368.85, 6.54% below the 50SMA and 4.01% below the 200SMA.
RSI 28.66
-7.14% YTD
Distribution days in the last week: 2
There were two distribution days this week, which follows last week where there were three distribution days. The SPX remains firmly below all key moving averages now.
The 6520 support level was breached last Friday, followed by a new pre-market low of 6400 on Monday. While that level held for most of the week, it was ultimately lost this past Friday. The next downside target in play is 6050. To the upside, bulls need to see 6500 and the 200-day SMA reclaimed; until then, the probability of a further downturn remains high.
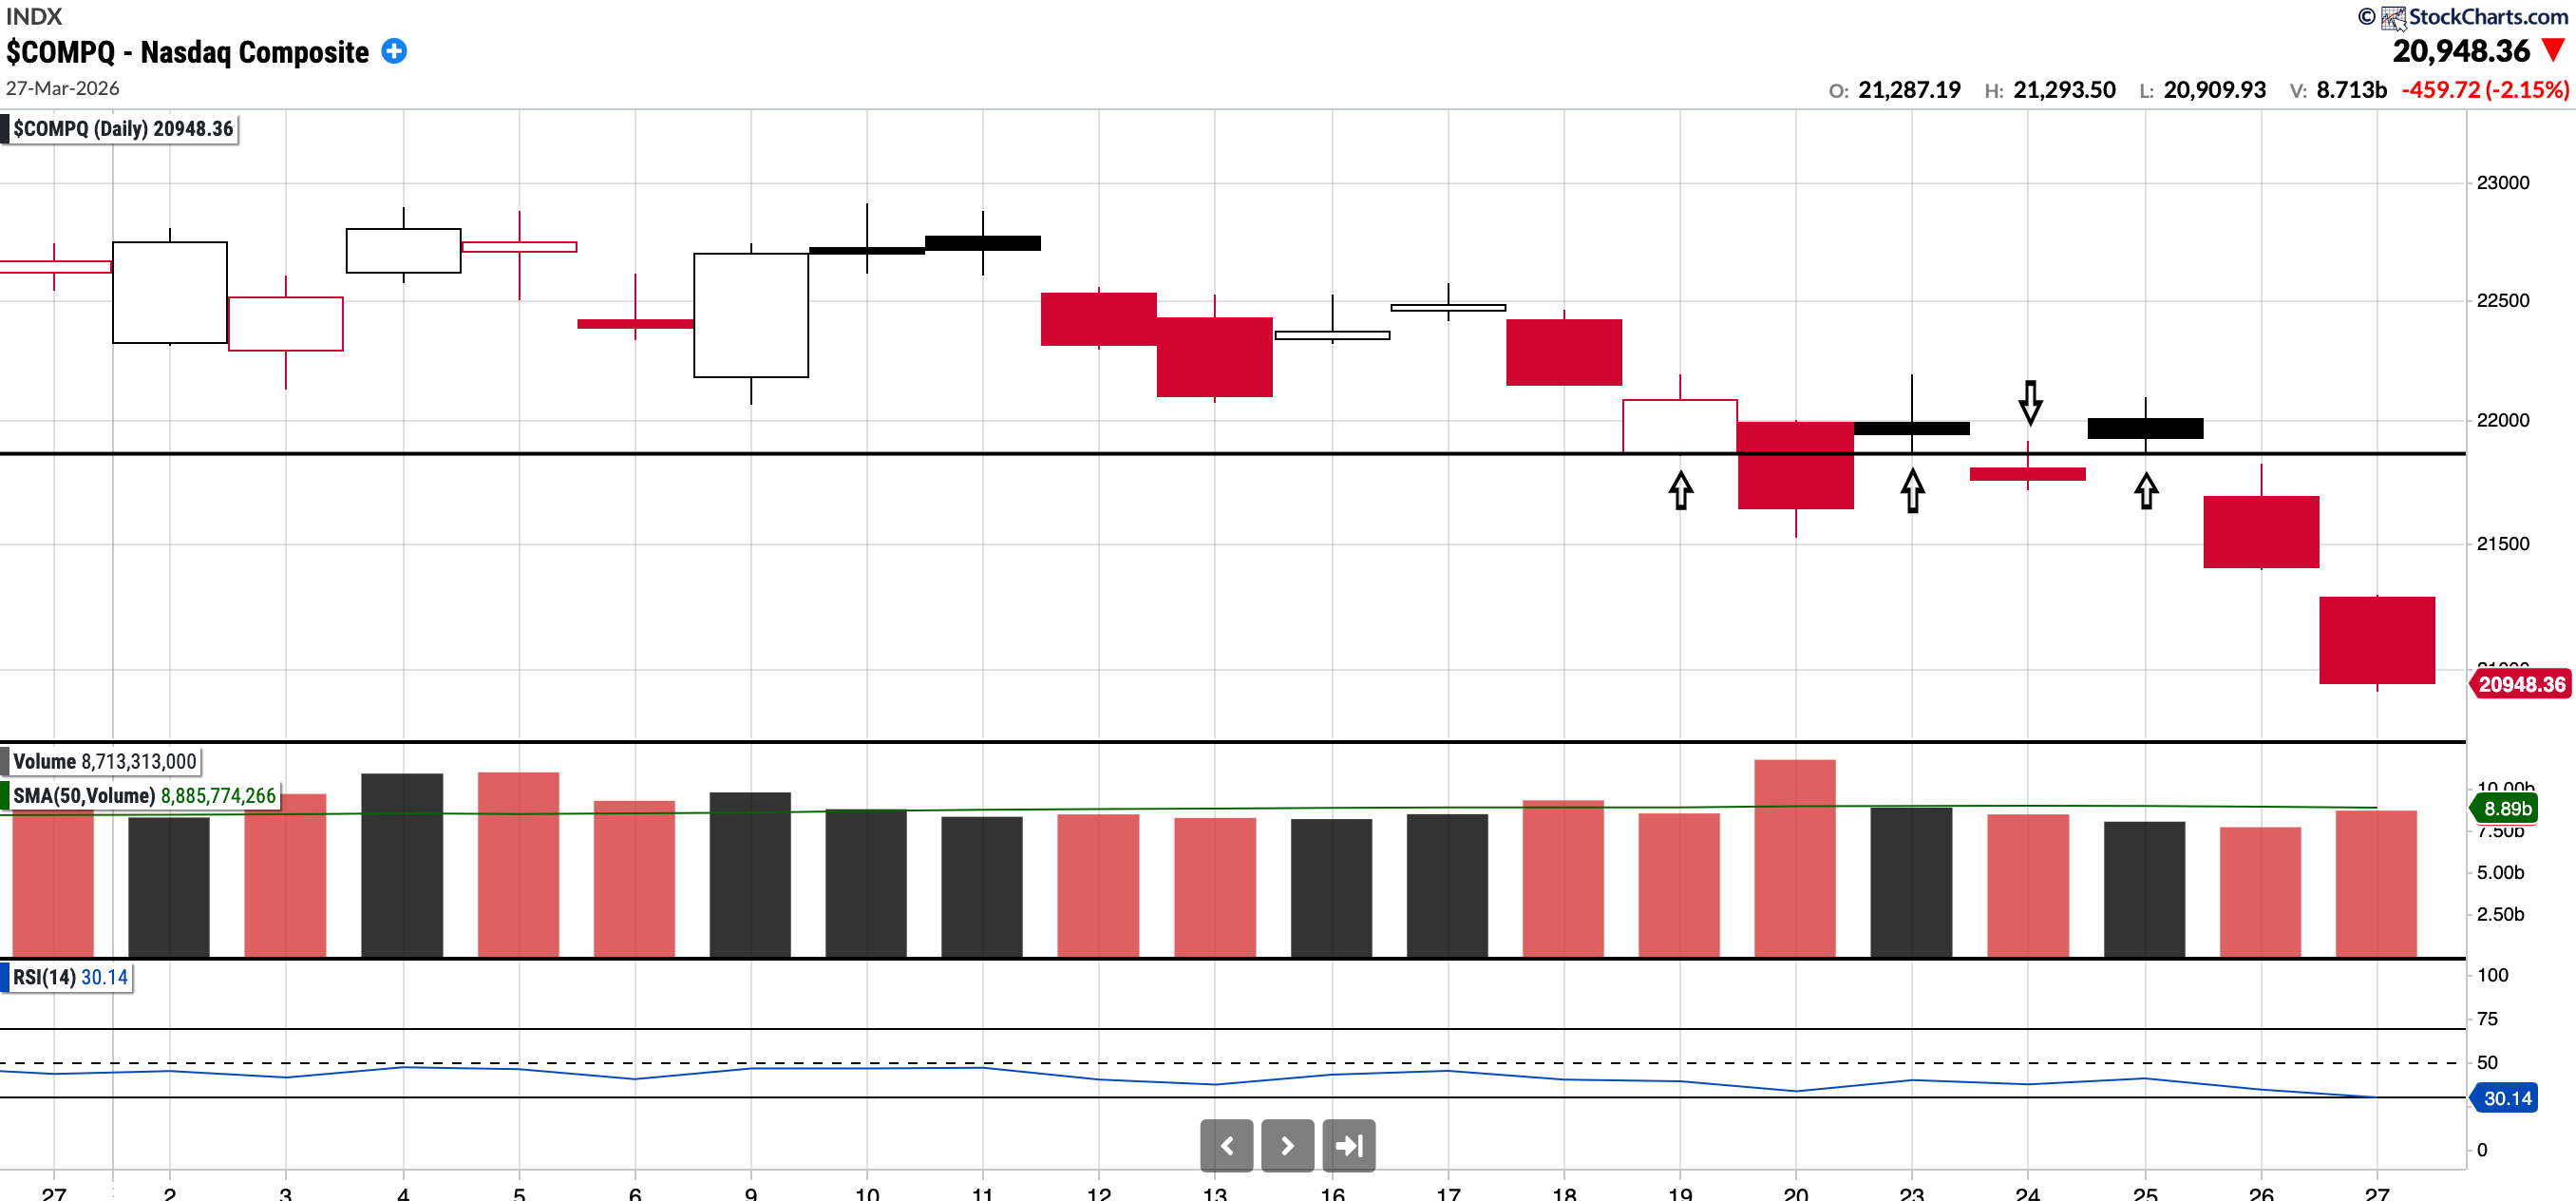
COMPQ
Currently trades at 20,948.36, 7.96% below the 50SMA and 6.07% below the 200SMA.
RSI 30.14
-9.84% YTD
Distribution days in the last week: 2
There were two distribution days this week. The Nasdaq Composite remains firmly below all key moving averages.
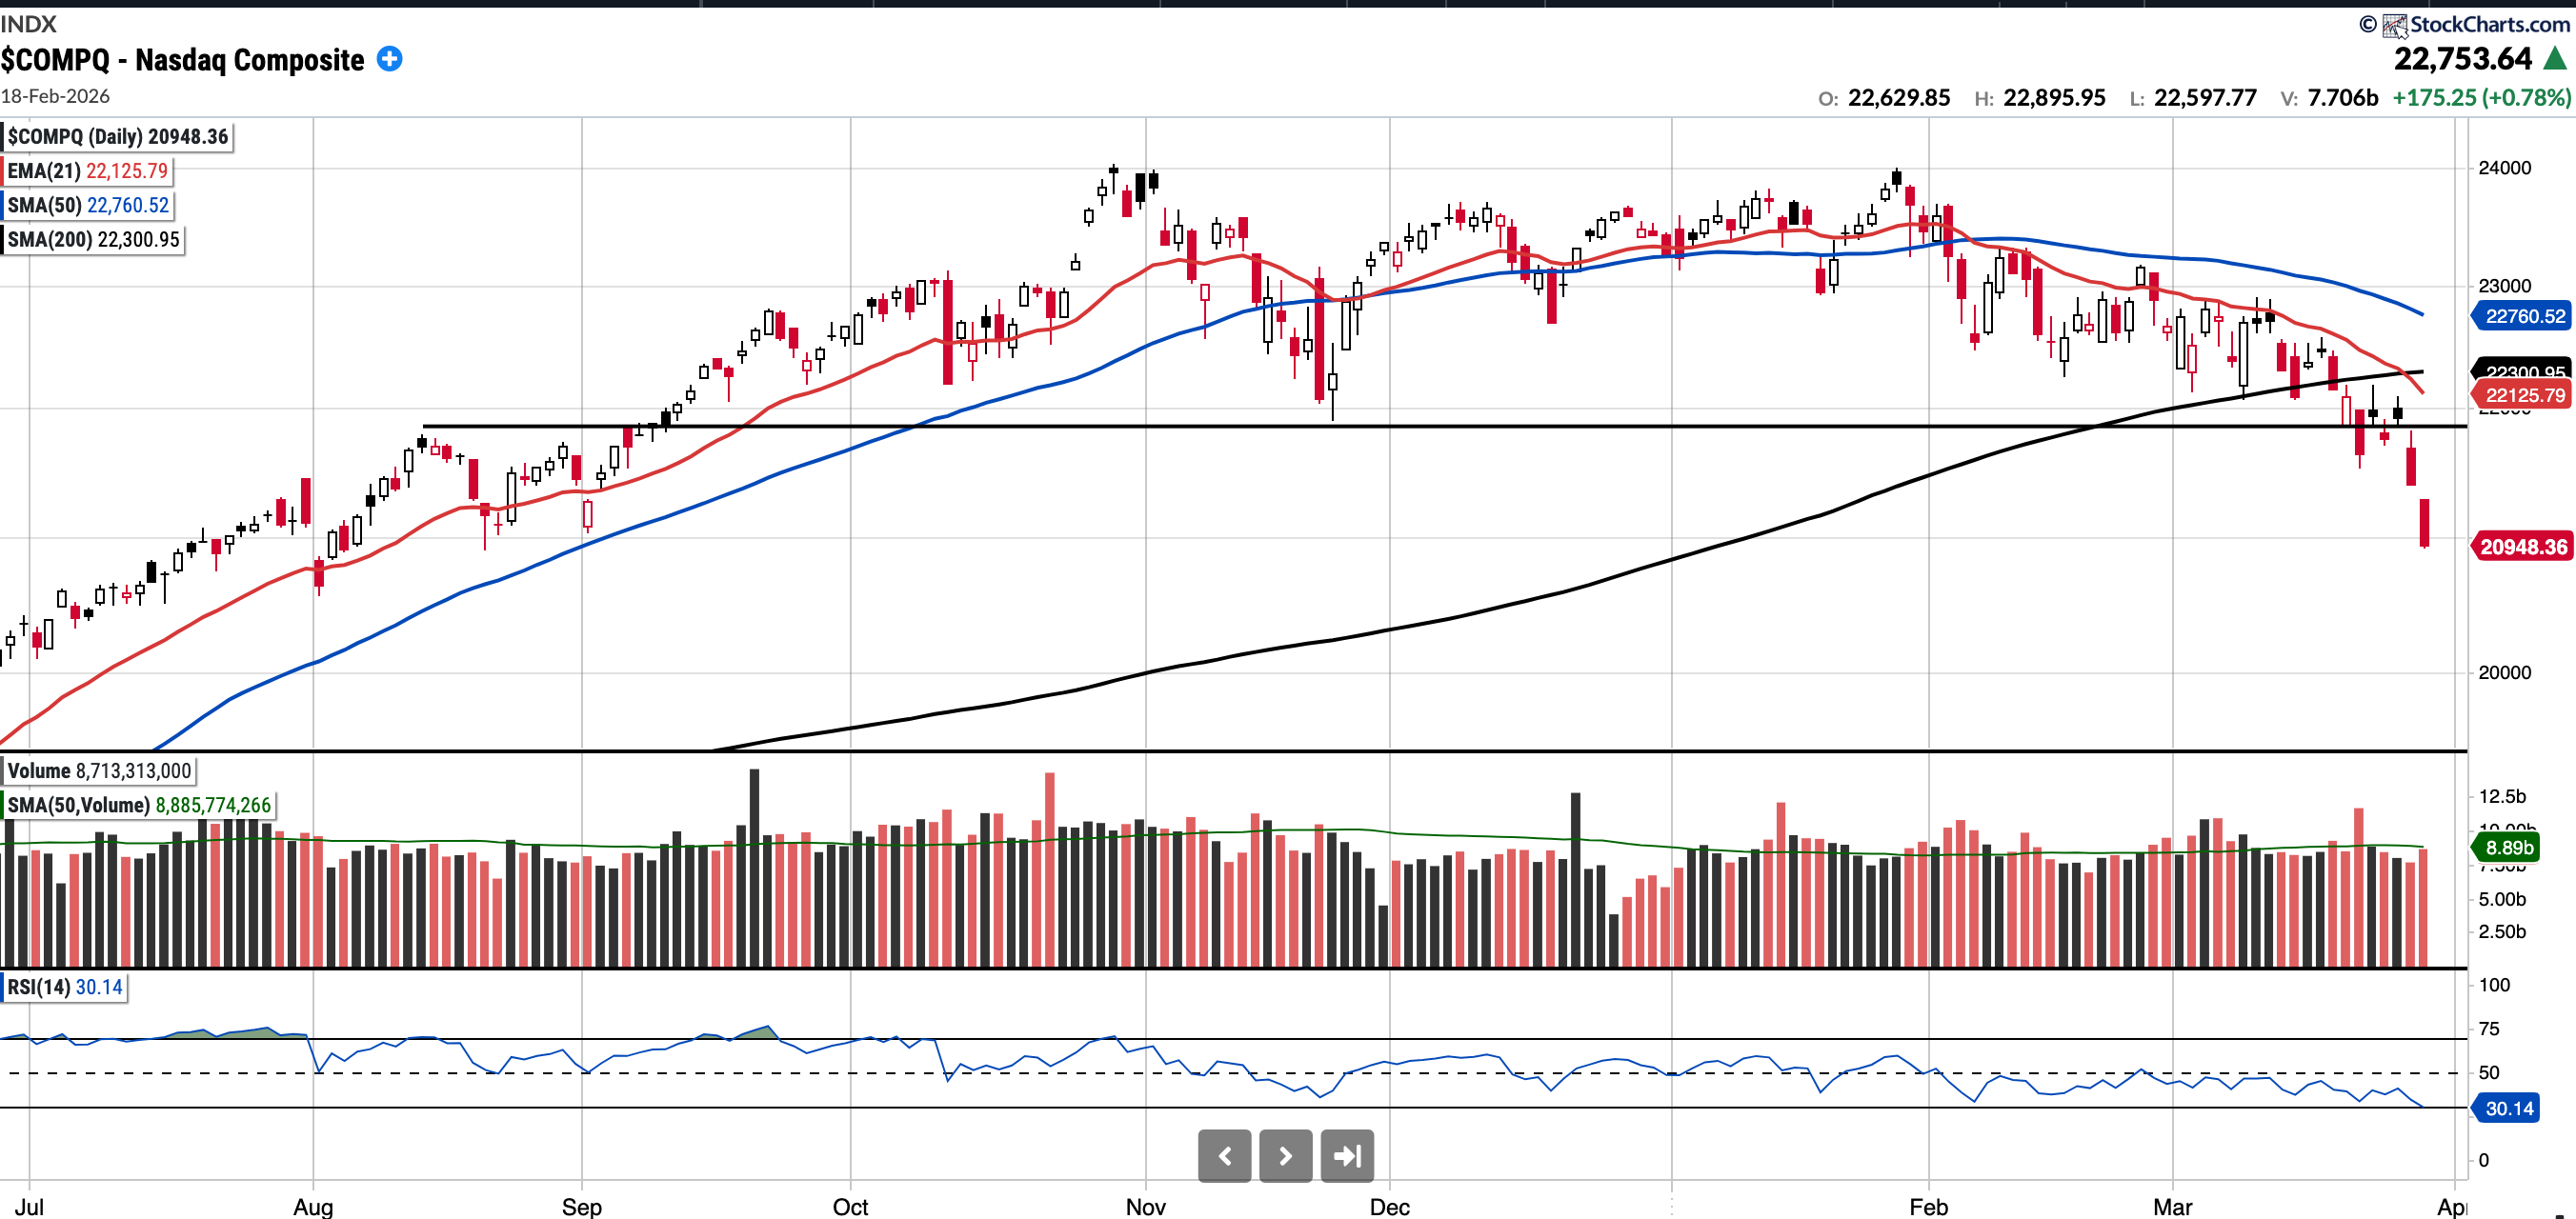
We broke decisively below the 21,850 level (level of interest) on Thursday and remain firmly below both that level and the 200-day SMA. Caution is still warranted.
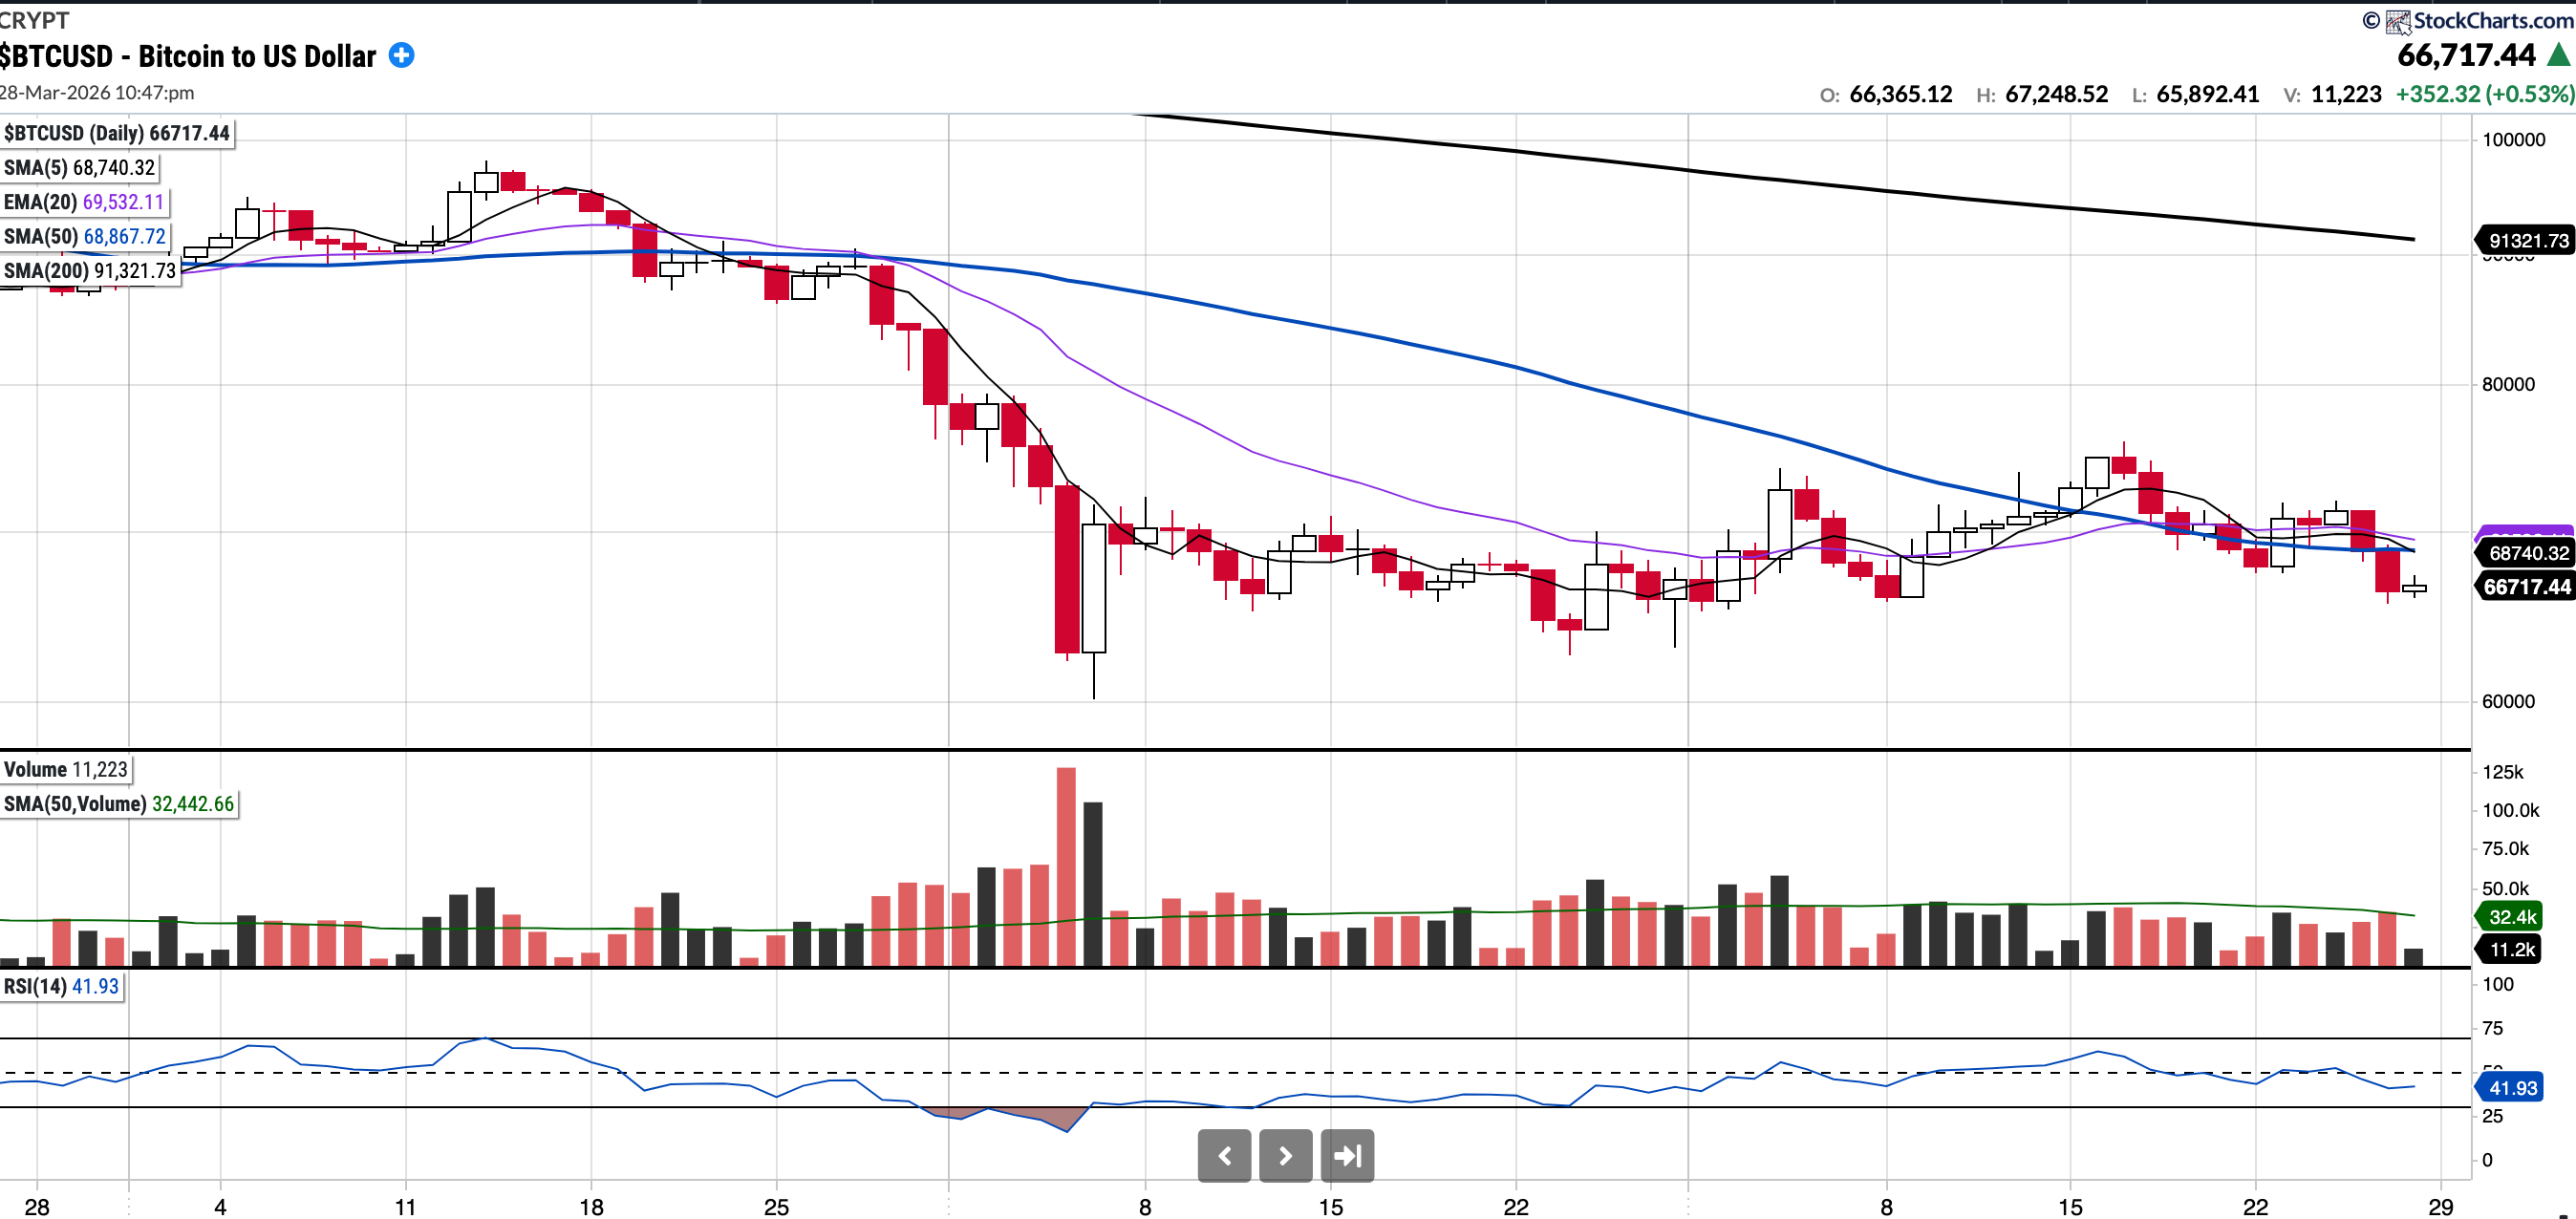
BTC (currently Long)
Currently trades at $66,717.44, 3.12% below the 50SMA and 26.94% below the 200SMA.
RSI 41.93
-24.81% YTD.
Since testing the 200-week moving average on Thursday, February 5th, Bitcoin has traded primarily within the $63,000–$70,000 range.
In early March, BTC had exhibited some strength , putting together a string of 8 green days in a row and trading as high as $76,000 for a moment, though it is again some way off those levels. $74,000 remains an important resistance level.
As of Saturday 22:50 GMT, BTC remains below all key moving averages. We remain in a position where significant technical work is required before the chart looks constructive.
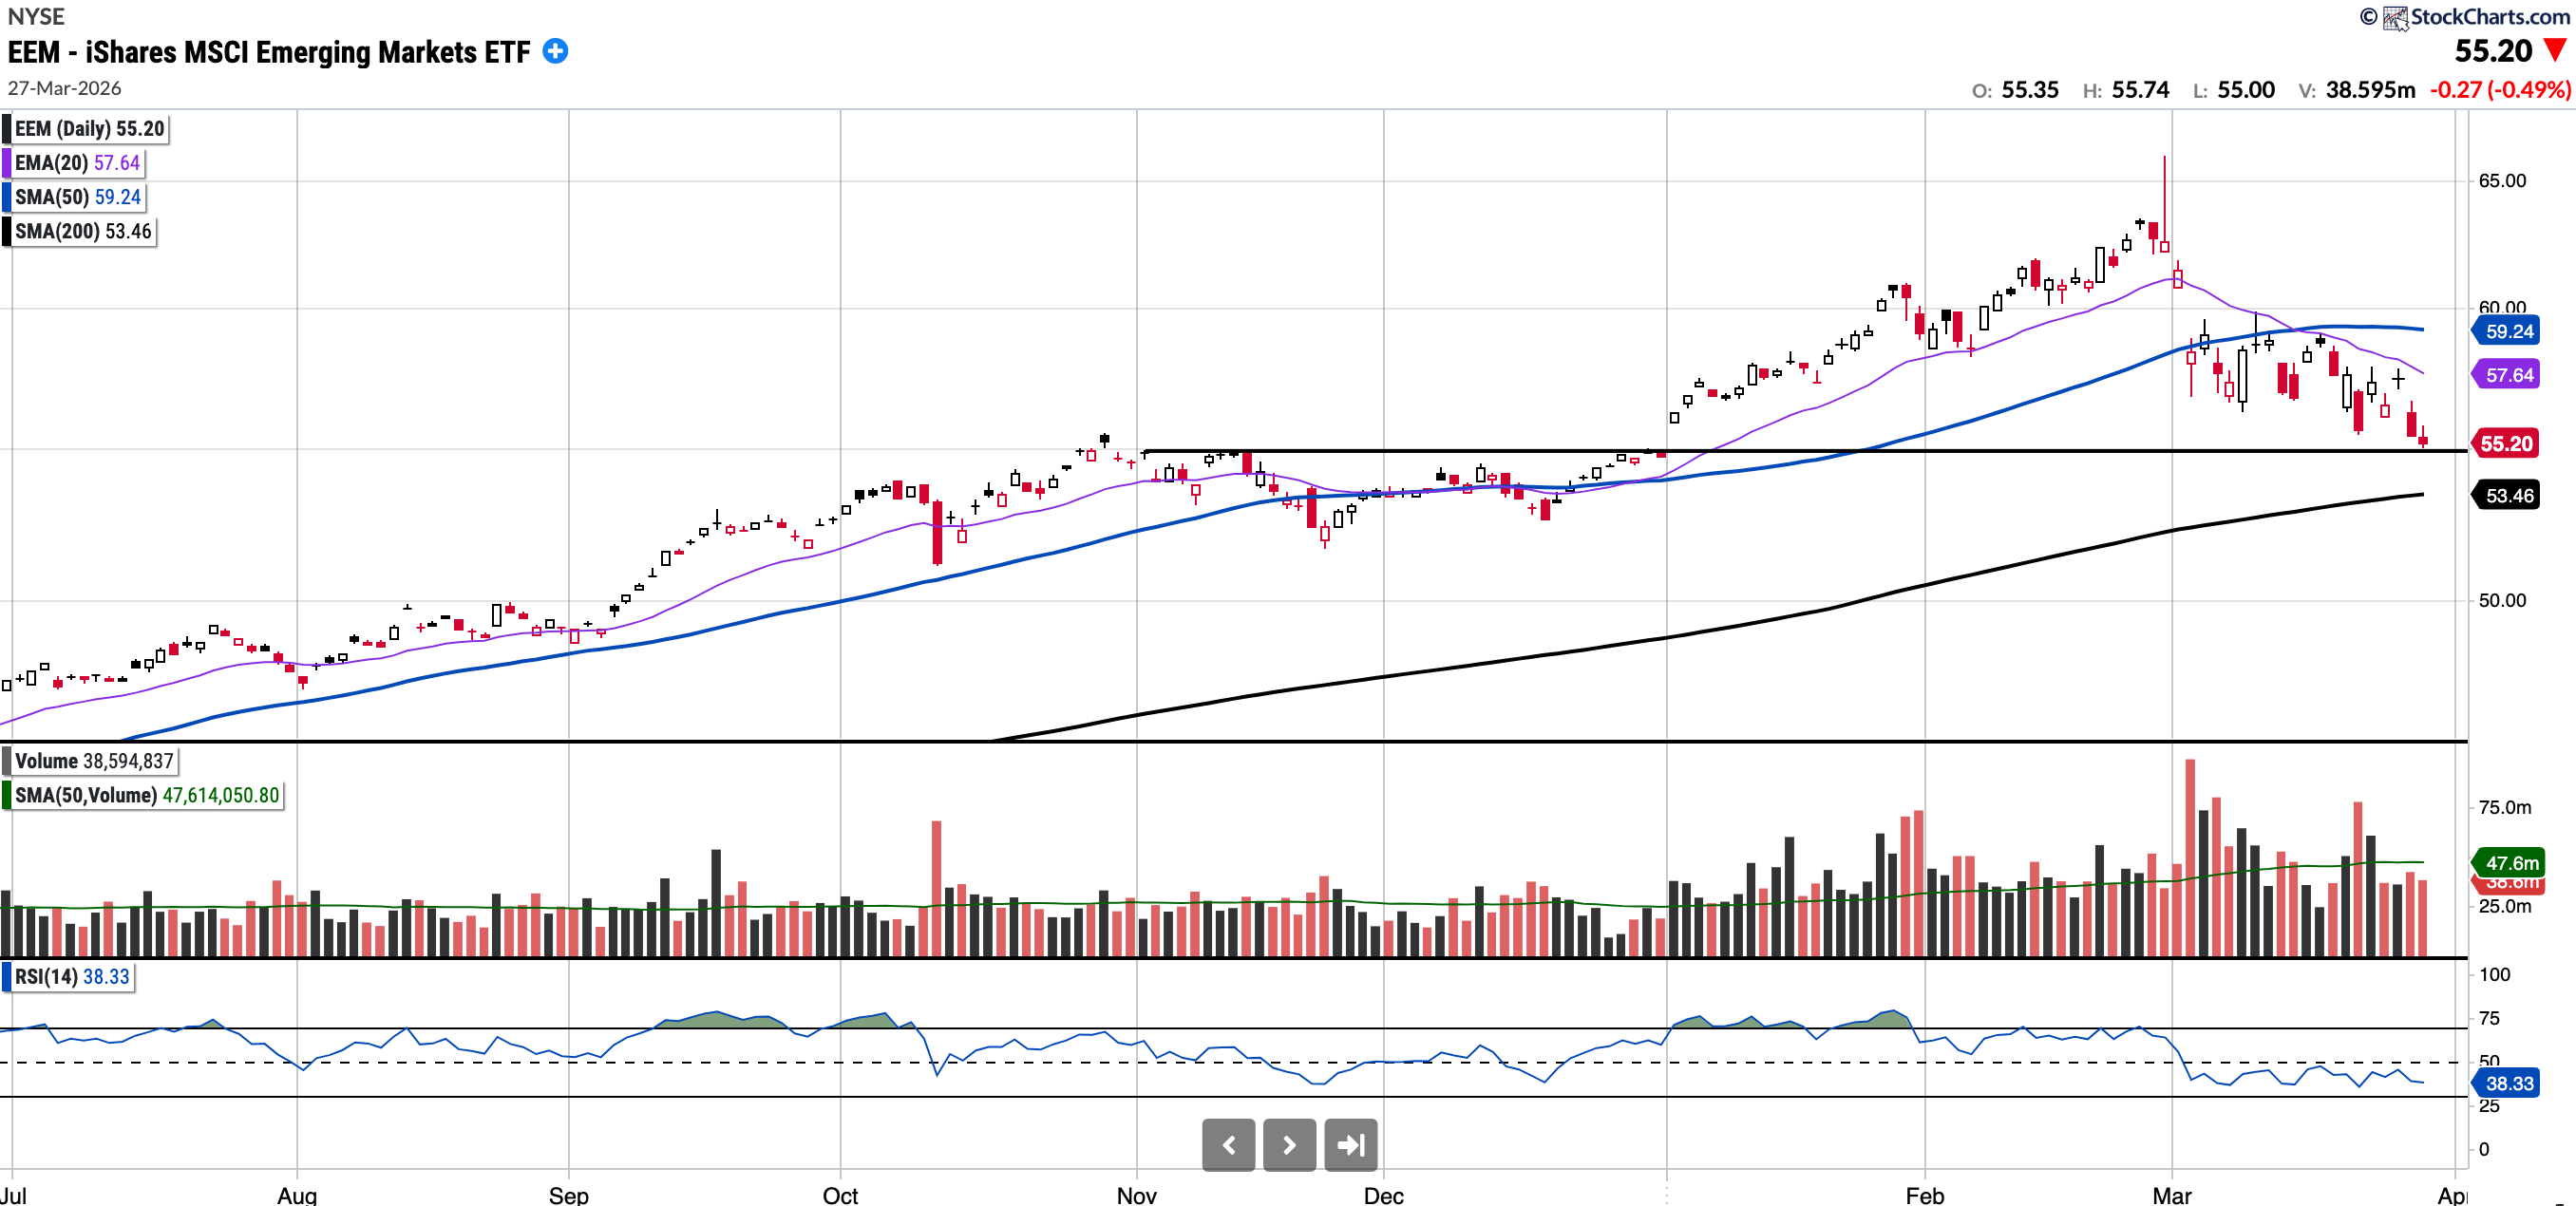
EEM
Currently trades at $55.20, 6.81% below the 50SMA and 3.26% above the 200SMA
RSI 35.81
-1.85% YTD
$EEM continues to outperform the U.S. indices comfortably year-to-date, but it has pulled back sharply over the last three weeks amid events in the Middle East. This makes sense given the higher oil and energy costs.
EEM remains an uptrend; however, the levels to watch for pullback buys are $55.00 (horizontal support) and the ascending 200-day SMA at $53.46. While it has held the $55.00 support for now, if that level is lost, the 200-day SMA will come into play.
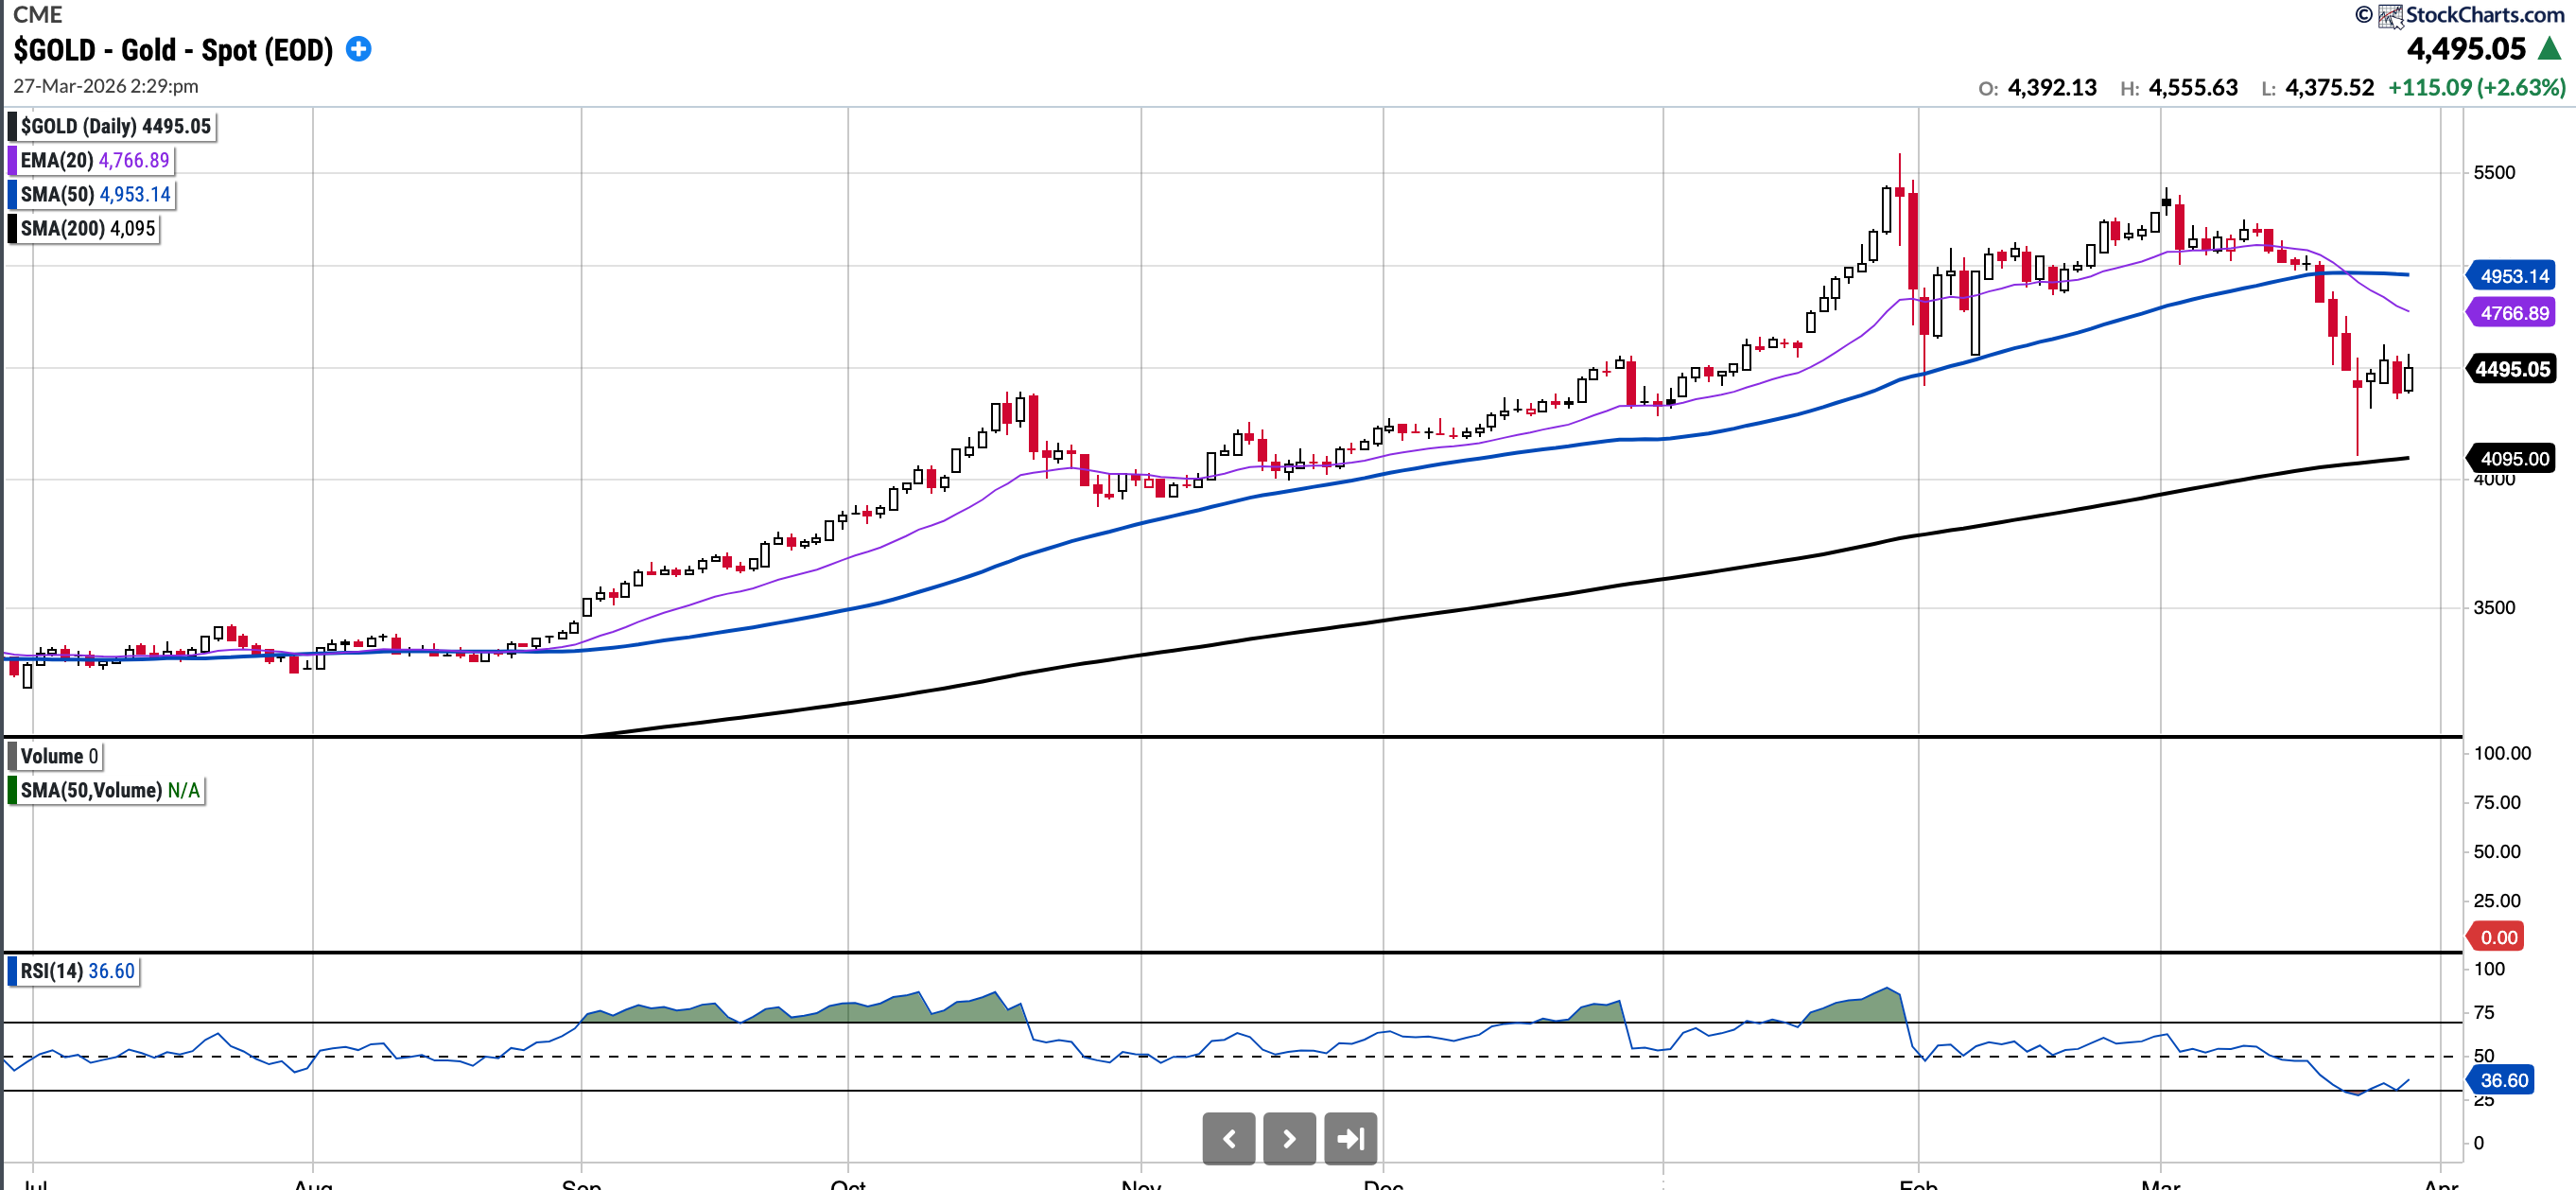
GOLD (Long Physical)
Currently trades at $4495, 9.25% below the 50SMA and 9.77% above the 200SMA
RSI 36.6
3.99% YTD
Gold has started to show surprising weakness despite ongoing geopolitical uncertainty.
Last week, I noted the 200-day SMA as a key level to watch; on Monday morning, price pulled back to test that average and held. It ultimately finished the week essentially unchanged, up just $1.
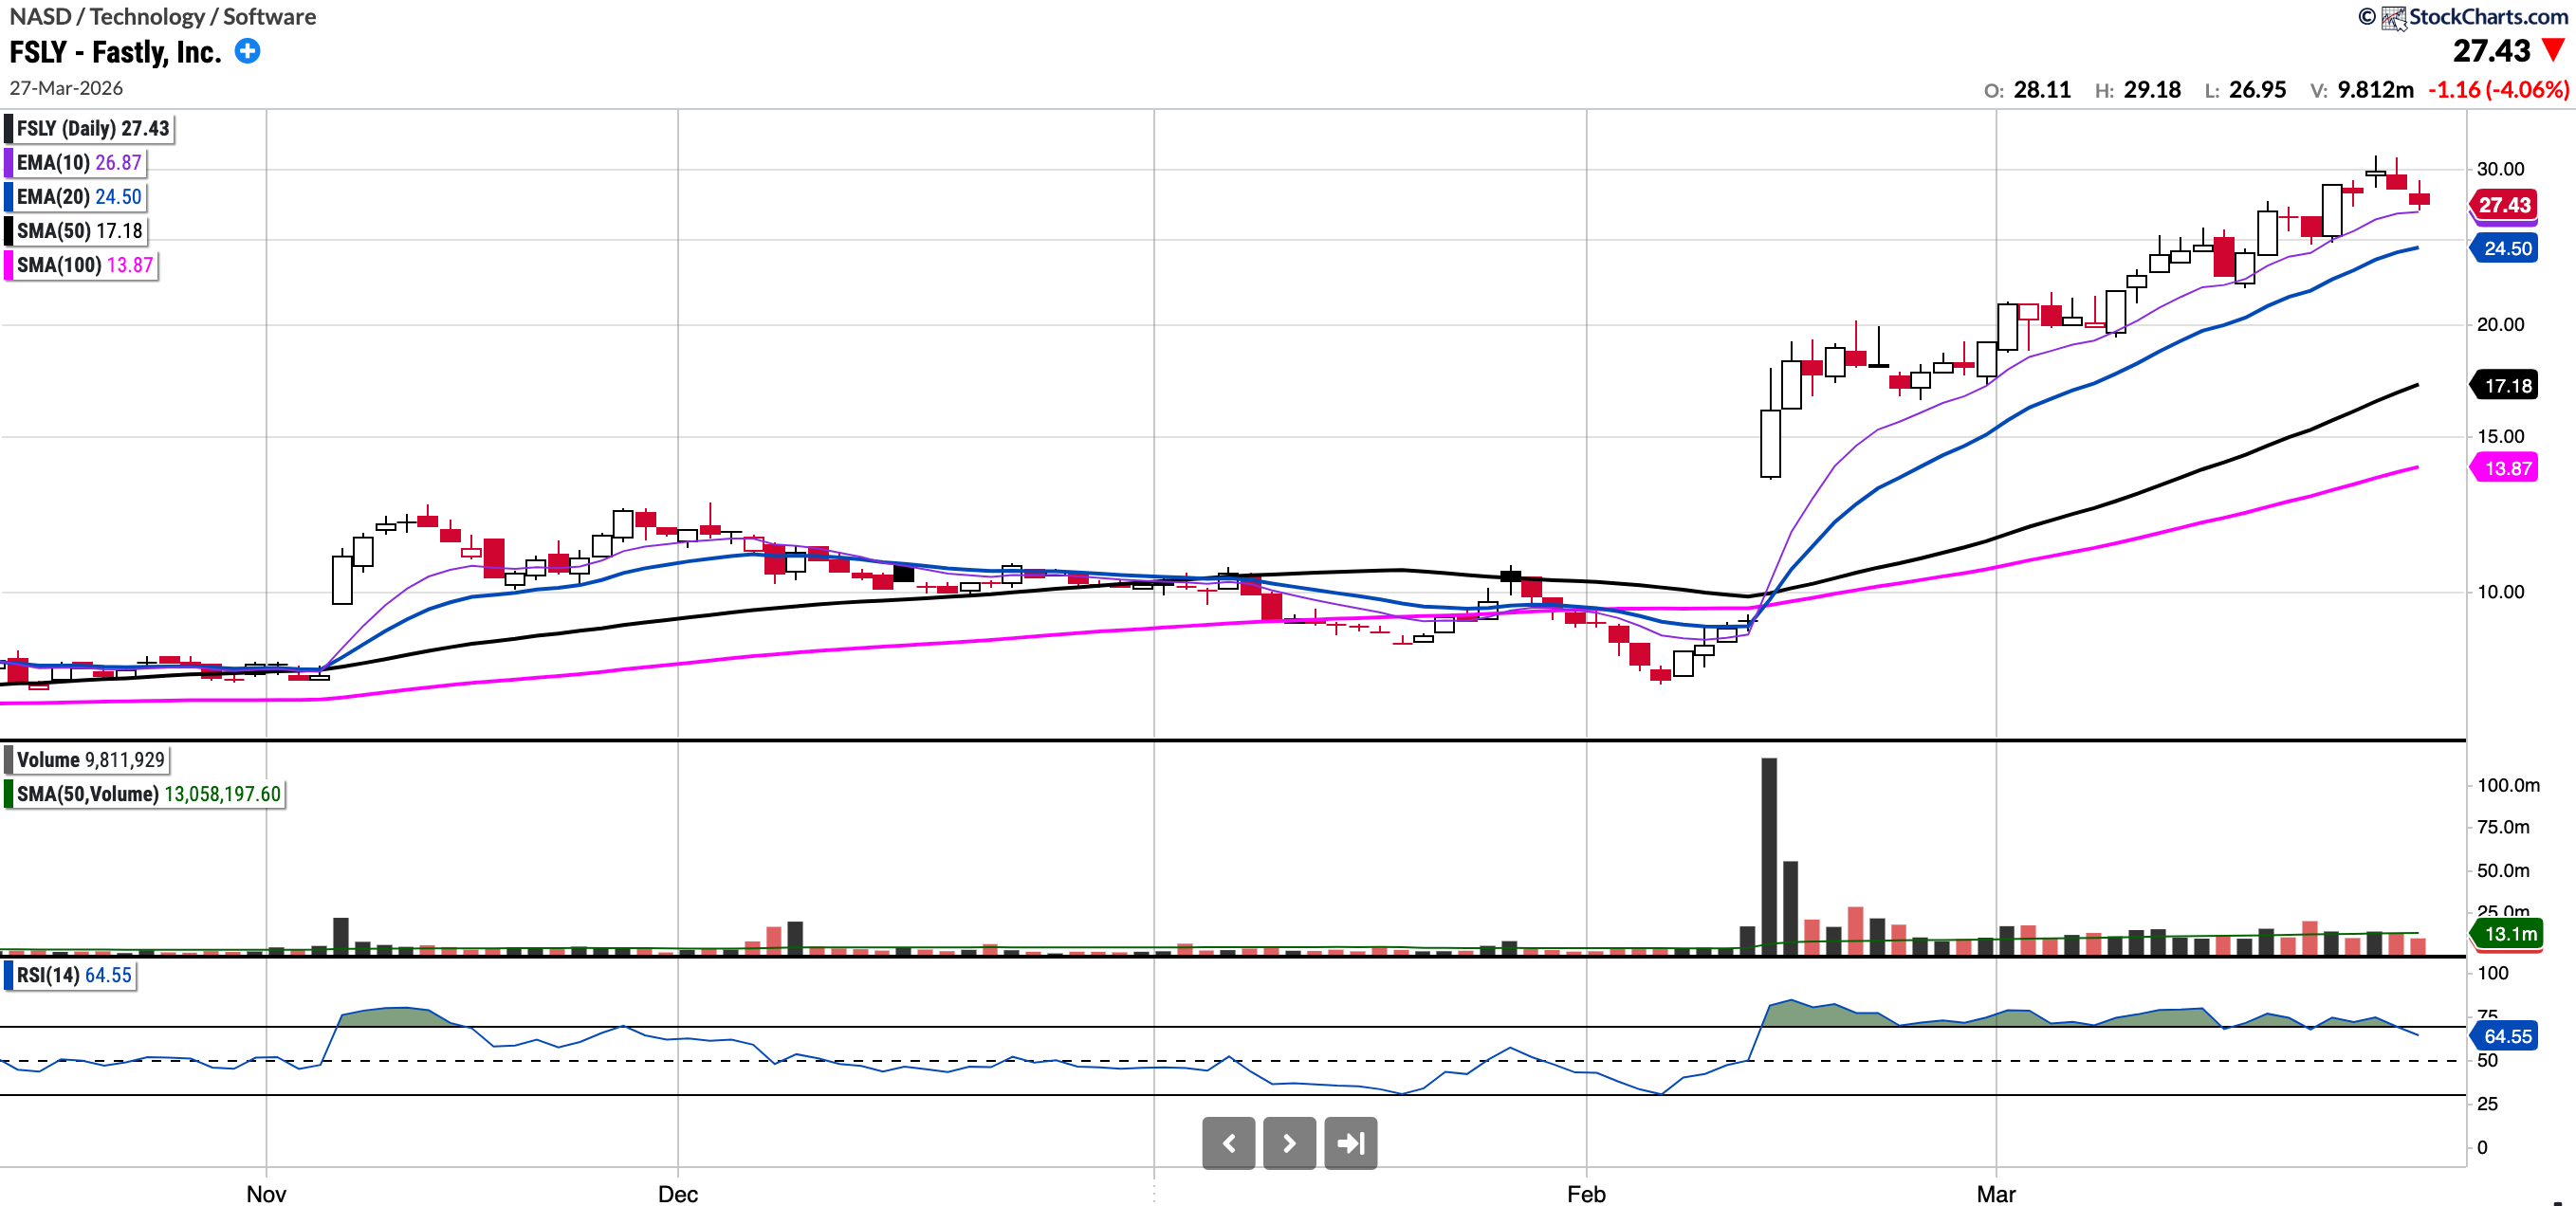
FSLY (currently Long, Trading Account)
Currently trades at $27.43, 59.69% above the 50SMA and 155.94% above the 200SMA.
RSI 67.97
147.3% YTD.
I featured FSLY initially at 17 on this weekly email, and it is up >60% since then. I ultimately only put on a position at ~23 more recently and booked profits in the 27’s and 29’s. The stock is extended in the near term but the strength it has shown proves it is a leading stock in the market right now. A close below the EMA 20 (and arguably even the EMA 10) would be a character change; until then, it remains a long for me.
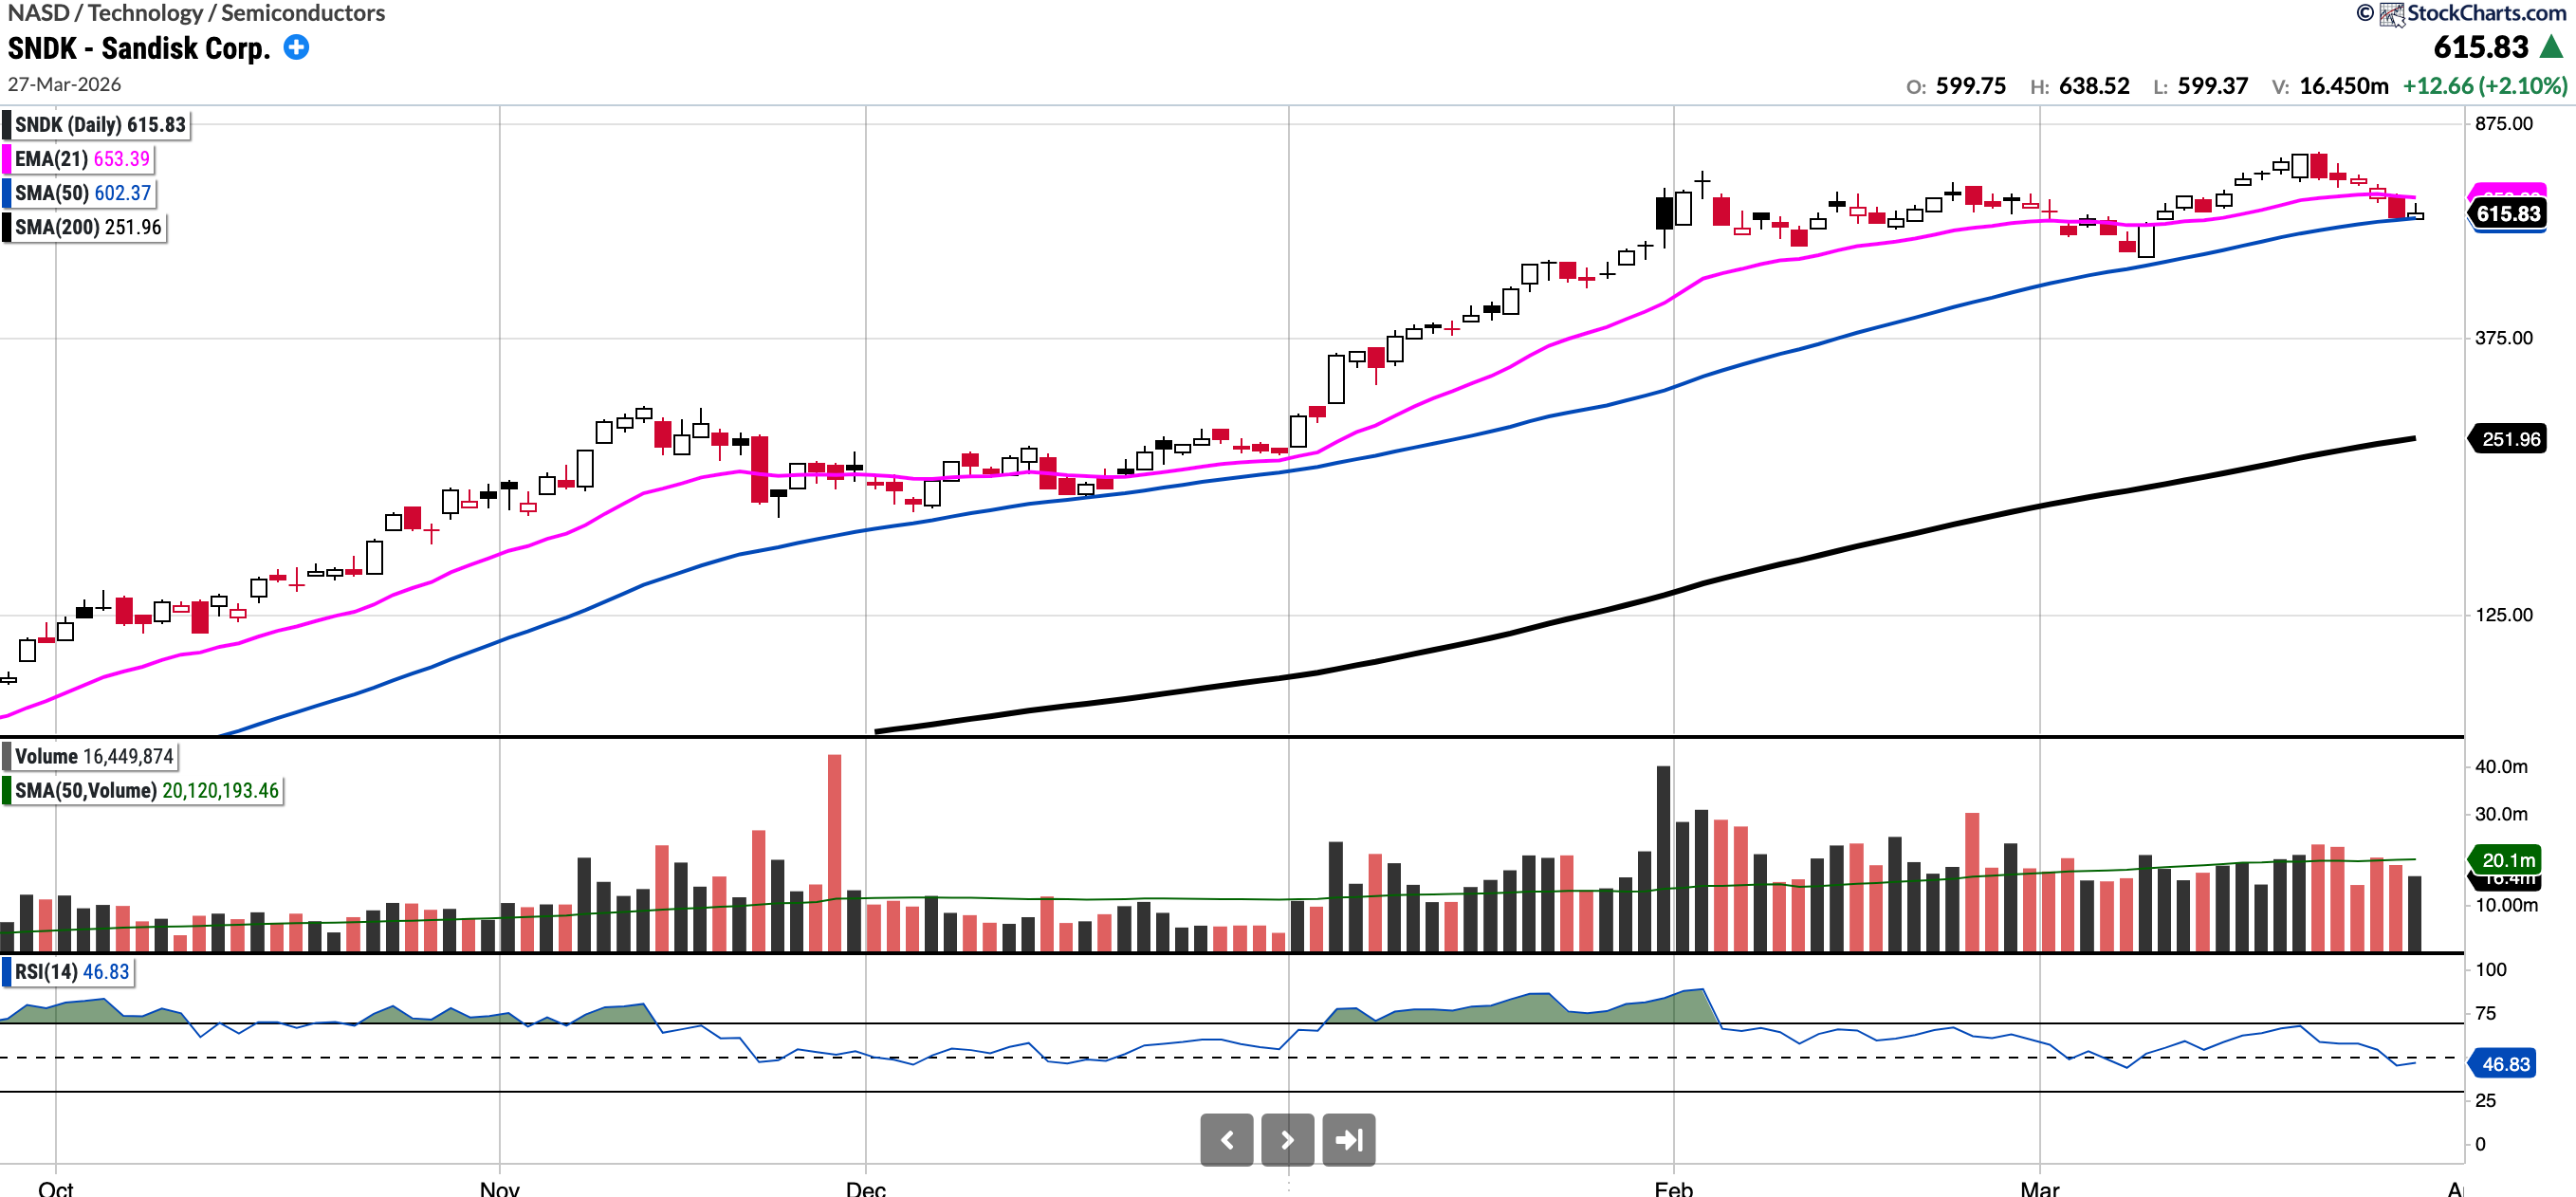
SNDK
Currently trades at $615.83, 2.23% above the 50SMA and 144.41% above the 200SMA.
RSI 67.97
123.74% YTD.
SNDK has been the top-performing stock in the S&P 500 YTD and currently trades at just under 8x NTM estimated earnings (a cyclical so take with a grain of salt).
The stock found support at the 50-day SMA on Friday; however, if that level fails, the next downside zone to watch is $560–$570. I am interested in trying to get positioned for a trade at some point.
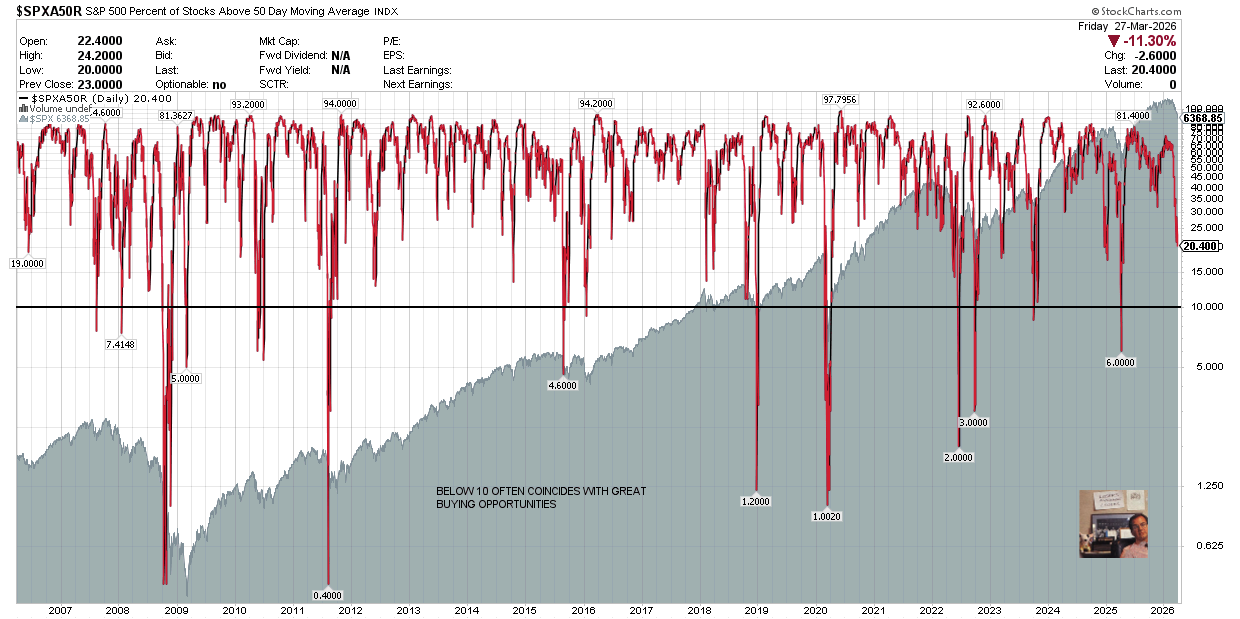
S&P 500 Percentage of Stocks Below the 50 Day Moving Average
Below 10 tend to be fantastic buying opportunities. We are not there yet.
Notable portfolio changes in previous week (all updated live in subscriber channels):
No new positions or exits.
Important: To familiarise yourself with the notification process, please read the following post regarding the notification system.
I have also included the link to the Live Updates thread on the Substack chat below, which is where I post all moves related to my investment account. Turn the notifications on. Live Updates Thread
Note that these updates are posted simultaneously on Discord as well.
Current Positions in Size Order with Cost Basis:
