
Preview of the Week Ahead: W/C May 4, 2026
SPX Closes at yet another All-Time High; Semis Most Overbought in History

Hope you all are having a good weekend. Below, we will be previewing the upcoming week’s events and providing a portfolio update as usual.
Format for what is covered in this weekly preview:
A Look at the Indices
Key Upcoming Economic Events
Upcoming Earnings Reports
Charts
Notable Portfolio Changes from the Previous Week
Current Portfolio Holdings
Position size, cost basis, and commentary on each holding regarding the intended holding period and any planned activity
Closing Thoughts
I recommend checking out the previous Monthly Portfolio and Performance Update below; the next update will also be available in a few days.

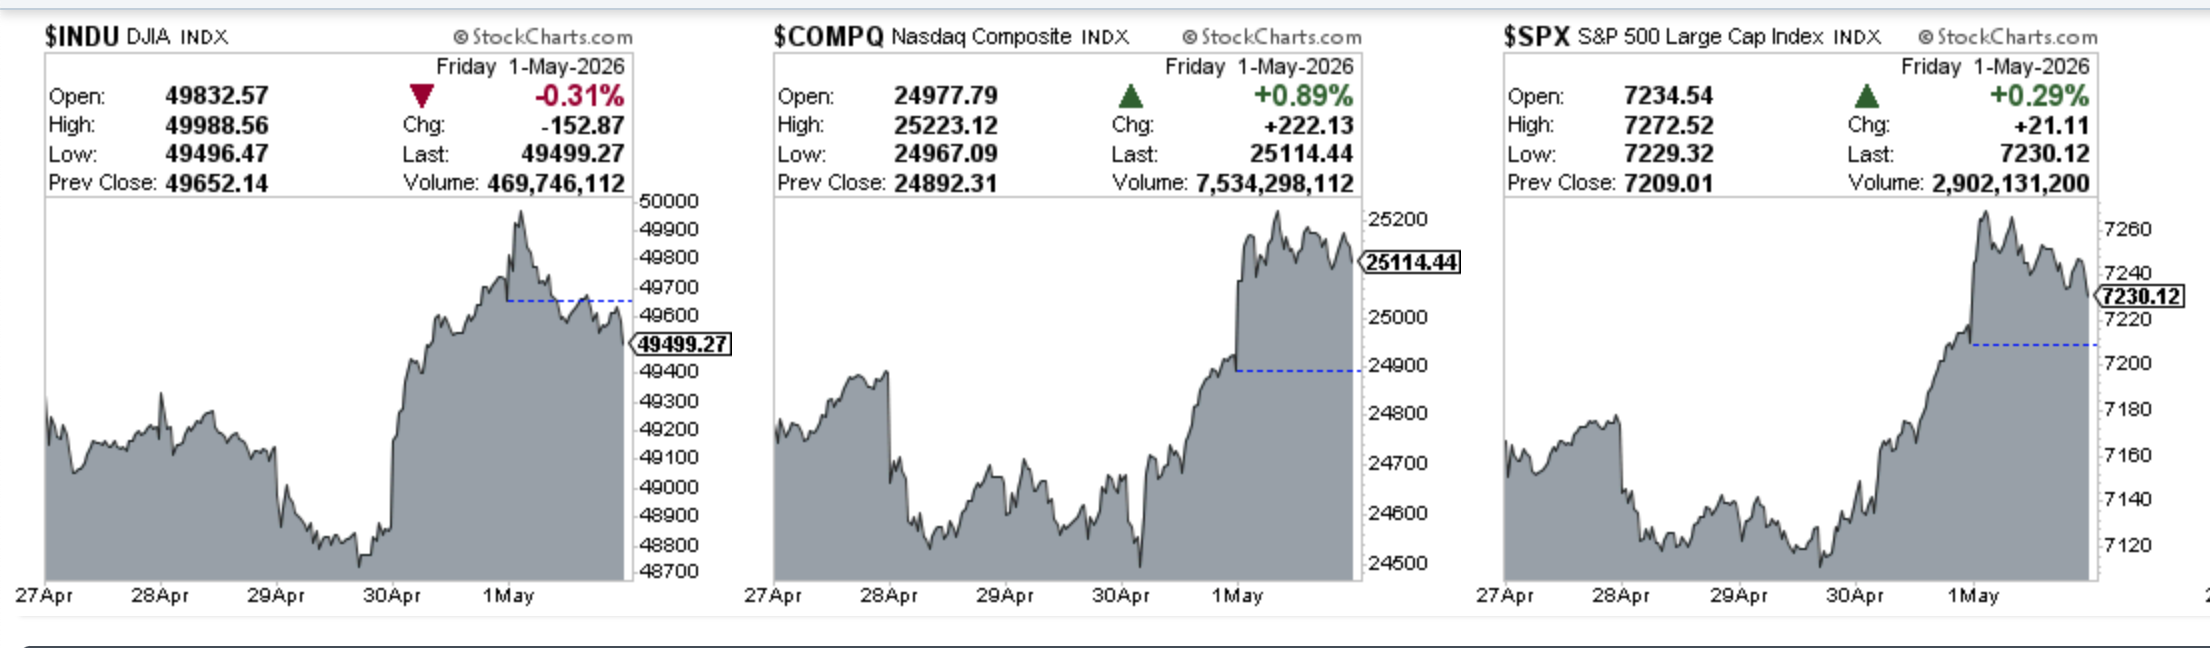
Indices
Dow Jones advanced 0.42% in the last week
S&P 500 advanced 0.97% in the last week
Nasdaq Composite advanced 1.43% in the last week
IWM advanced 0.5% in the last week
Key upcoming economic events
Monday, May 4
Factory Orders (10:00 AM ET)
Tuesday, May 5
U.S. Trade Balance (8:30 AM ET)
S&P Global Services PMI - Final (9:45 AM ET)
ISM Services PMI (10:00 AM ET)
JOLTS Job Openings (10:00 AM ET)
Wednesday, May 6
ADP National Employment Report (8:15 AM ET): Tracks private-sector payroll growth.
Thursday, May 7
Initial Jobless Claims (8:30 AM ET)
Productivity and Costs - Preliminary (8:30 AM ET)
Construction Spending (10:00 AM ET)
Friday, May 8
Employment Situation Report / “Jobs Report” (8:30 AM ET): The week’s most critical data release, includes:
Non-farm Payrolls: The number of jobs added or lost in the previous month.
Unemployment Rate: The percentage of the labor force that is unemployed.
Average Hourly Earnings: A key metric for assessing wage-push inflation.
Wholesale Trade (10:00 AM ET)
Upcoming Earnings
Below is the infographic by Earnings Whispers highlighting the schedule for this week:

Charts
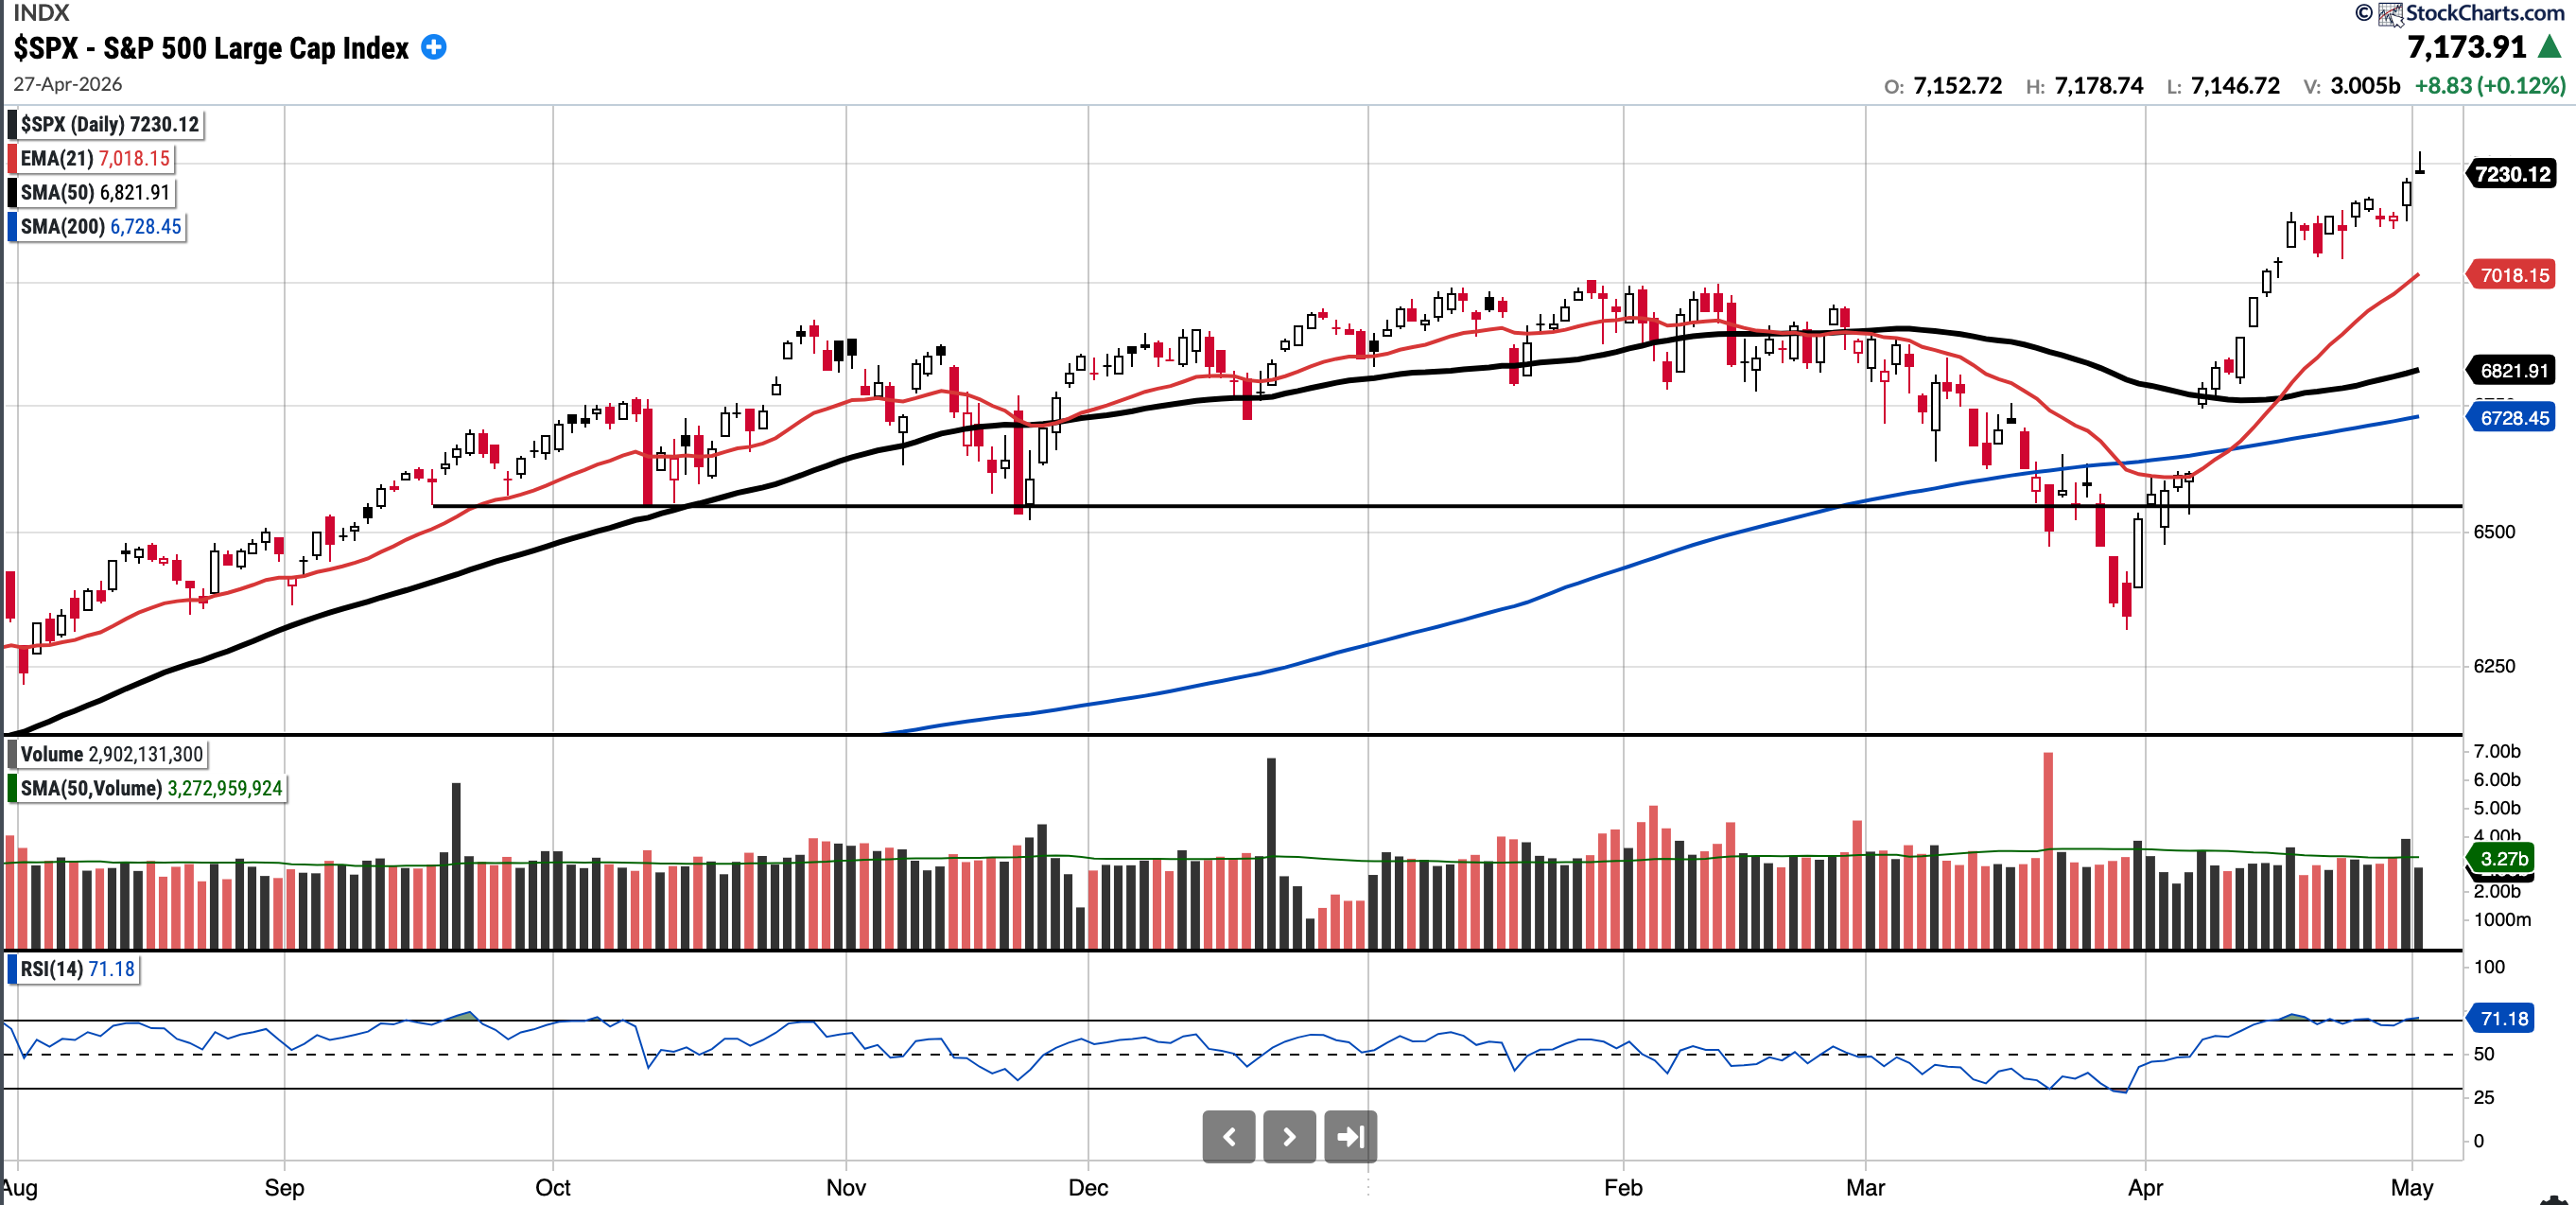
SPX
Currently trades at 7,230.12, 5.98% above the 50SMA and 7.46% above the 200SMA.
RSI 71.18
5.42% YTD
Distribution days in the last week: 1
The SPX reached an all-time high close, continuing the remarkable V-shaped recovery from the March 30 lows.
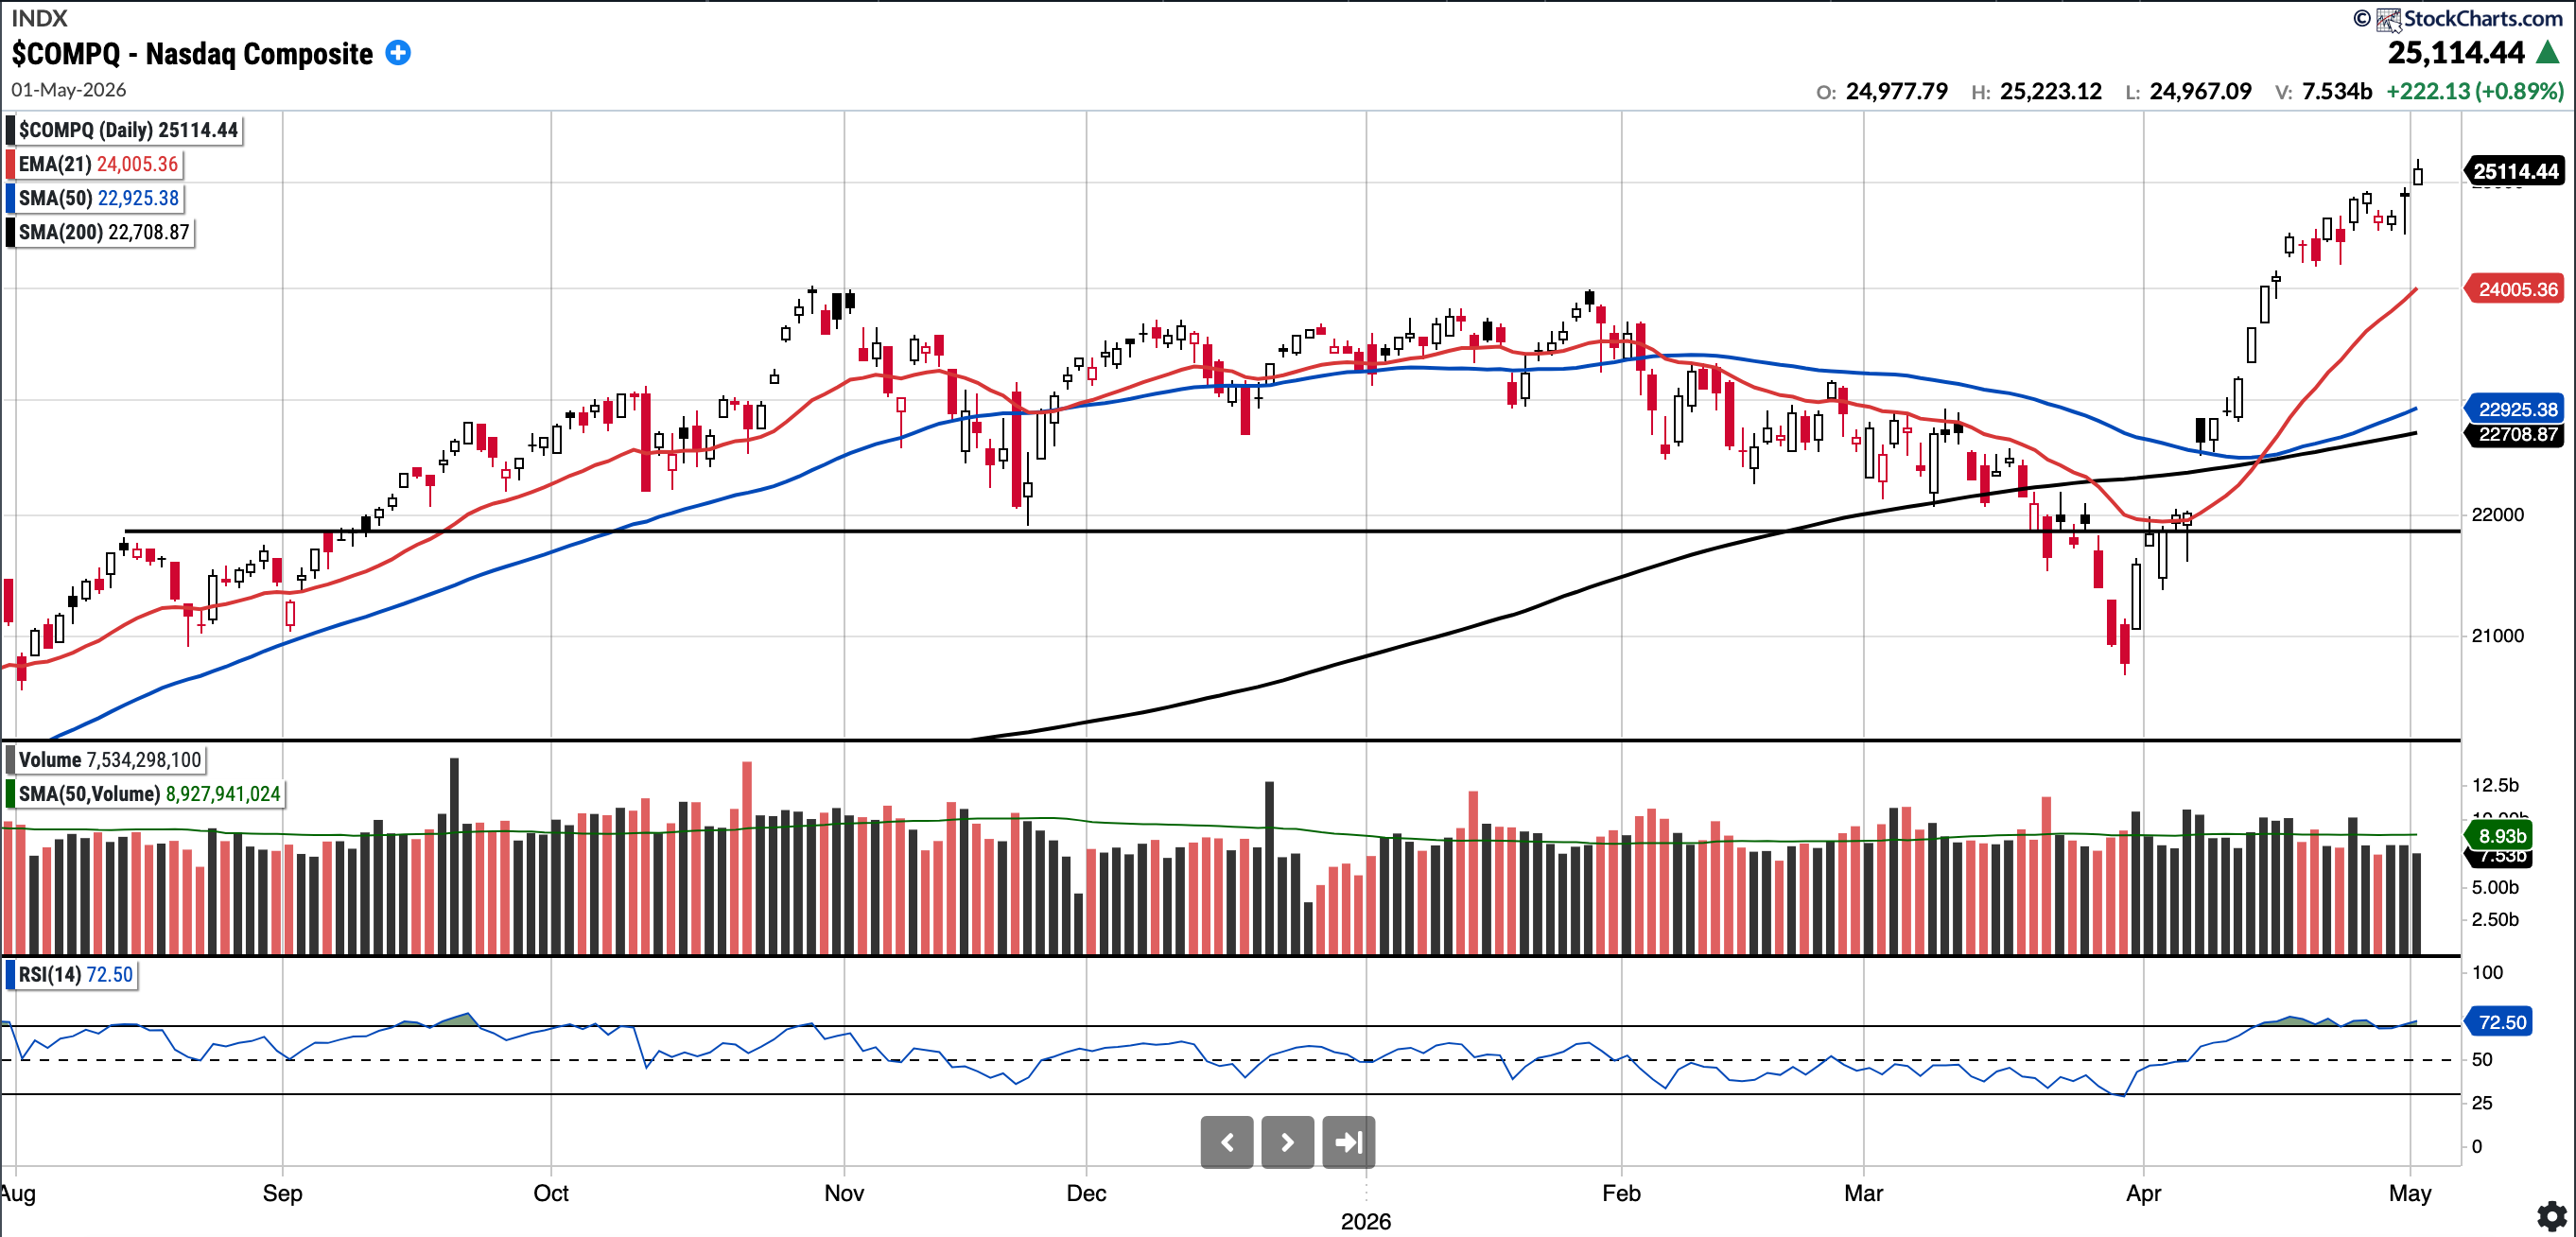
COMPQ
Currently trades at 25,114.44, 9.55% above the 50SMA and 10.59% above the 200SMA.
RSI 72.5
8.09% YTD
Distribution days in the last week: 0
The Nasdaq Composite, like the SPX, ended the week with an all-time high close. It remains quite extended, currently trading 9.55% above its 50-day SMA.
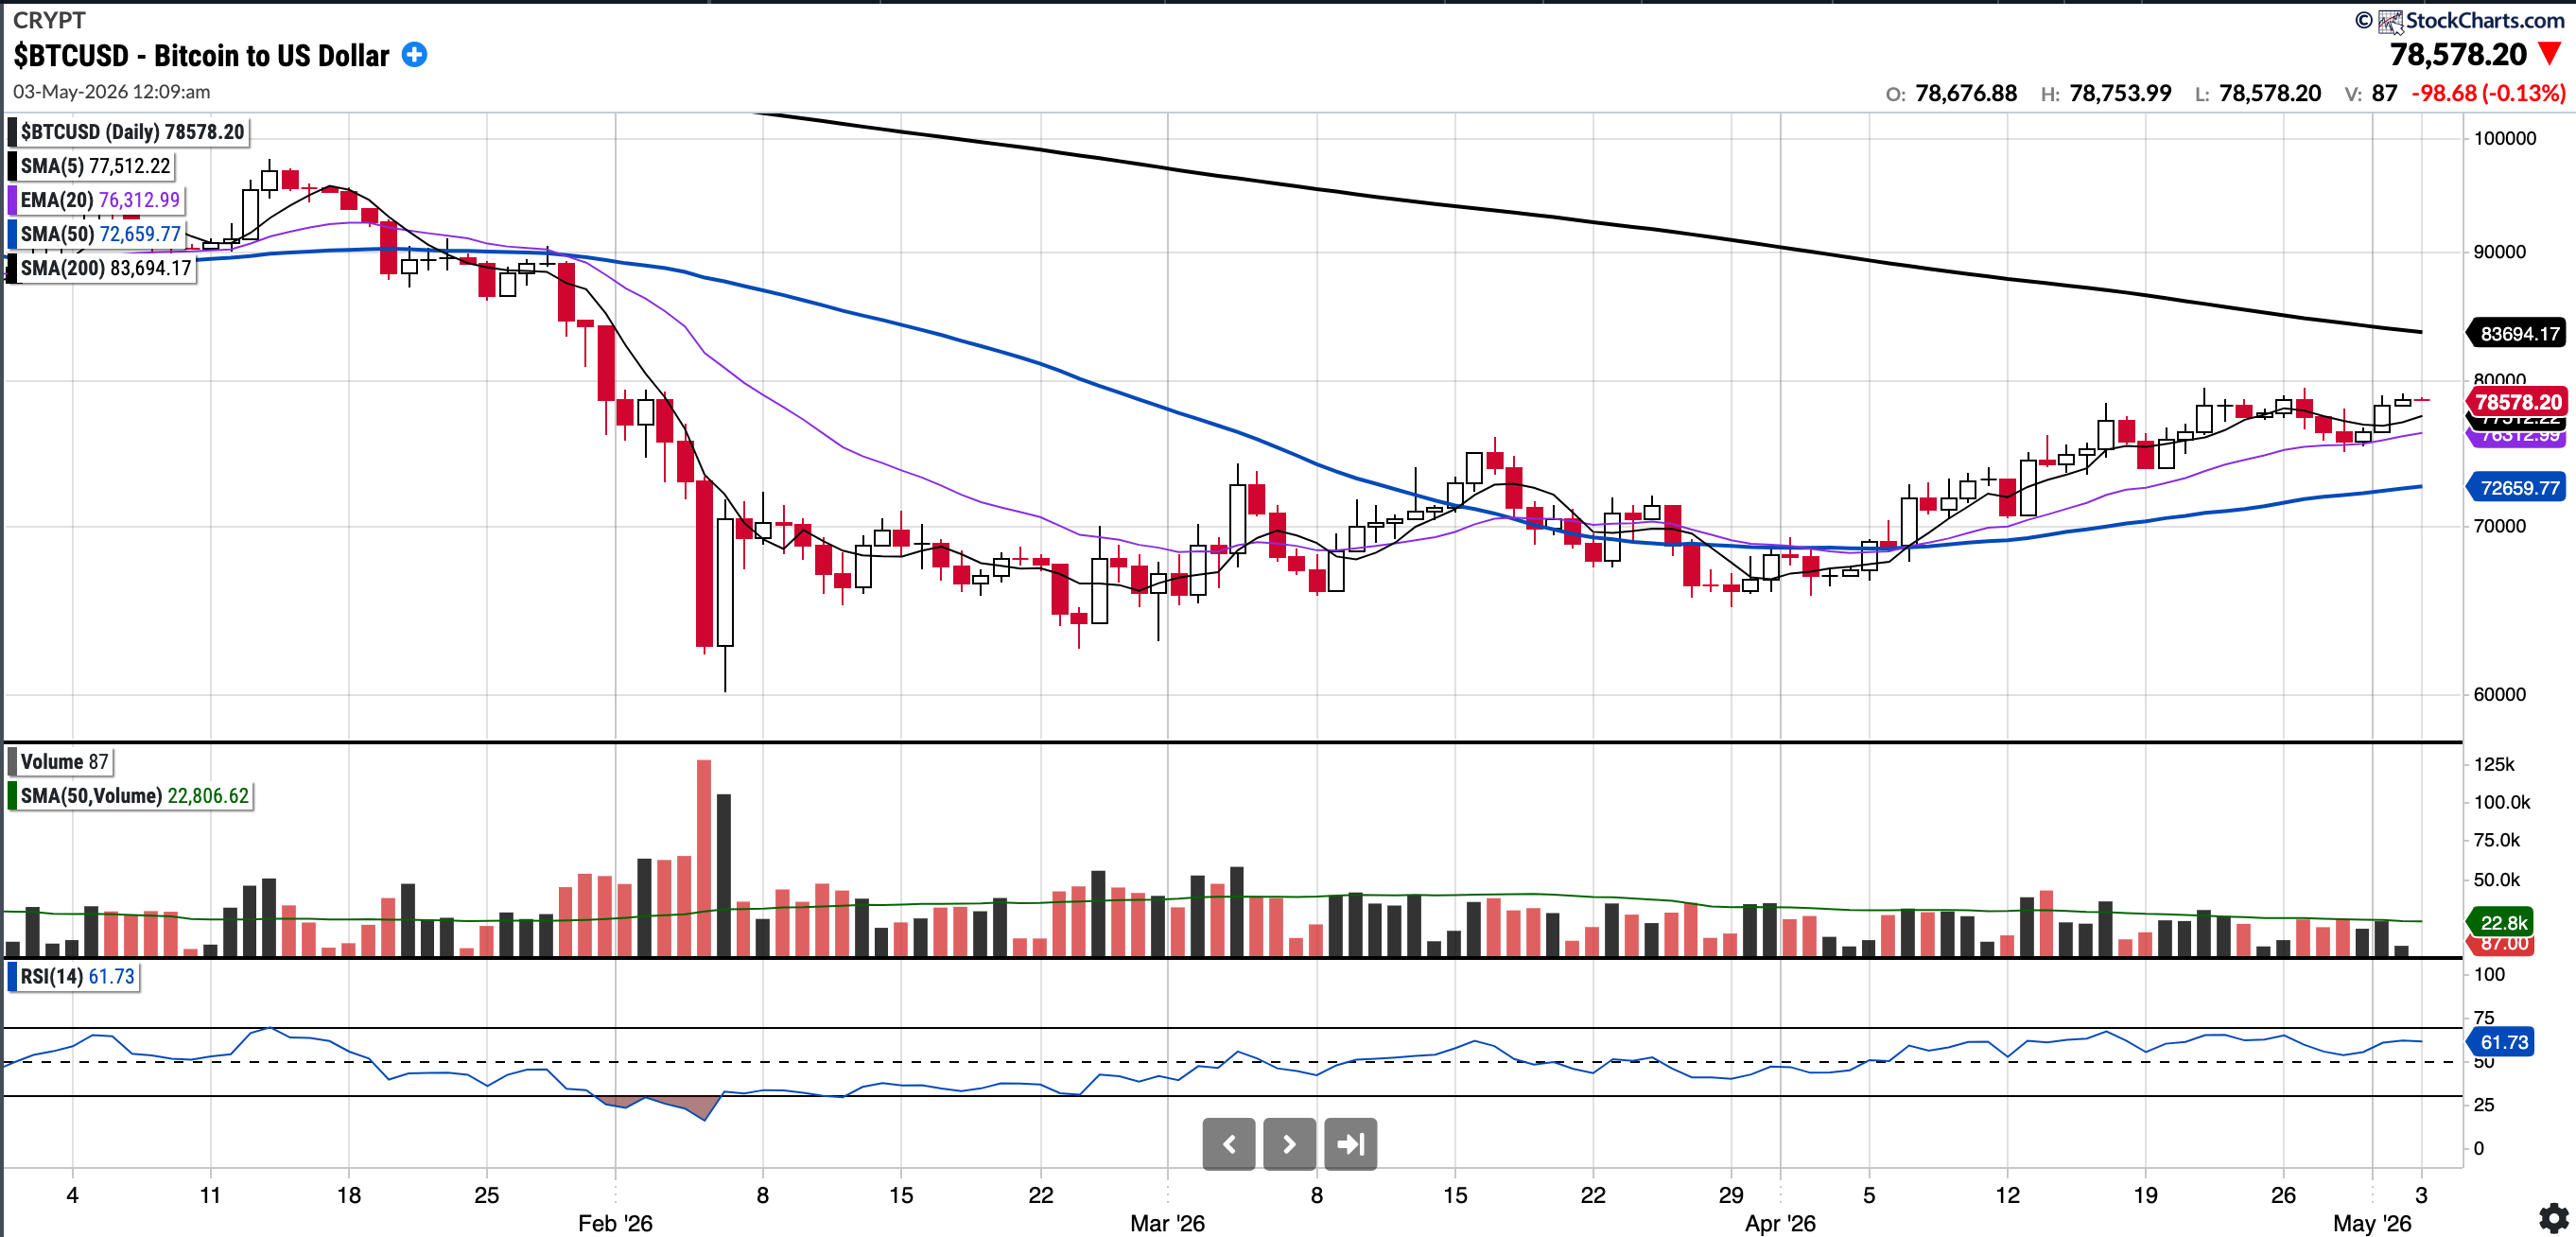
BTC (currently Long)
Currently trades at $78,578.20, 8.15% above the 50SMA and 6.11% below the 200SMA.
RSI 61.73
-11.45% YTD.
Since testing the 200-week moving average on Thursday, February 5th, Bitcoin has traded primarily within the $63,000–$70,000 range.
However, we broke out of that range and traded as high as $79,900 this week. As of Sunday at 01:20 BST, BTC is trading above all near-term moving averages and remains above the $74,000 level, which I previously noted as a key area. The 200-day moving average is also within grasp; if reclaimed, that would be very constructive. My suspicion is that, in the near term, it may serve as resistance.
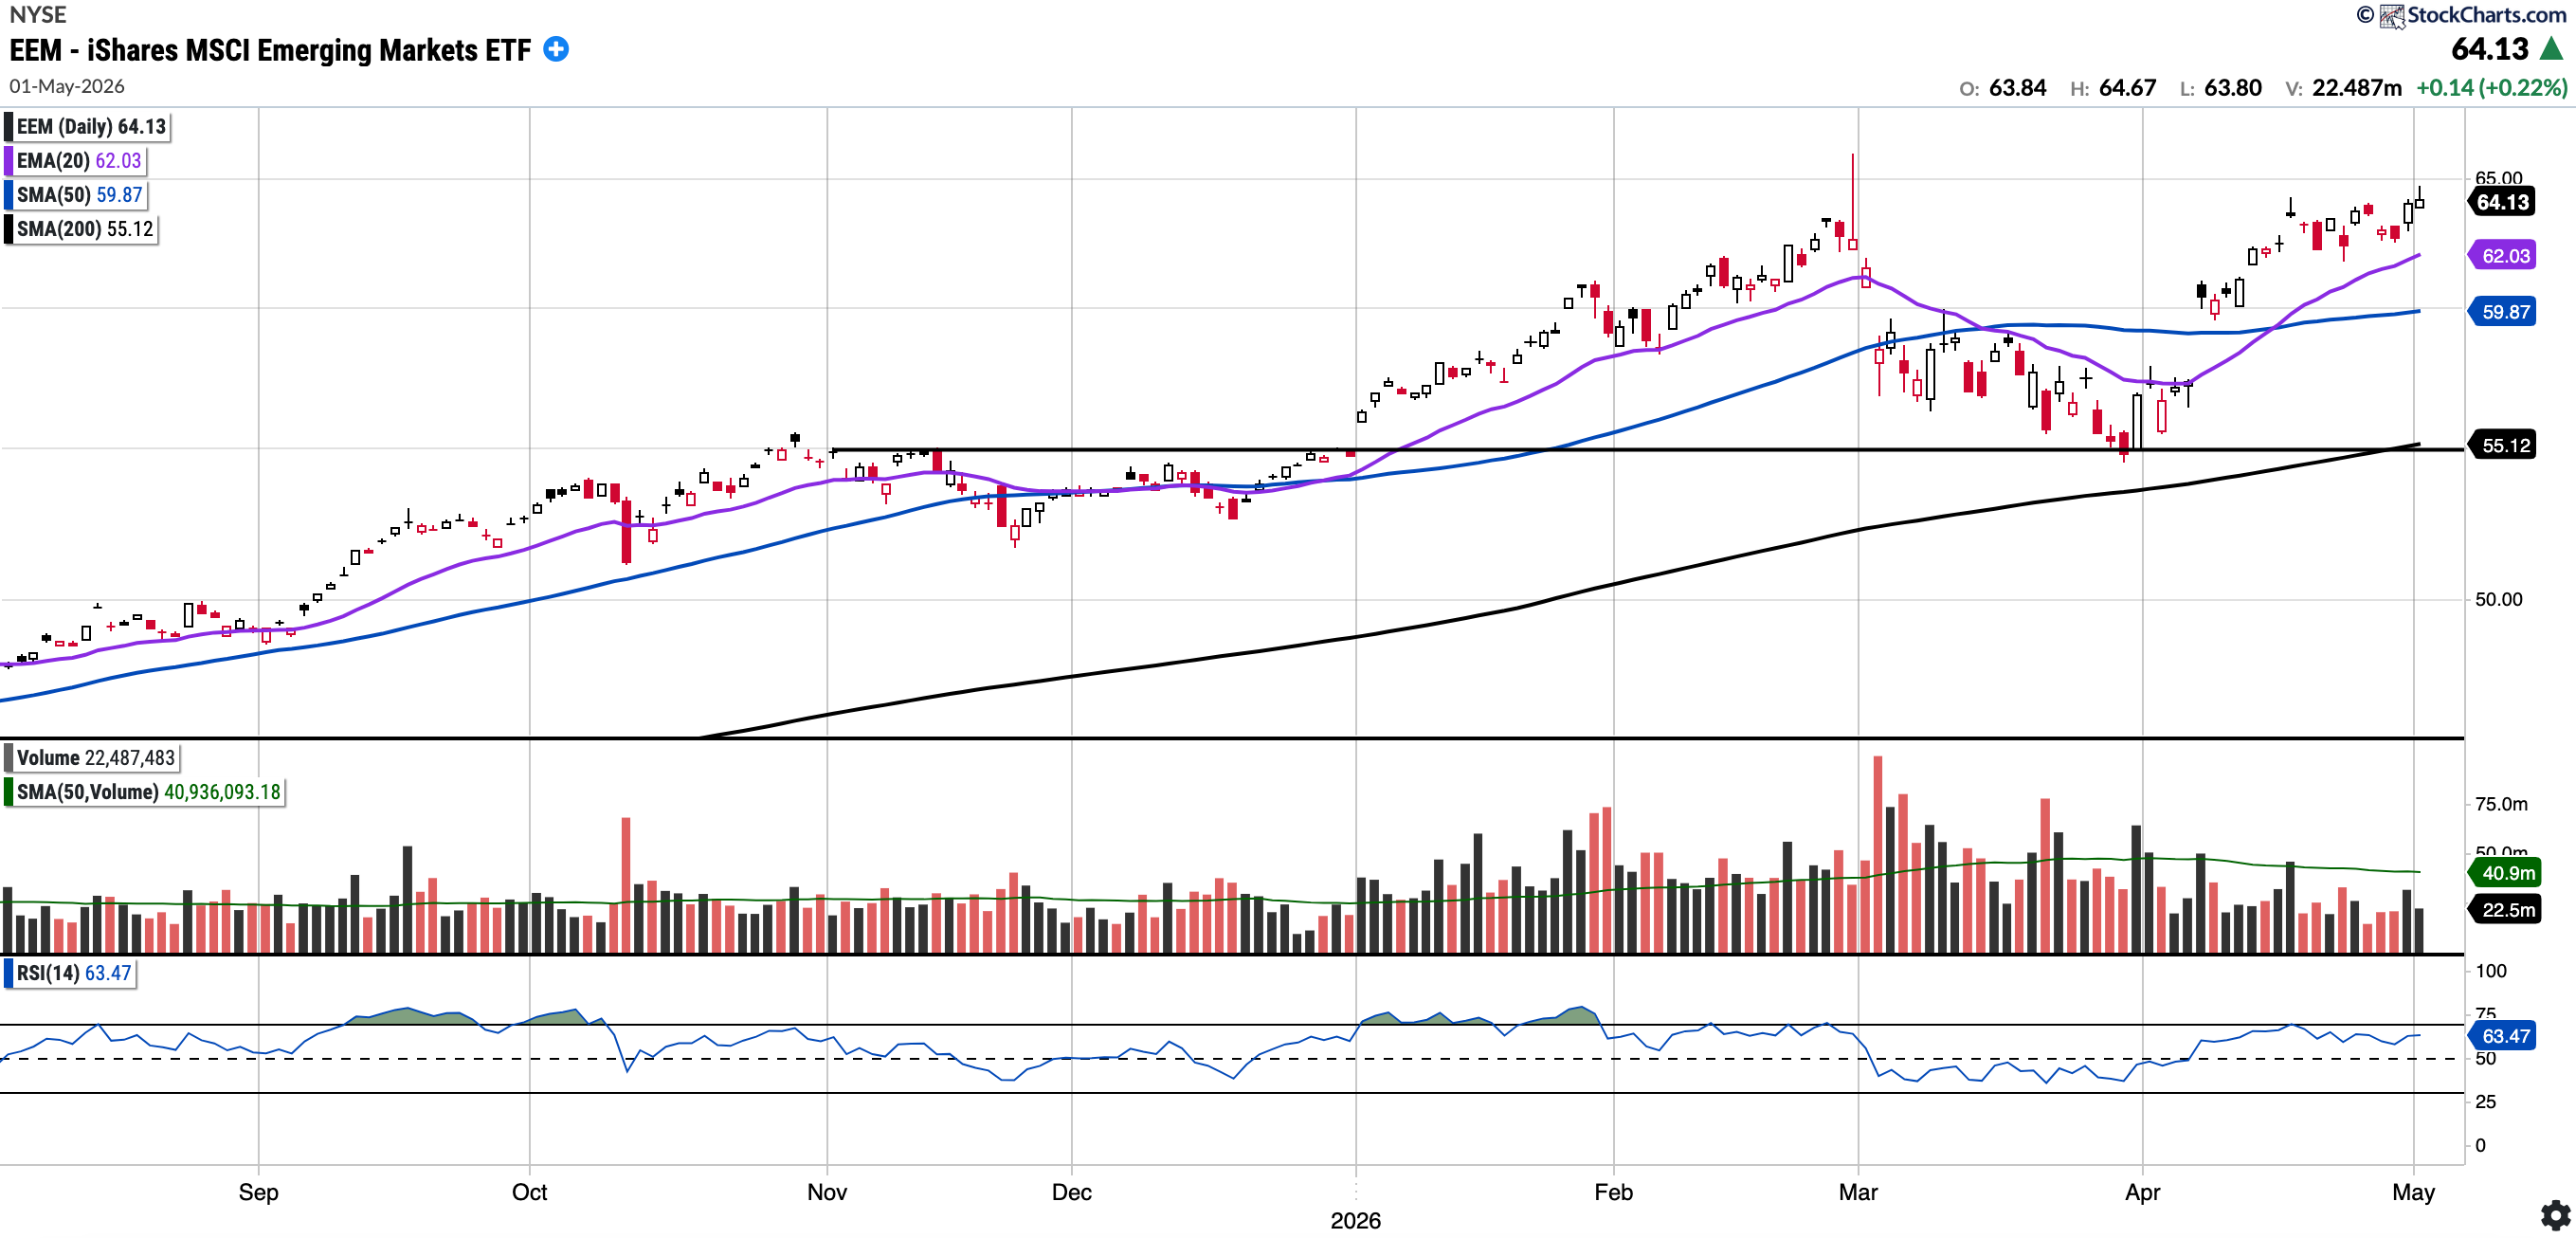
EEM
Currently trades at $64.13, 7.11% above the 50SMA and 16.34% above the 200SMA
RSI 63.47
+14.03% YTD
EEM remains in a strong uptrend and continues to outperform U.S. indices comfortably year-to-date by close to 850 bps.
The levels to watch for pullback buys are the SMA at 59.87 and then $55.00 (horizontal support). I do not expect it to trade as low as $55 again unless there are significant disturbances in the Middle East.
I believe EEM could be setting up for multi-year outperformance; hence, I continue to watch it closely. It looks set to breakout to new highs.
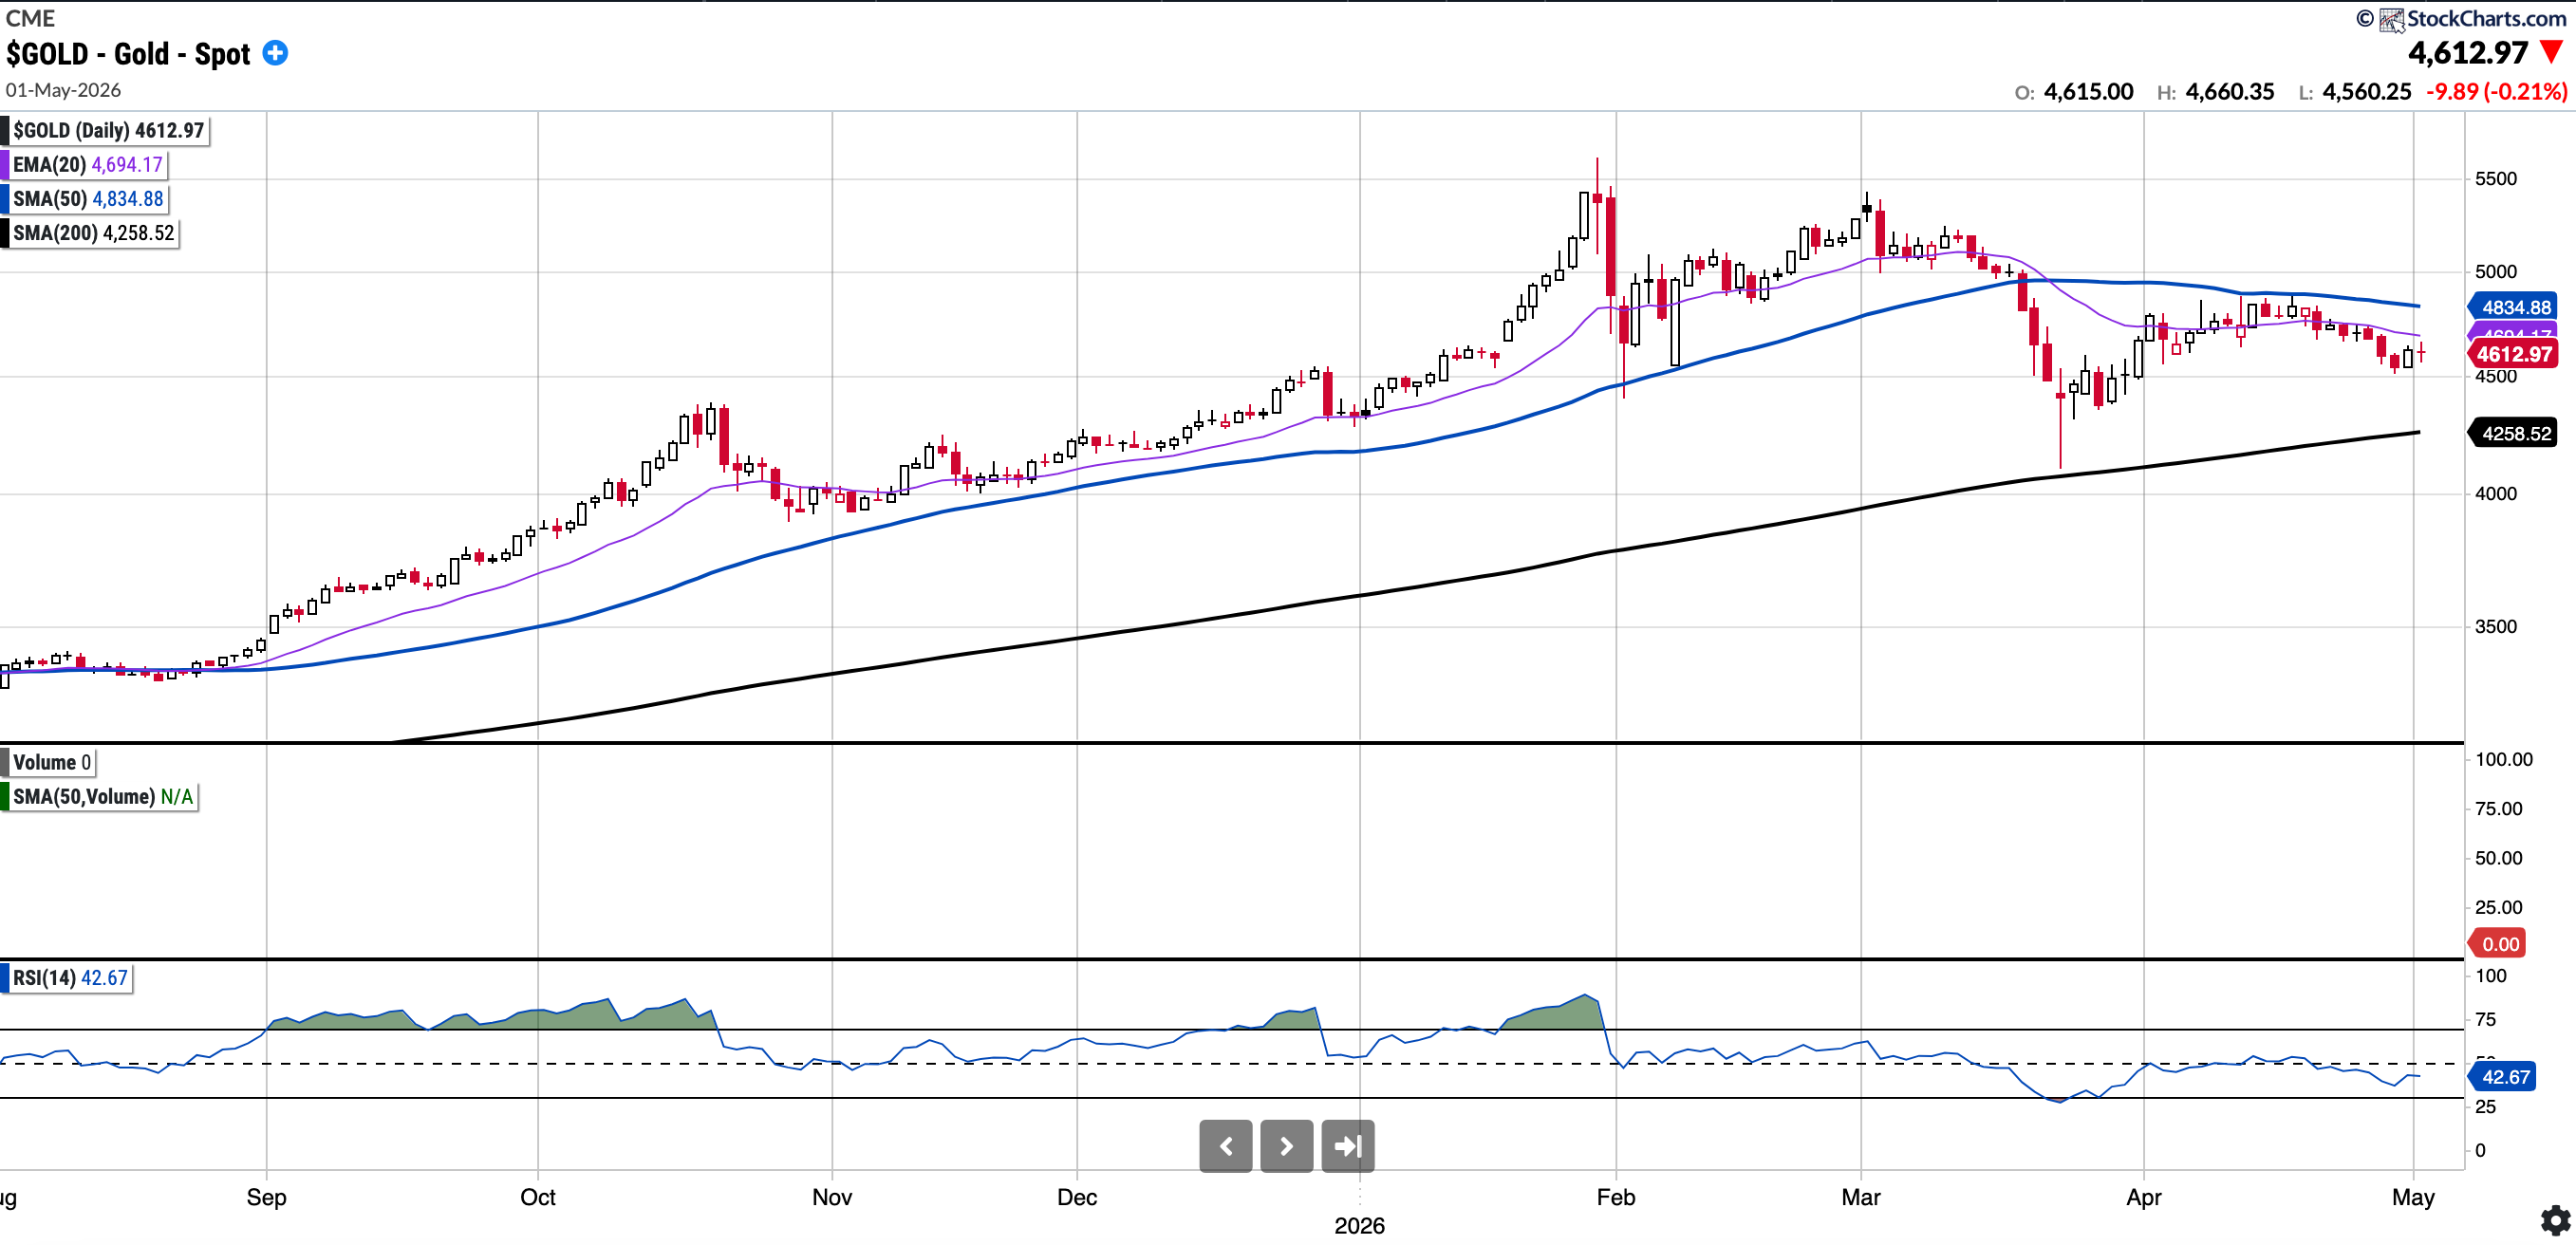
GOLD (Long Physical)
Currently trades at $4612.97, 4.59% below the 50SMA and 8.32% above the 200SMA
RSI 42.67
6.72% YTD
Gold remains in an uptrend, though it has started to consolidate below the overhead SMA 50, which is serving as a strong resistance level.
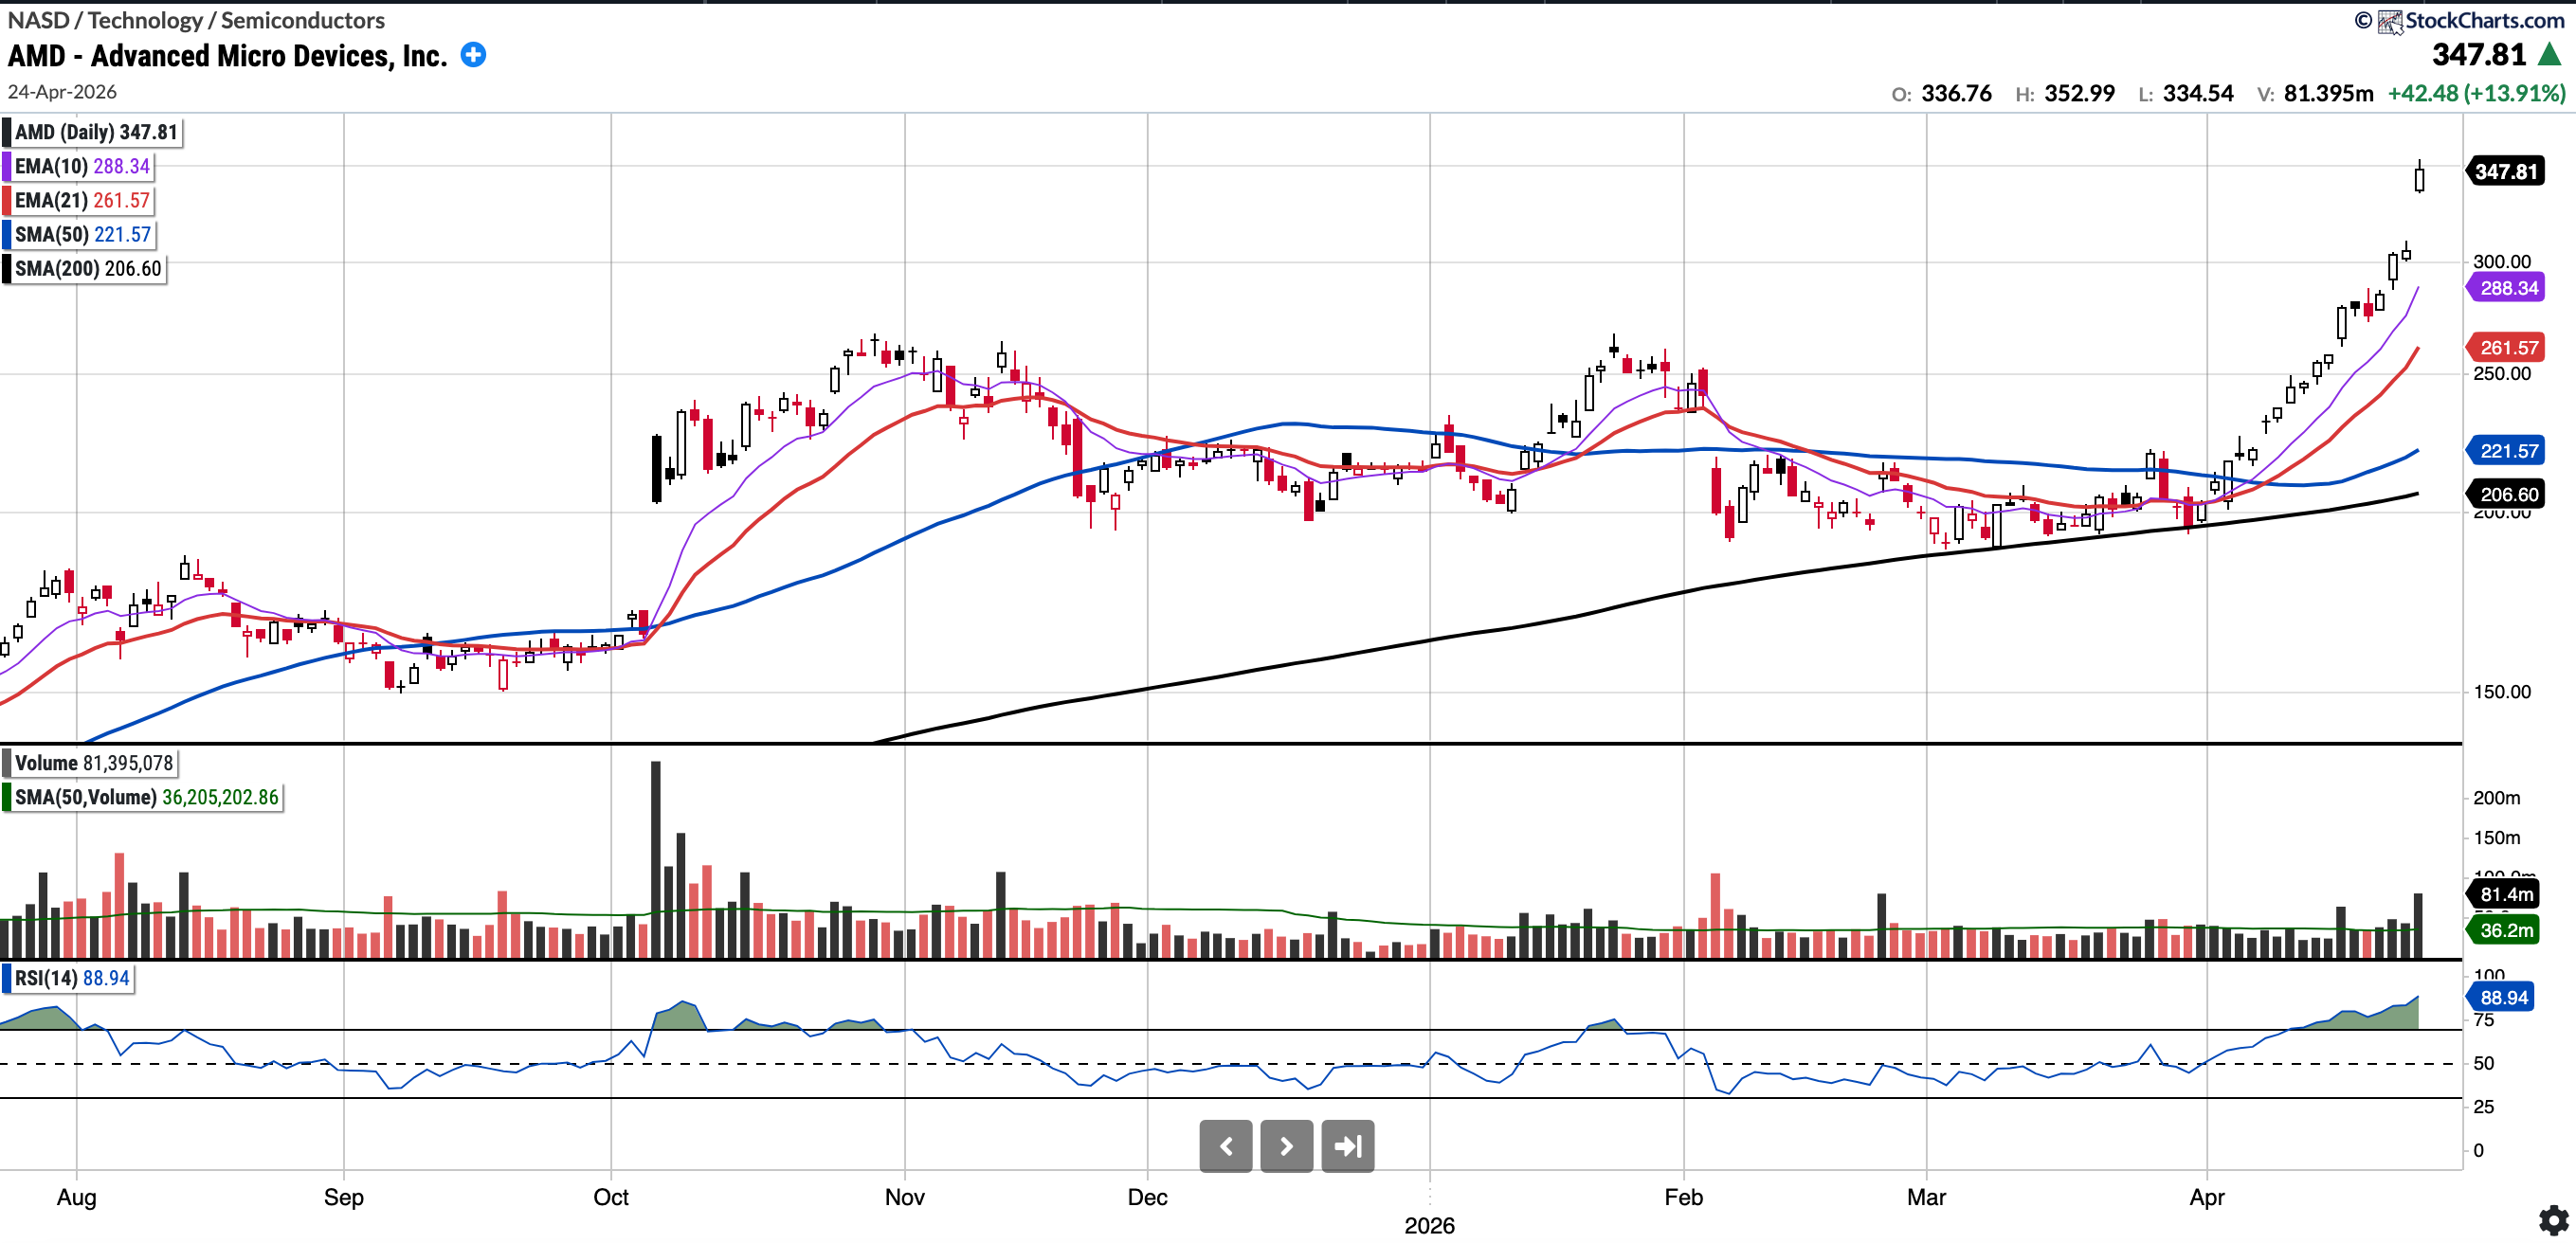
AMD and ARM
Currently trades at $347.81, 56.97% above the 50SMA and 68.35% above the 200SMA
RSI 88.94
+55.64% YTD
Last week about AMD I had written:
It is now trading at its highest valuation multiples in history across all metrics. This, combined with the parabolic short setup, has piqued shorts interest. A gap-up and fade may be the initial sign that AMD is due for a consolidation phase.
AMD did gap up and fade on Monday; by Tuesday morning, it had corrected more than 10% from Friday's high. However, it has bounced back remarkably to end the week at all-time highs. Not ideal for shorts who overstayed their welcome.
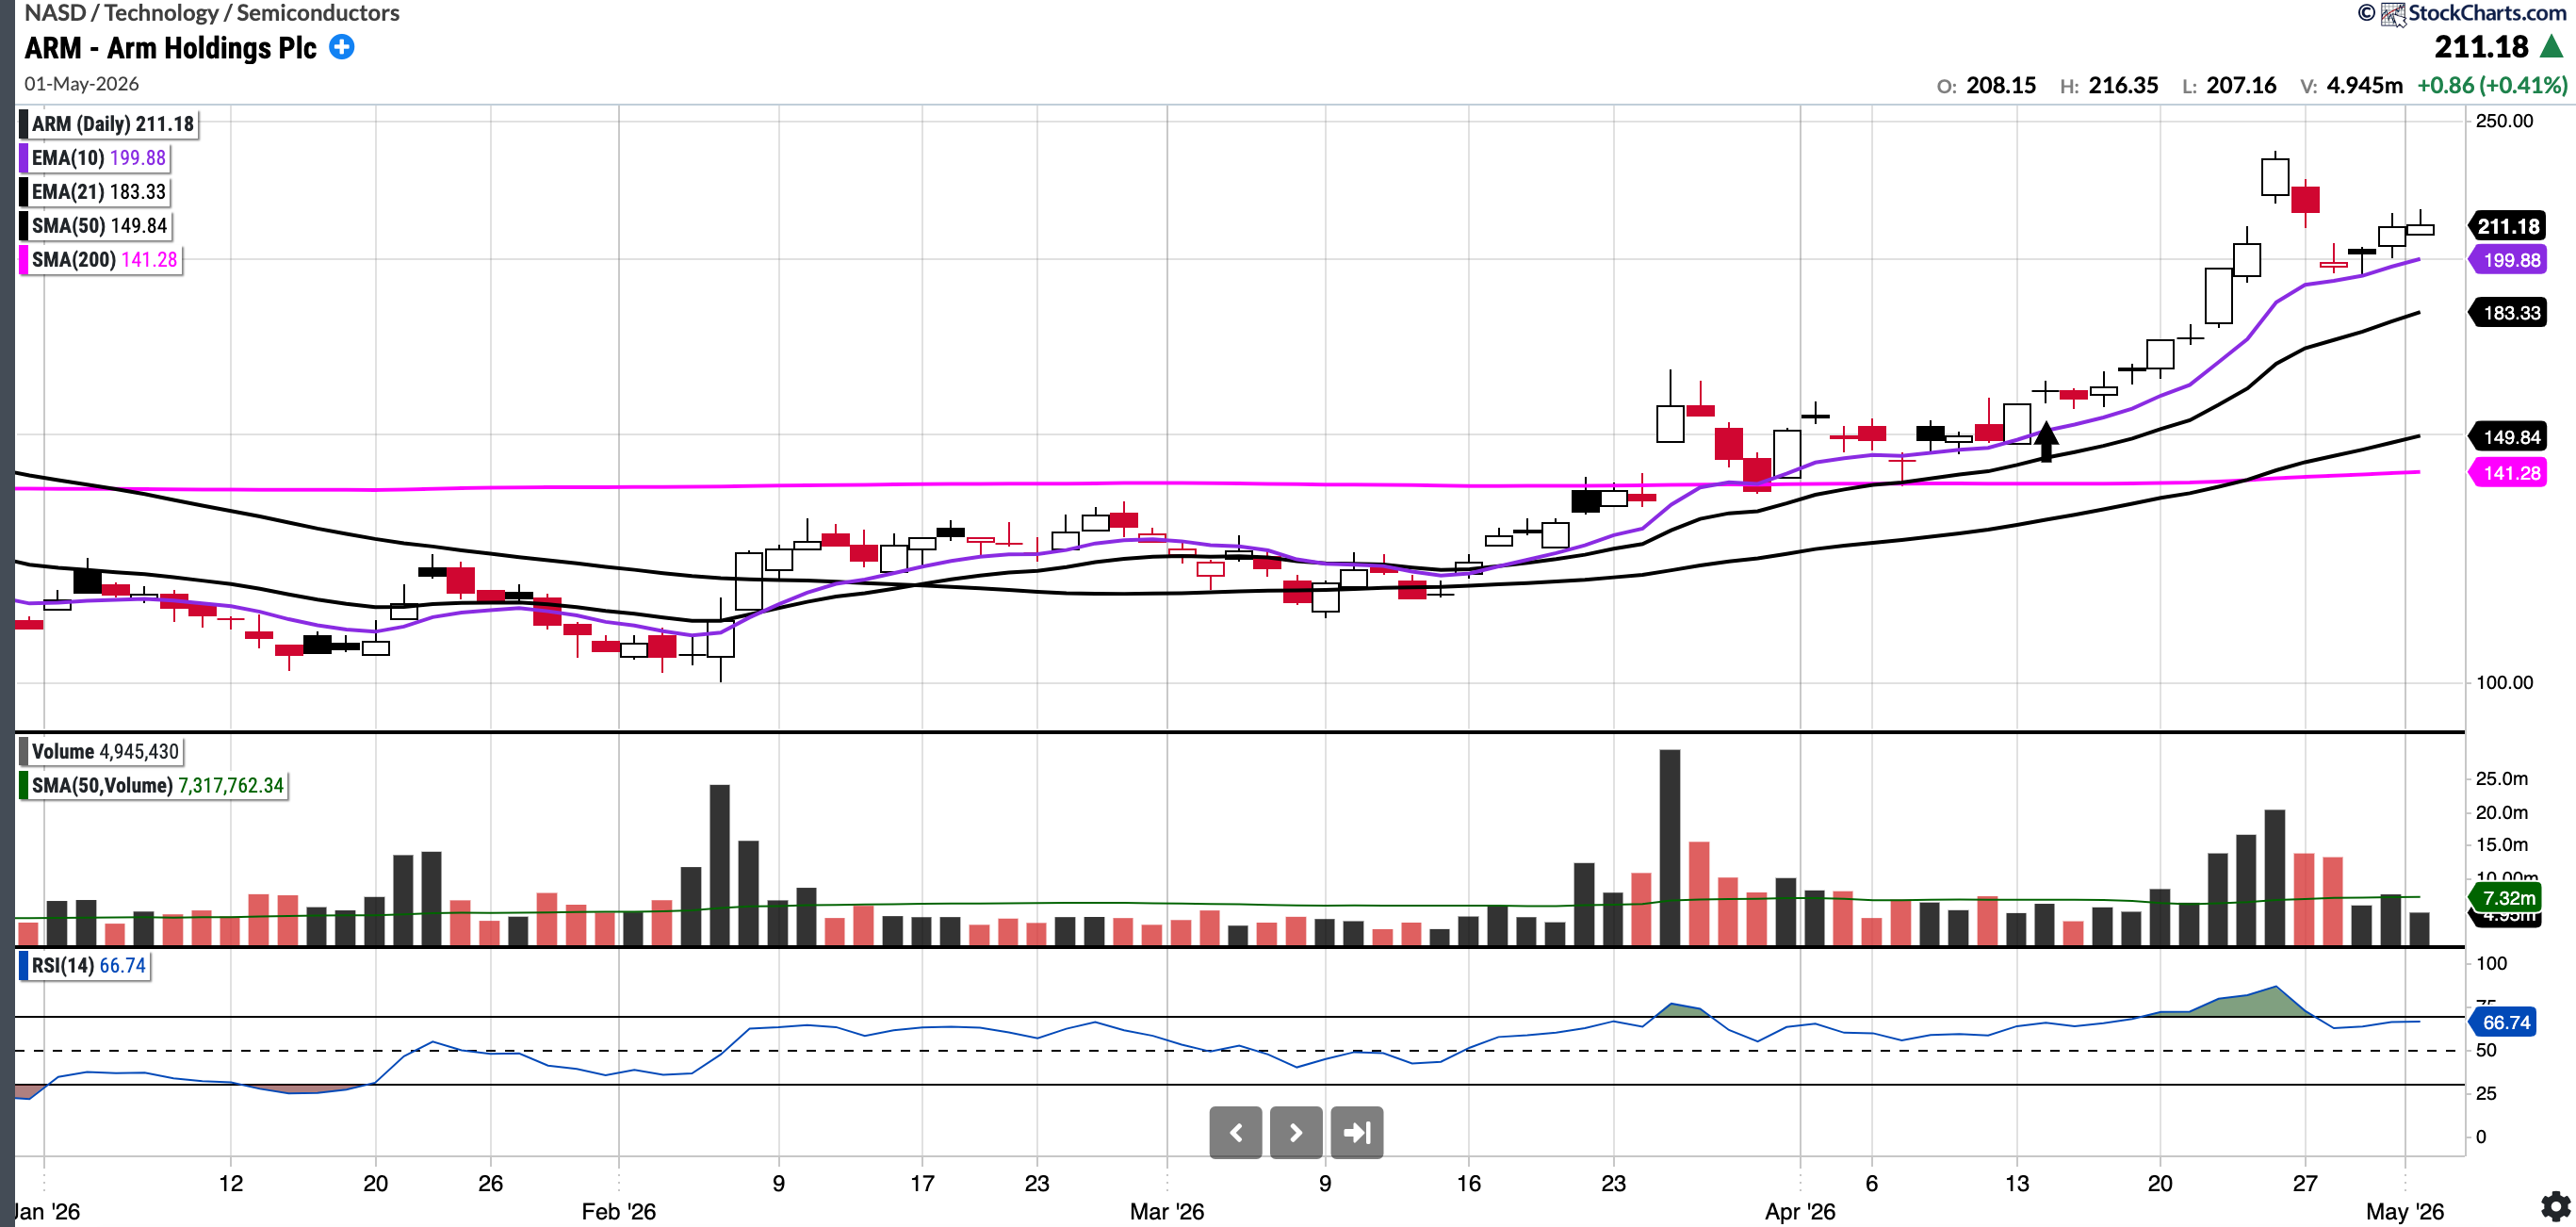
Since I’ve mentioned ARM over the past few weeks, I’ve included the updated chart below to close the loop. ARM was up 40% the previous week, but it pulled back about 6% this week to find support at the 10-day MA. ARM reports earnings Wednesday after the close, so I suggest managing your position ahead of that (trimming and trailing is one option)
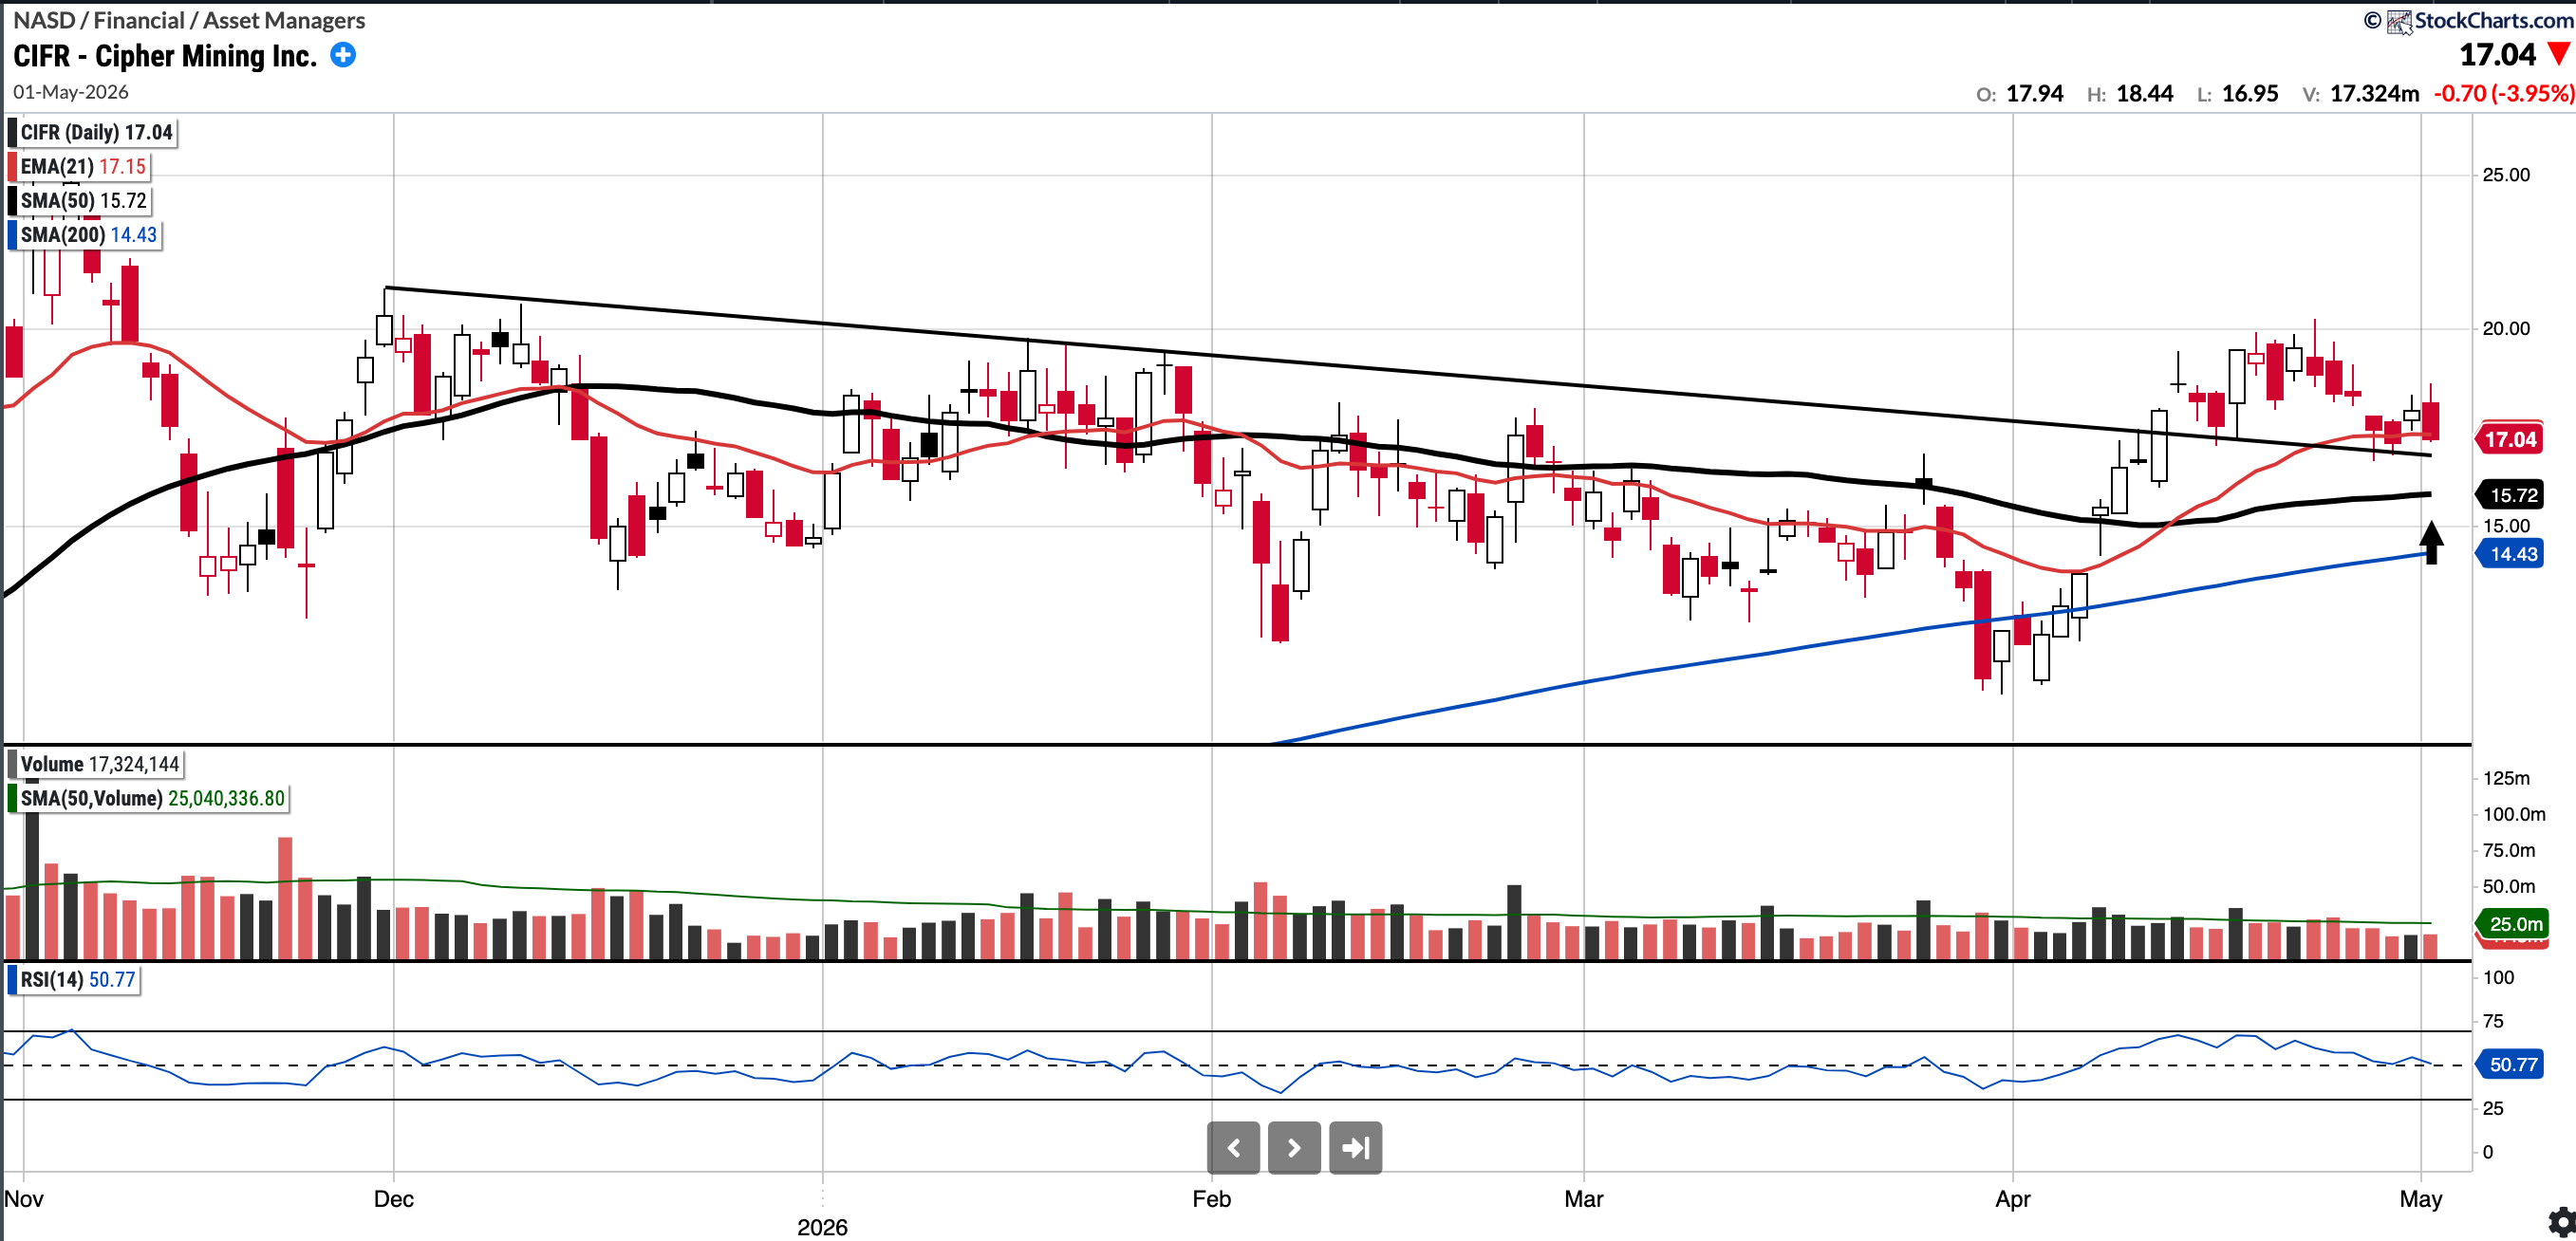
CIFR (Long)
Currently trades at $17.04, 8.38% above the 50SMA and 18.05% above the 200SMA
RSI 50.77
5.19% YTD
CIFR broke out above the descending trendline last week, although it finished the week back below it. I’m looking for a low-volume pullback to the 50-day SMA(see arrow), where I may add to my long starter position.
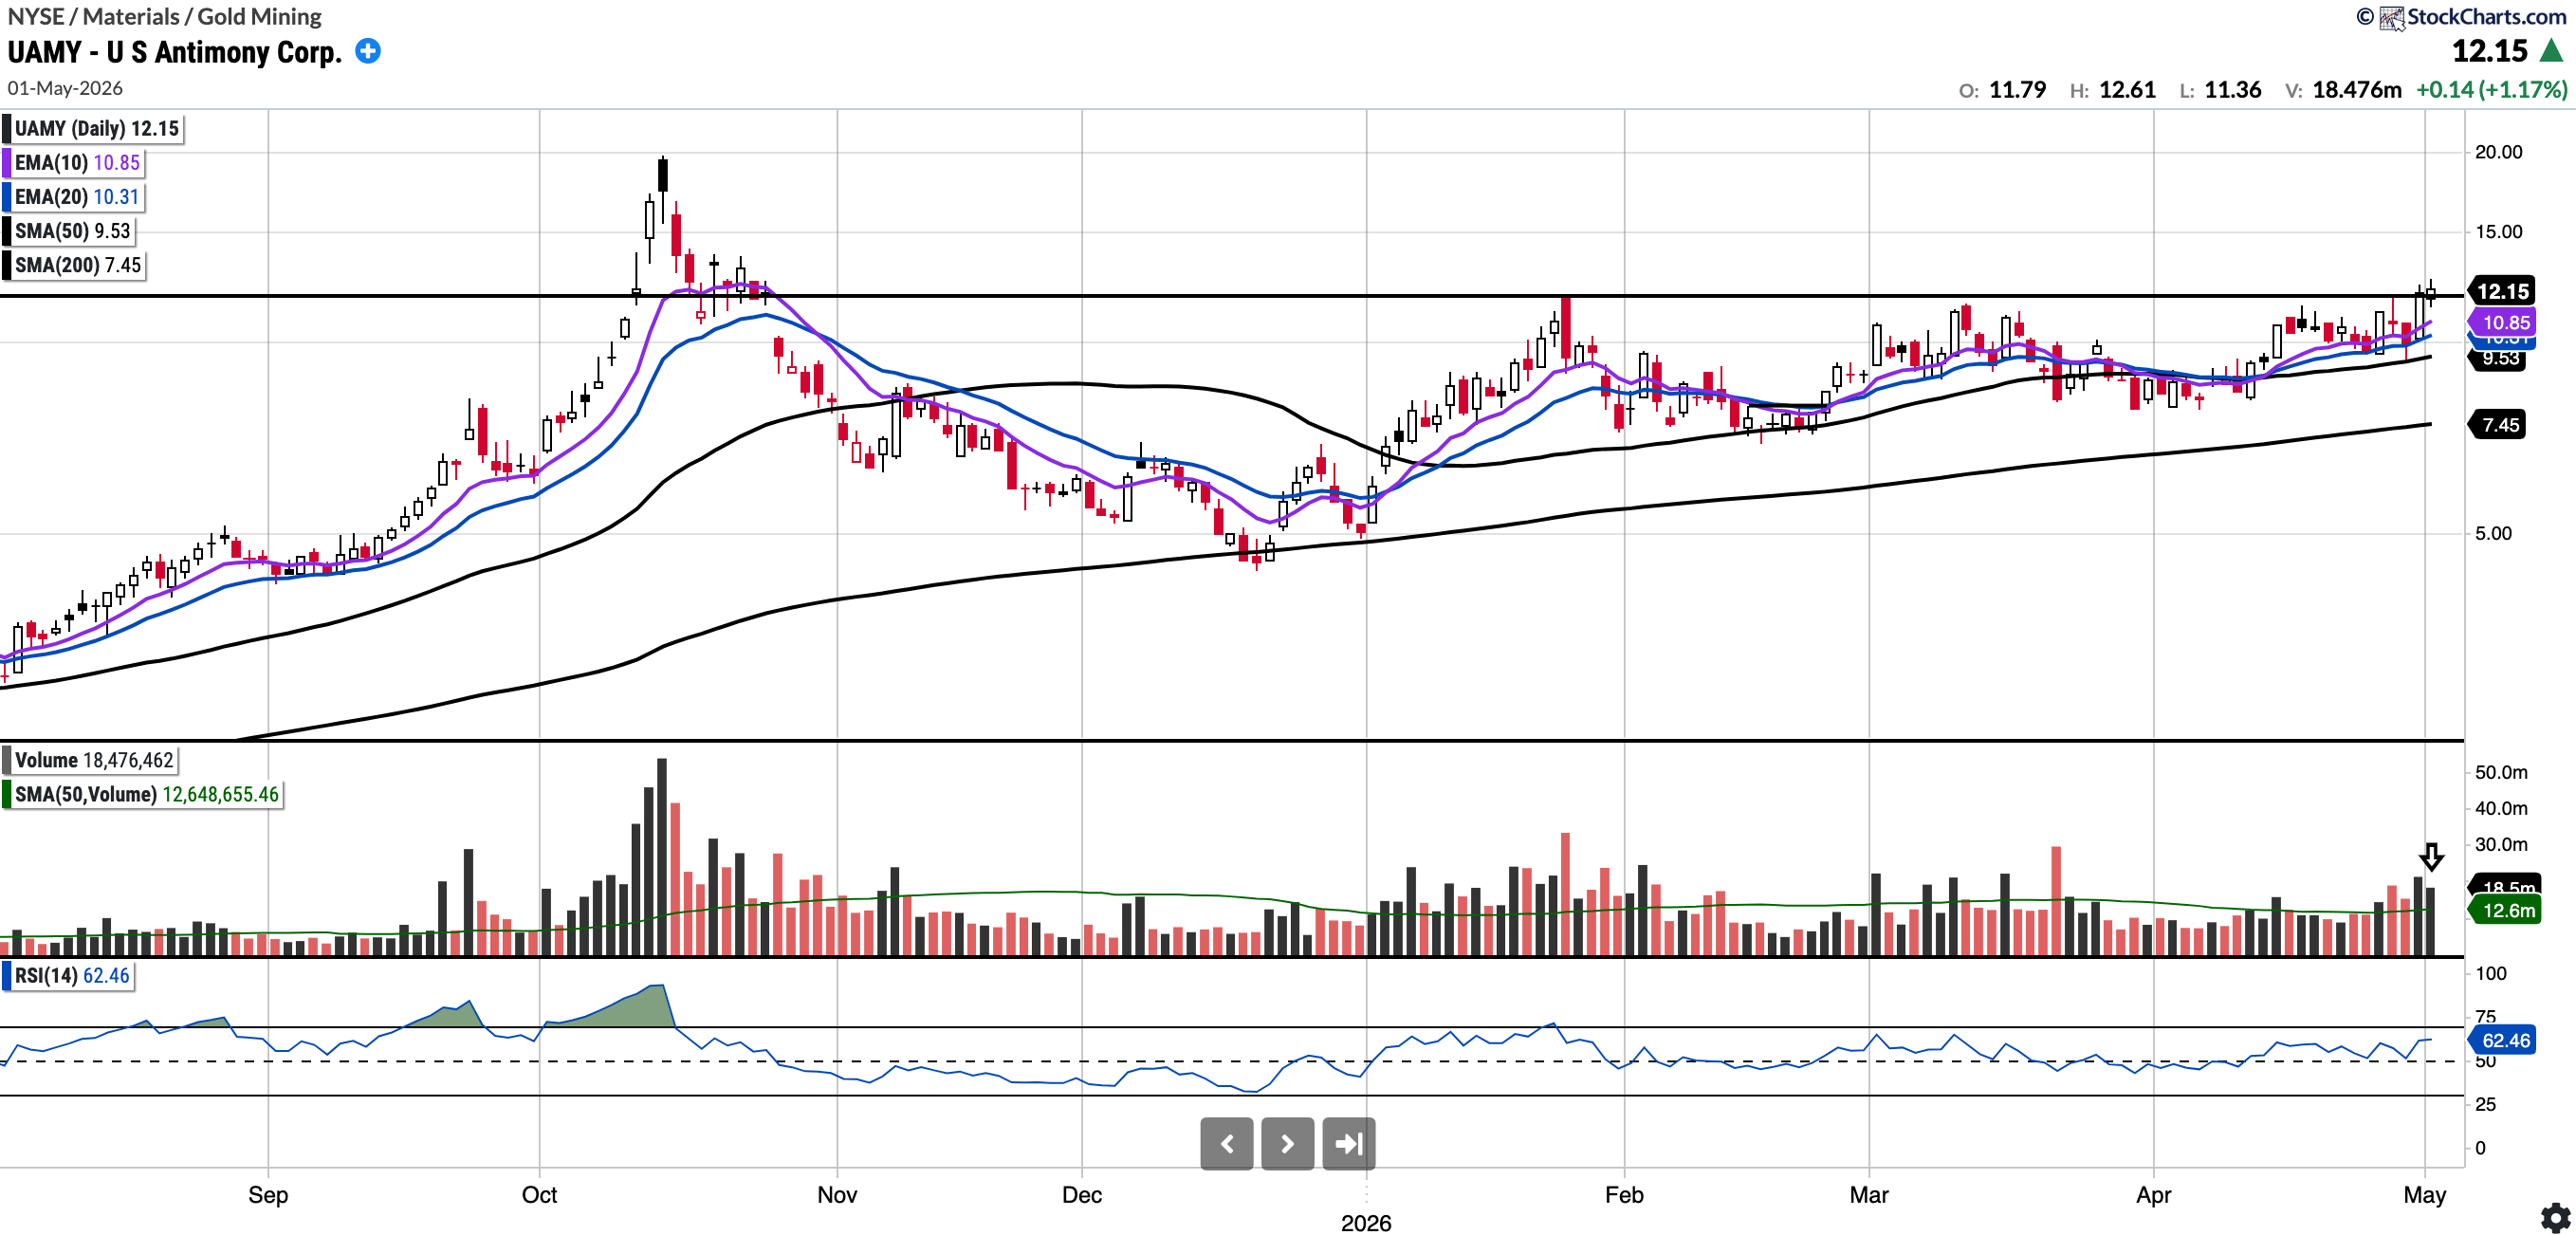
UAMY
Currently trades at $12.15, 27.44% above the 50SMA and 63.06% above the 200SMA
RSI 62.46
104.89% YTD
UAMY looks to breaking out of a multi-month base. Many others in the same sector also look very constructive (MP and USAR)
I will feature several other trading ideas in the Watchlist Snapshot post, so keep a look out for that. Last weeks post is below:
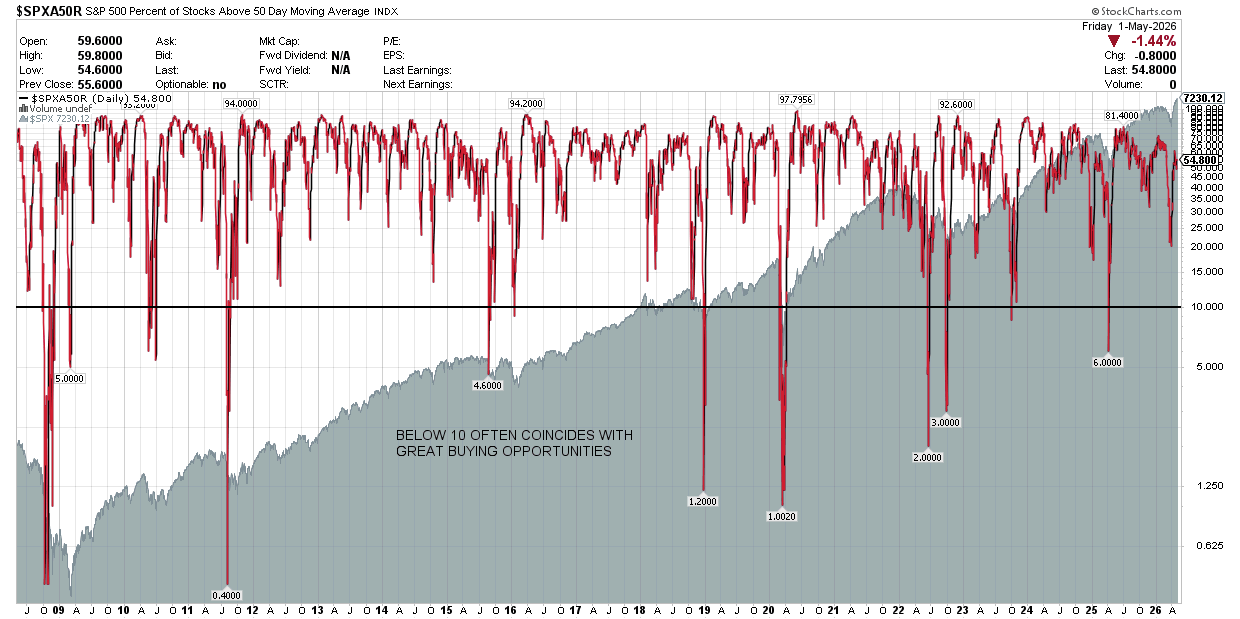
S&P 500 Percentage of Stocks Above the 50 Day Moving Average: Currently 54.8
Readings below 10 tend to be fantastic buying opportunities. We did get to 20 at the recent pico low on the SPX.
You will note that whilst the SPX closed at the highs, breadth is deteriorating.
Notable portfolio changes in previous week (all updated live in subscriber channels):
