
Preview of the Week Ahead: W/C May 11, 2026
SPX Closes at yet another All-Time High; Semis Most Overbought in History By Far (New Paradigm?)

Hope you all are having a good weekend. Below, we will be previewing the upcoming week’s events and providing a portfolio update as usual.
Format for what is covered in this weekly preview:
A Look at the Indices
Key Upcoming Economic Events
Upcoming Earnings Reports
Charts
Notable Portfolio Changes from the Previous Week
Current Portfolio Holdings
Position size, cost basis, and commentary on each holding regarding the intended holding period and any planned activity
Closing Thoughts
I recommend checking out the most recent Monthly Portfolio and Performance Update below:

Indices
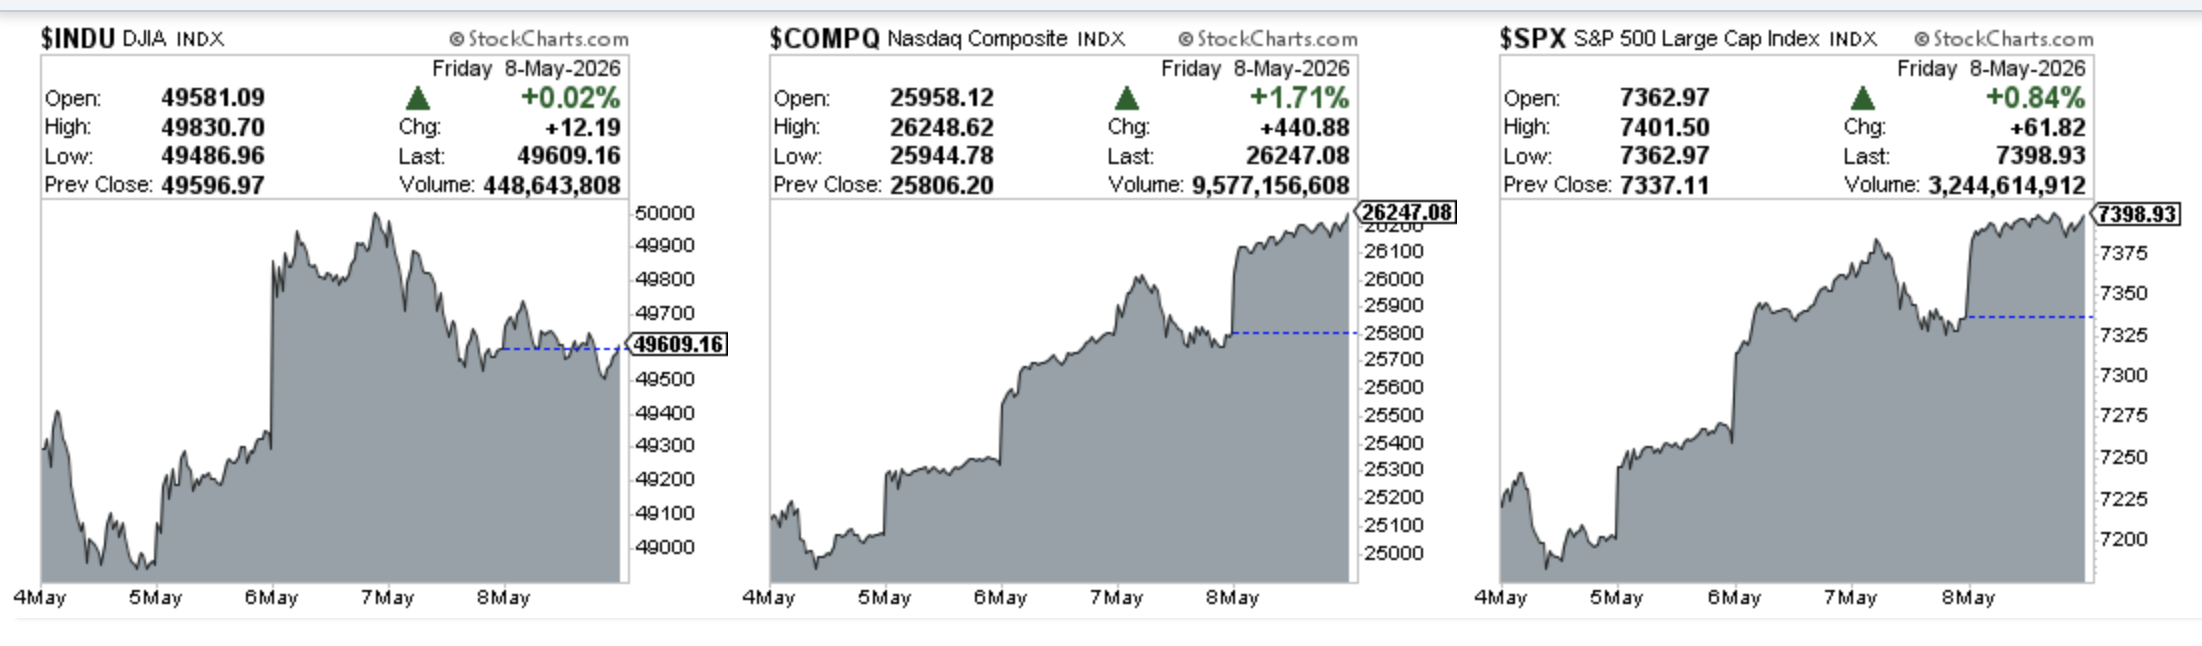
Dow Jones advanced 0.61% in the last week
S&P 500 advanced 2.47% in the last week
Nasdaq Composite advanced 4.47% in the last week
IWM advanced 1.81% in the last week
Key upcoming economic events
Monday, May 11
Existing Home Sales (April)
3-Year Note Auction
NY Fed Bill Purchases
Tuesday, May 12
Consumer Price Index (CPI) - April
NFIB Business Optimism Index
Total Household Debt (Q1)
Fed Speaker: Federal Reserve Bank of New York President John Williams is scheduled to speak.
Wednesday, May 13
Producer Price Index (PPI) - April
Thursday, May 14
Advance Retail Sales (April)
Initial Jobless Claims
Business Inventories
Import and Export Prices
Friday, May 15
Empire State Manufacturing Survey
Industrial Production and Capacity Utilisation:
Survey of Professional Forecasters: Quarterly release from the Philadelphia Fed detailing expectations for GDP and inflation.
Upcoming Earnings
Below is the infographic by Earnings Whispers highlighting the schedule for this week:

Charts
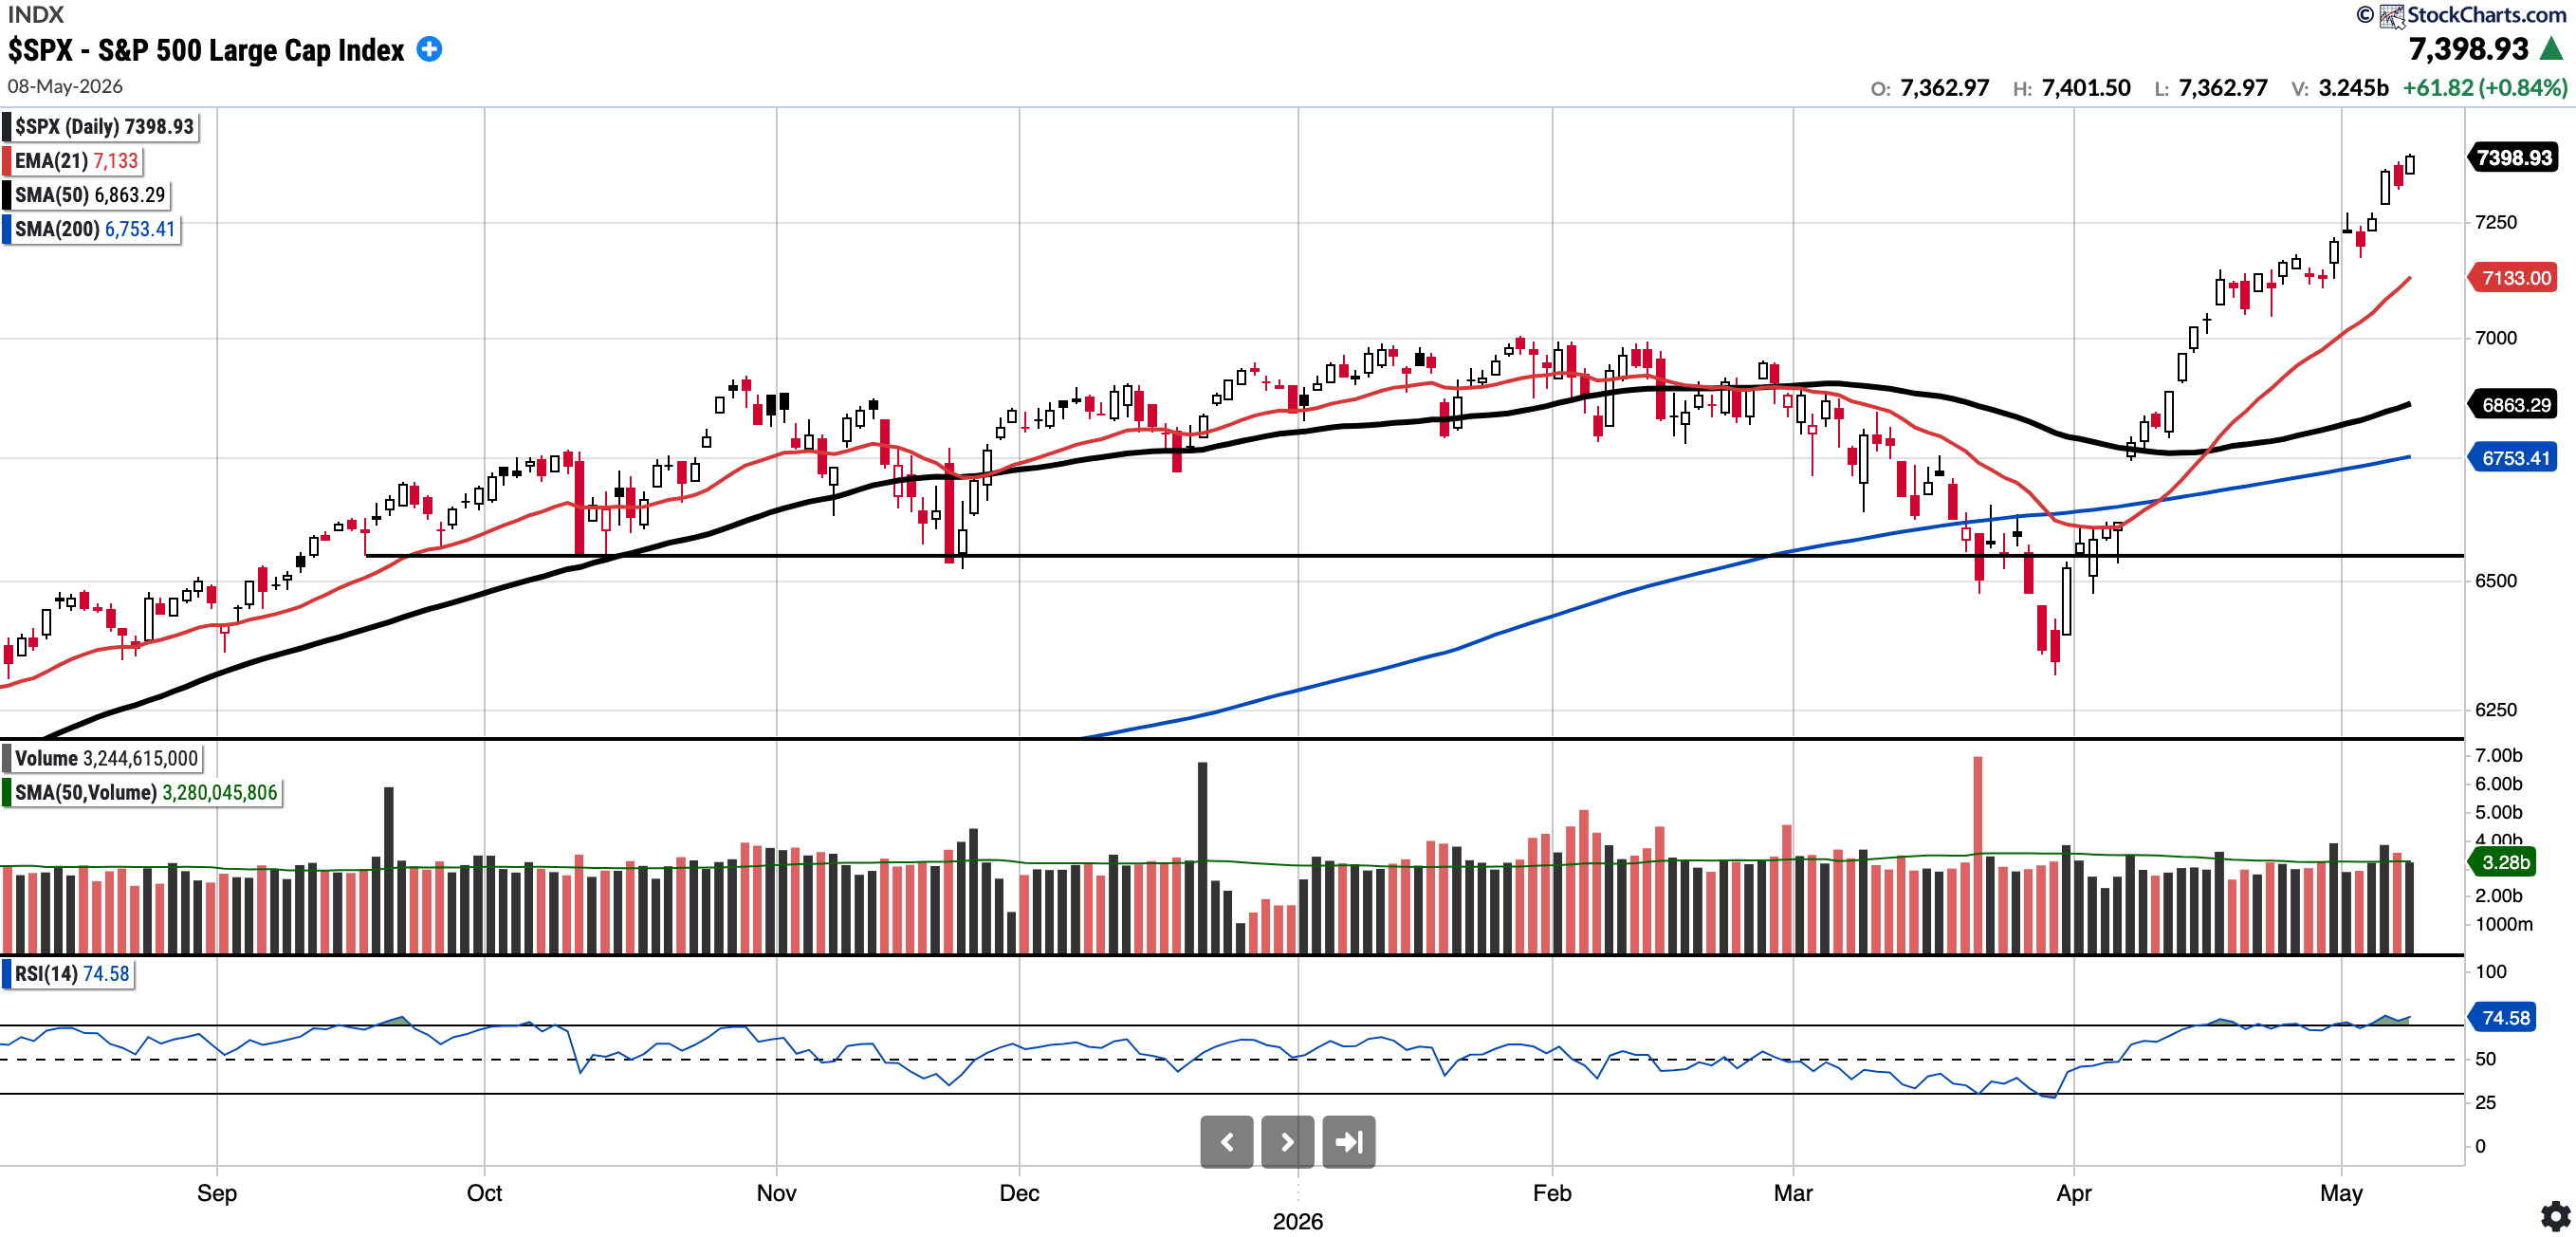
SPX
Currently trades at 7,389.93, 7.8% above the 50SMA and 9.56% above the 200SMA.
RSI 74.58
7.88% YTD
Distribution days in the last week: 0
The SPX reached another all-time high close, continuing the remarkable V-shaped recovery from the March 30 lows.
COMPQ
Currently trades at 26,247.08, 13.12% above the 50SMA and 14.98% above the 200SMA.
RSI 80.02
12.96% YTD
Distribution days in the last week: 0
The Nasdaq Composite, like the SPX, ended the week with an all-time high close. It remains quite extended, currently trading 9.55% above its 50-day SMA.

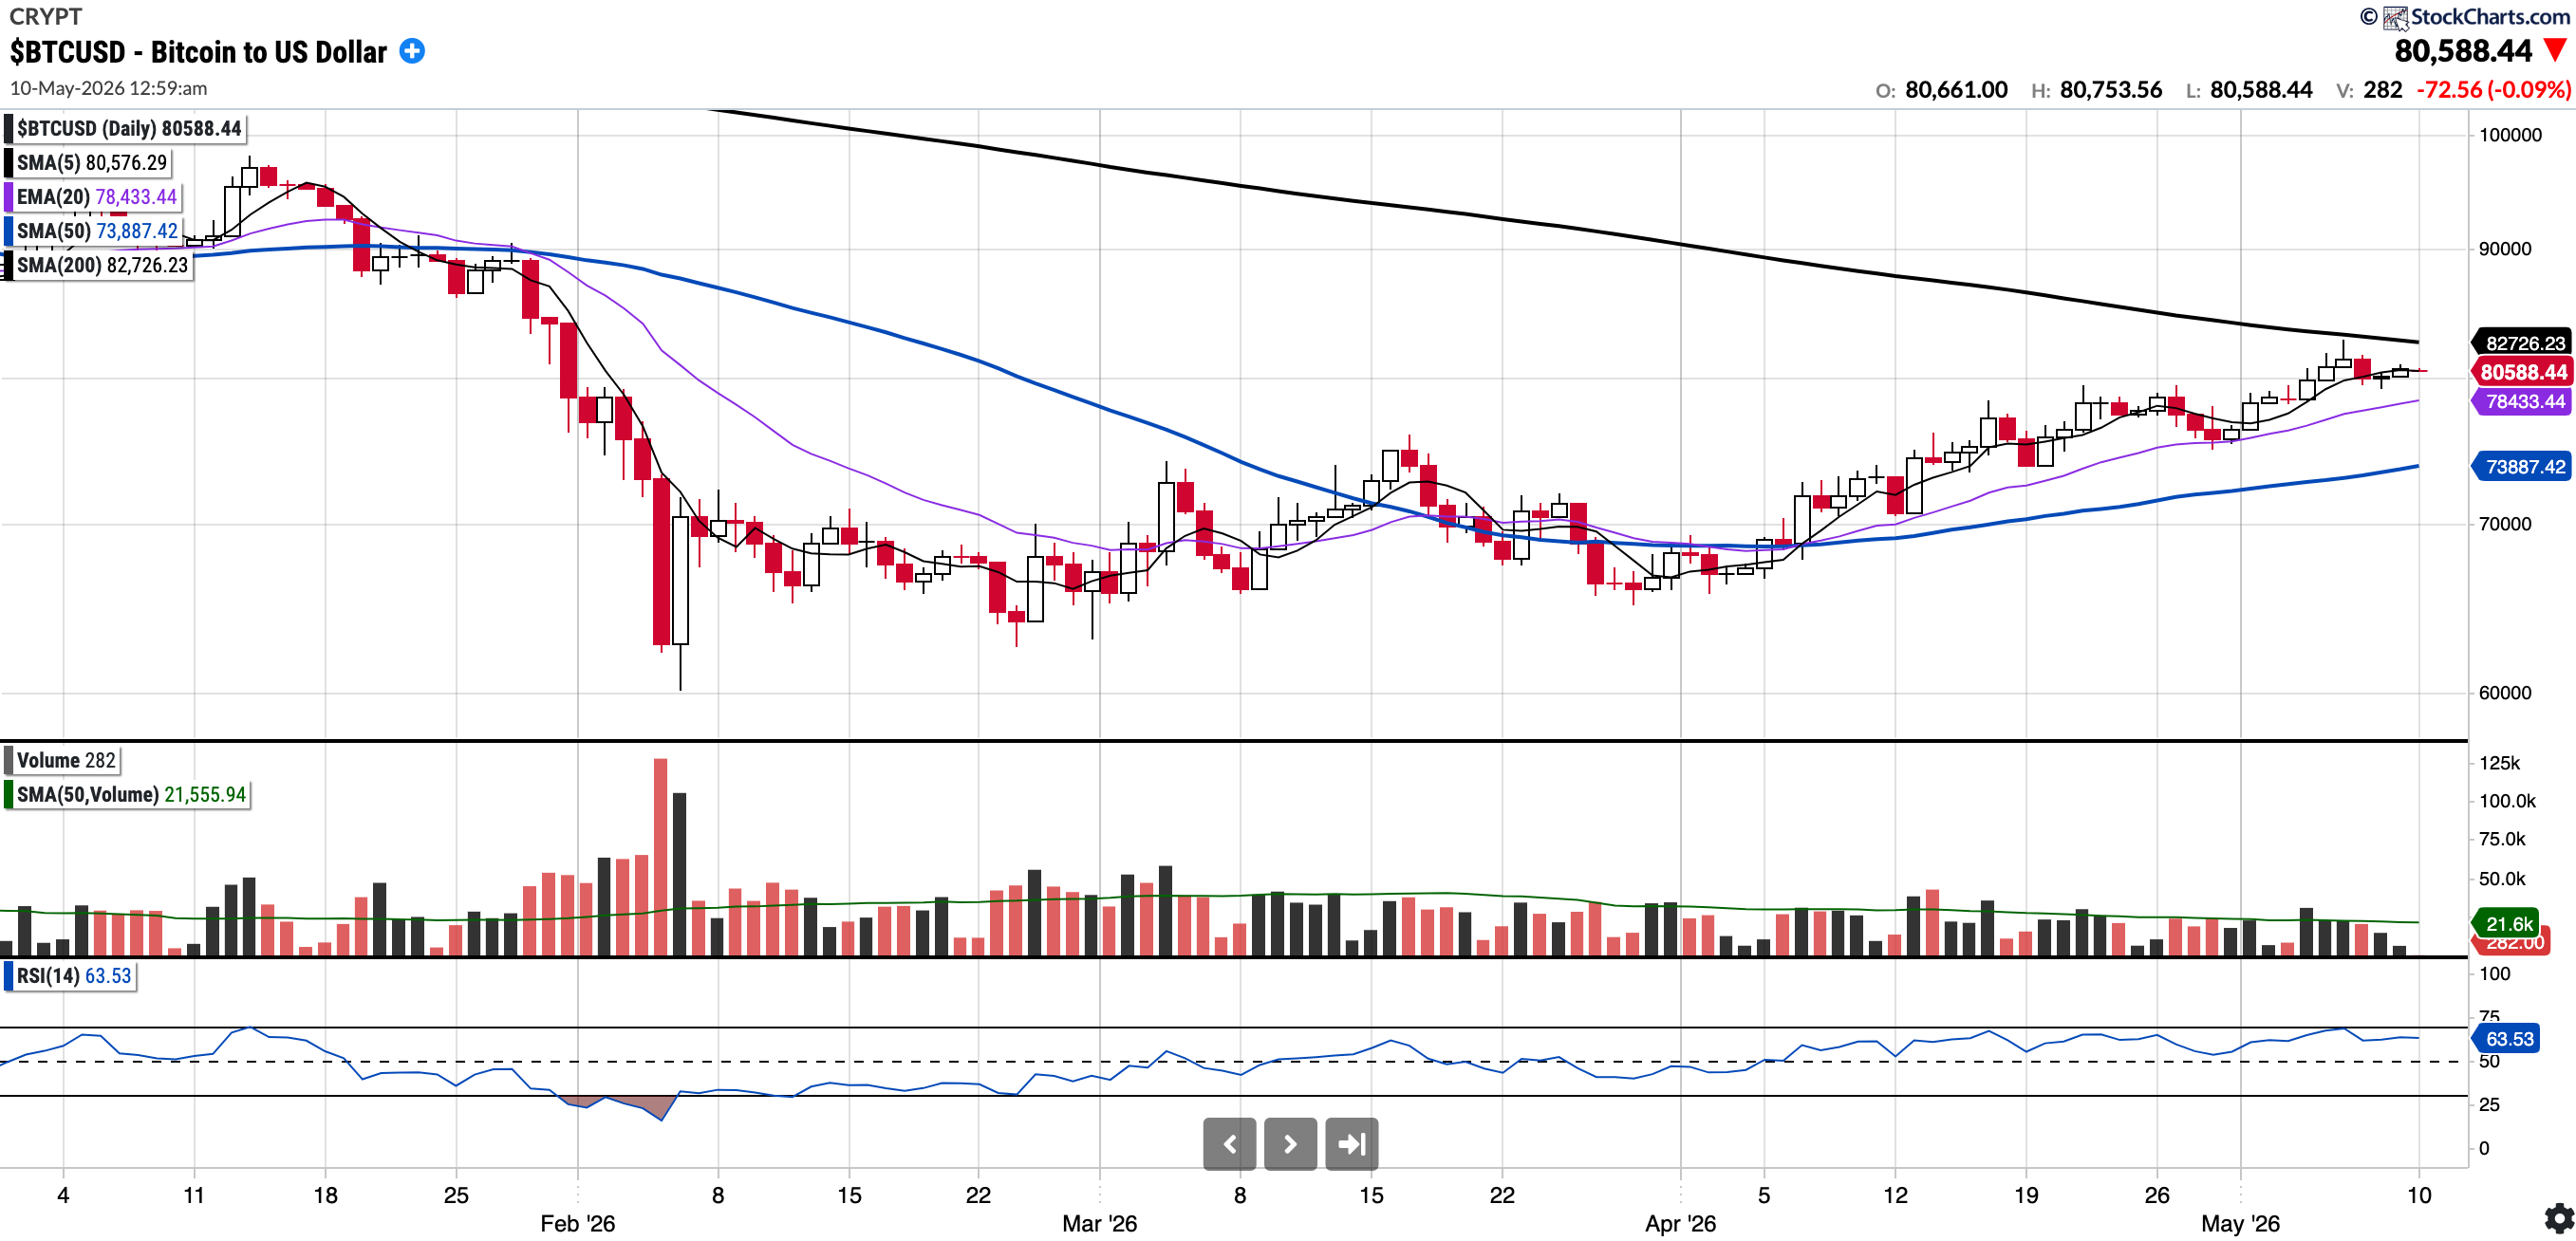
BTC (currently Long)
Currently trades at $78,578.20, 9.07% above the 50SMA and 2.58% below the 200SMA.
RSI 61.73
-9.18% YTD.
Since testing the 200-week moving average on Thursday, February 5th, Bitcoin has traded primarily within the $63,000–$70,000 range. However, we broke out of that consolidation this week, reaching highs of $82,900.
Last week I had written:
The 200-day moving average is also within grasp; if reclaimed, that would be very constructive. My suspicion is that, in the near term, it may serve as resistance.
We did find resistance at the 200-day (see chart); however, given the more constructive price action of late and the likelihood of the Clarity Act passing, BTC may reclaim the 200-day soon.
As of Sunday at 02:04 BST, BTC is trading above all near-term moving averages and remains comfortably above the $74,000 level, which I previously noted as a key area.
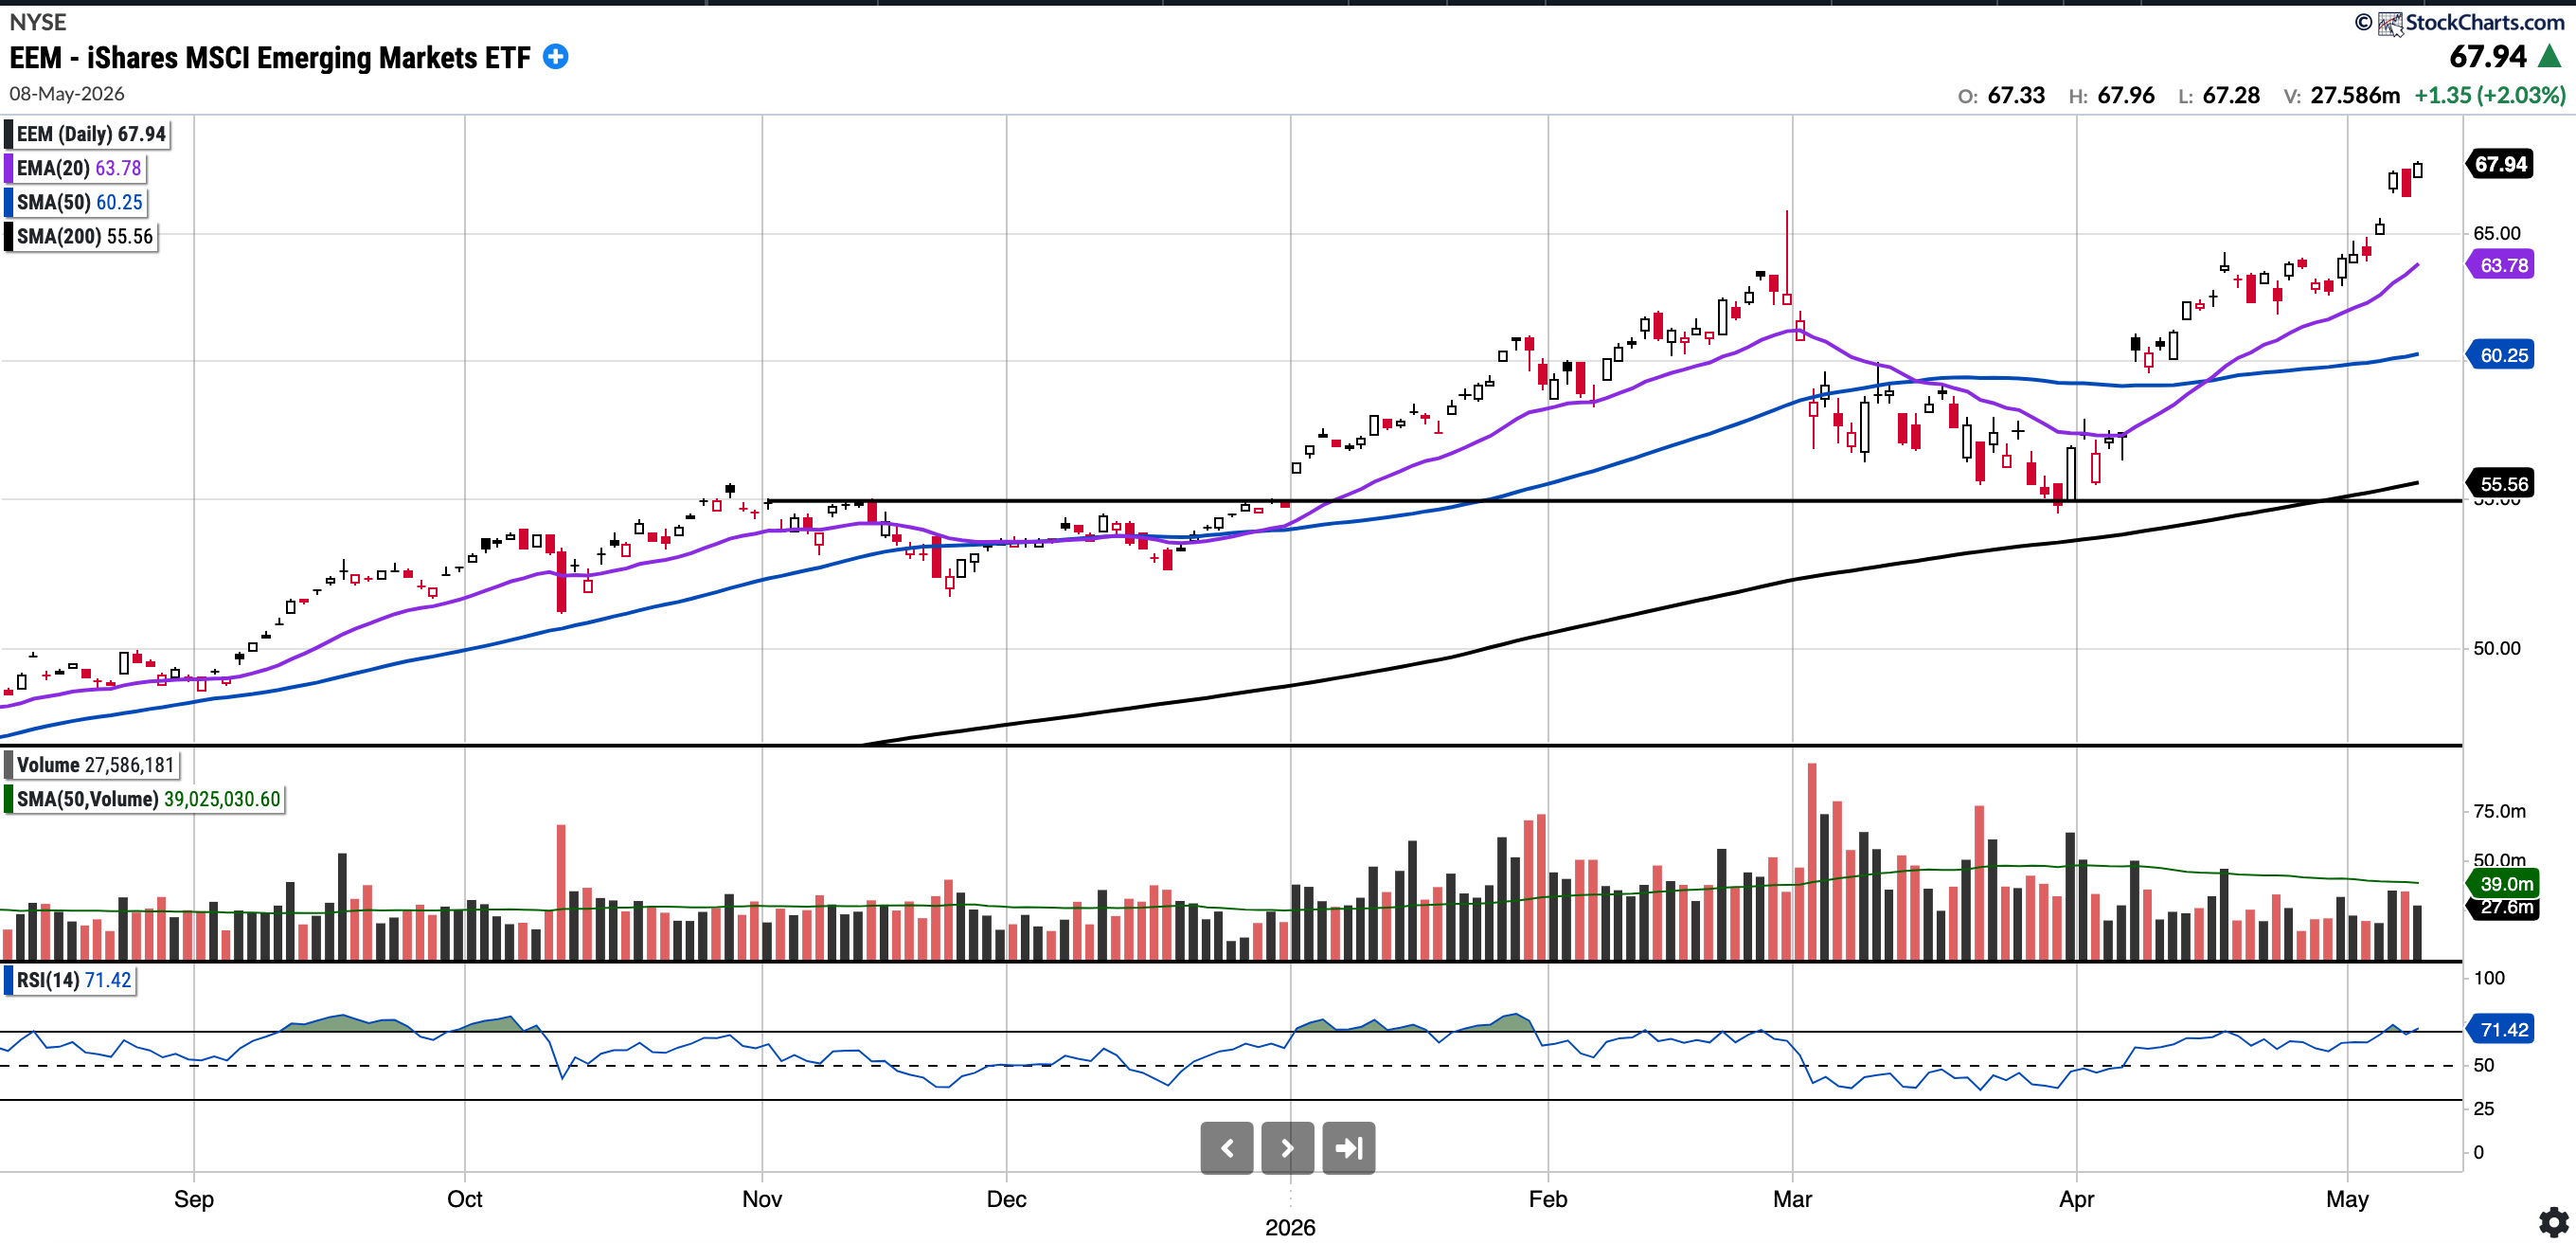
EEM
Currently trades at $67.94, 12.76% above the 50SMA and 22.28% above the 200SMA
RSI 71.42
+20.8% YTD
EEM remains in a strong uptrend and continues to outperform U.S. indices comfortably year-to-date by more than 1200 bps. It has bounced remarkably from the late March lows.
The levels to watch for pullback buys are the SMA 50 at 60.25 and then ~$55.00 (horizontal support and SMA 200). I do not expect it to trade as low as $55 again unless there are significant disturbances in the Middle East.
I believe EEM could be setting up for multi-year outperformance; hence, I continue to watch it closely. It looks set to breakout to new highs.
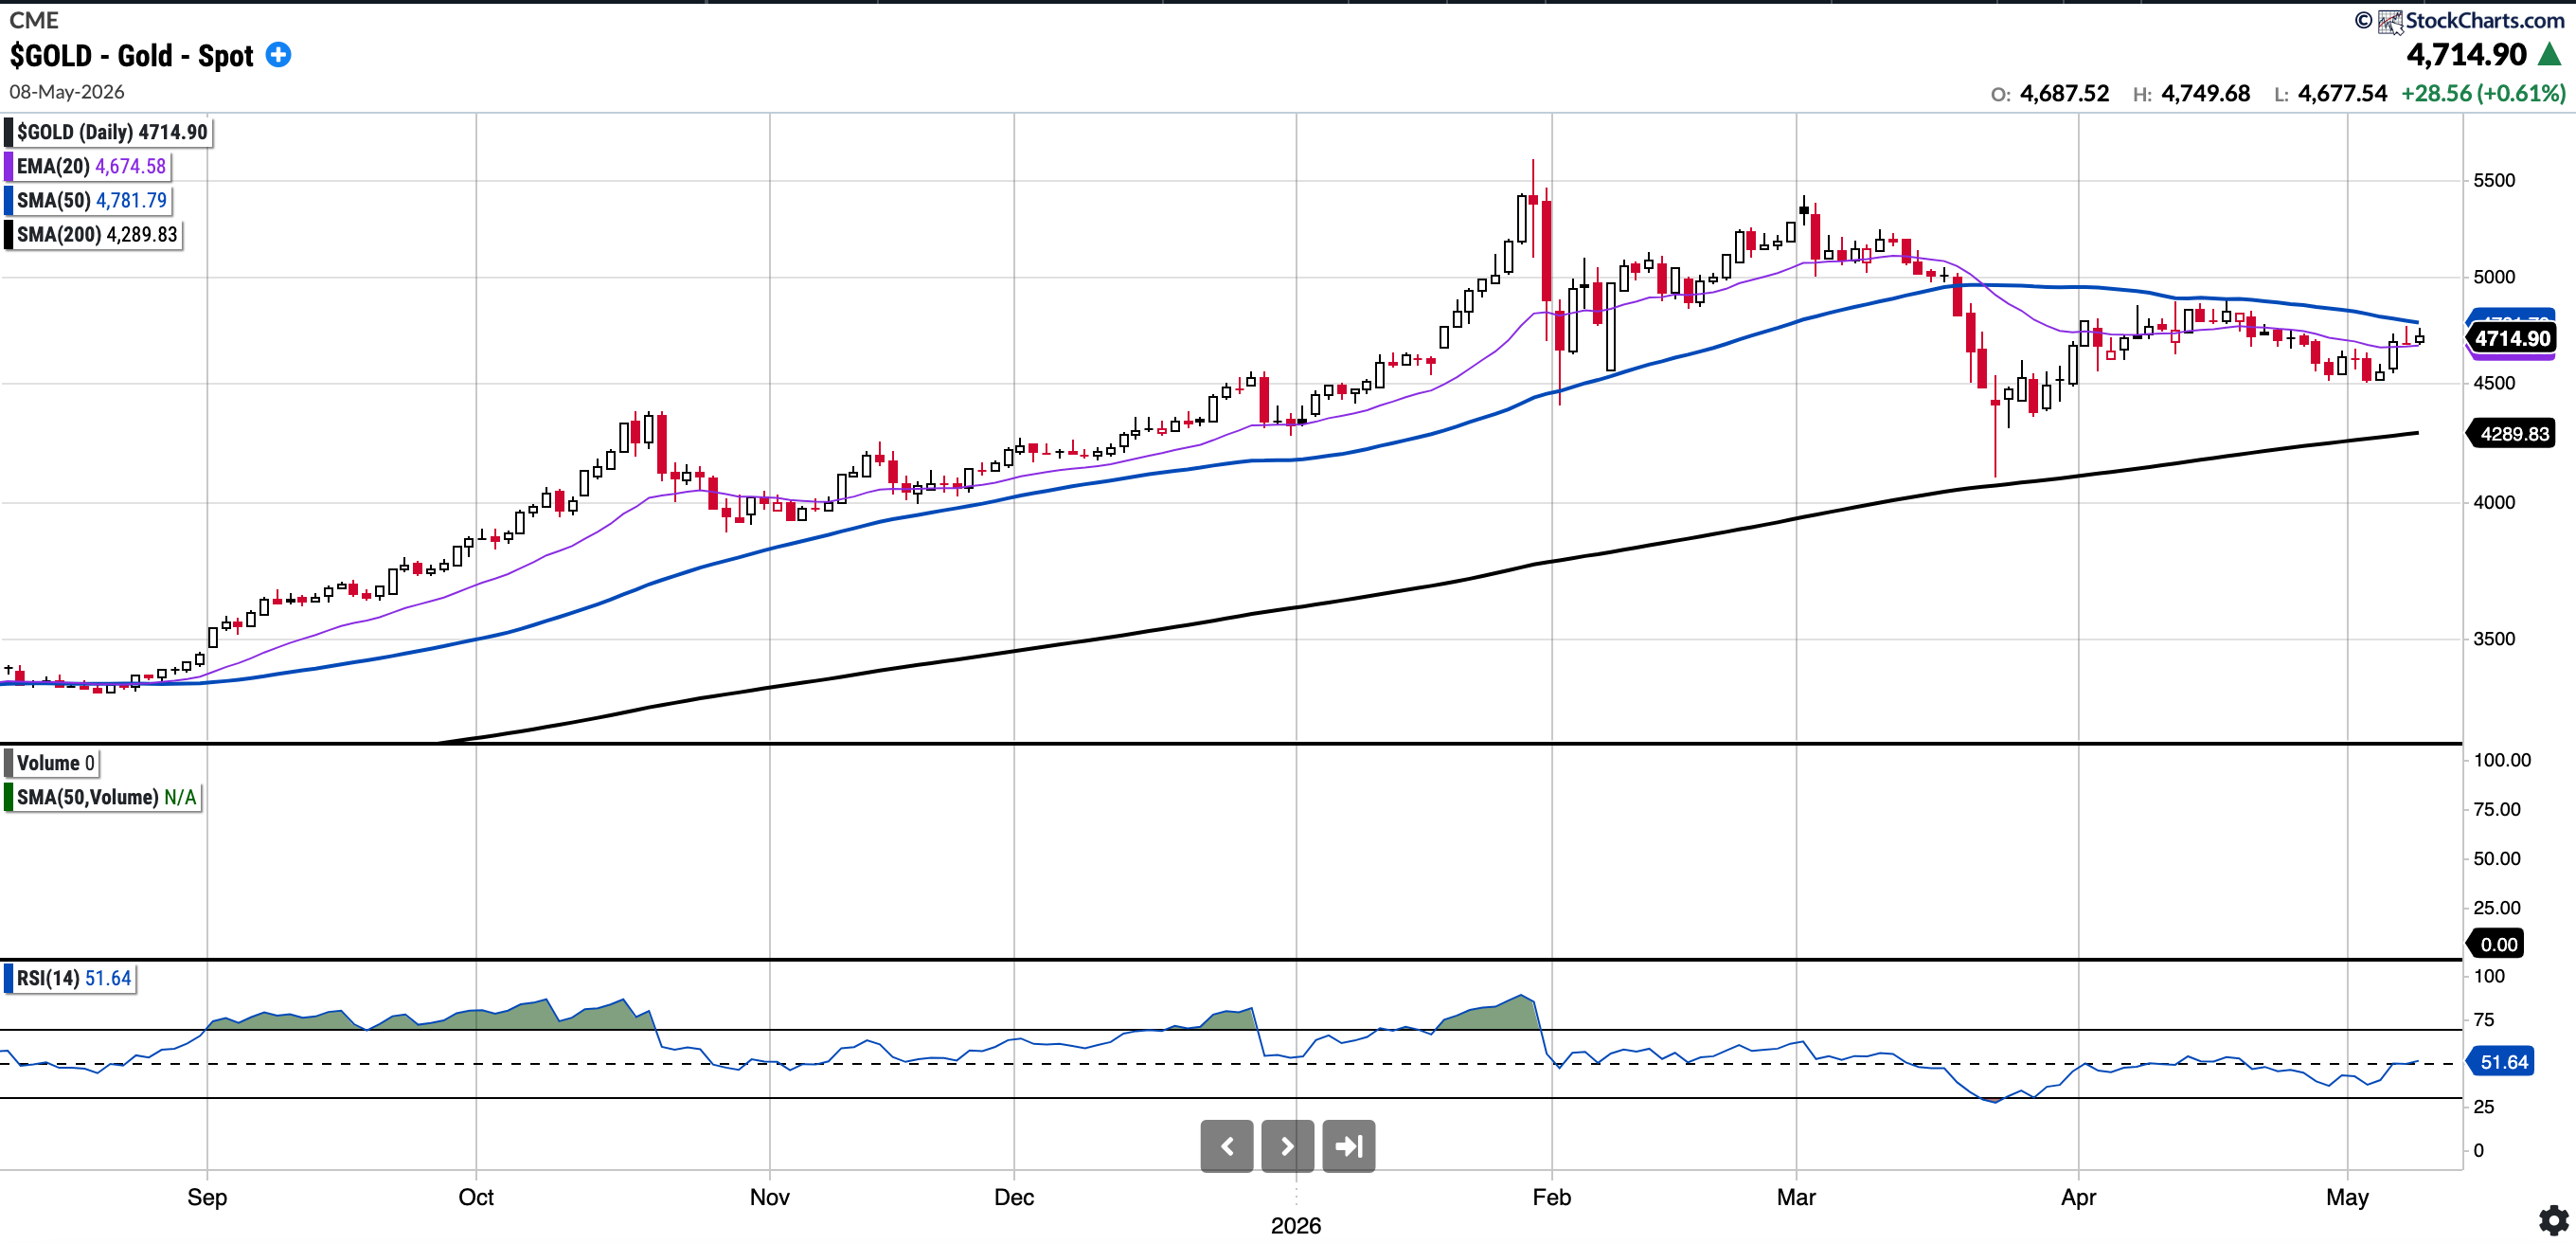
GOLD (Long Physical)
Currently trades at $4714.90, 1.4% below the 50SMA and 9.91% above the 200SMA
RSI 51.64
9.08% YTD
Gold remains in a well defined uptrend, though it has started to consolidate below the overhead SMA 50, which is serving as a strong resistance level.
AMD
Currently trades at $455.19, 78.85% above the 50SMA and 109.42% above the 200SMA
RSI 80.78
+103.69% YTD
Last week about AMD I had written:
AMD did gap up and fade on Monday; by Tuesday morning, it had corrected more than 10% from Friday’s high. However, it has bounced back remarkably to end the week at all-time highs. Not ideal for shorts who overstayed their welcome.
AMD reported earnings on Tuesday, after which it gapped up, held those gains, and rallied 12% on Friday to close the week up 27%. It’s been a fantastic run, and certainly not ideal for the shorts who overstayed their welcome! Of note, AMD is now 109% above its 200-day moving average, typically, 70% is considered extended for a large-cap liquid stock.
On an aside, this was one I sold a little too early and could have been more systematic in the selling process (trimming and trailing would have been a better approach!).
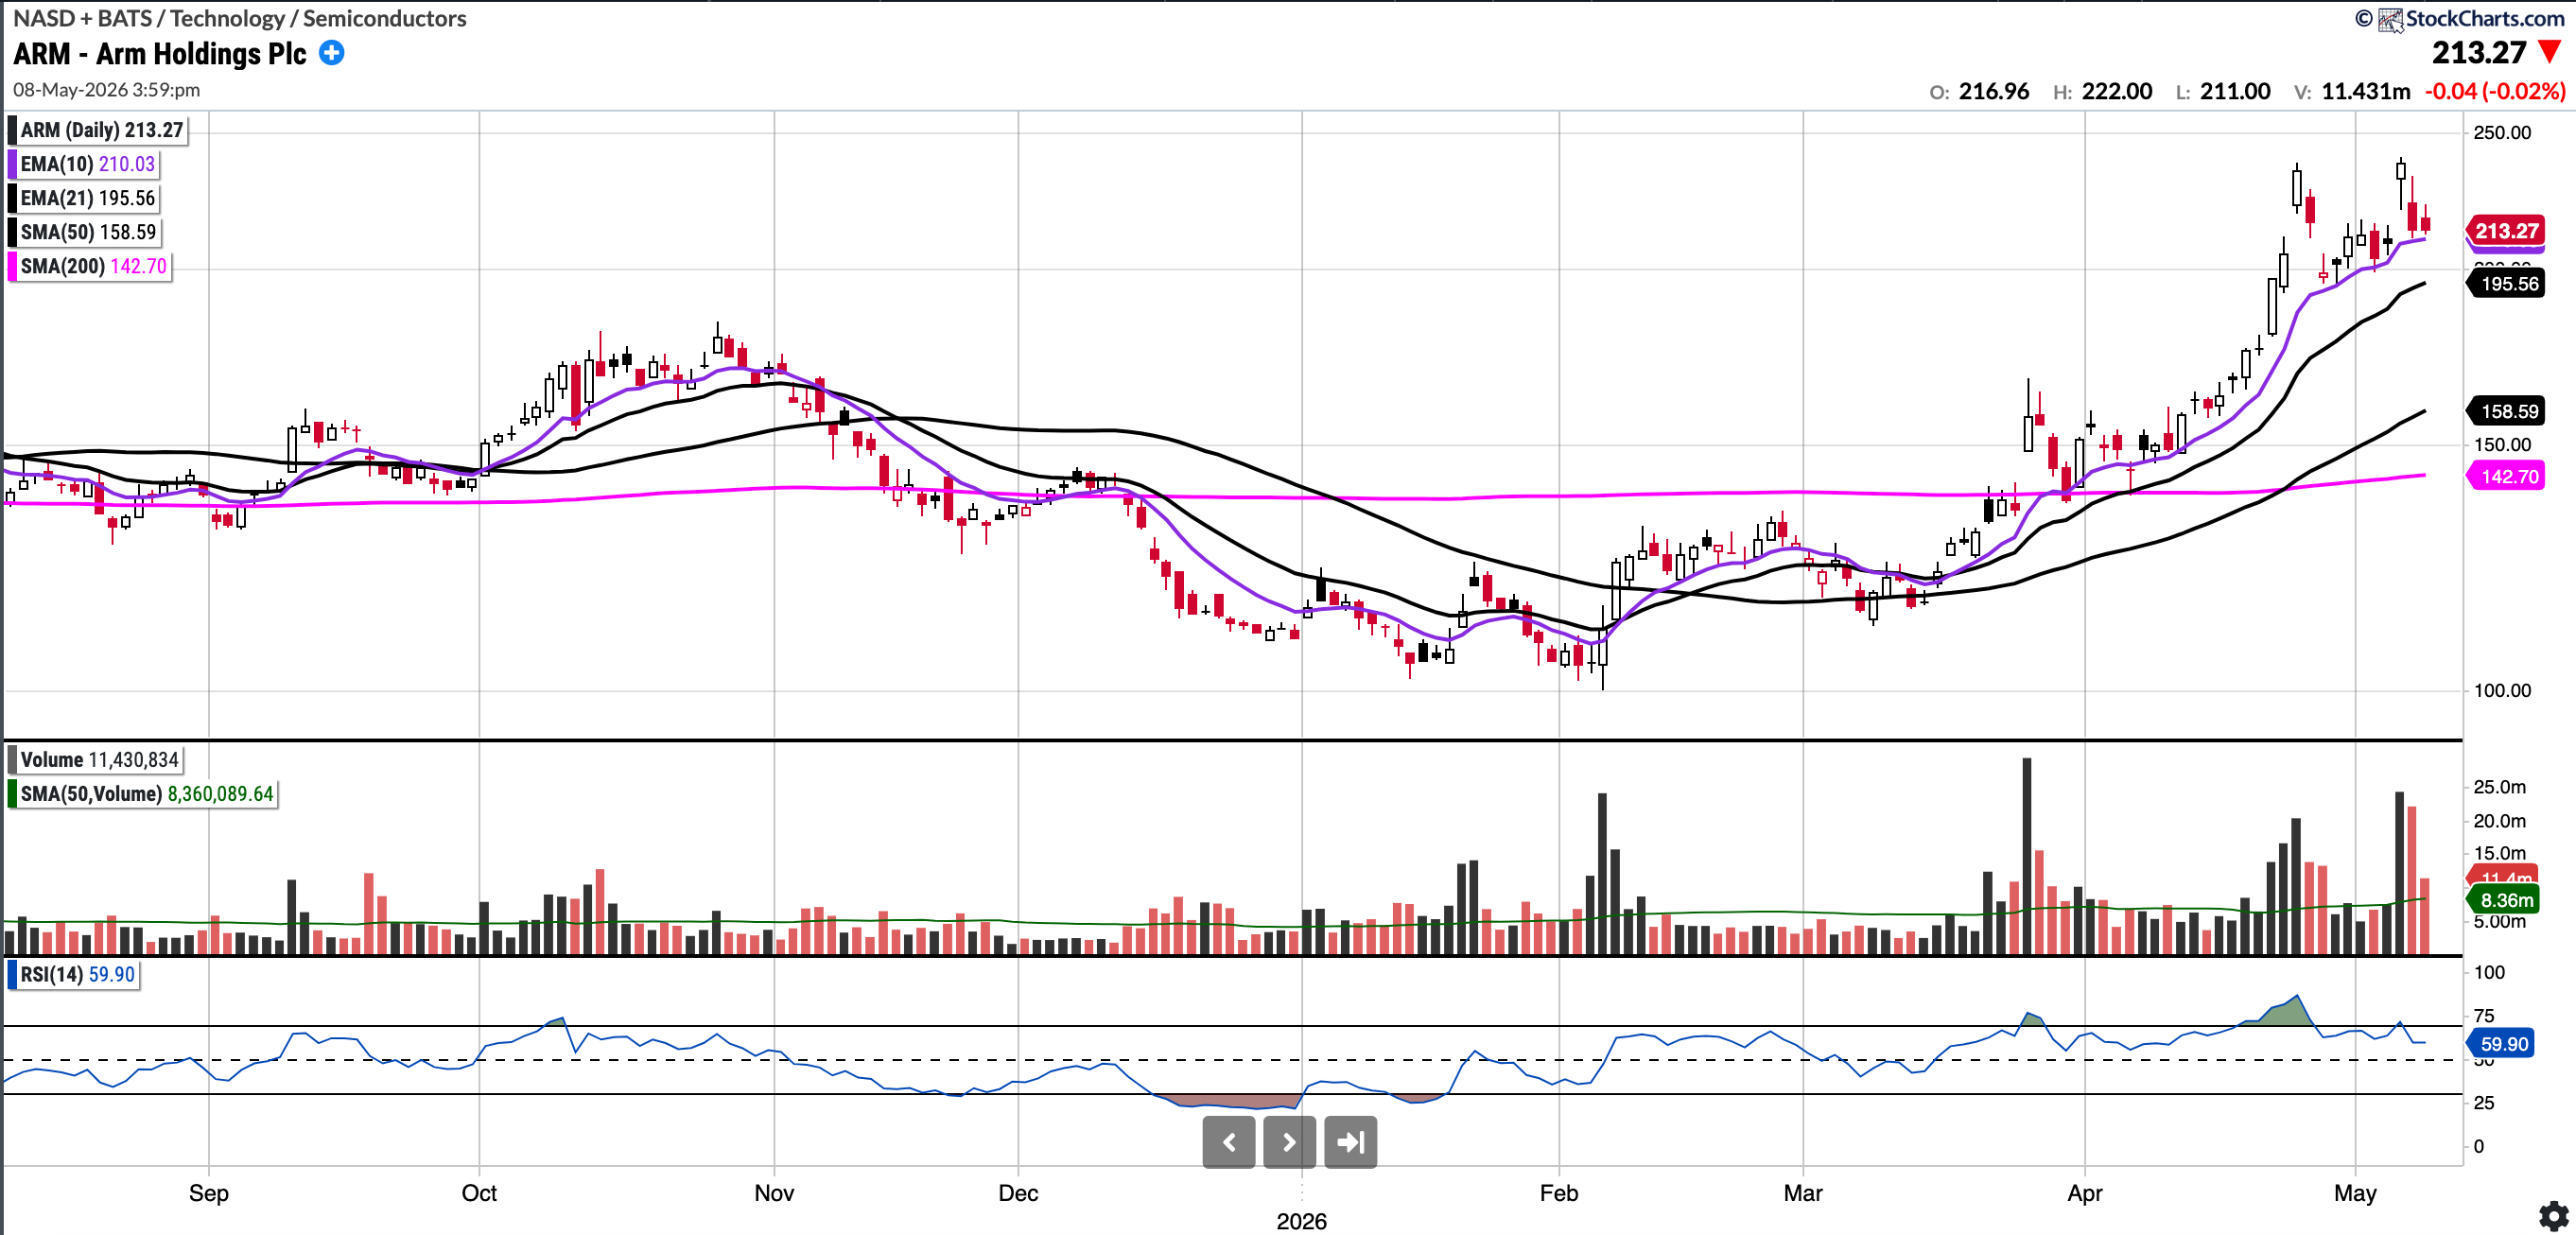
Since I’ve mentioned ARM frequently over the past few weeks, I’ve included the updated chart below to close the loop. I finally exited ARM in my trading this week for the close to 50% gains in a couple of weeks. I would like to see consolidation for now and possibly a pullback to re-test the breakout level which was ~180.
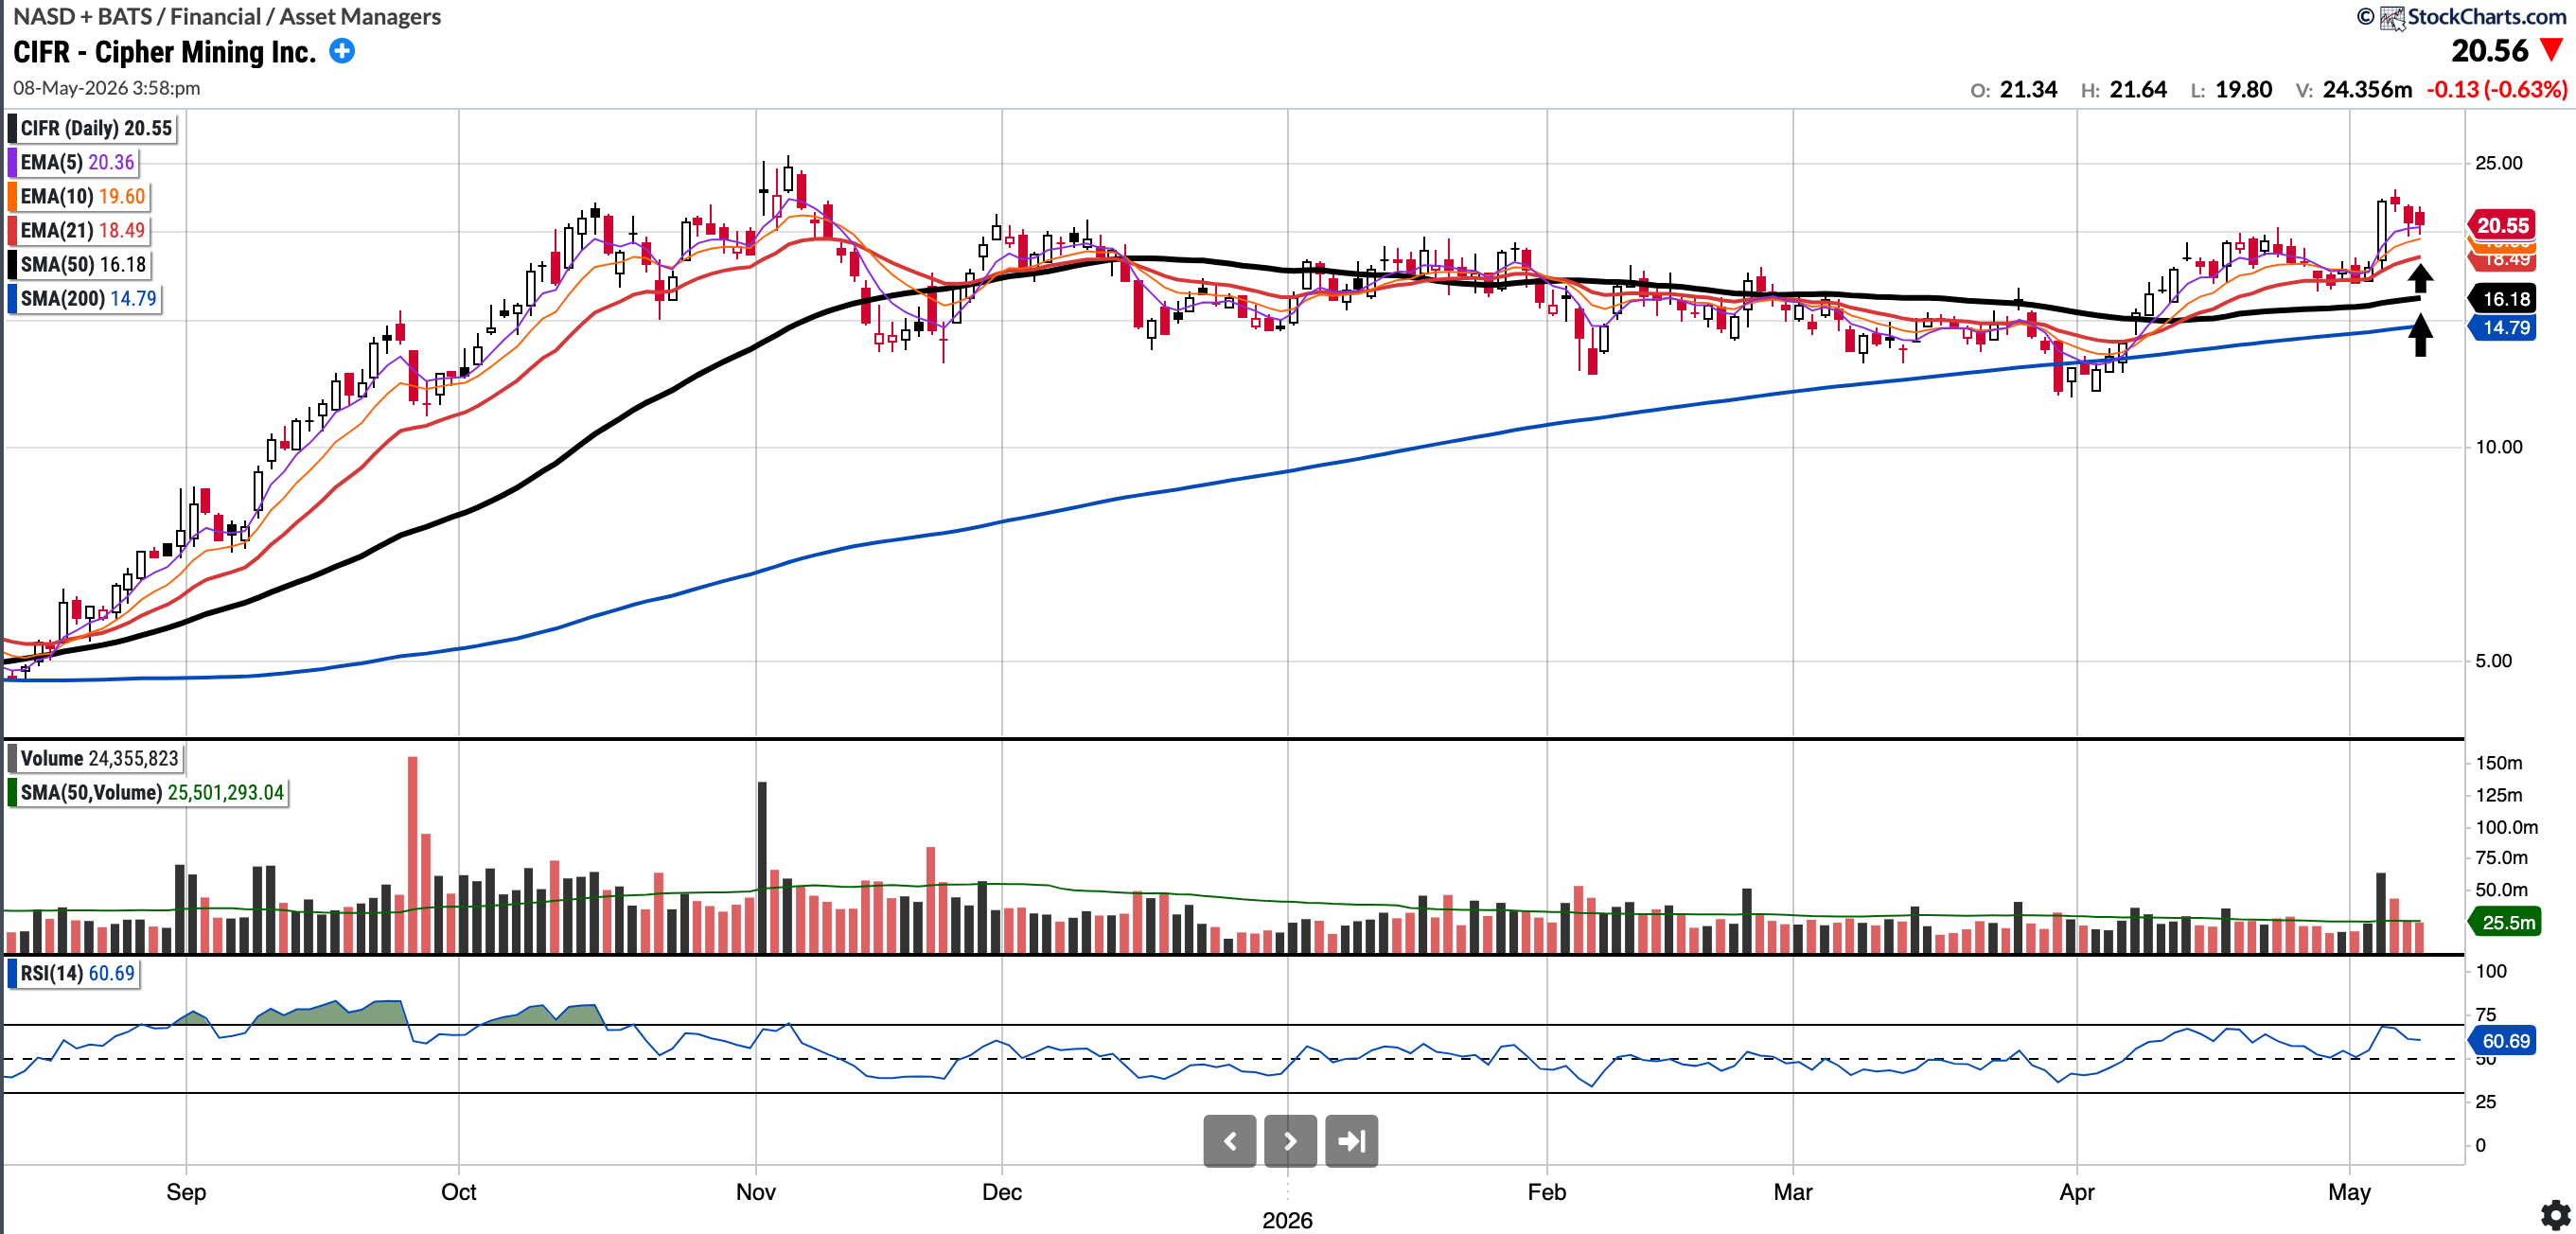
CIFR (Long)
Currently trades at $20.55, 26.98% above the 50SMA and 38.98% above the 200SMA
RSI 60.69
26.85% YTD
We featured CIFR last week as it broke out of its descending trendline. On Monday, I doubled my position ahead of Tuesday's earnings report. The move paid off well; they announced they had secured 4GW and a third hyperscaler client, leading the stock to close up over 20% for the week. I am now looking for a low-volume pullback to either the 21-day EMA (18.49) or the 50-day SMA (~16).
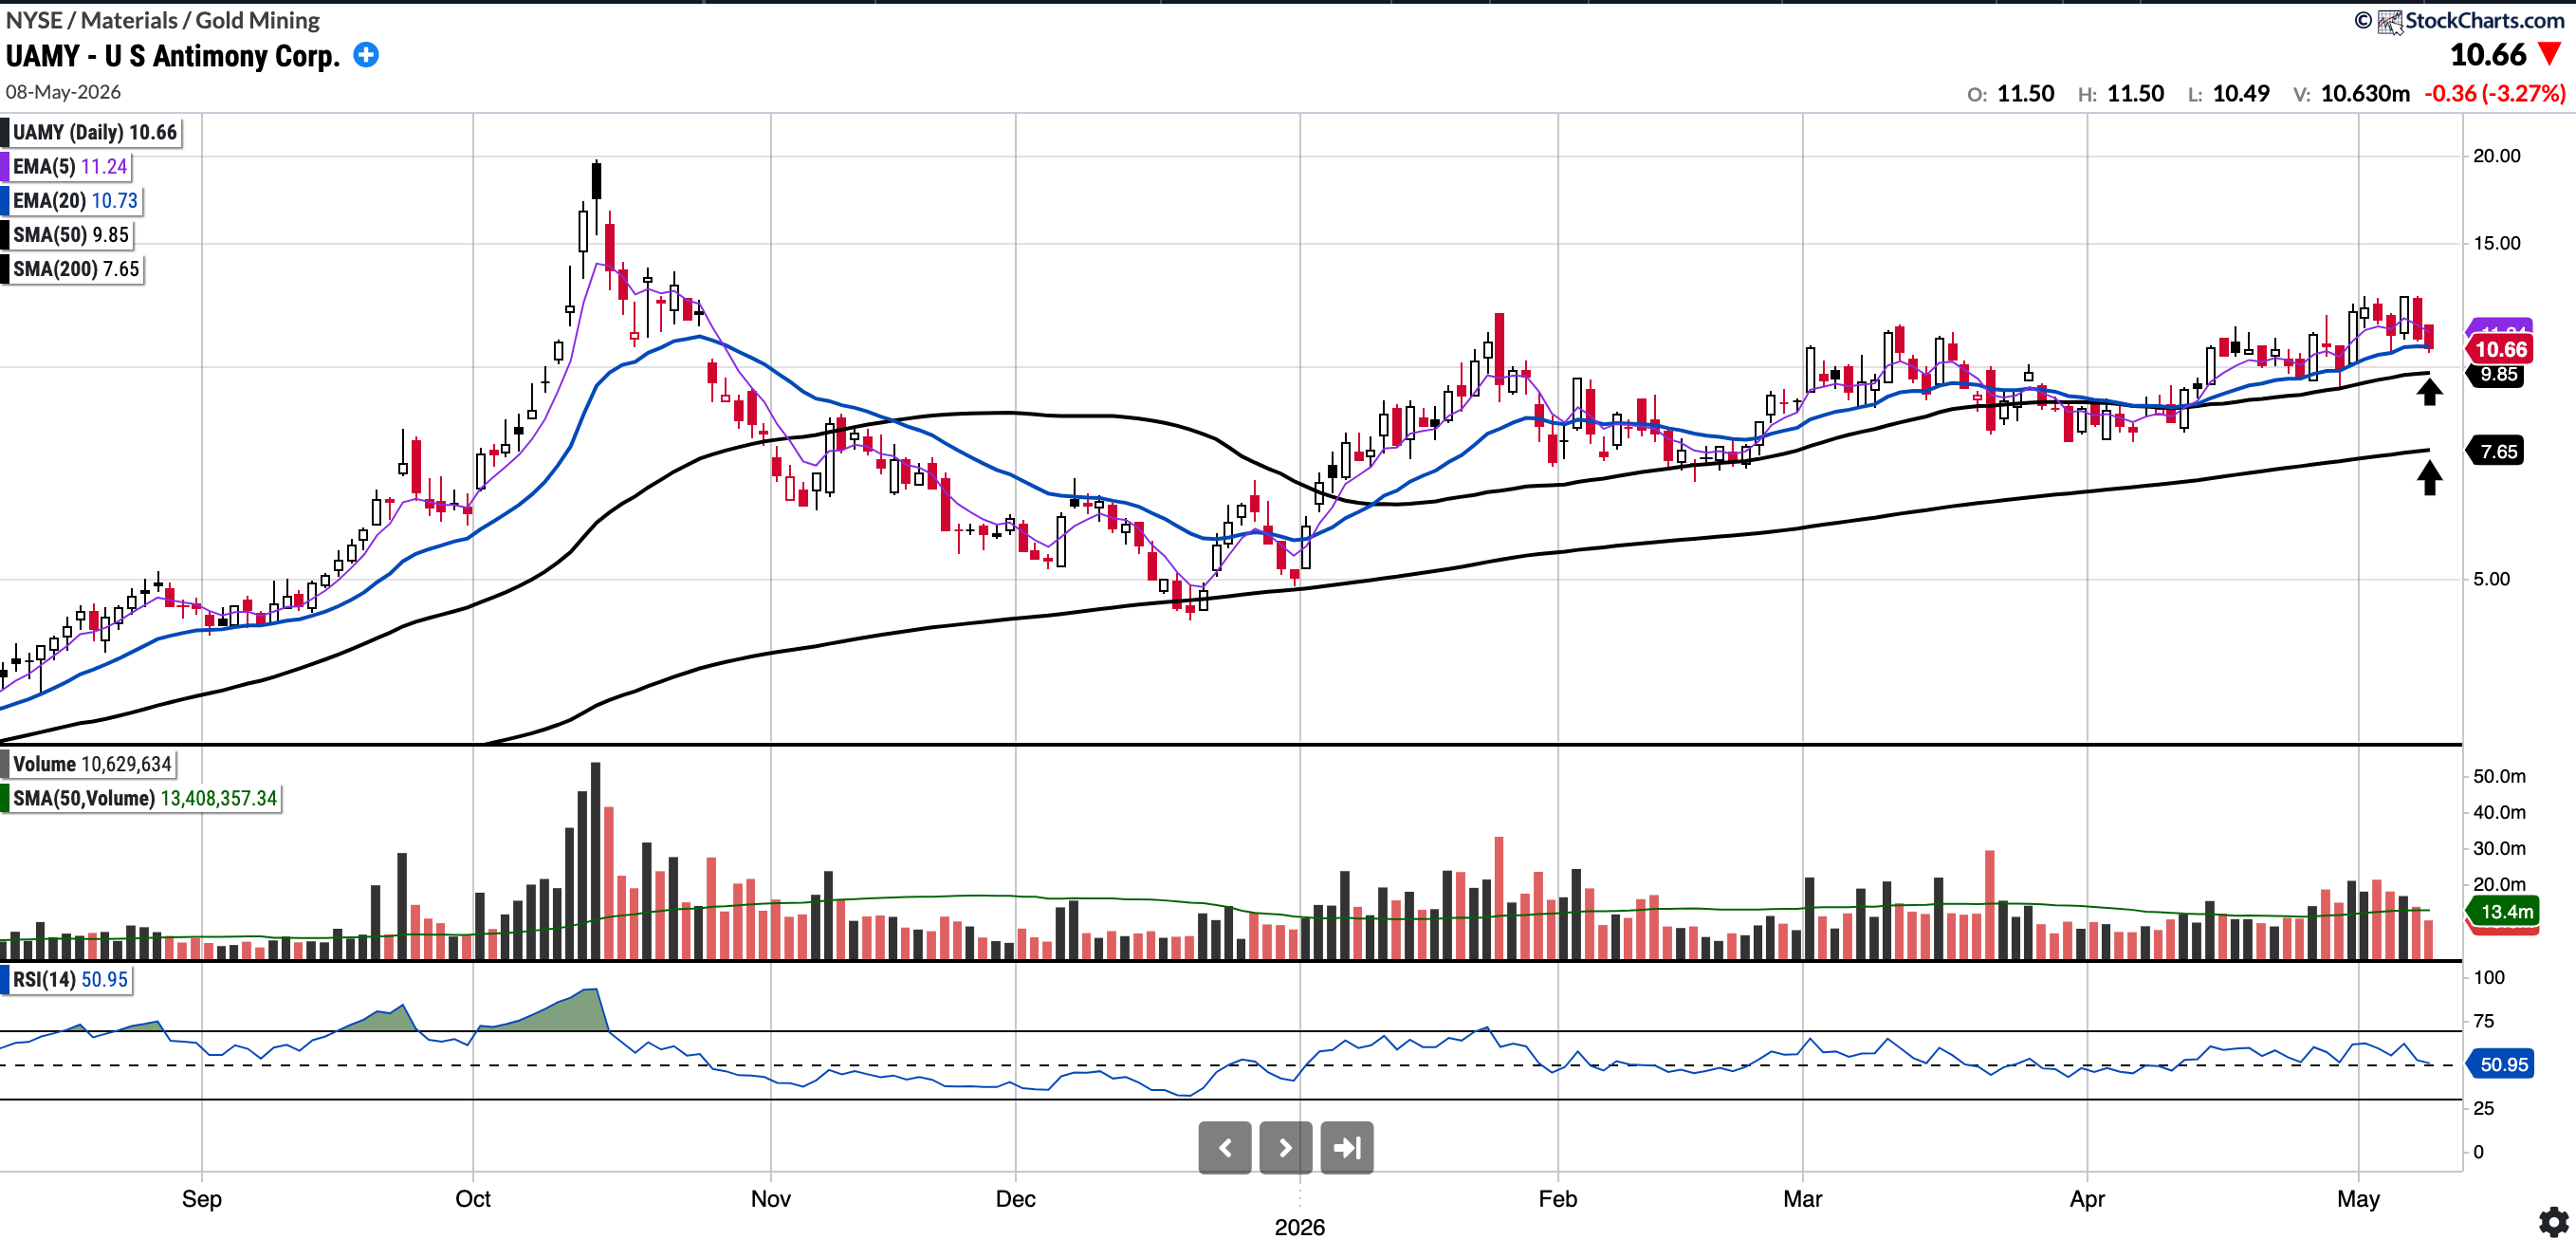
UAMY
Currently trades at $10.66, 8.26% above the 50SMA and 39.43% above the 200SMA
RSI 50.95
79.76% YTD
UAMY looked like it was breaking out of a multi-month base last week; however, it has since pulled back to the 20-day MA. If it hits the 50-day, I may be interested, or it could be a 'value buy' if it trades down to the 200-day. Many others in the sector also look very constructive, specifically MP and USAR, both of which are US Government-backed.
Important: I will feature several other trading ideas in the Watchlist Snapshot post, so keep a look out for that post tomorrow.
Last weeks post (link below) had countless winners such as:
RKLB 78 to 105
FLY 31 to 40
ORCL 165 to 196
CIFR 17 to 22
MP 63 to 75
CRCL 109 to 122
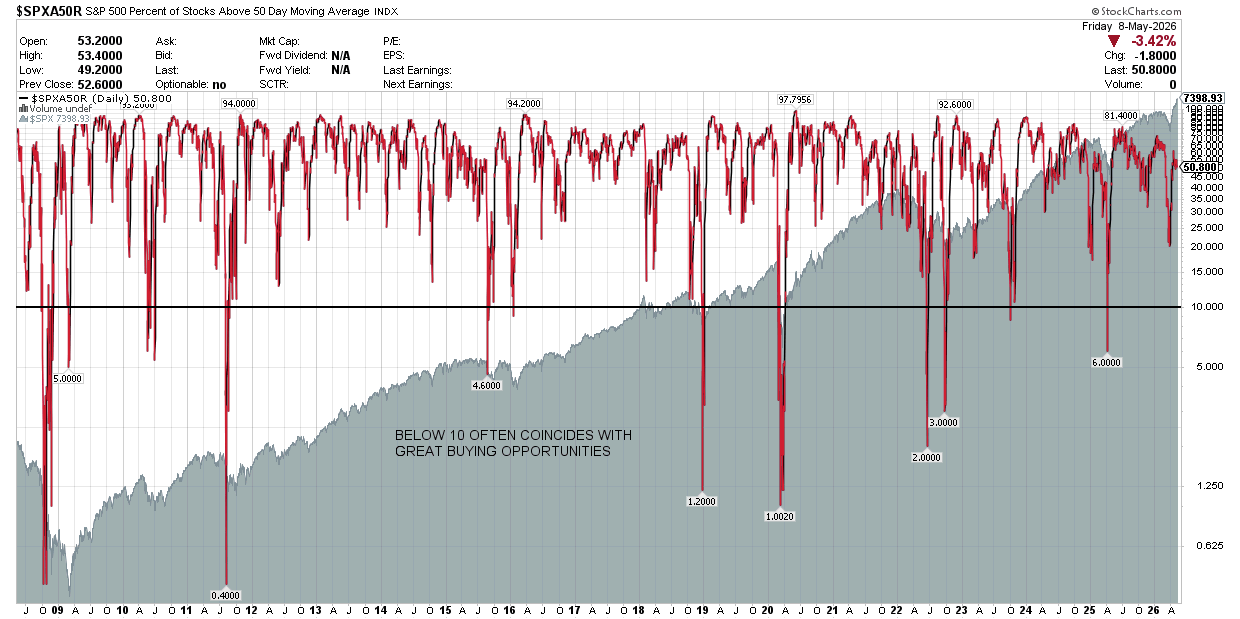
S&P 500 Percentage of Stocks Above the 50 Day Moving Average: Currently 50.8
Readings below 10 tend to be fantastic buying opportunities. We did get to 20 at the recent pico low on the SPX.
You will note that whilst the SPX closed at the highs, breadth is again deteriorating.
Notable portfolio changes in previous week (all updated live in subscriber channels):
No notable portfolio changes this week.
Important: To familiarise yourself with the notification process, please read the following post regarding the notification system.
I have also included the link to the Live Updates thread on the Substack chat below, which is where I post all moves related to my investment account. Turn the notifications on. Live Updates Thread
Note that these updates are posted simultaneously on Discord as well.
Current Positions in Size Order with Cost Basis (Investment Account)
