

Hope you all are having a good weekend. Below, we will be previewing the upcoming week’s events and providing a portfolio update as usual.
Format for what is covered in this weekly preview:
A Look at the Indices
Key Upcoming Economic Events
Upcoming Earnings
Charts
Current Portfolio Holdings
Sizing | Cost Basis | Timeframe | Planned Moves
Closing Thoughts (Scroll to here for my Market Commentary)
I recommend checking out the most recent in-depth Monthly Portfolio and Performance Update below (the new post will also be published within the next day).

For all readers a reminder that a premium subscription includes:
Live Portfolio updates (All Buys and Sells) in Subscriber only Channels
Favourite set-up Ideas, Market Memos plus Full archive
Monthly in depth portfolio & performance updates
Annual Tier: Discord access for live trading account updates and AMAs.
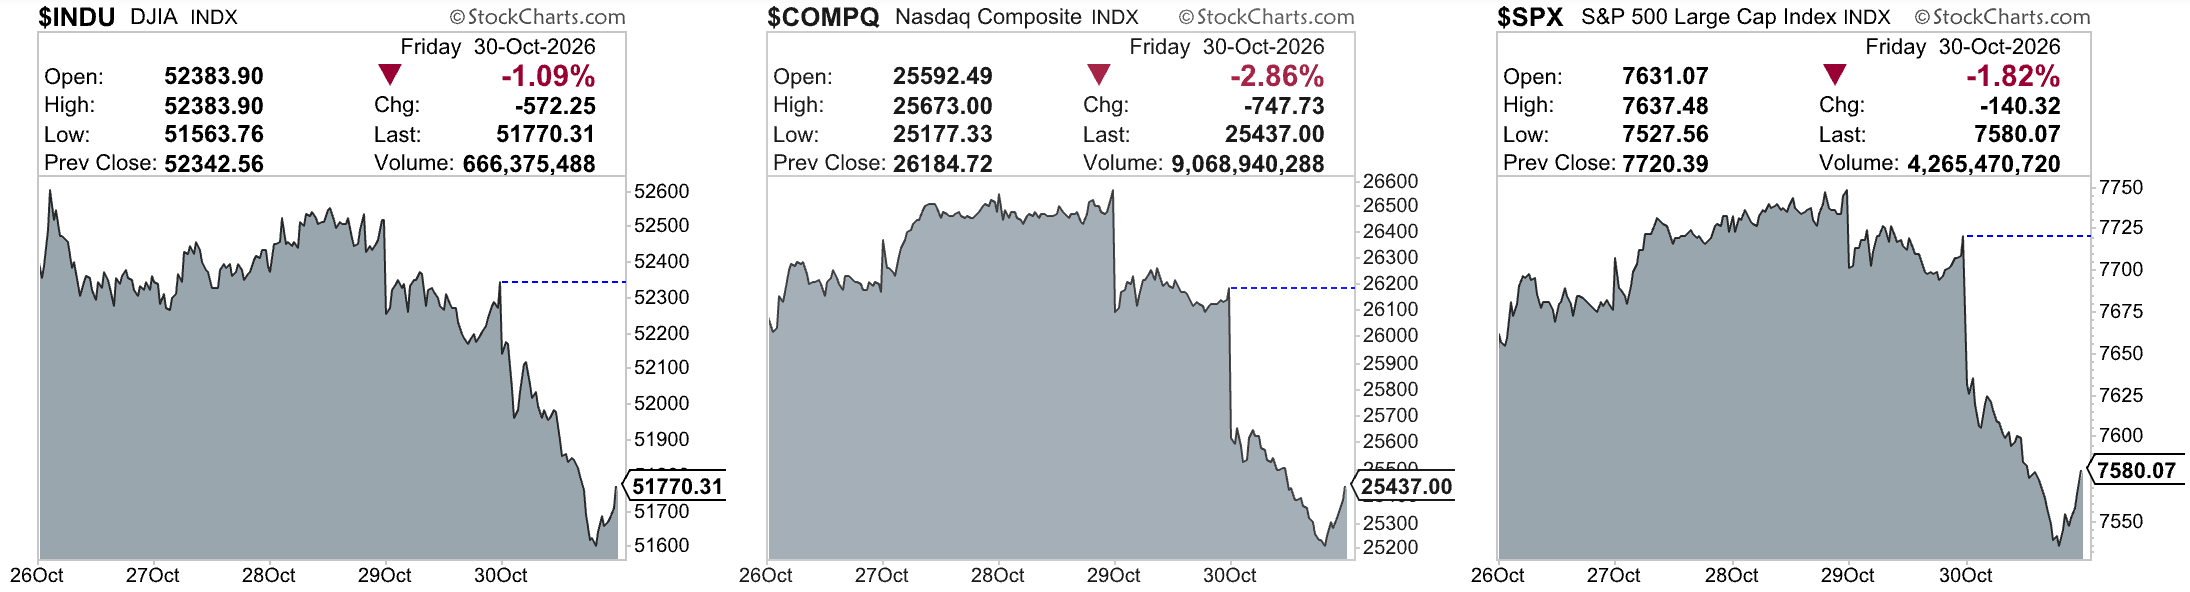
Indices
Dow Jones Industrial Average declined -0.85% in the last week
S&P 500 declined -0.57% in the last week
Nasdaq Composite declined -2.00% in the last week
IWM advanced +1.30% in the last week
Key upcoming economic events
Monday, November 2
ISM Manufacturing PMI (October)
Fed Senior Loan Officer Opinion Survey (Q3)
Fed speaker: Goolsbee
Tuesday, November 3
US midterm elections
JOLTS Job Openings (September)
Factory Orders (September)
Wednesday, November 4
ADP Employment (October)
Trade Balance (September)
ISM Services PMI (October)
EIA Weekly Petroleum Status Report
Treasury Quarterly Refunding Announcement
Thursday, November 5
Initial and Continuing Jobless Claims
Productivity and Unit Labor Costs, preliminary (Q3)
Fed speakers: Hammack and Barkin
Fed H.4.1 balance sheet release
Friday, November 6
Employment Situation (October)
University of Michigan Consumer Sentiment, preliminary (November)
Consumer Credit (September)
Fed speakers: Logan, Williams, Musalem and Bowman
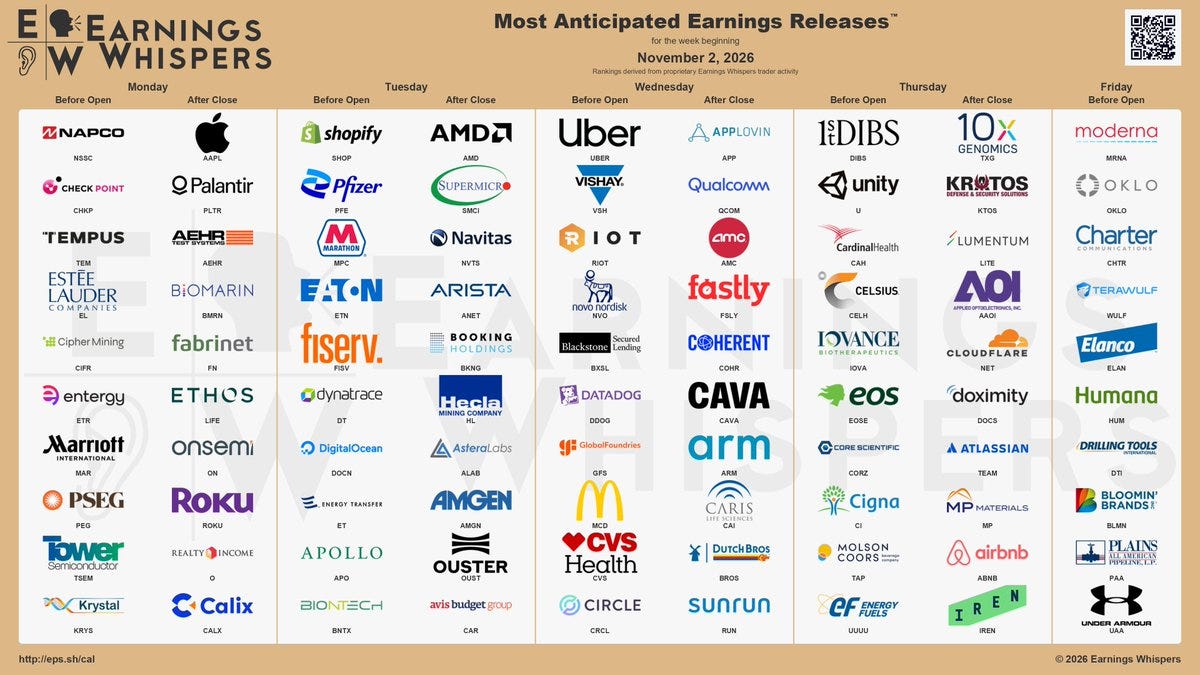
Upcoming Earnings
Below is the infographic by Earnings Whispers highlighting the schedule for this week:
Charts
SPX
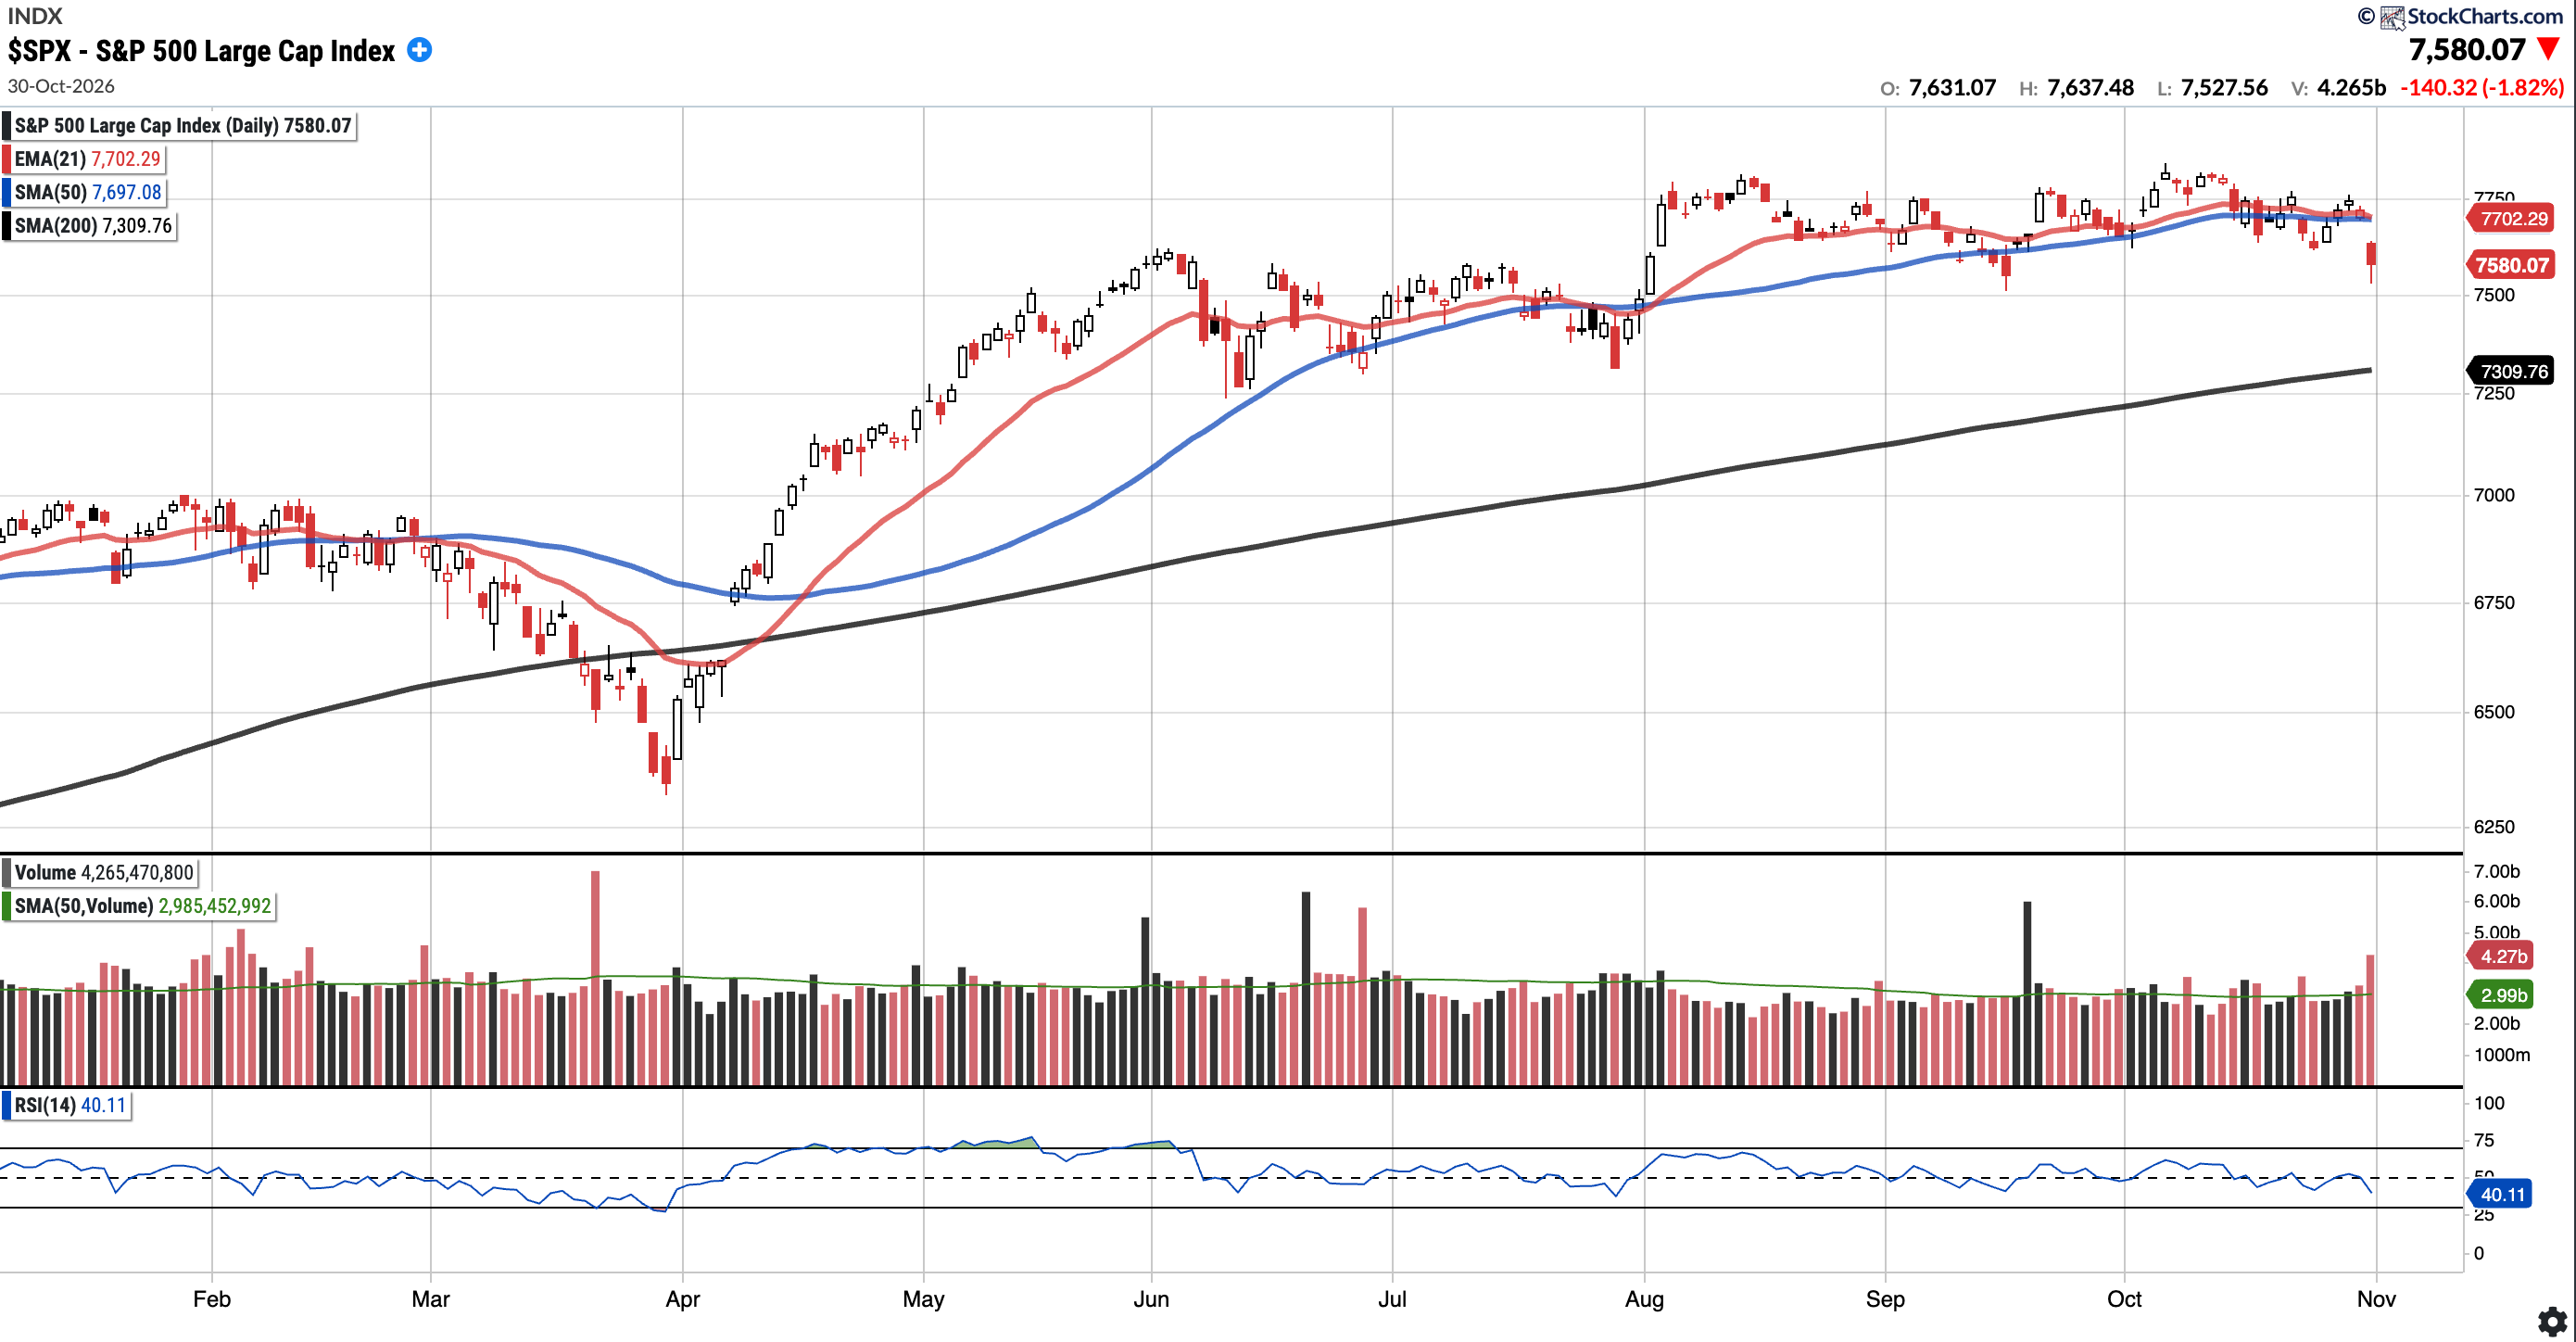
Currently trades at $7,580.07, 1.52% below the 50SMA and 3.70% above the 200SMA.
RSI 40.11
10.52% YTD
Distribution days in the last week: 2
The S&P 500 reclaimed the 21-day EMA and 50-day SMA on Tuesday, however, Friday’s 1.82% drop on volume well above its 50-day average sent price back below both moving averages. The 21EMA and 50SMA are now overhead. Similar to last week, bulls will want to see a reclaim of those levels. Meanwhile the 200-day SMA is the next major MA support.
COMPQ
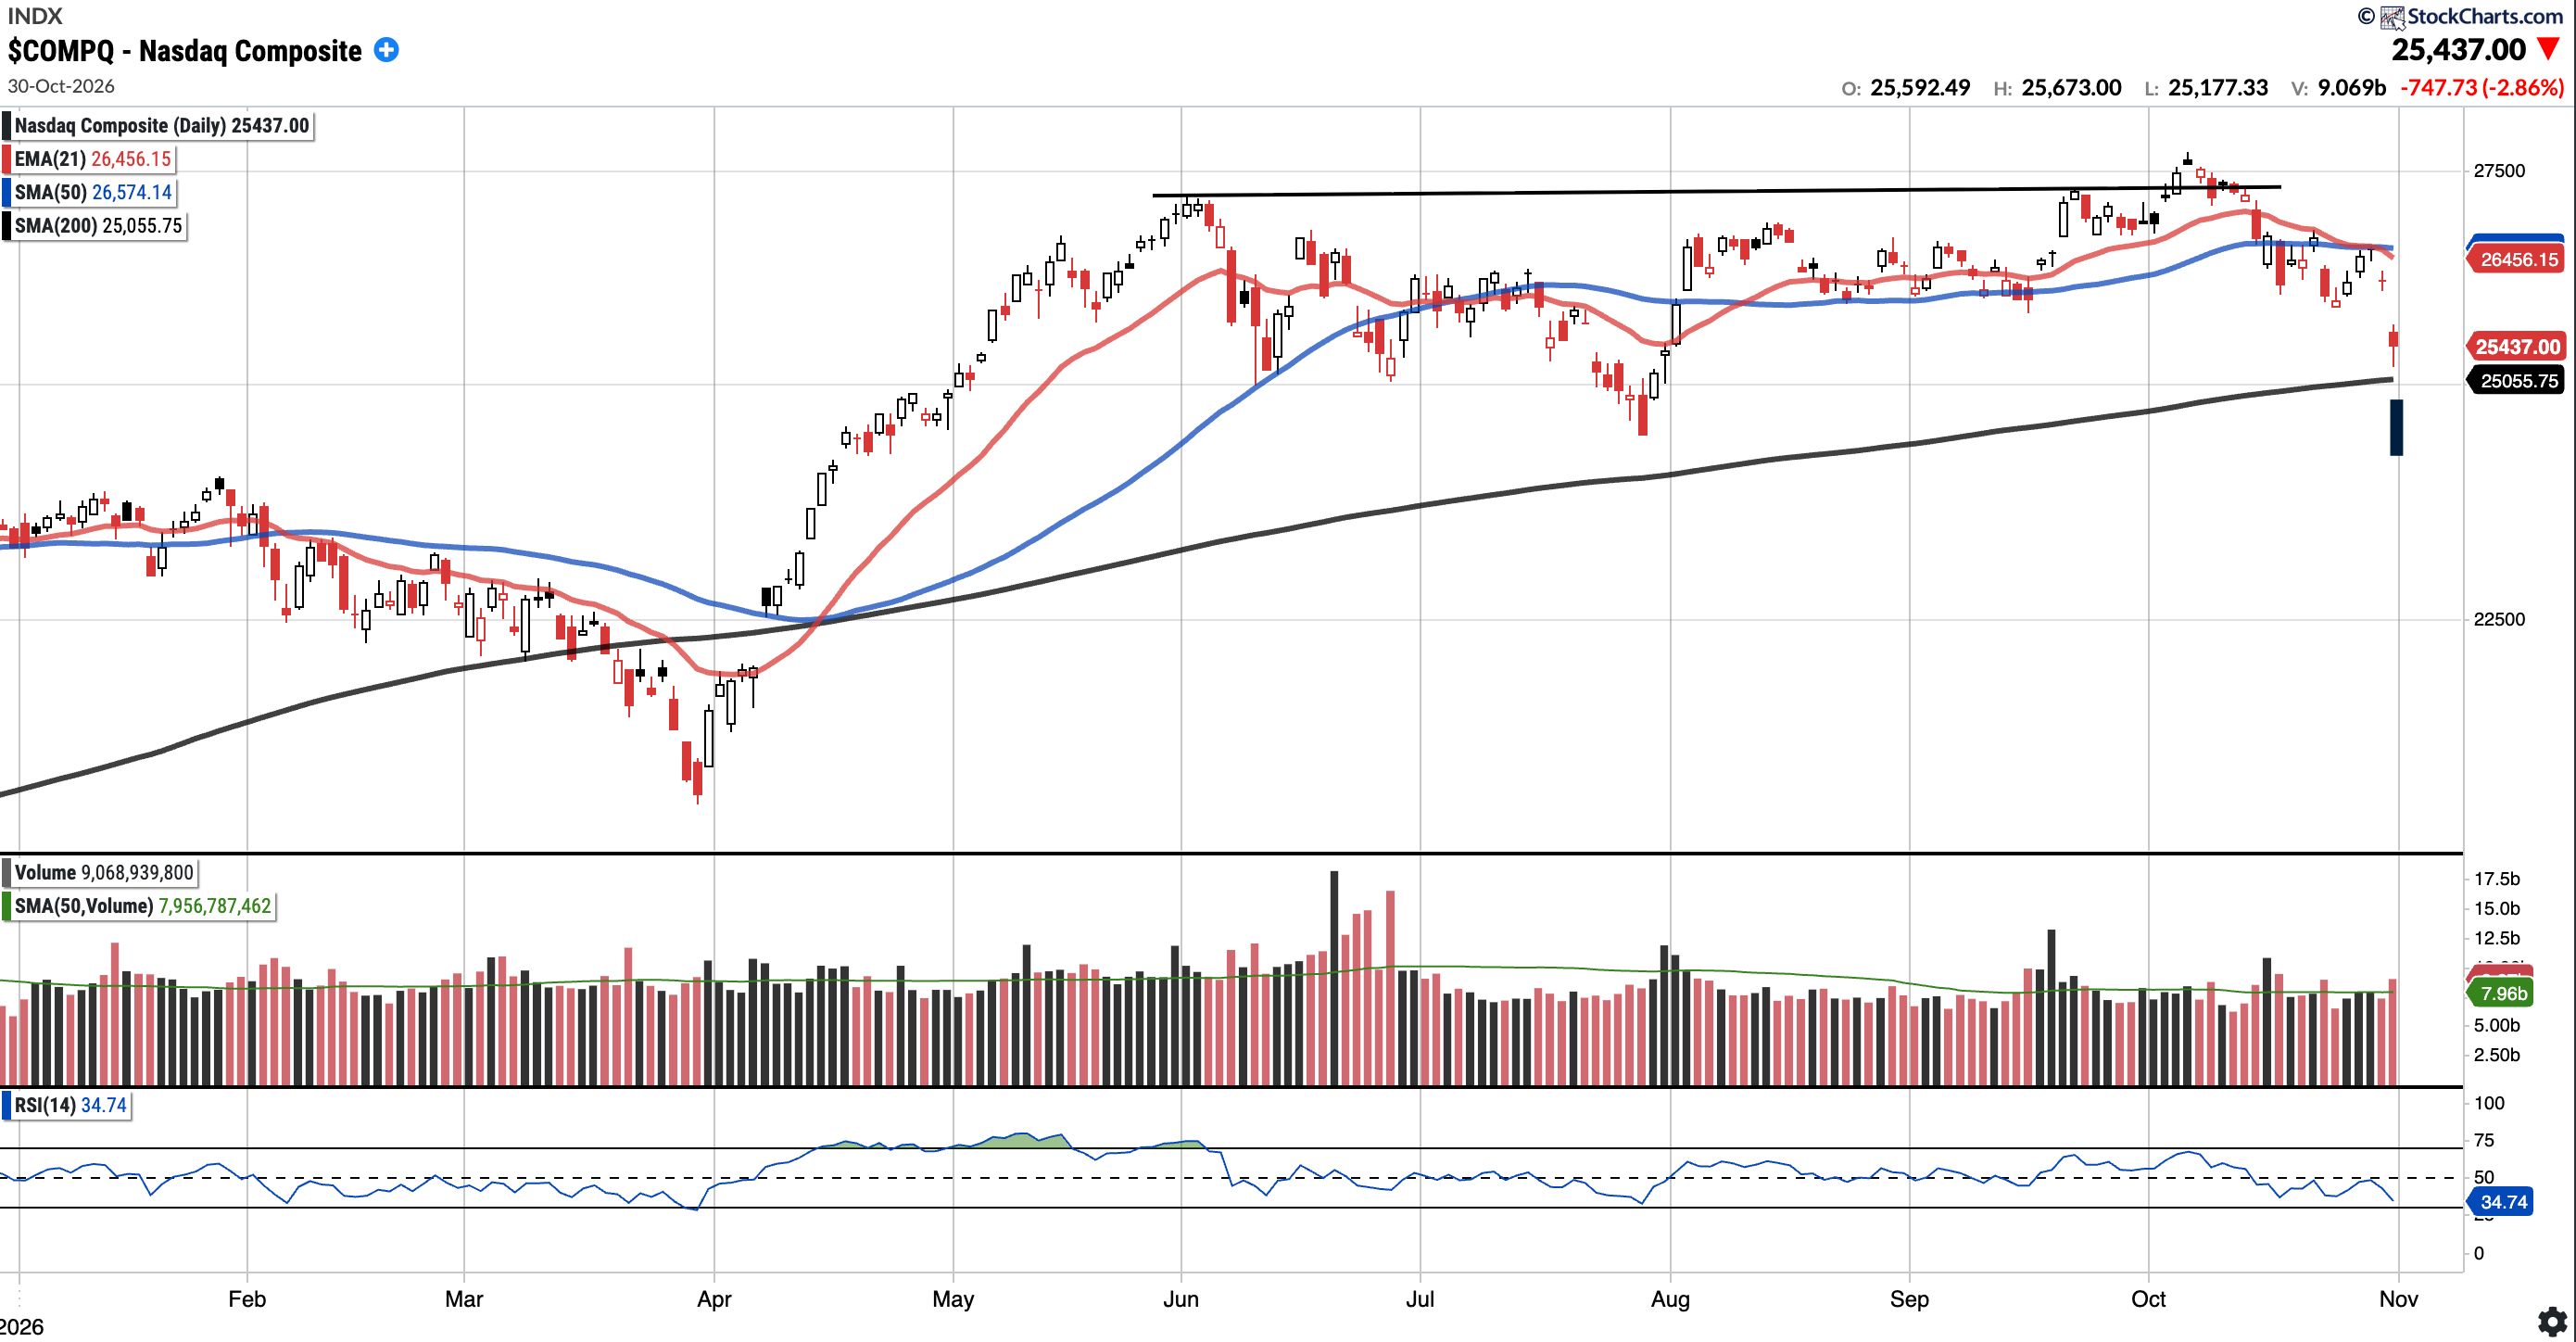
Currently trades at $25,437.00, 4.28% below the 50SMA and 1.52% above the 200SMA.
RSI 34.74
9.47% YTD
Distribution days in the last week: 1
The Nasdaq Composite spent the week below both the 21-day EMA and the 50-day SMA, followed by a gap lower on Friday on above-average volume. Friday’s low was very close to testing the 200-day moving average, which is an important level to hold; if lost, a sharp reclaim is of utmost importance for the bulls.
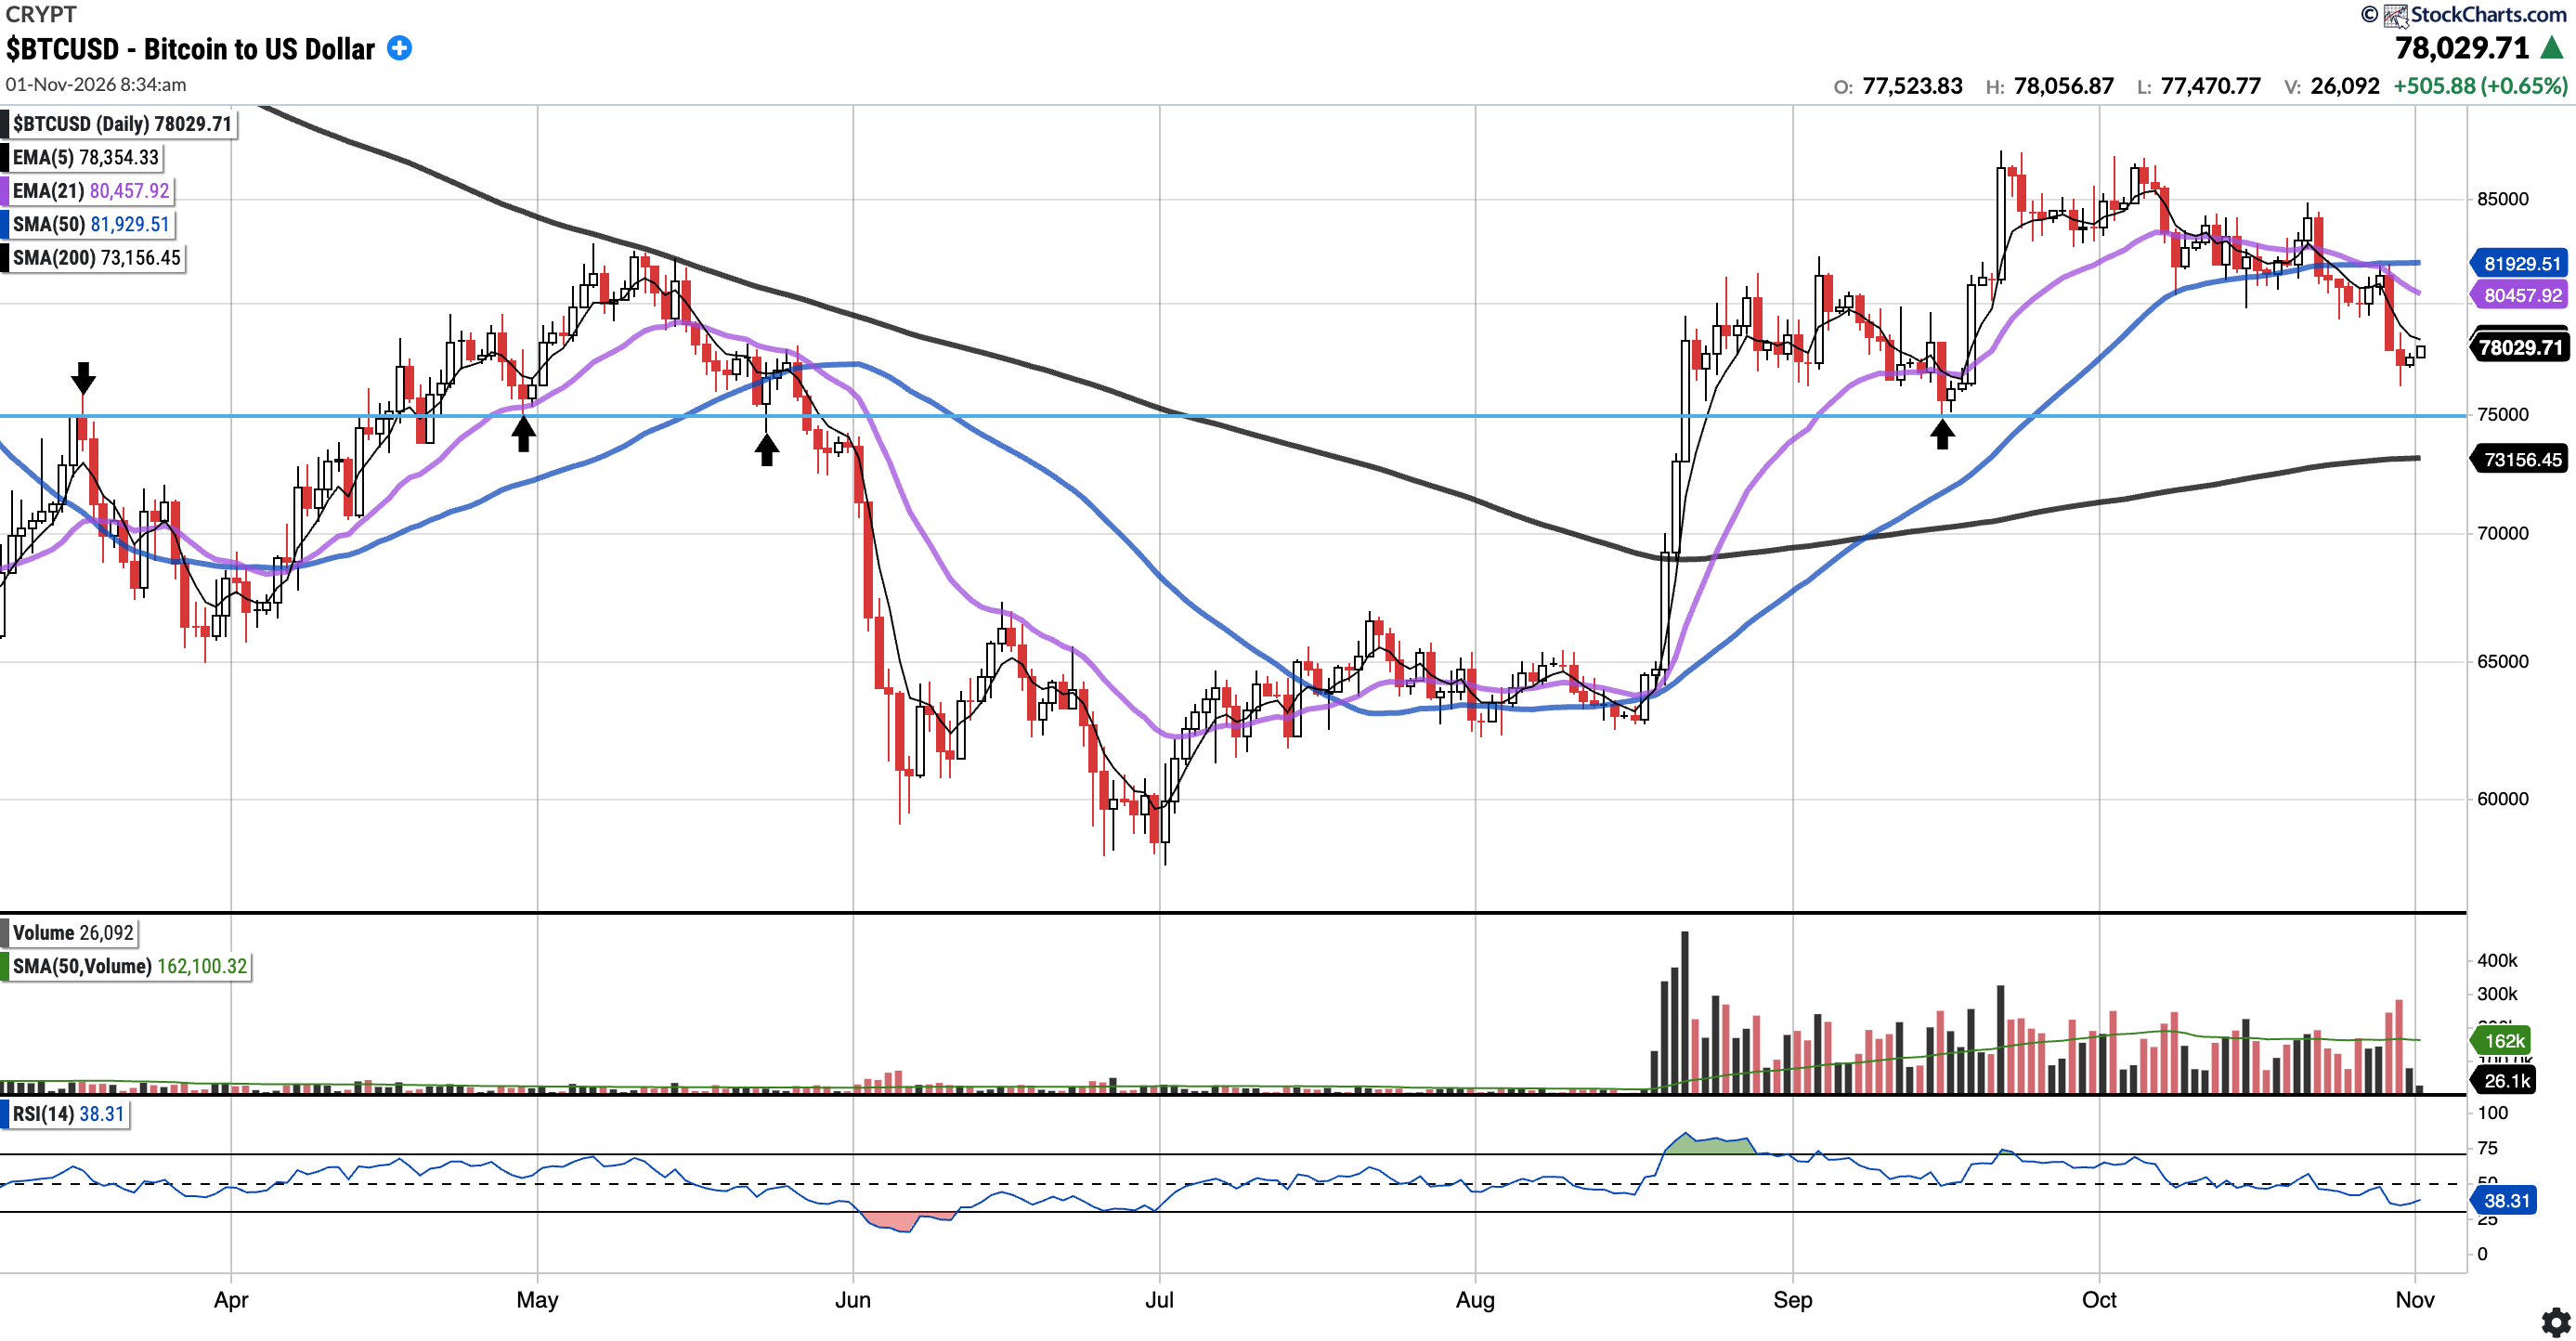
BTC (currently Long)
Currently trades at $78,029, 4.78% below the 50SMA and 6.63% above the 200SMA.
RSI 38.31
-10.84% YTD
As of Sunday November 1 at 3:34AM EST (8:34 AM UTC), BTC is trading at $78,029. BTC could not reclaim the 21EMA and 50SMA near the 82K mark. Price then broke below the $80K support level that was in focus last week and sold off. The next major support below is toward $75K (see horizontal line). Also note the bearish 21EMA cross below the 50SMA. Bulls will want to see $80K reclaimed, whereas to the downside, the $75K level, which has held as support on multiple tests (see arrows), is in play with the 200SMA just below.
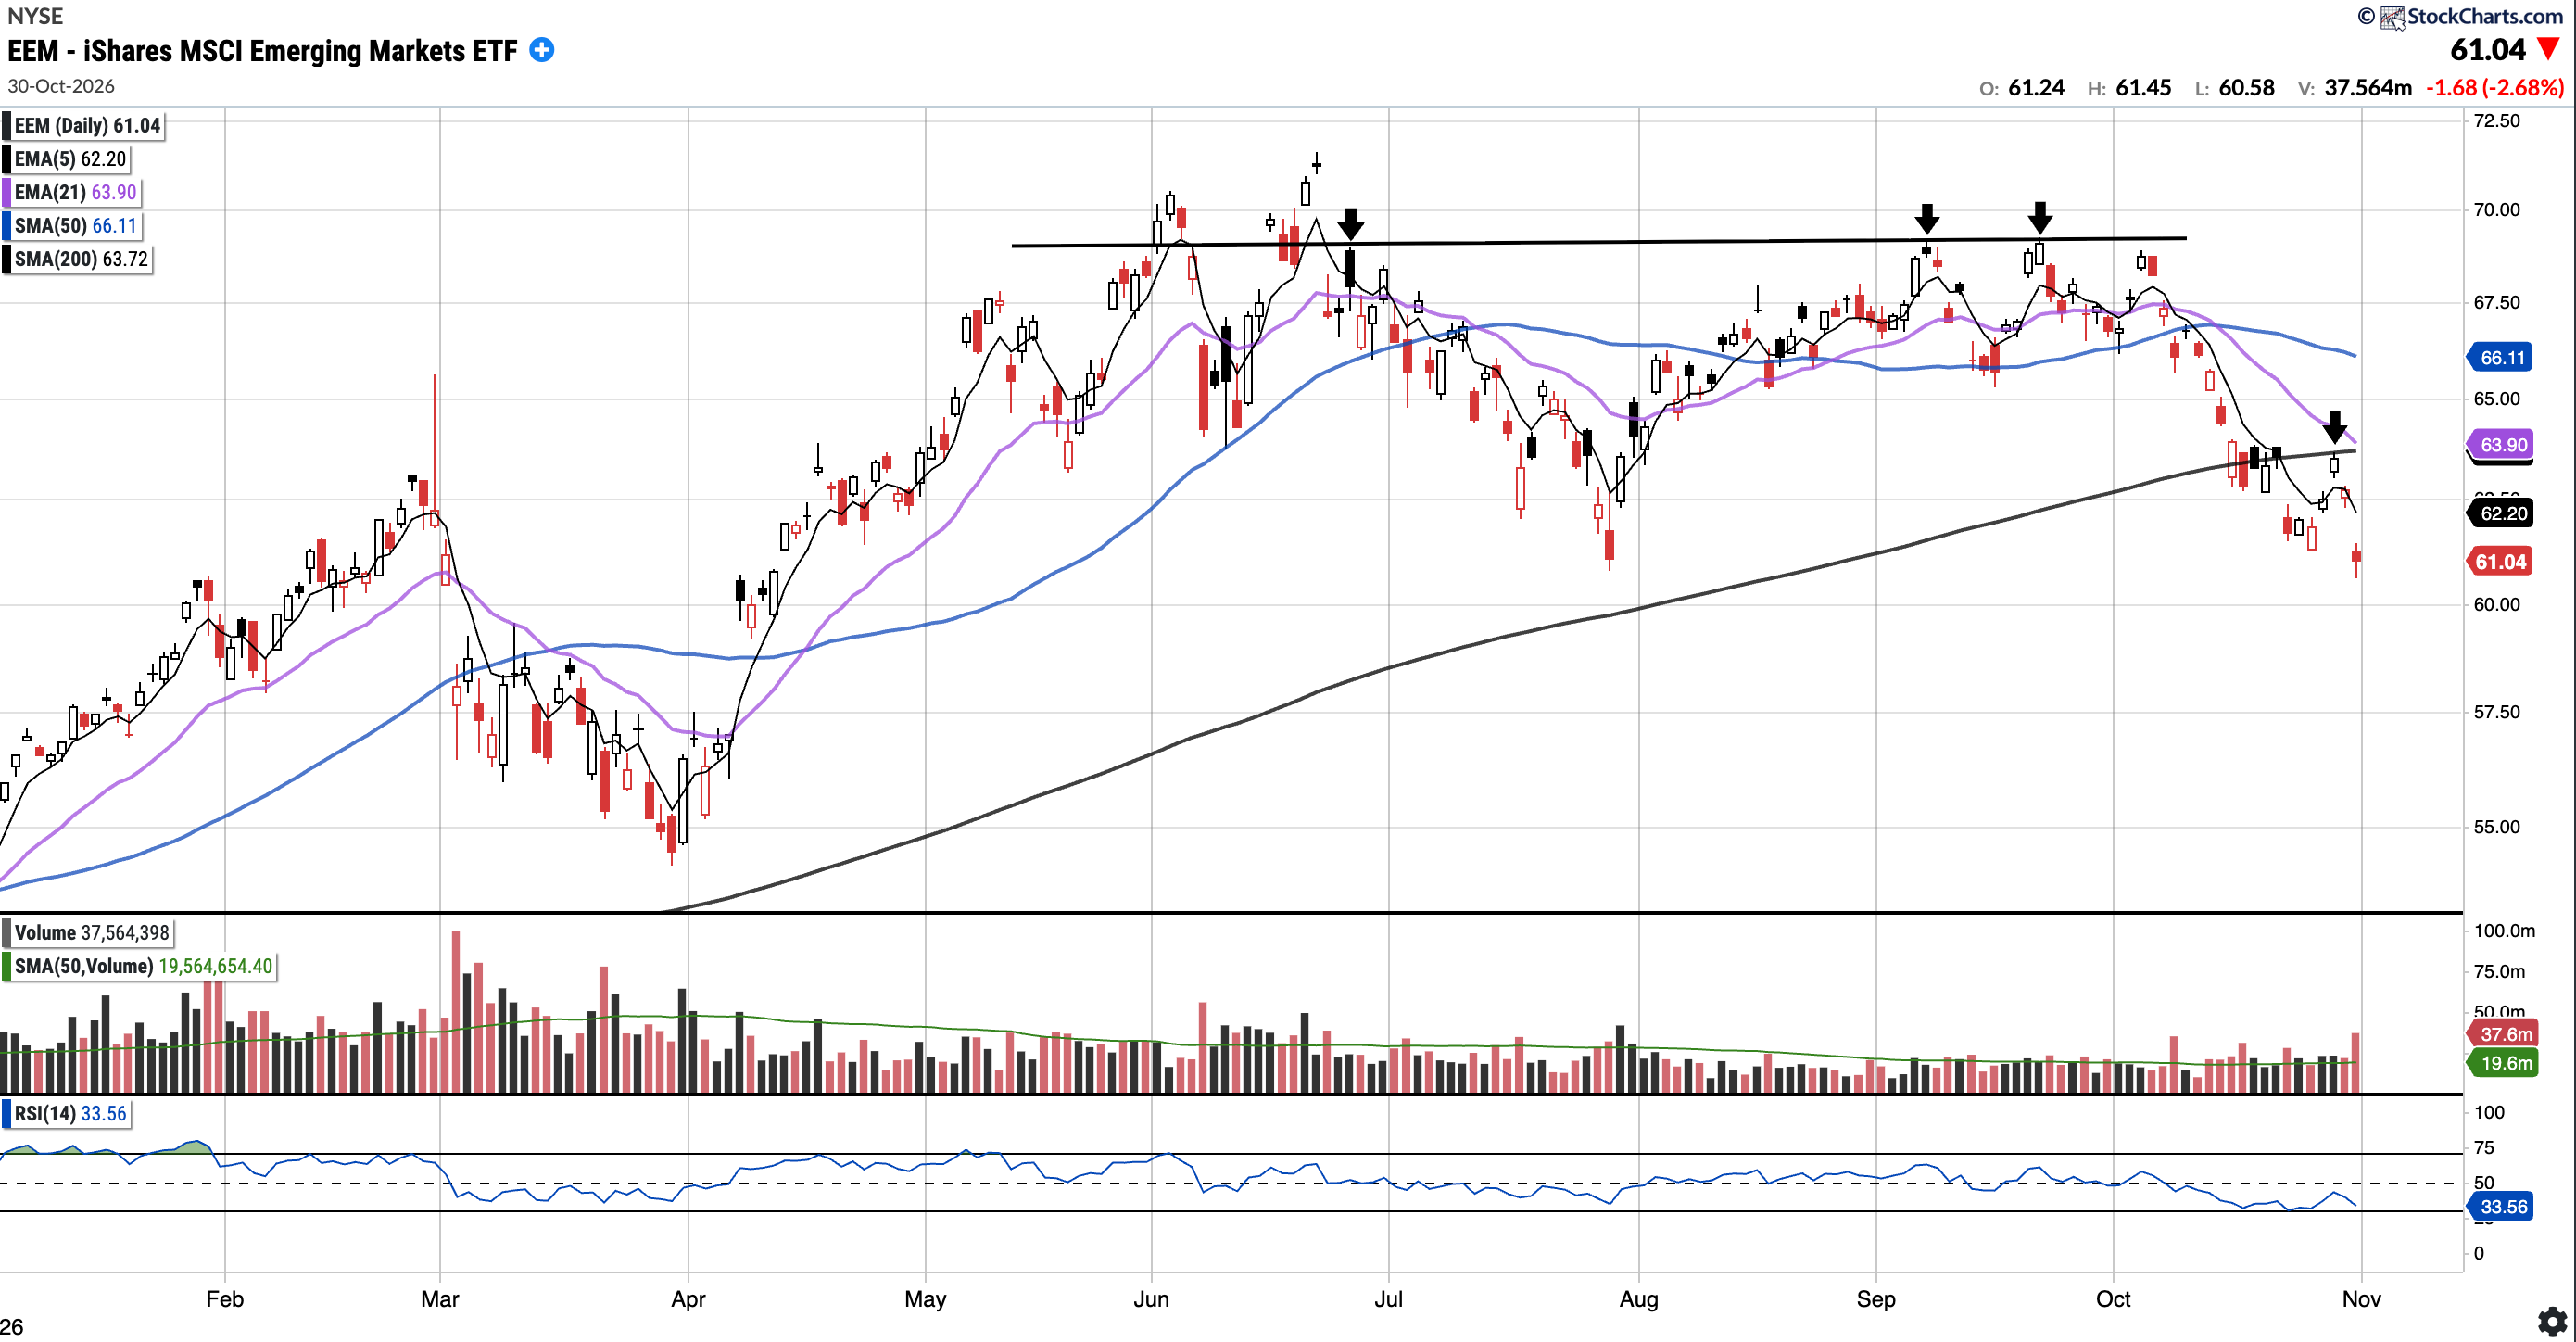
EEM
Currently trades at $61.04, 7.68% below the 50SMA and 4.20% below the 200SMA.
RSI 33.56
9.10% YTD
EEM rallied into the 200SMA ($63.72) on Wednesday where it was was rejected (see arrow). EEM closed the week below all of its key moving averages and at its lowest close since April. Notably Friday’s drop was on nearly double its average volume. Bulls will want to see the 200-day reclaimed soon given it has now spent close to 2 weeks below it.
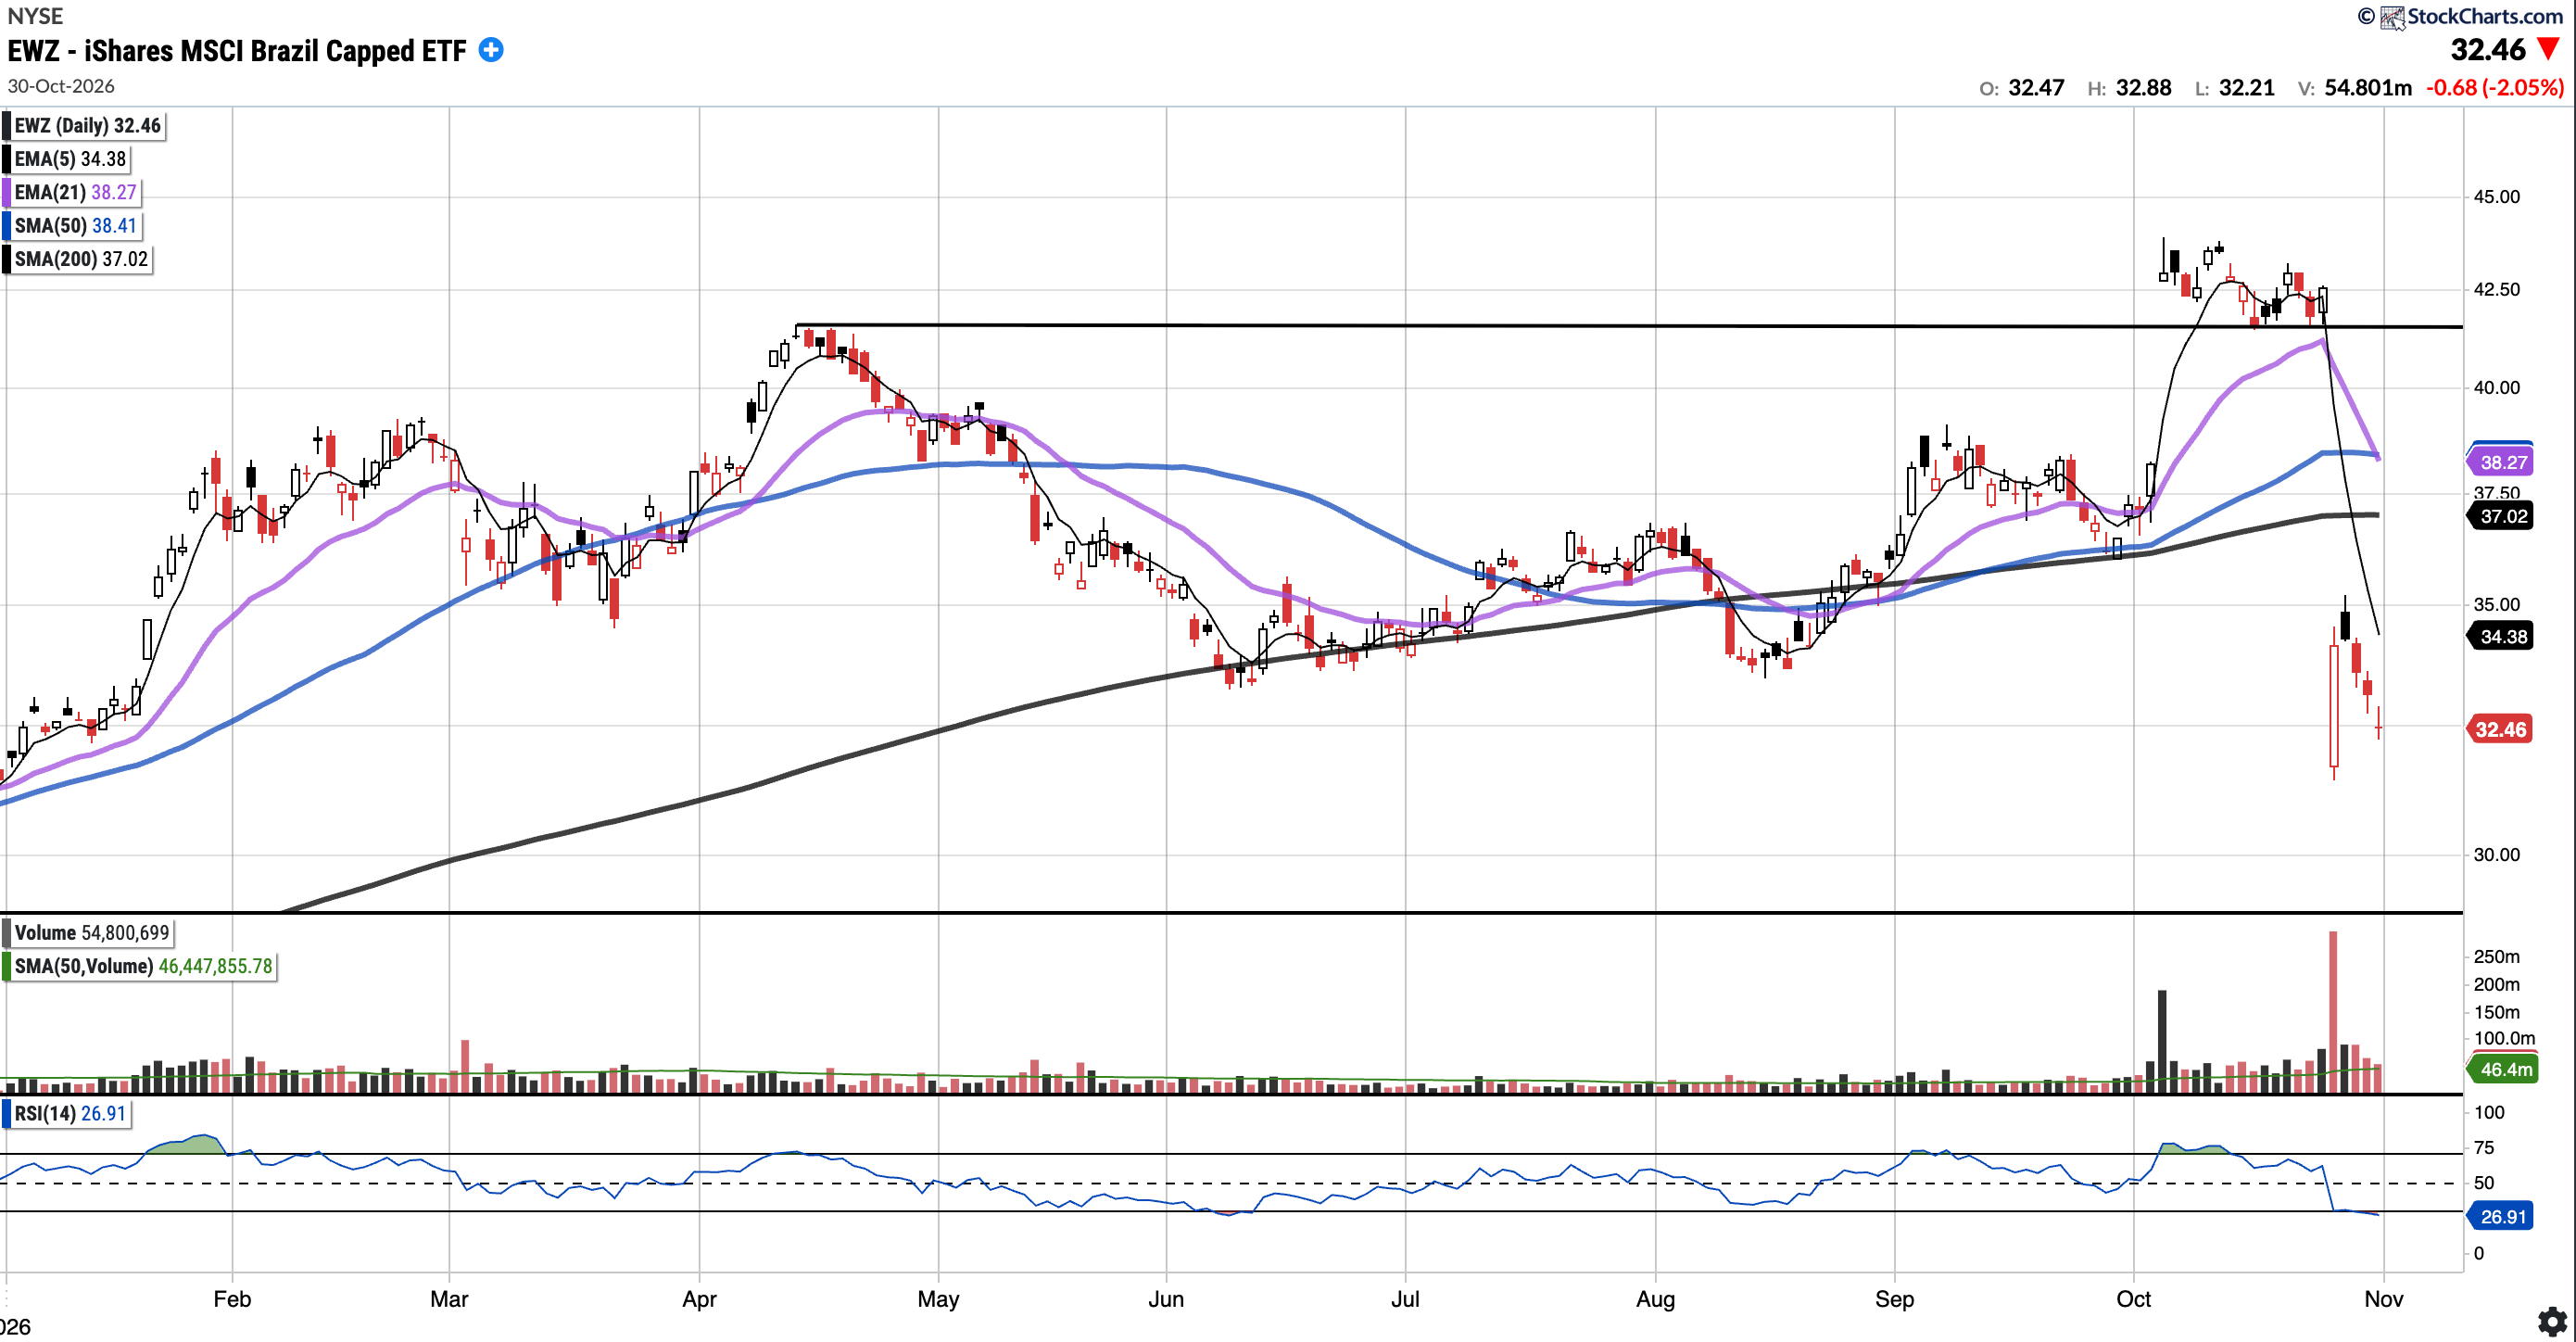
EWZ (Currently Long via IBZL)
Currently trades at $32.46, 15.49% below the 50SMA and 12.31% below the 200SMA.
RSI 26.91
1.77% YTD
EWZ fell nearly 20% on Monday, on above average volume, following the Brazilian presidential runoff, losing the April highs (see horizontal line) and all of its key moving averages in a single session. Positioning was crowded given Bolsonaro was expected to win, hence the unwind.
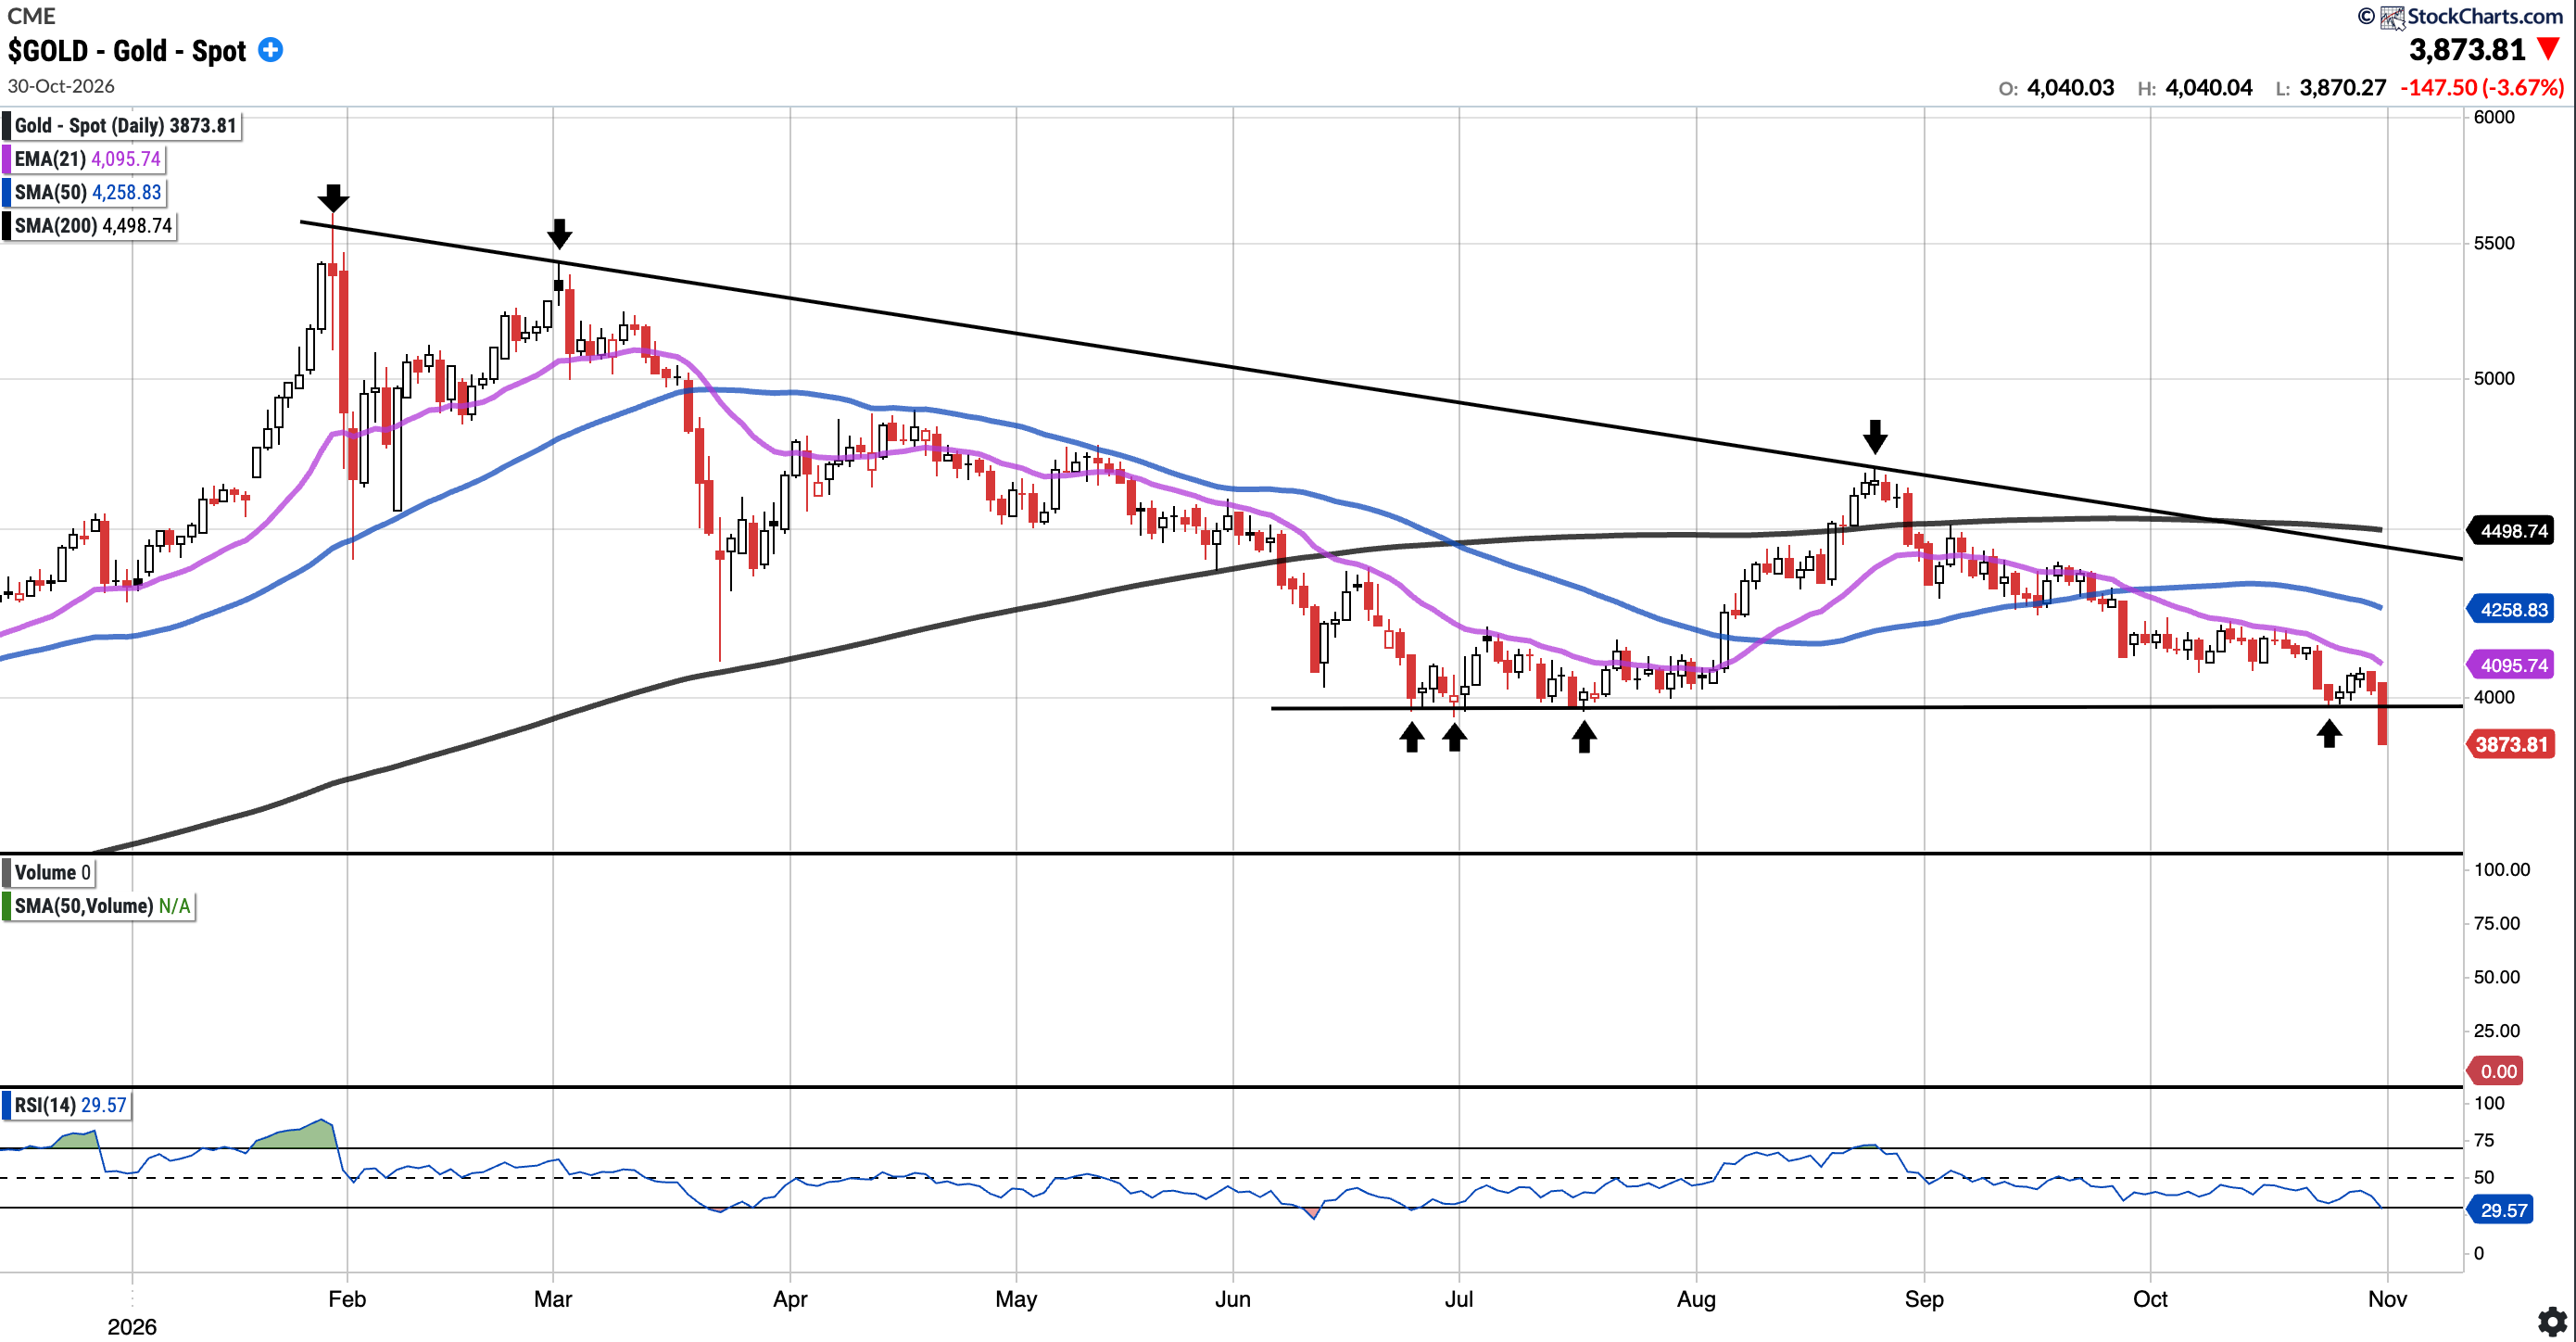
GOLD (Long Physical)
Currently trades at $3,873.81, 9.04% below the 50SMA and 13.89% below the 200SMA.
RSI 29.57
-10.39% YTD
Gold broke below the $3,950–$4,000 support zone flagged last week, which marked the June and July lows (see arrows). This is notable.
It closed the week at $3,873.81, its lowest weekly close since November 2025, and remains below all key moving averages. Bulls will want to see the $3,950–$4,000 zone reclaimed initially, followed by the 21-day EMA.
SOXX
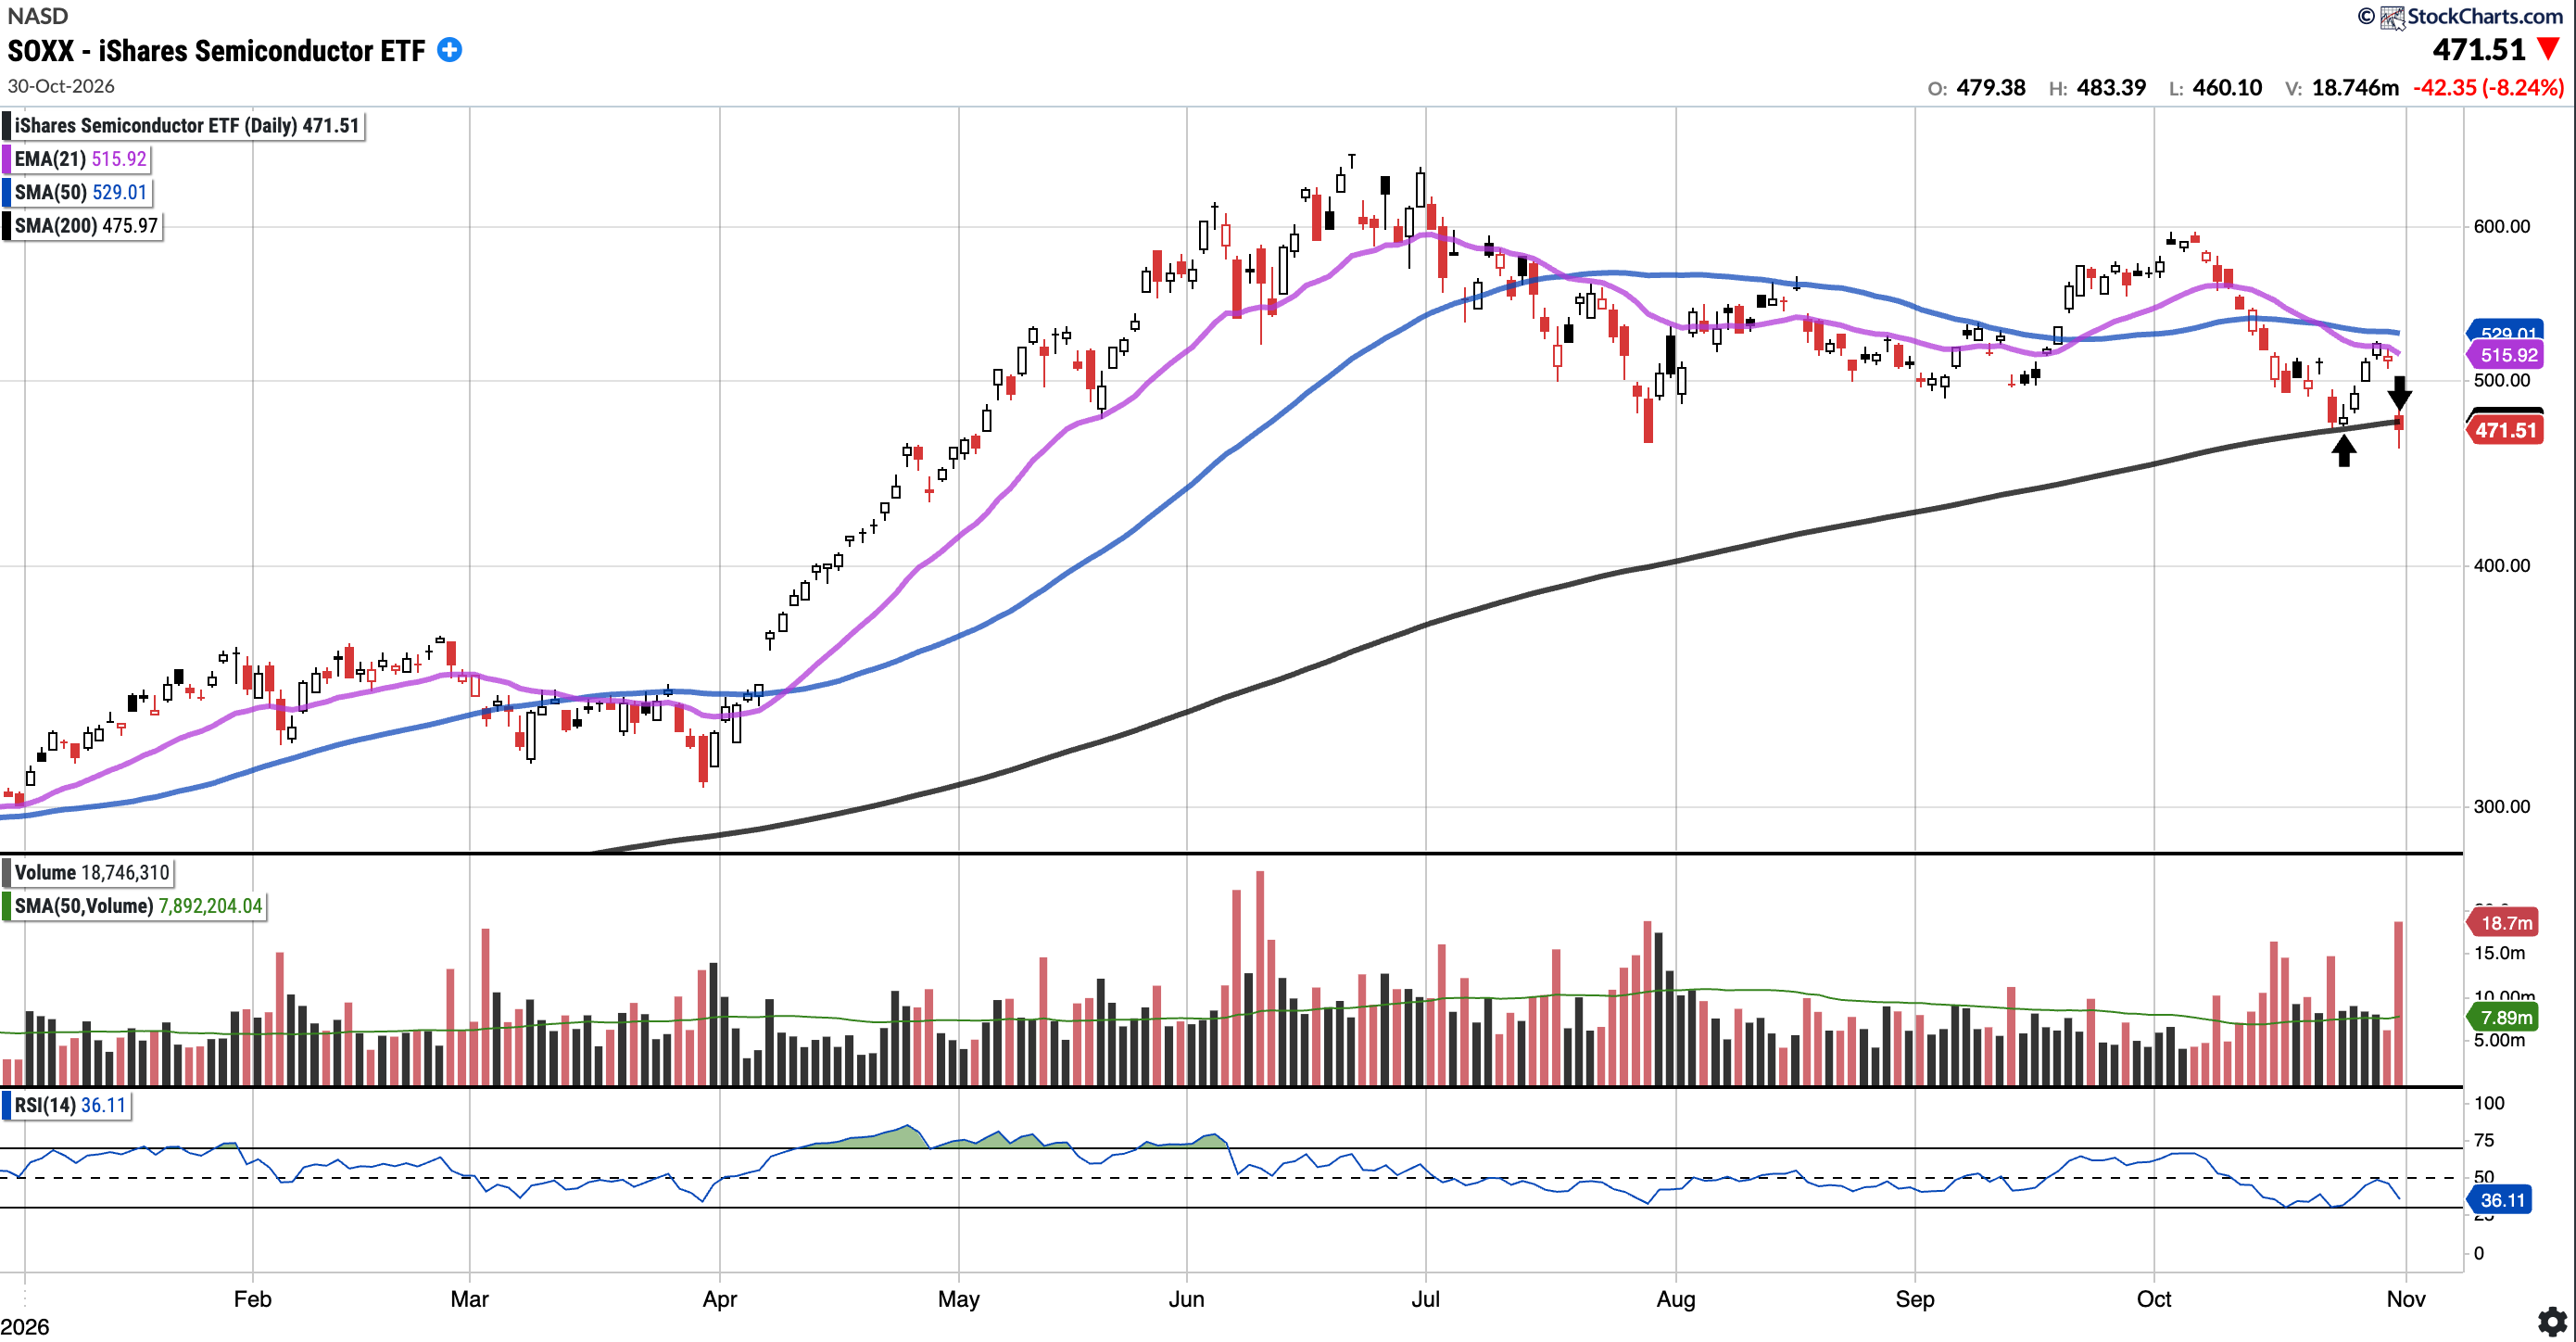
Currently trades at $471.51, 10.87% below the 50SMA and 0.94% below the 200SMA.
RSI 36.11
50.57% YTD
Despite a volatile week, SOXX closed just 1.40% below last Friday’s close ($478.20). Price bounced off the 200-day SMA (see up arrow) and rallied more than 9% back to the 21EMA by Wednesday before rolling over.
On Friday it dropped 8.24% on significant volume, which took it back below the 200-day moving average (see down arrow). Bulls will want the 200 day reclaimed promptly.
AMZN (Currently Long)
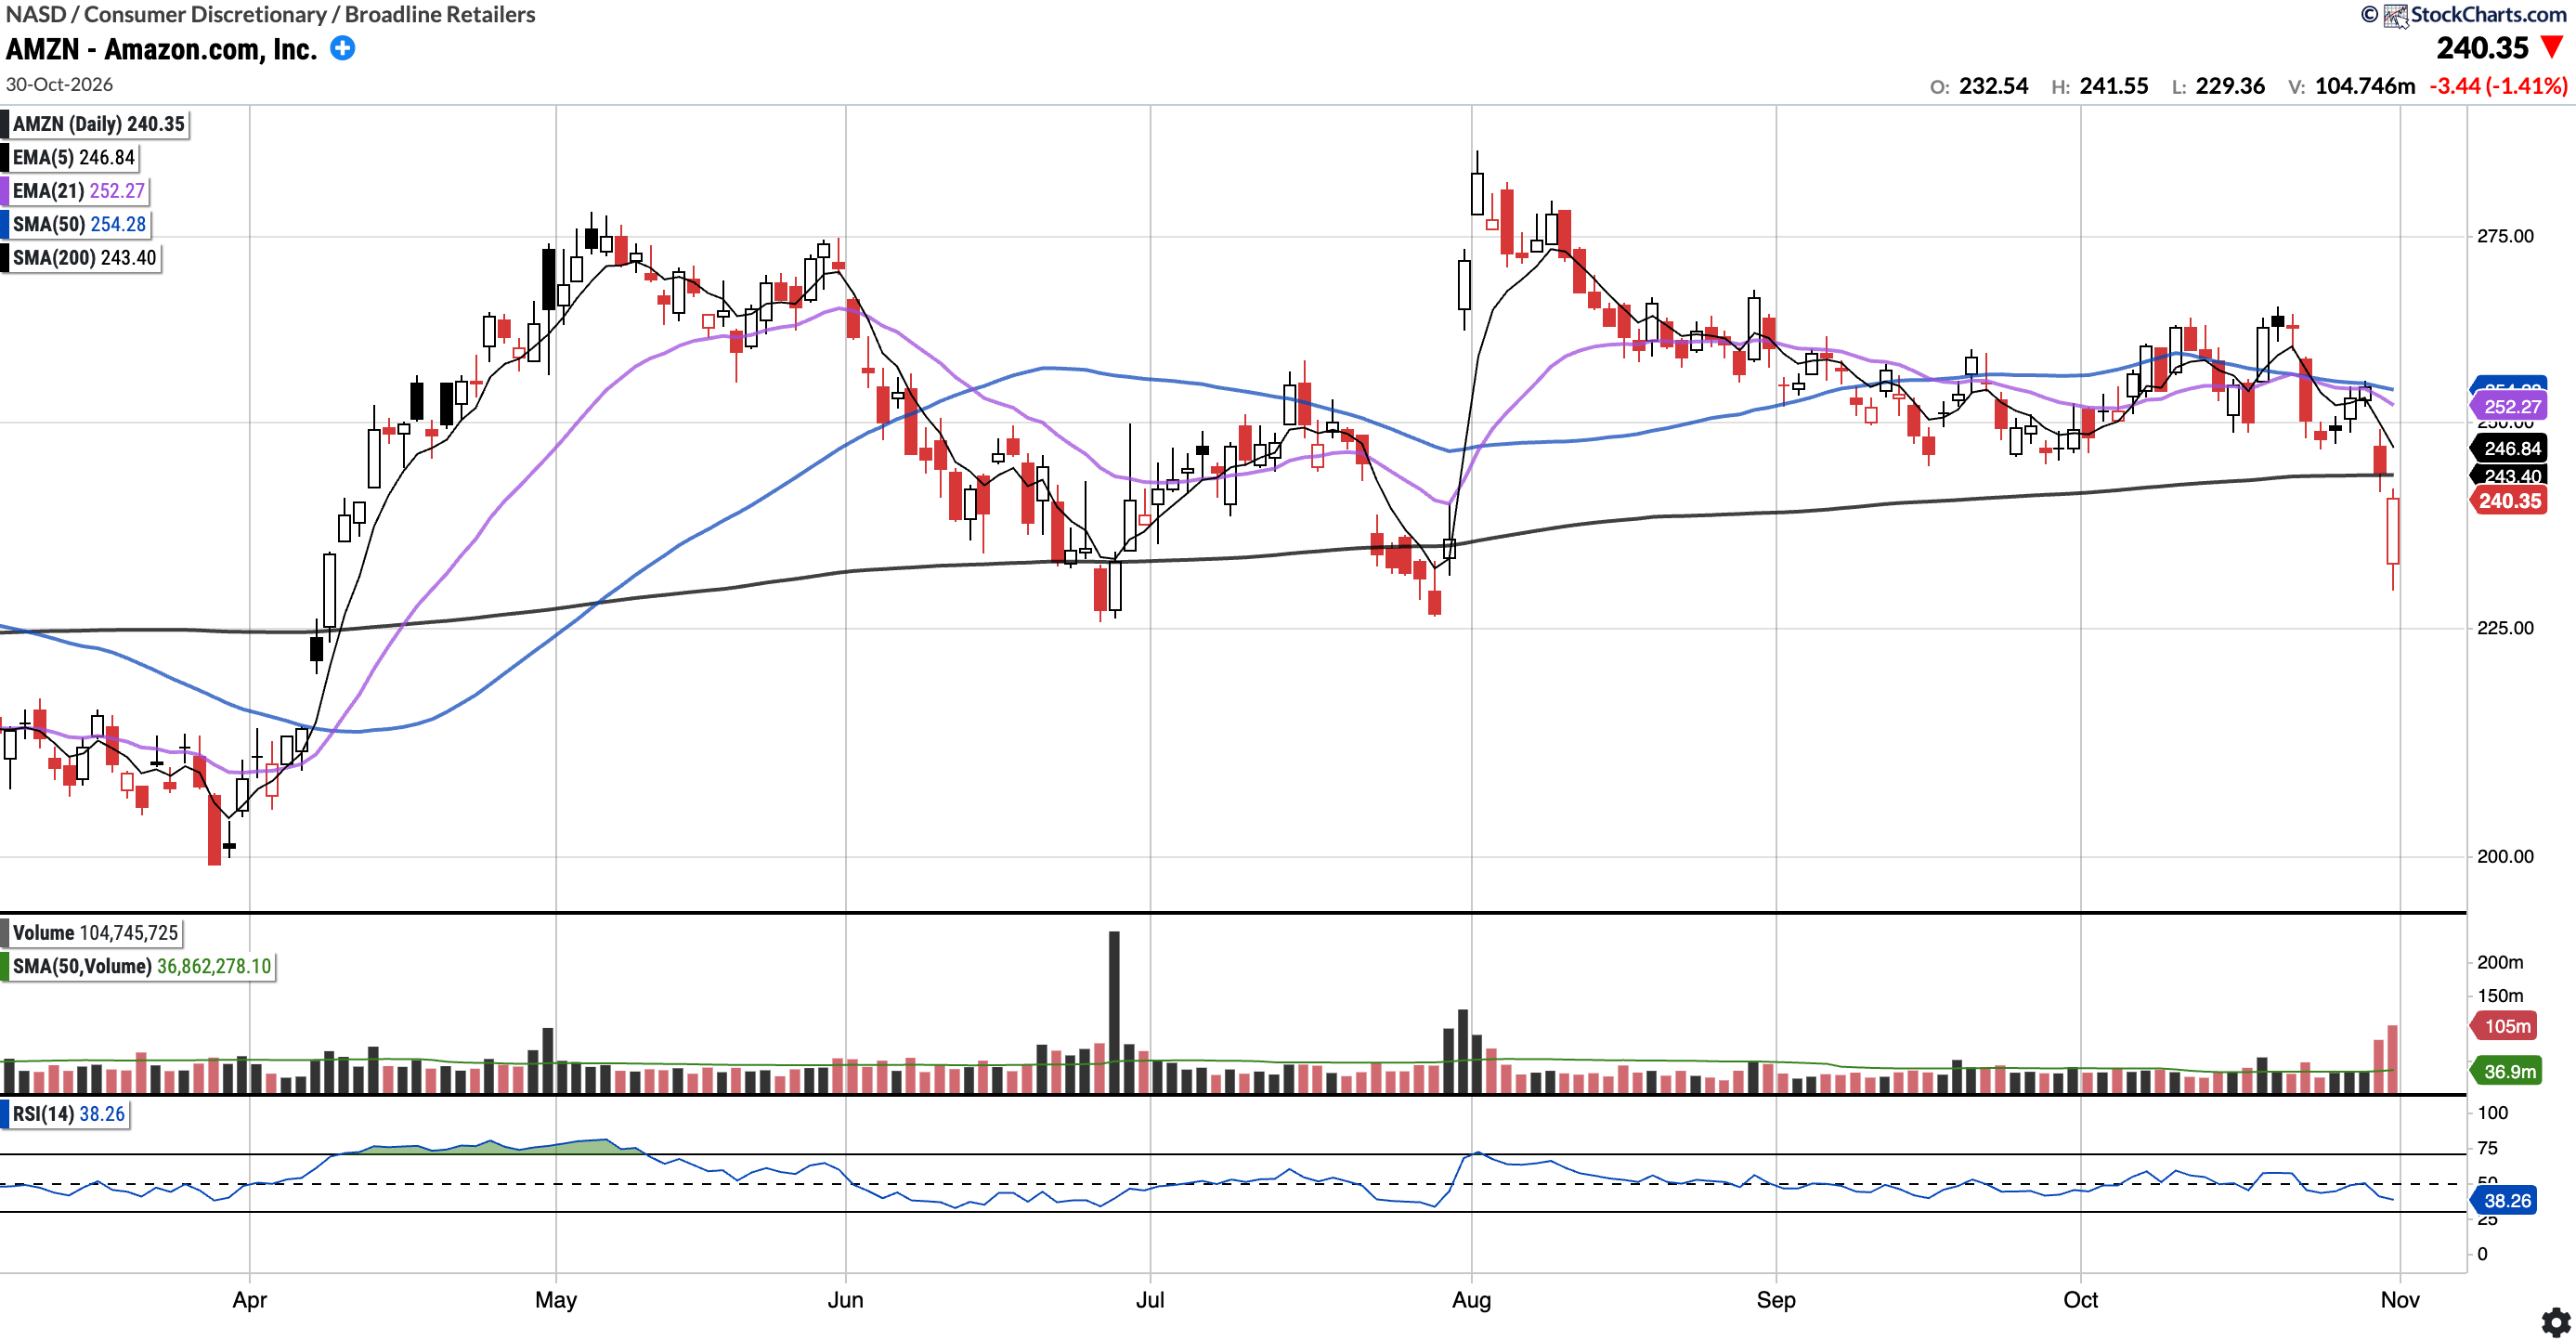
Currently trades at $240.35, 5.48% below the 50SMA and 1.25% below the 200SMA.
RSI 38.26
6.11% YTD
AMZN gapped lower on Friday following earnings, but recouped much of those losses, trading up throughout the day. Relative to the rest of the market, AMZN did show some relative strength.
Notably, however, AMZN closed the week below the 200-day SMA after a breakdown of that moving average (see arrow). Bulls will want to see the price reclaim the 200-day SMA.
LLY (Currently Long)
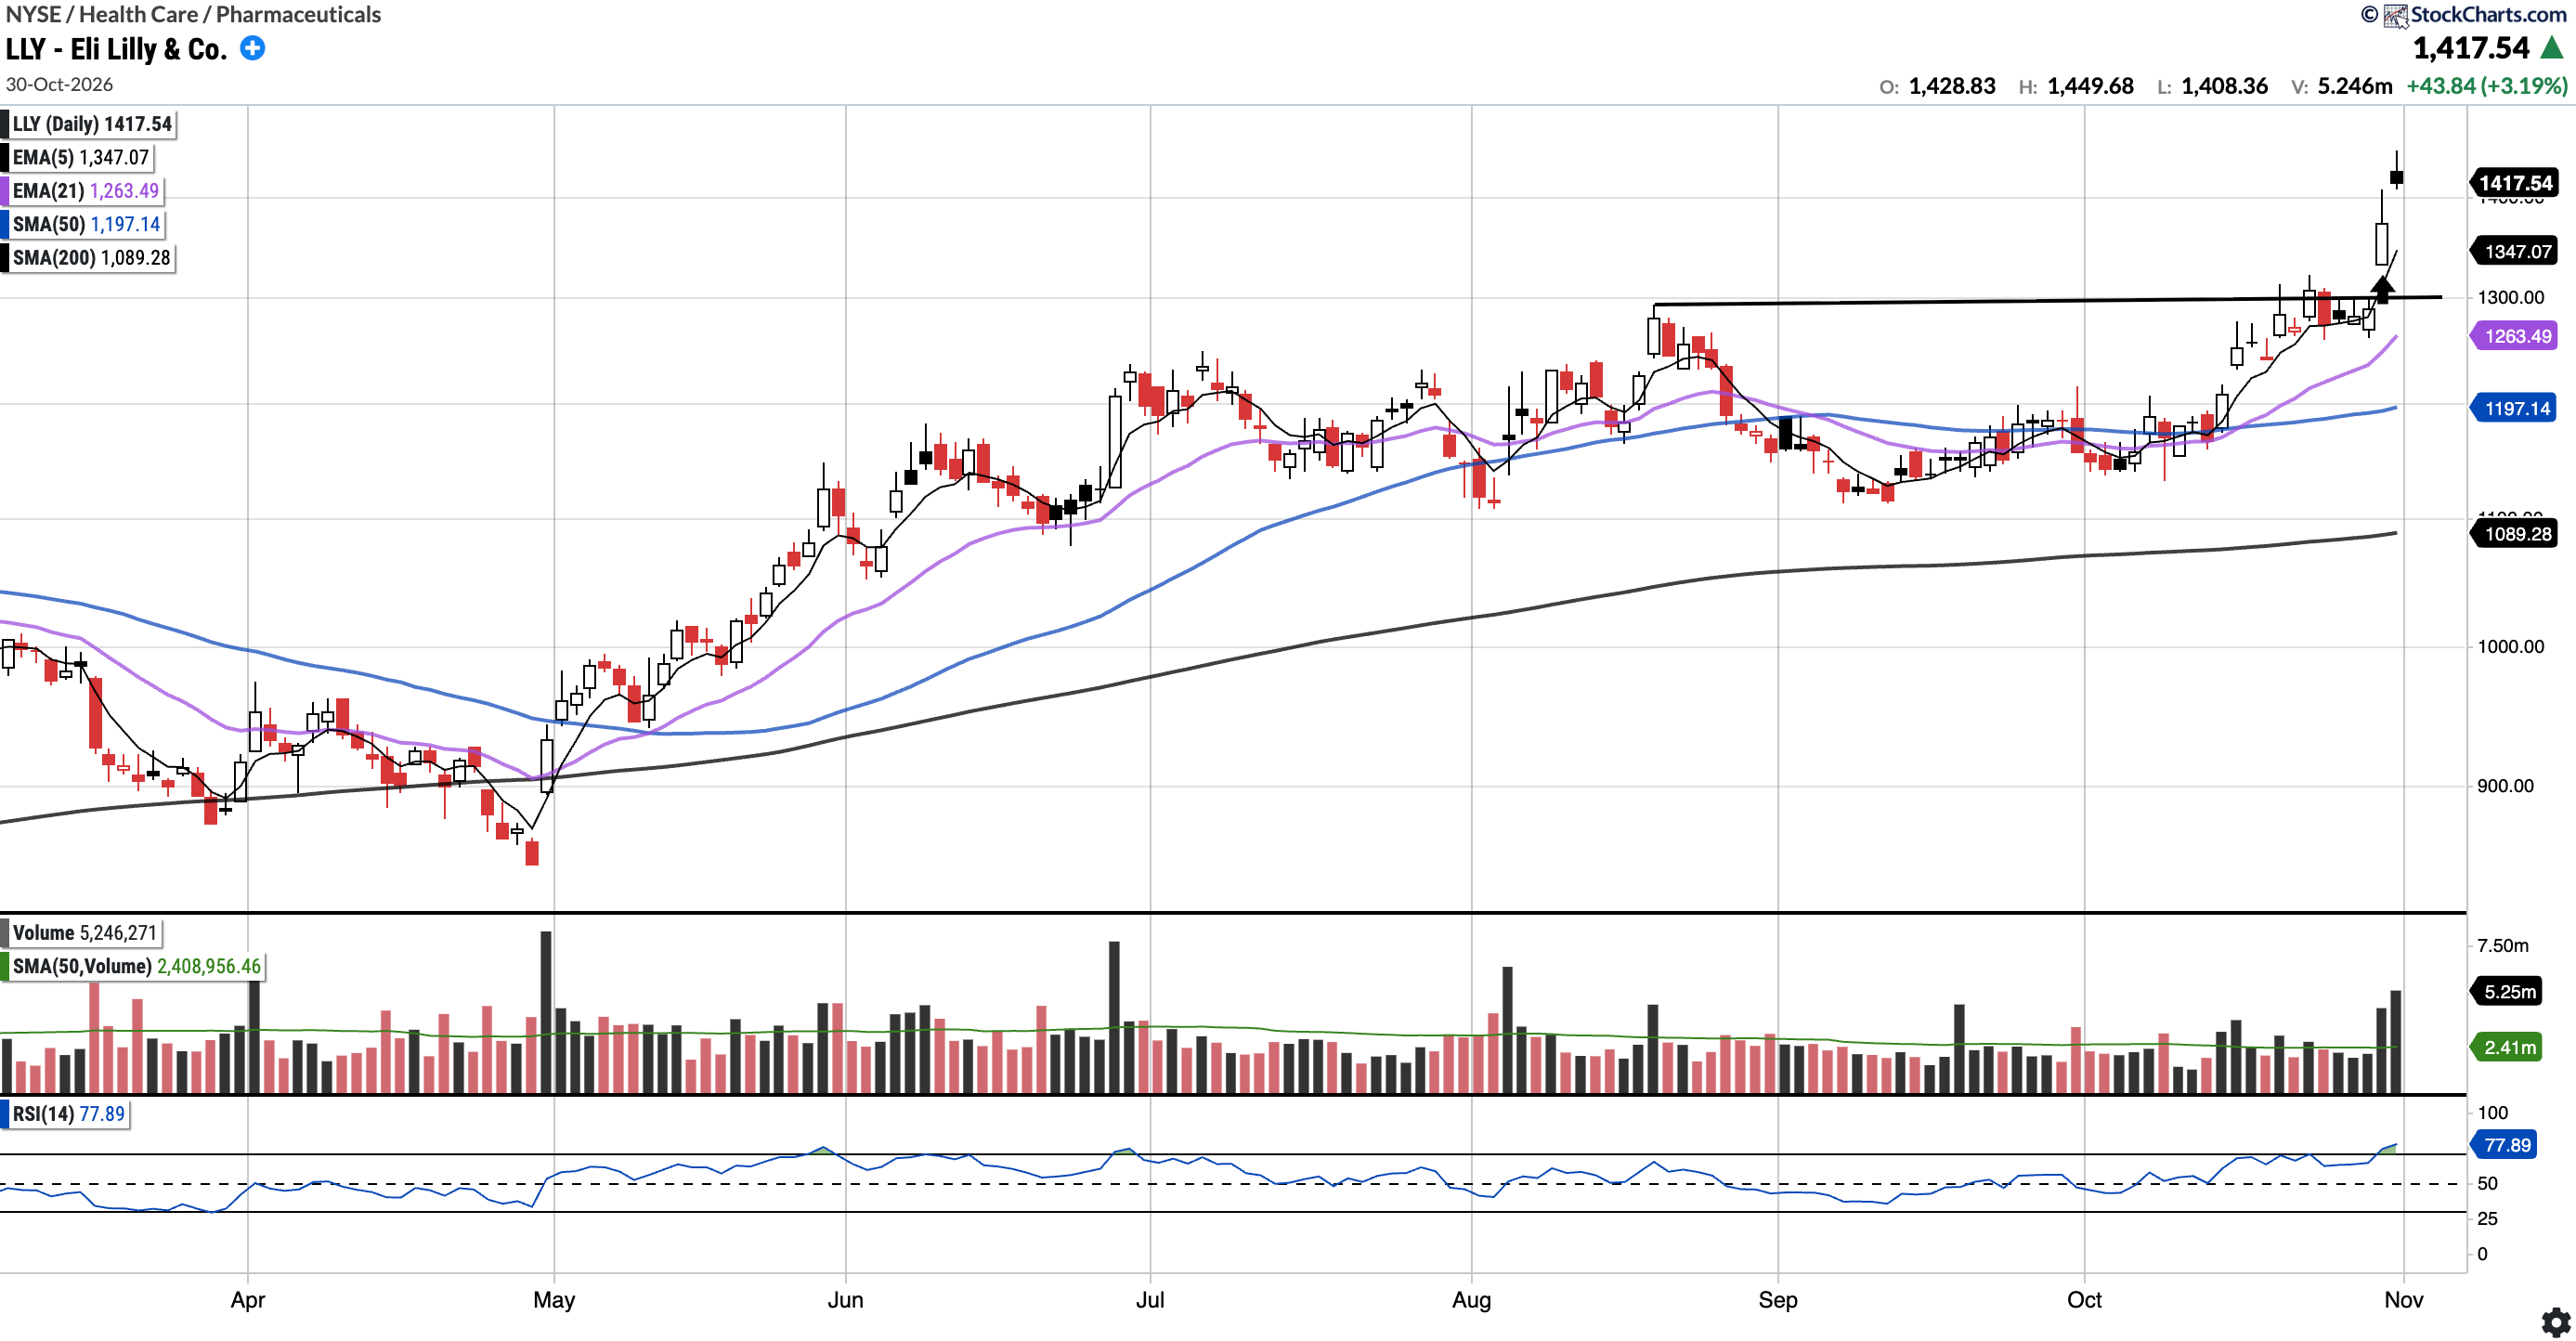
Currently trades at $1,417.54, 18.41% above the 50SMA and 30.14% above the 200SMA.
RSI 77.89
31.84% YTD
LLY broke out this week on volume following earnings, gapping above the August highs near $1,295 (see horizontal line) on Thursday and following through on Friday, with an all-time-high weekly close of $1,417.54. The $1,295 breakout level is the level that may get retested on a pullback, and bulls will want that to hold.
We trimmed some shares for +59% (see the notable portfolio changes section below).
Portfolio live updates can be accessed here: Portfolio Live Updates
MSFT (Currently Long)
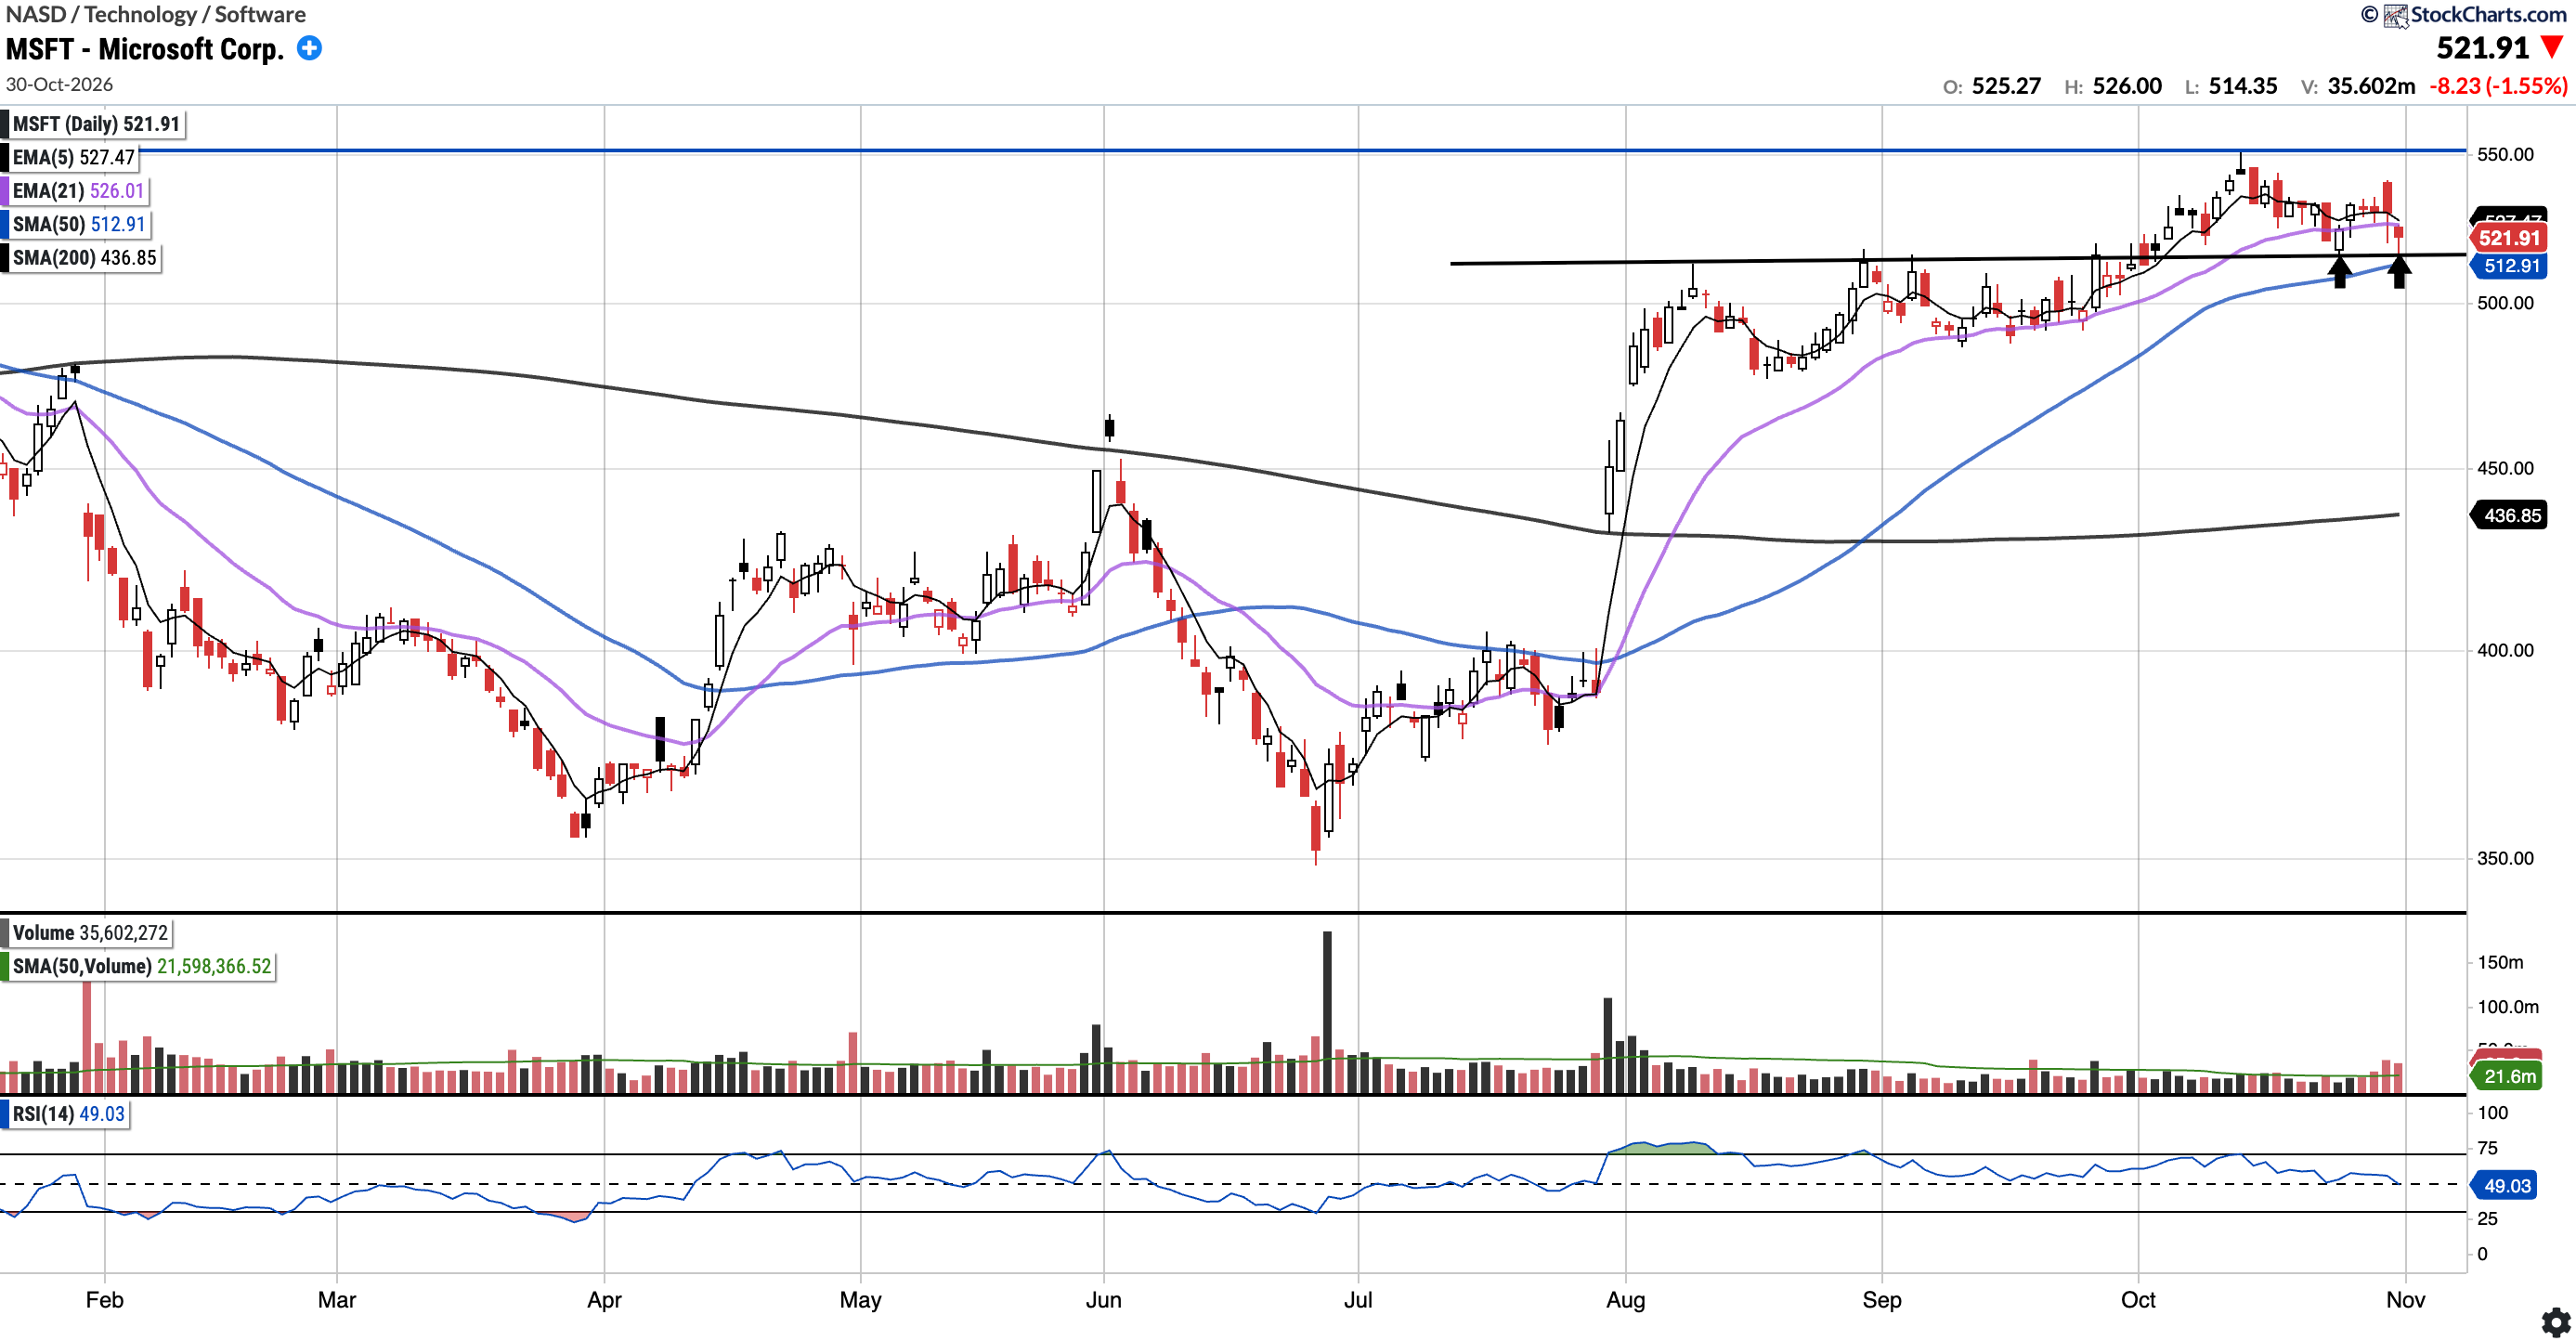
Currently trades at $521.91, 1.75% above the 50SMA and 19.47% above the 200SMA.
RSI 49.03
11.05% YTD
MSFT gapped higher on Thursday following strong earnings, but failed to make a new ATH, which is notable given it has been rejected at that $550 level around four times now over the last couple of years. Due to this, we trimmed shares post the print.
Friday’s selloff pushed the stock back below the 21-day EMA, but the 50-day SMA was retested and held. As noted last week, the 50-day was the area of interest on a post-earnings dip.
Bulls will want to see the 21-day EMA reclaimed, with the price holding above the $515 level.
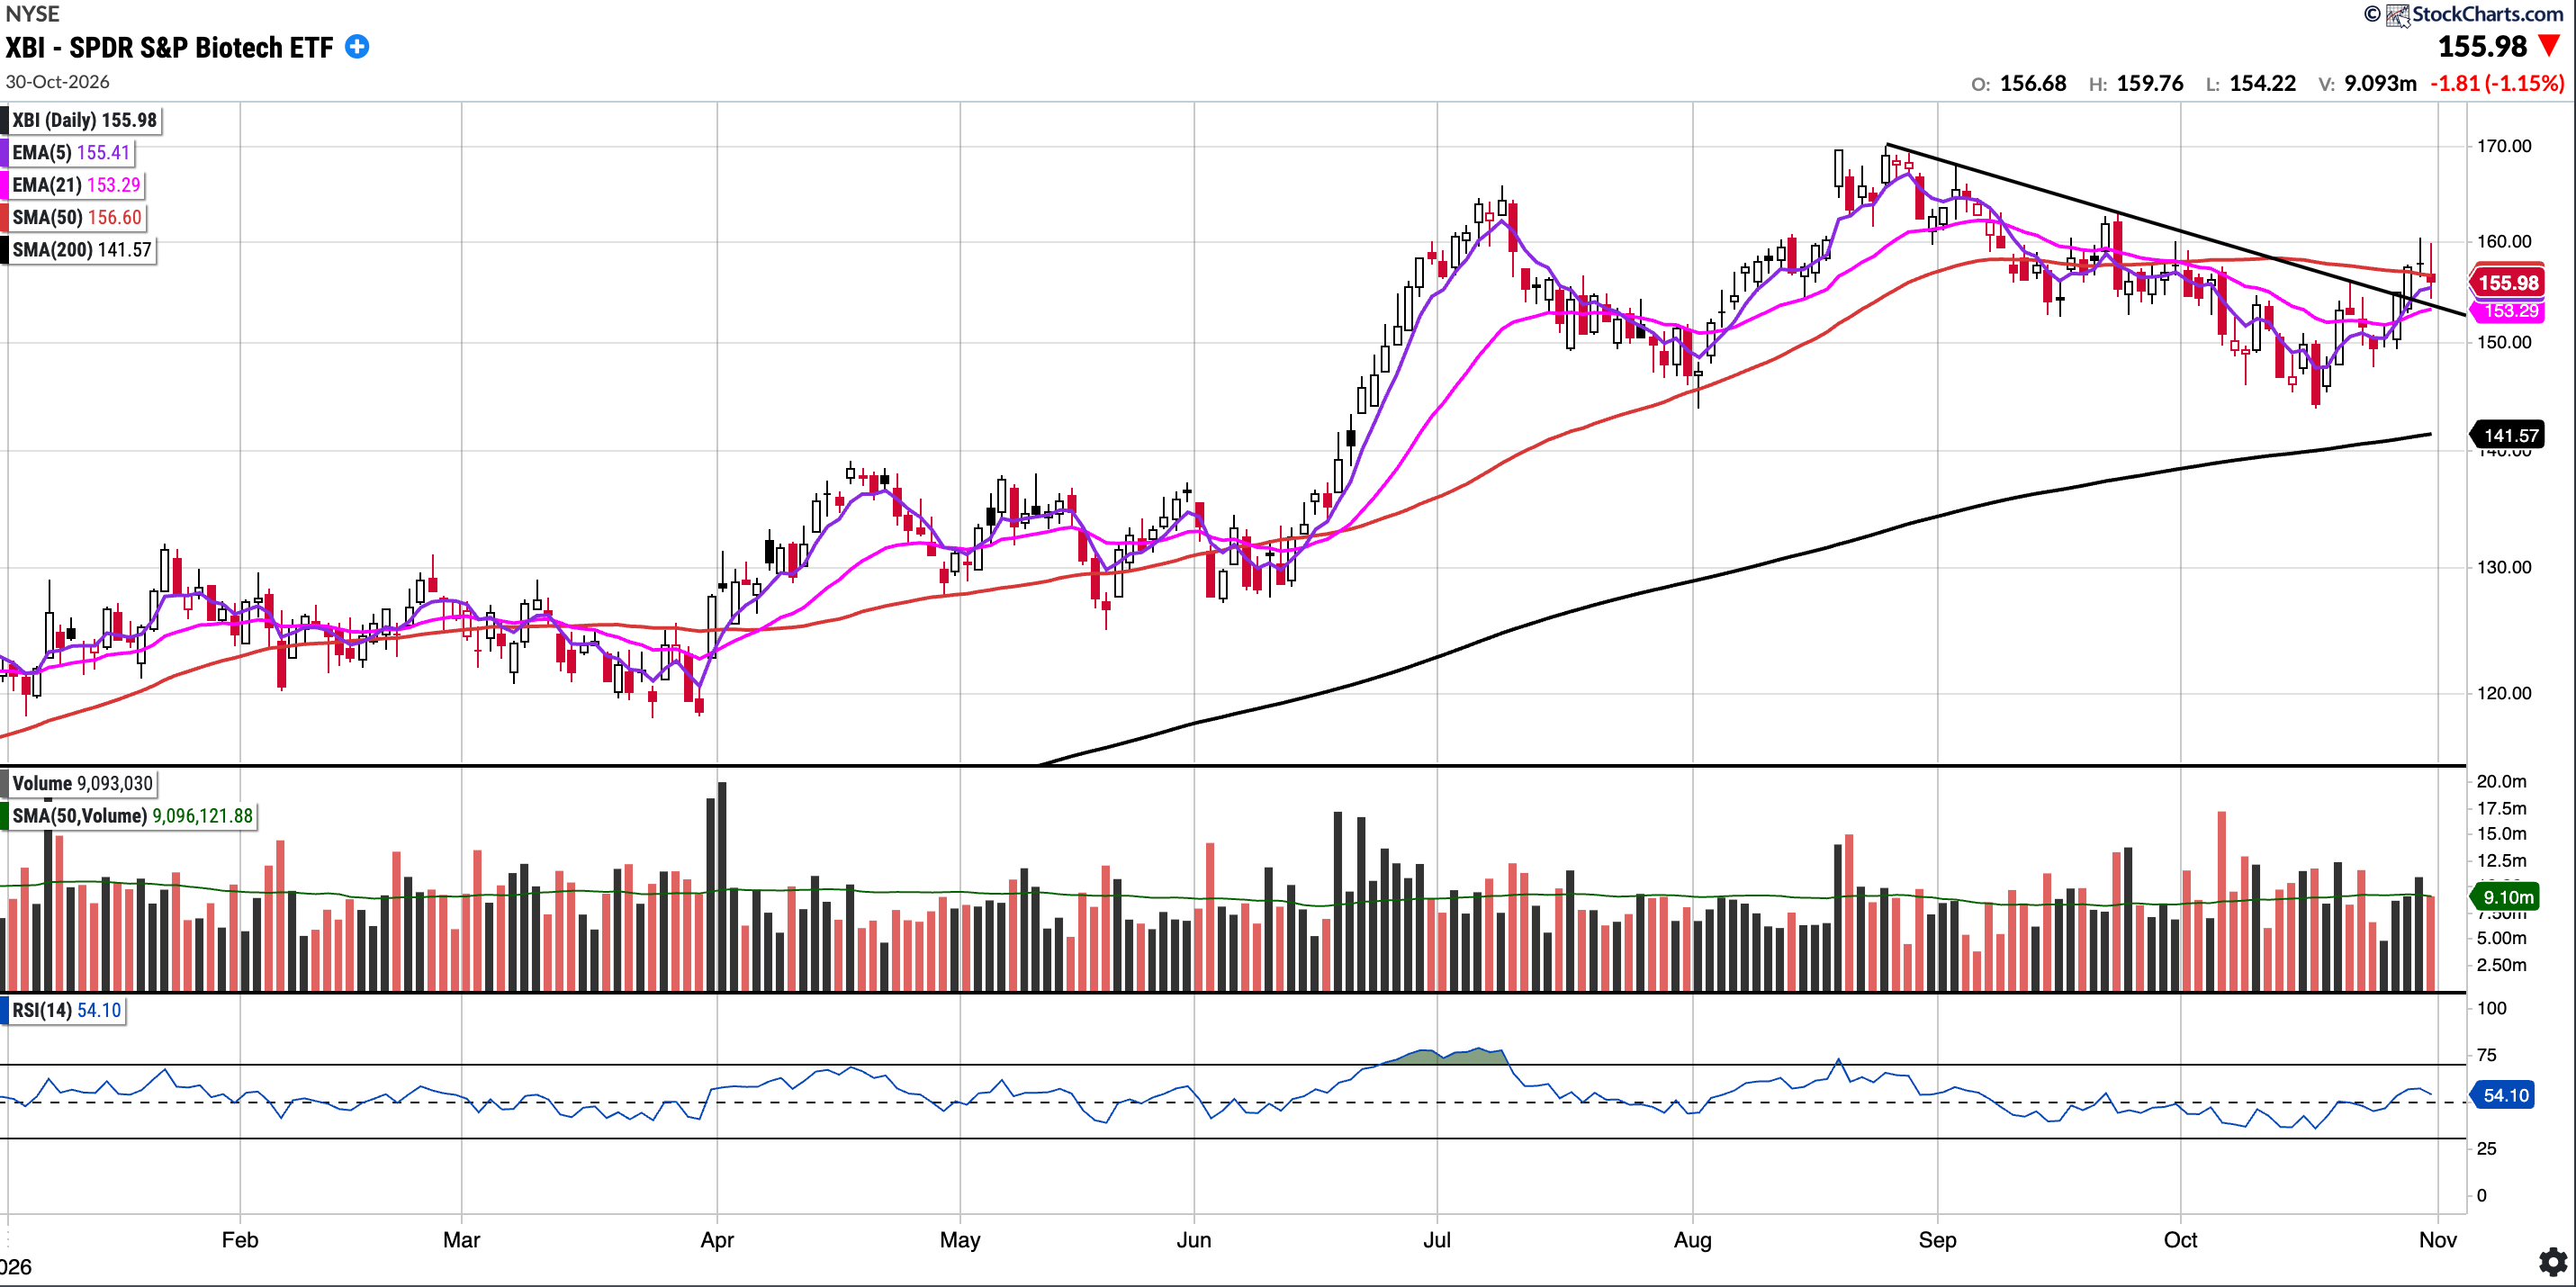
XBI
Currently trades at $155.98, 0.40% below the 50SMA and 10.18% above the 200SMA.
RSI 54.10
28.48% YTD
XBI broke out of its descending trend-line on Tuesday and has reclaimed its near-term moving averages. XBI did undergo a bullish 5/21 cross, though it is sitting right below 50-day SMA. Bulls would like to see that reclaimed and flipped to support. A breakdown below the $154 level could bring about a re-test of the low 140’s again.
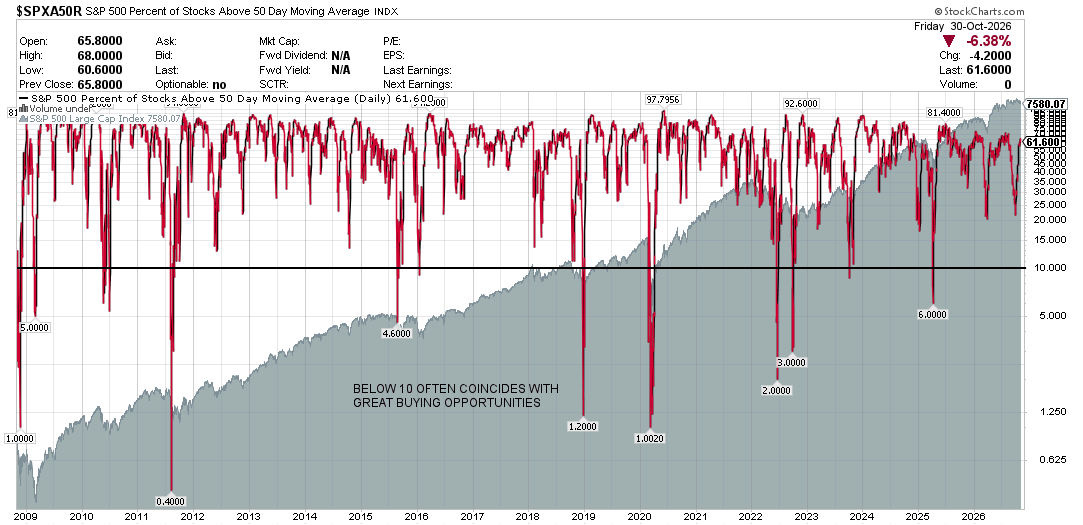
S&P 500 Percentage of Stocks Above the 50 Day Moving Average: Currently 61.60%
Breadth increased decently again this week, with the percentage of stocks above the 50-day moving average now at 61.60% compared to 58.80% last week.
Notable portfolio changes in previous week (all updated live in subscriber channels):
INTC: Exited the INTC position on October 28 at $94.
SKHY: Trimmed the SKHY position on October 28, leaving house shares only.