

Hope you all are having a good weekend. Below, we will be previewing the upcoming week’s events and providing a portfolio update as usual.
Format for what is covered in this weekly preview:
A Look at the Indices
Key Upcoming Economic Events
Upcoming Earnings
Charts
Current Portfolio Holdings (Scroll here for current positions)
Sizing | Cost Basis | Timeframe | Planned Moves
Closing Thoughts (Scroll here for my market commentary)
I recommend checking out the most recent in-depth Monthly Portfolio and Performance Update below (the new post will also be published within the next day).

For all readers a reminder that a premium subscription includes:
Live Portfolio updates (All Buys and Sells) in Subscriber only Channels
Favourite set-up Ideas, Market Memos plus Full archive
Monthly in depth portfolio & performance updates
Annual Tier: Discord access for live trading account updates and AMAs.
Indices
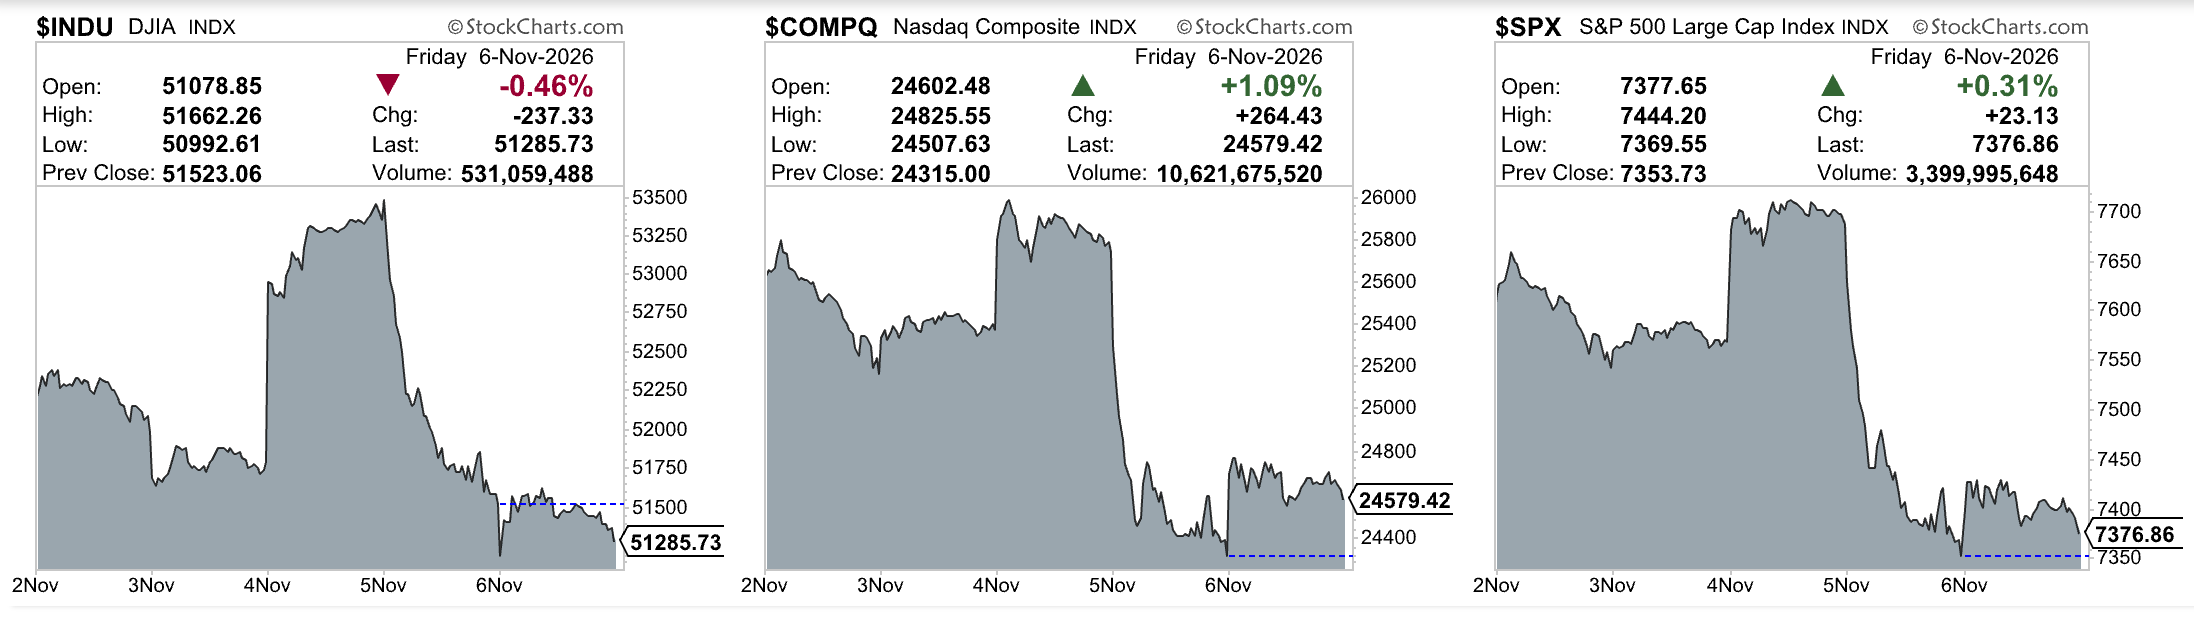
Dow Jones Industrial Average declined -0.94% in the last week
S&P 500 declined -2.68% in the last week
Nasdaq Composite declined -3.37% in the last week
IWM declined -2.03% in the last week
Key upcoming economic events
Monday, November 9
Wholesale Trade (September)
Conference Board Employment Trends Index (October)
NY Fed Survey of Consumer Expectations (October)
Tuesday, November 10
Consumer Price Index (October)
Real Earnings (October)
NFIB Small Business Optimism (October)
ADP Weekly Employment (NER Pulse)
NY Fed Household Debt and Credit Report (Q3)
EIA Short-Term Energy Outlook
Fed speakers: Waller, Logan, Schmid and Bowman
Wednesday, November 11
Veterans Day (US bond market closed, stock market open)
MBA Mortgage Applications
Thursday, November 12
Initial and Continuing Jobless Claims
Existing Home Sales (October)
Monthly Treasury Statement (October)
EIA Weekly Petroleum Status Report (shifted from Wednesday for the holiday)
Fed H.4.1 balance sheet release
Friday, November 13
Producer Price Index (October)
Import & Export Price Indexes (Oct)
Upcoming Earnings
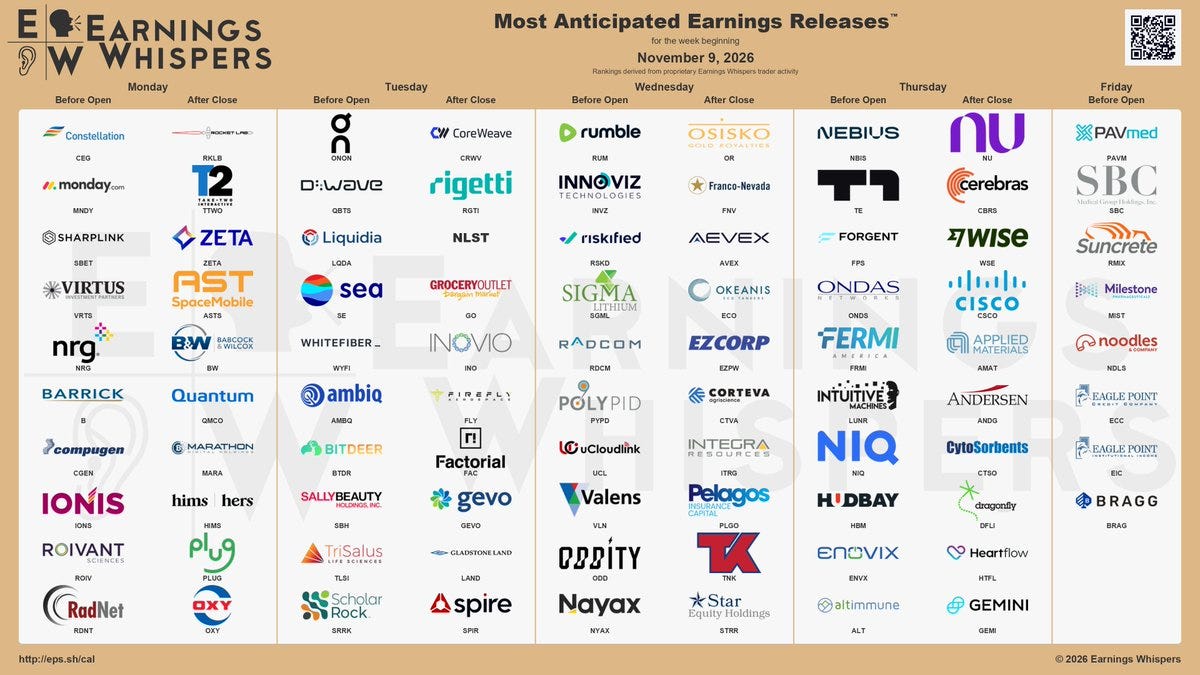
Below is the infographic by Earnings Whispers highlighting the schedule for this week:
Charts
SPX
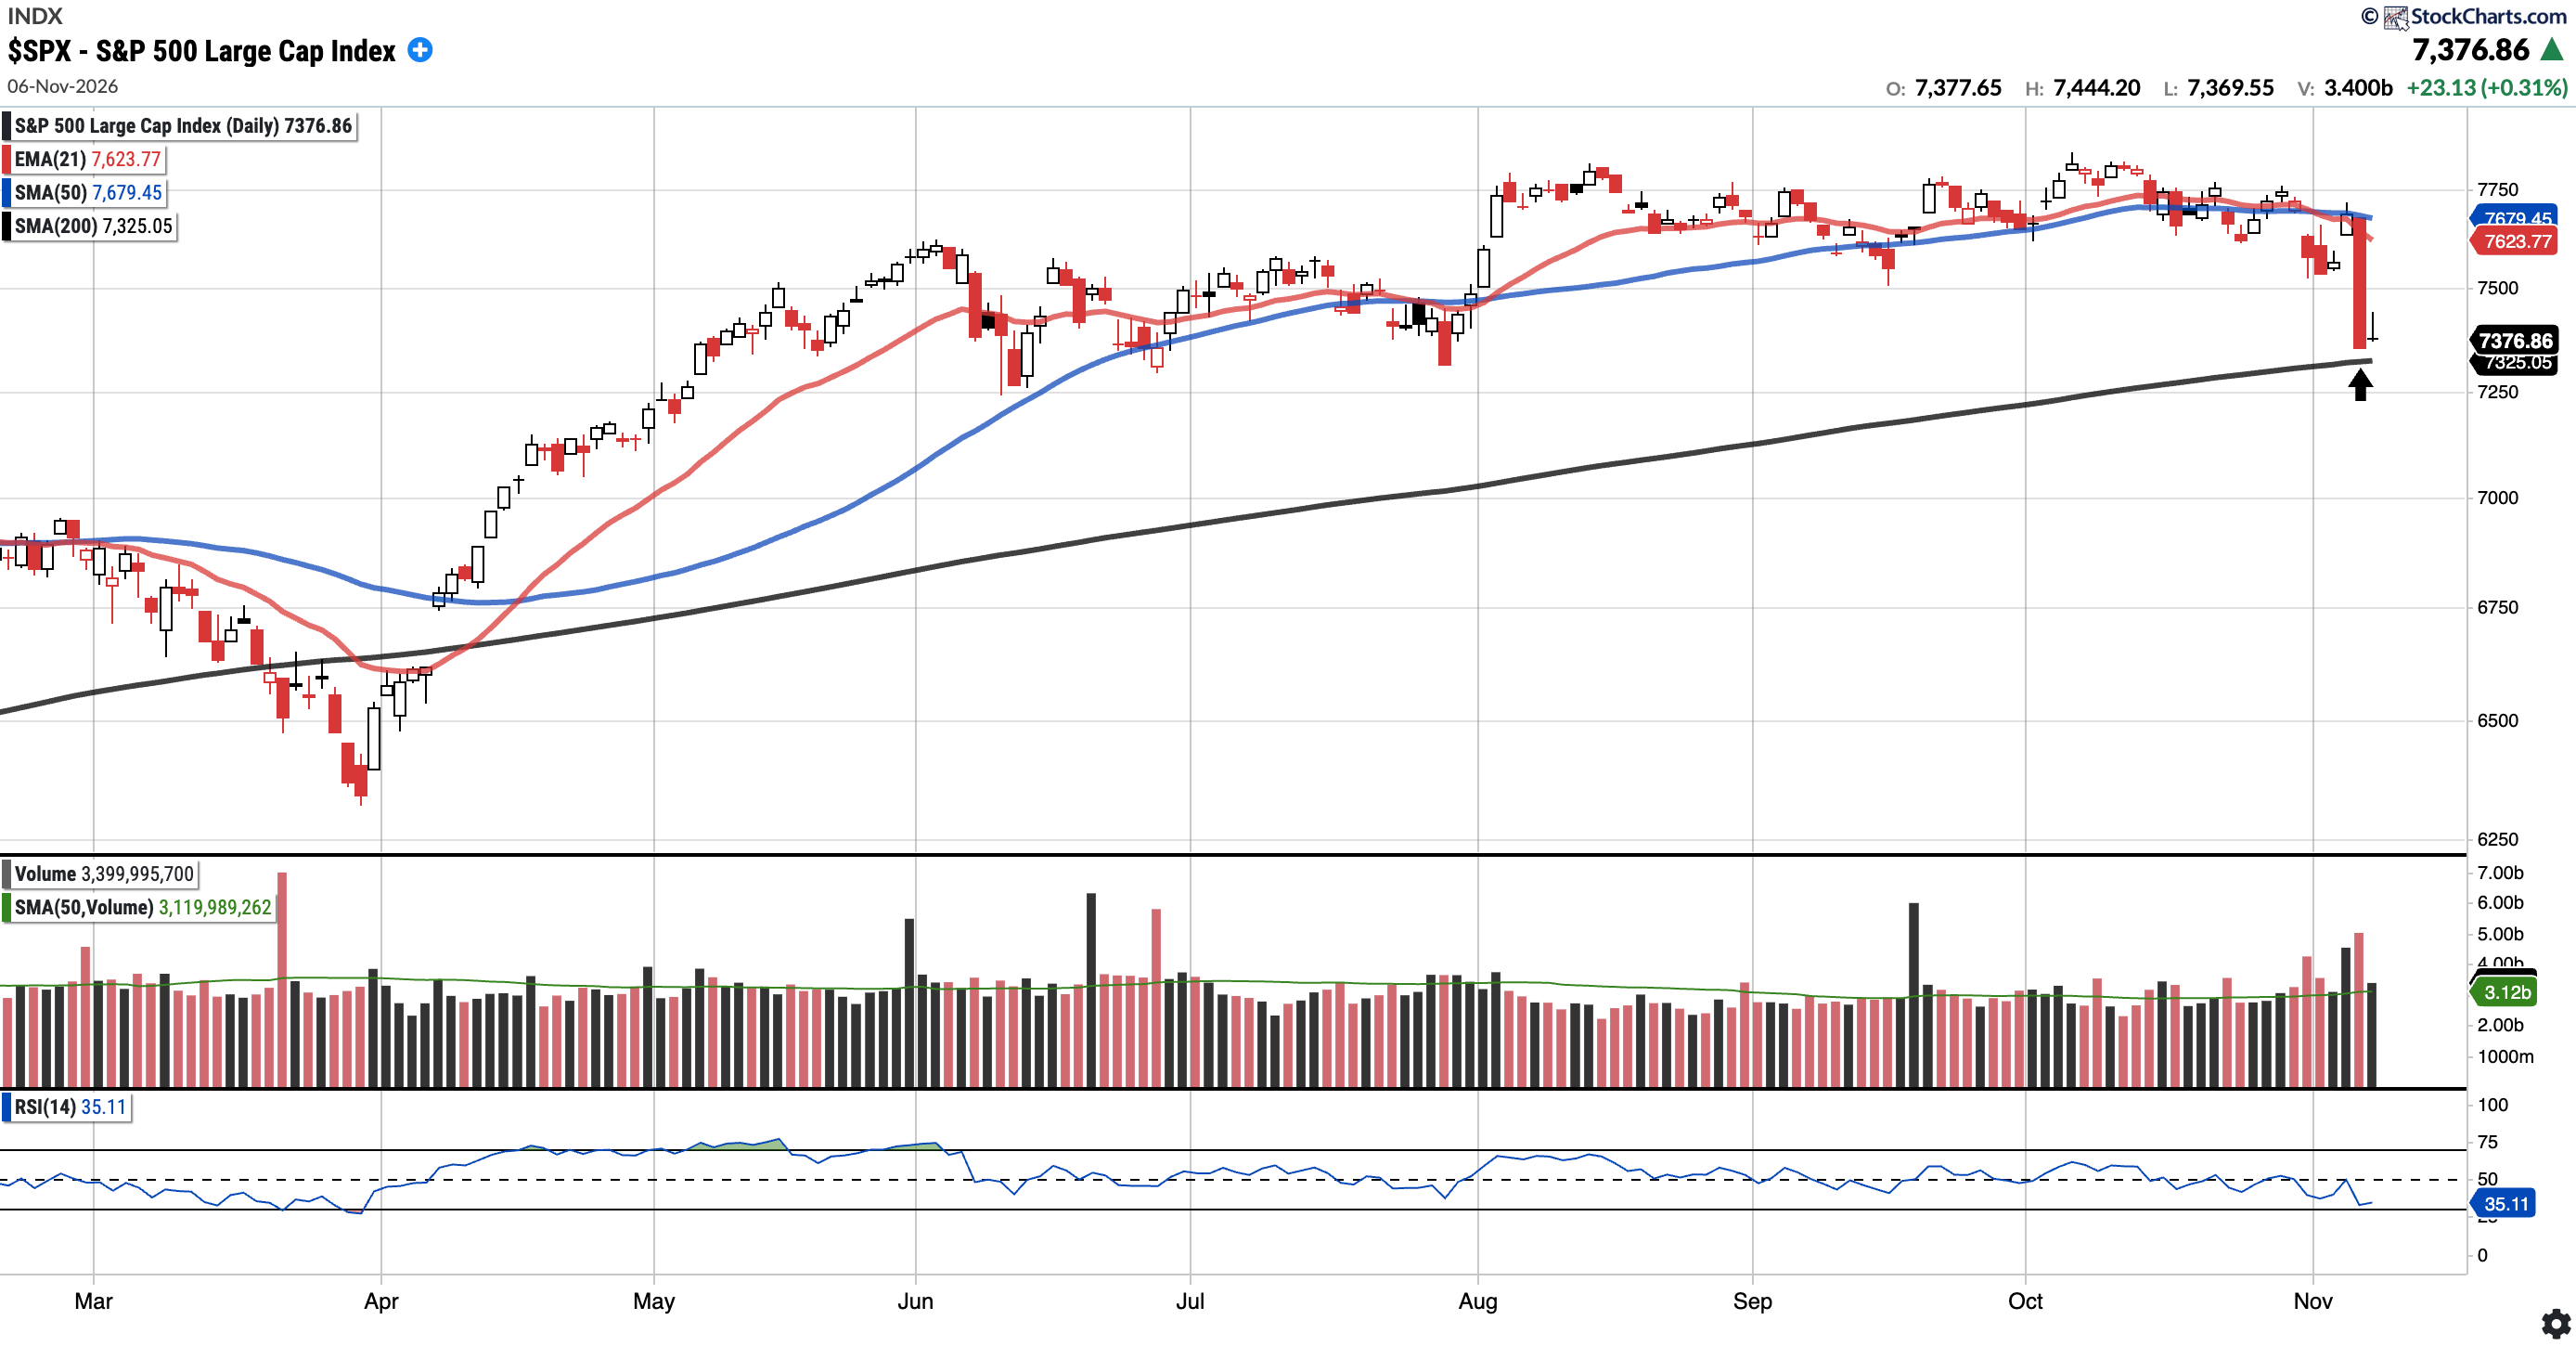
Currently trades at $7,376.86, 3.94% below the 50SMA and 0.71% above the 200SMA.
RSI 35.11
7.56% YTD
Distribution days in the last week: 1
The S&P 500 rallied back into the 21-day EMA and 50-day SMA on Wednesday but failed to hold those levels. Thursday’s drop wason volume well above its 50-day average, took price down towards the 200-day SMA (see arrow). Friday held above the 200-day, which is now the key level to hold. The 21EMA and 50SMA are overhead, and bulls will want to see those reclaimed. A breakdown below the 200SMA could signal continued selling pressure.
COMPQ
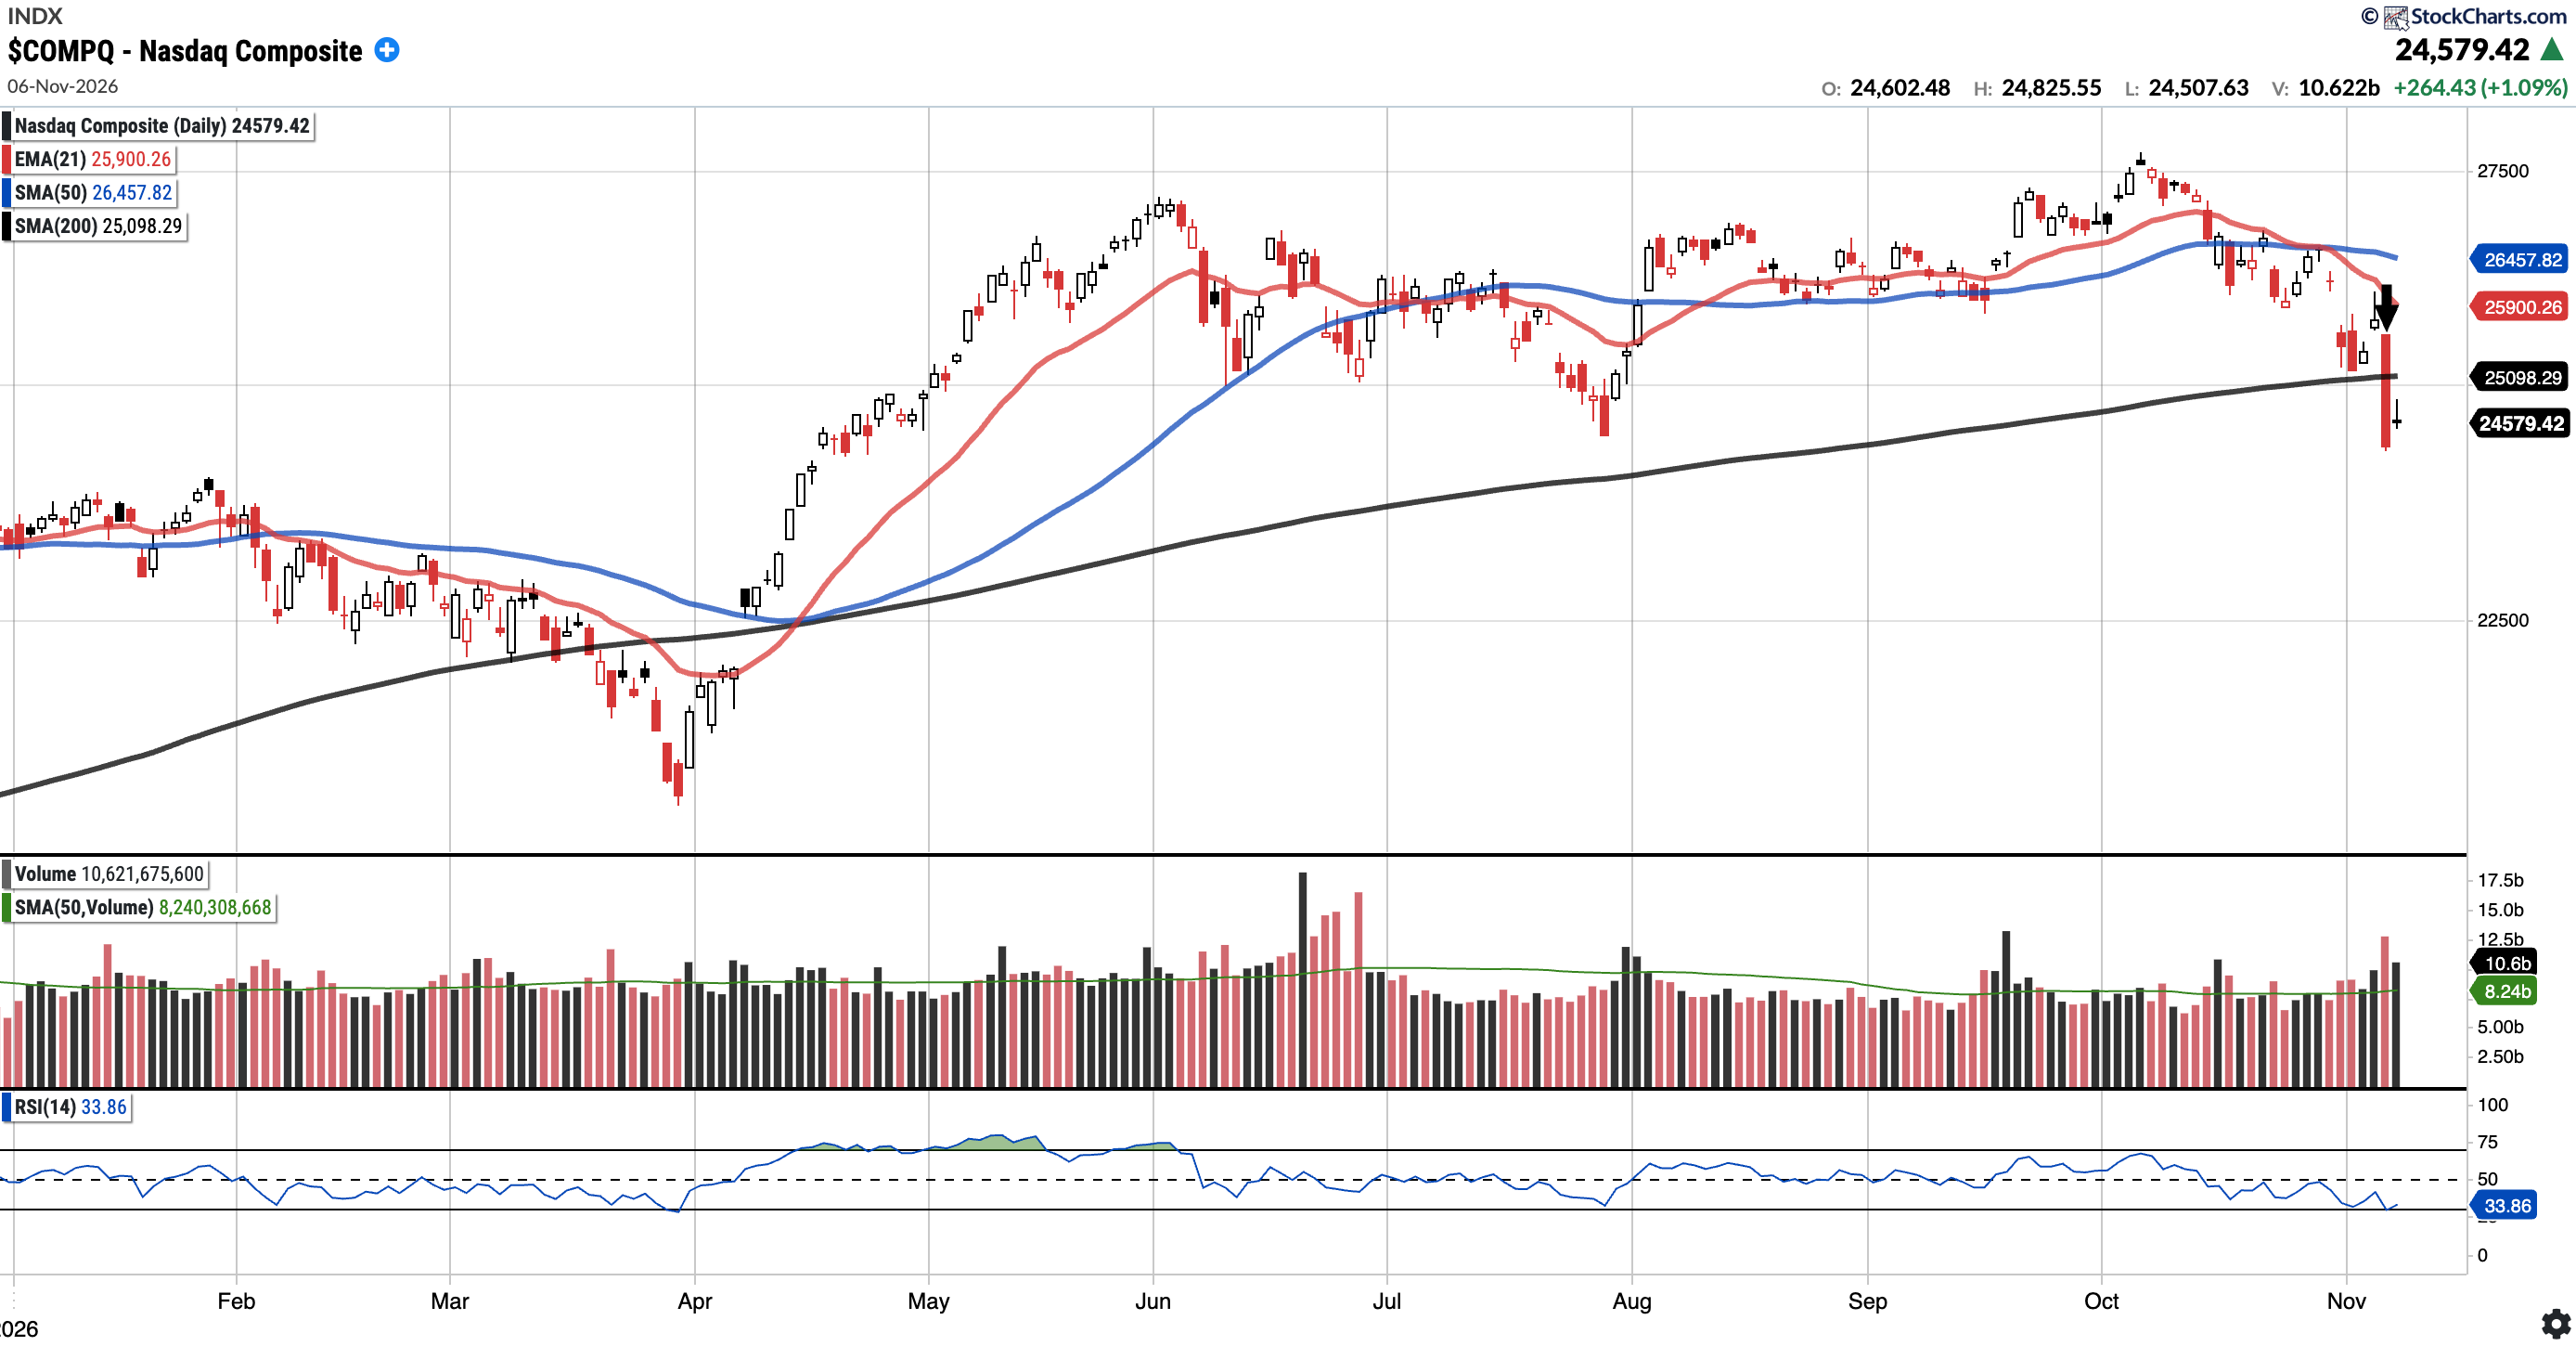
Currently trades at $24,579.42, 7.10% below the 50SMA and 2.07% below the 200SMA.
RSI 33.86
5.78% YTD
Distribution days in the last week: 2
Last week we flagged the 200-day moving average as an important level to hold. Thursday’s 5.52% drop on above-average volume took the Nasdaq Composite below it. Friday bounced 1.09%, but price closed the week below the 200-day ($25,098). A sharp reclaim of the 200-day is of key for bulls.
Notably, on Thursday, the QQQ recorded its highest volume for a red day since June 2022.
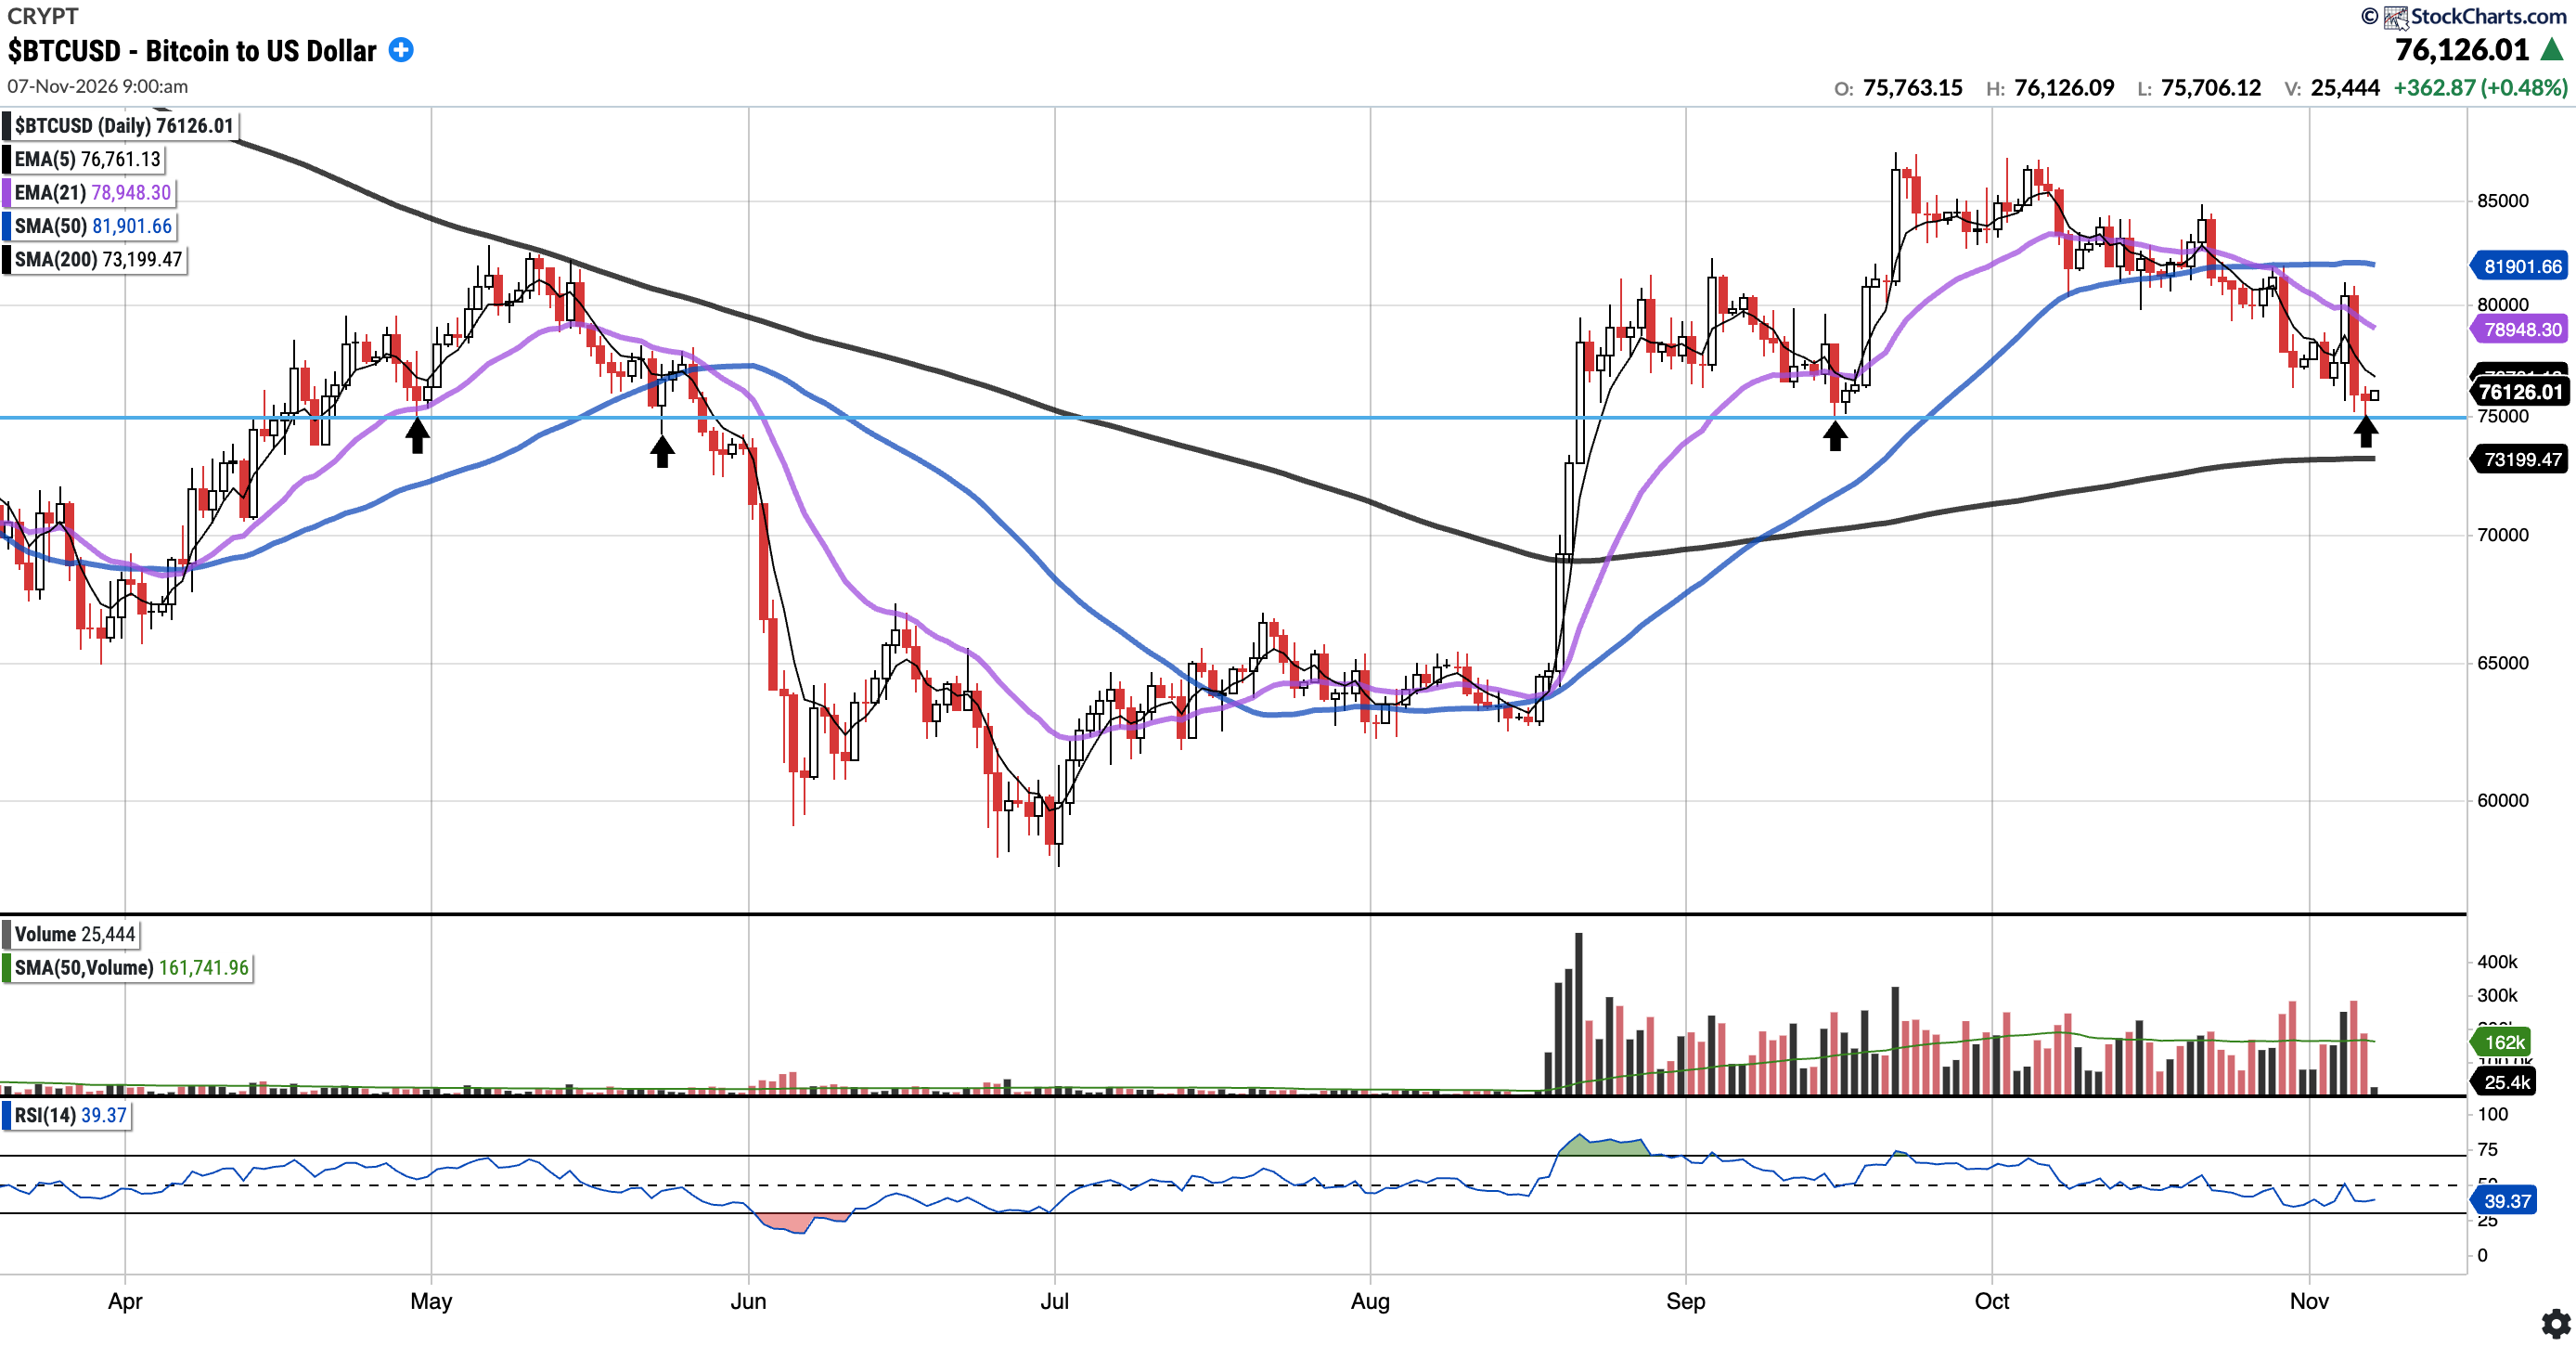
BTC (currently Long)
Currently trades at $76,126, 7.05% below the 50SMA and 4.00% above the 200SMA.
RSI 39.37
-14.21% YTD
As of Saturday November 7 at 4:00AM EST (9:00 AM UTC), BTC is trading at $76,126. On Wednesday BTC pushed back above $80K, but reversed immediately on Thursday to the $75K support flagged last week. That level has held once again, as it did on prior tests in May and September (see arrows). Bulls will want to see $80K reclaimed and held. To the downside, a loss of $75K puts the 200SMA ($73,199) as the next major support.
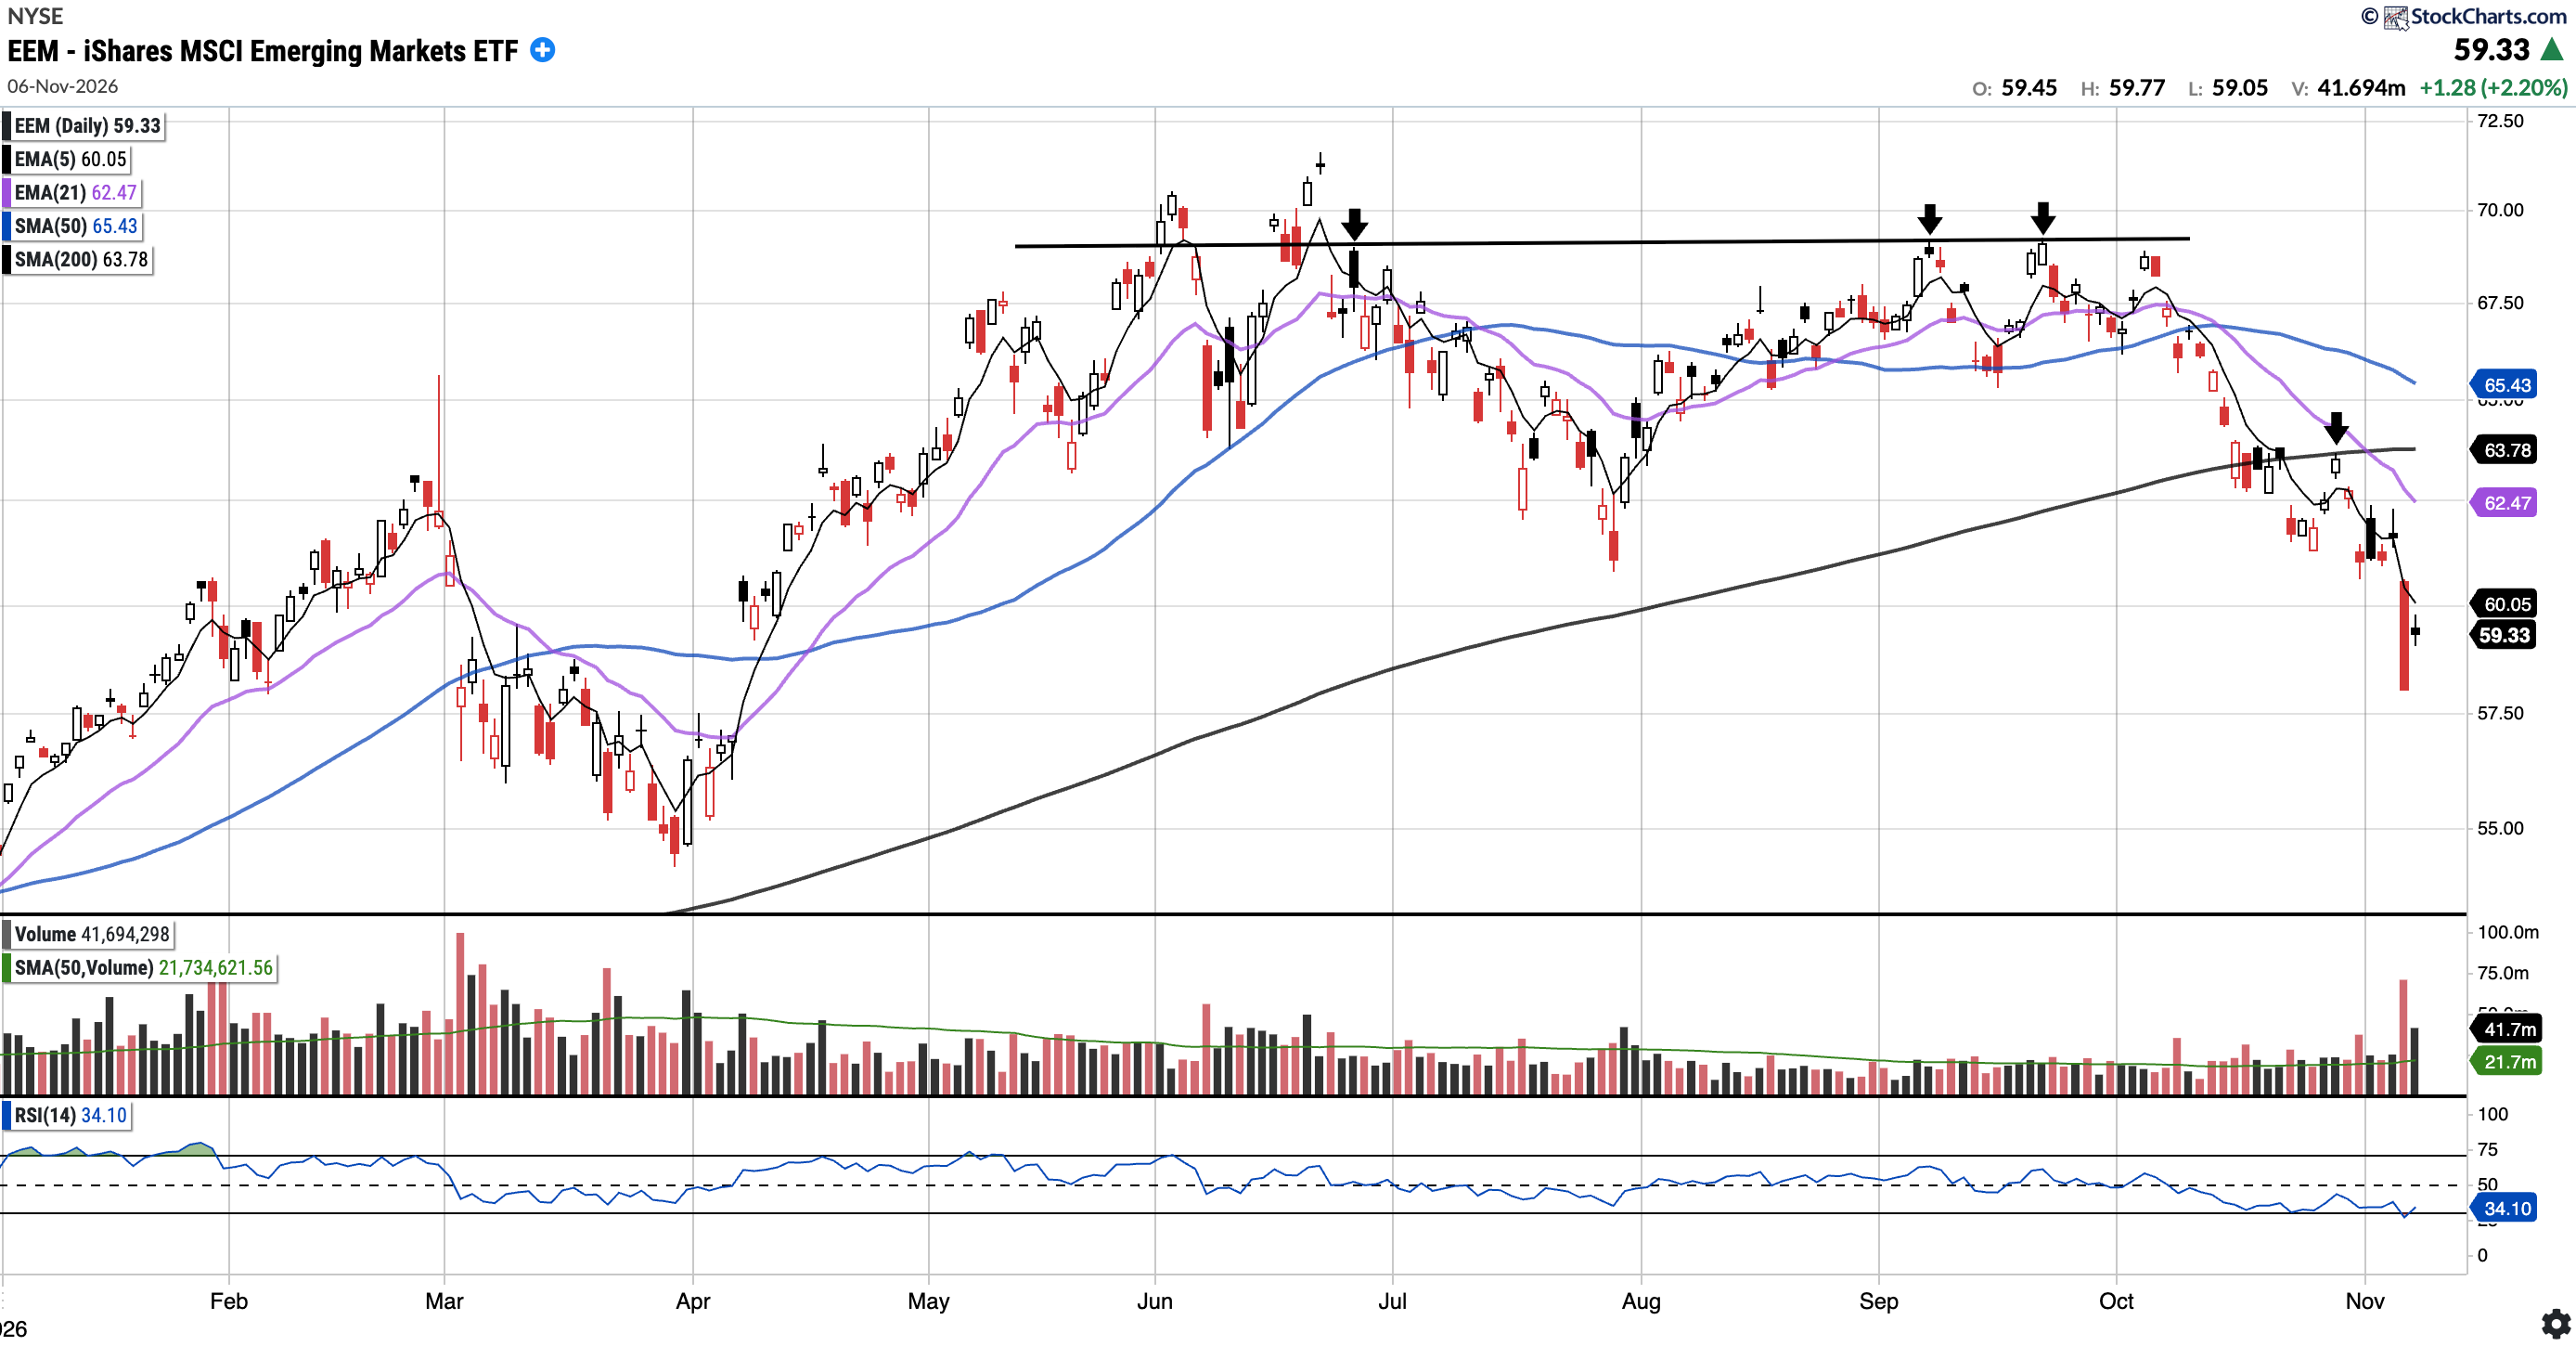
EEM
Currently trades at $59.33, 9.33% below the 50SMA and 6.97% below the 200SMA.
RSI 34.10
6.04% YTD
Last week EEM was rejected at the 200SMA. This week it dropped 5.79% on Thursday on more than three times its average volume, closing at its lowest level since April. Friday bounced 2.21%, but EEM remains below all of its key moving averages. Bulls will want to see the 21EMA ($62.47) reclaimed initially, followed by the 200-day ($63.78).
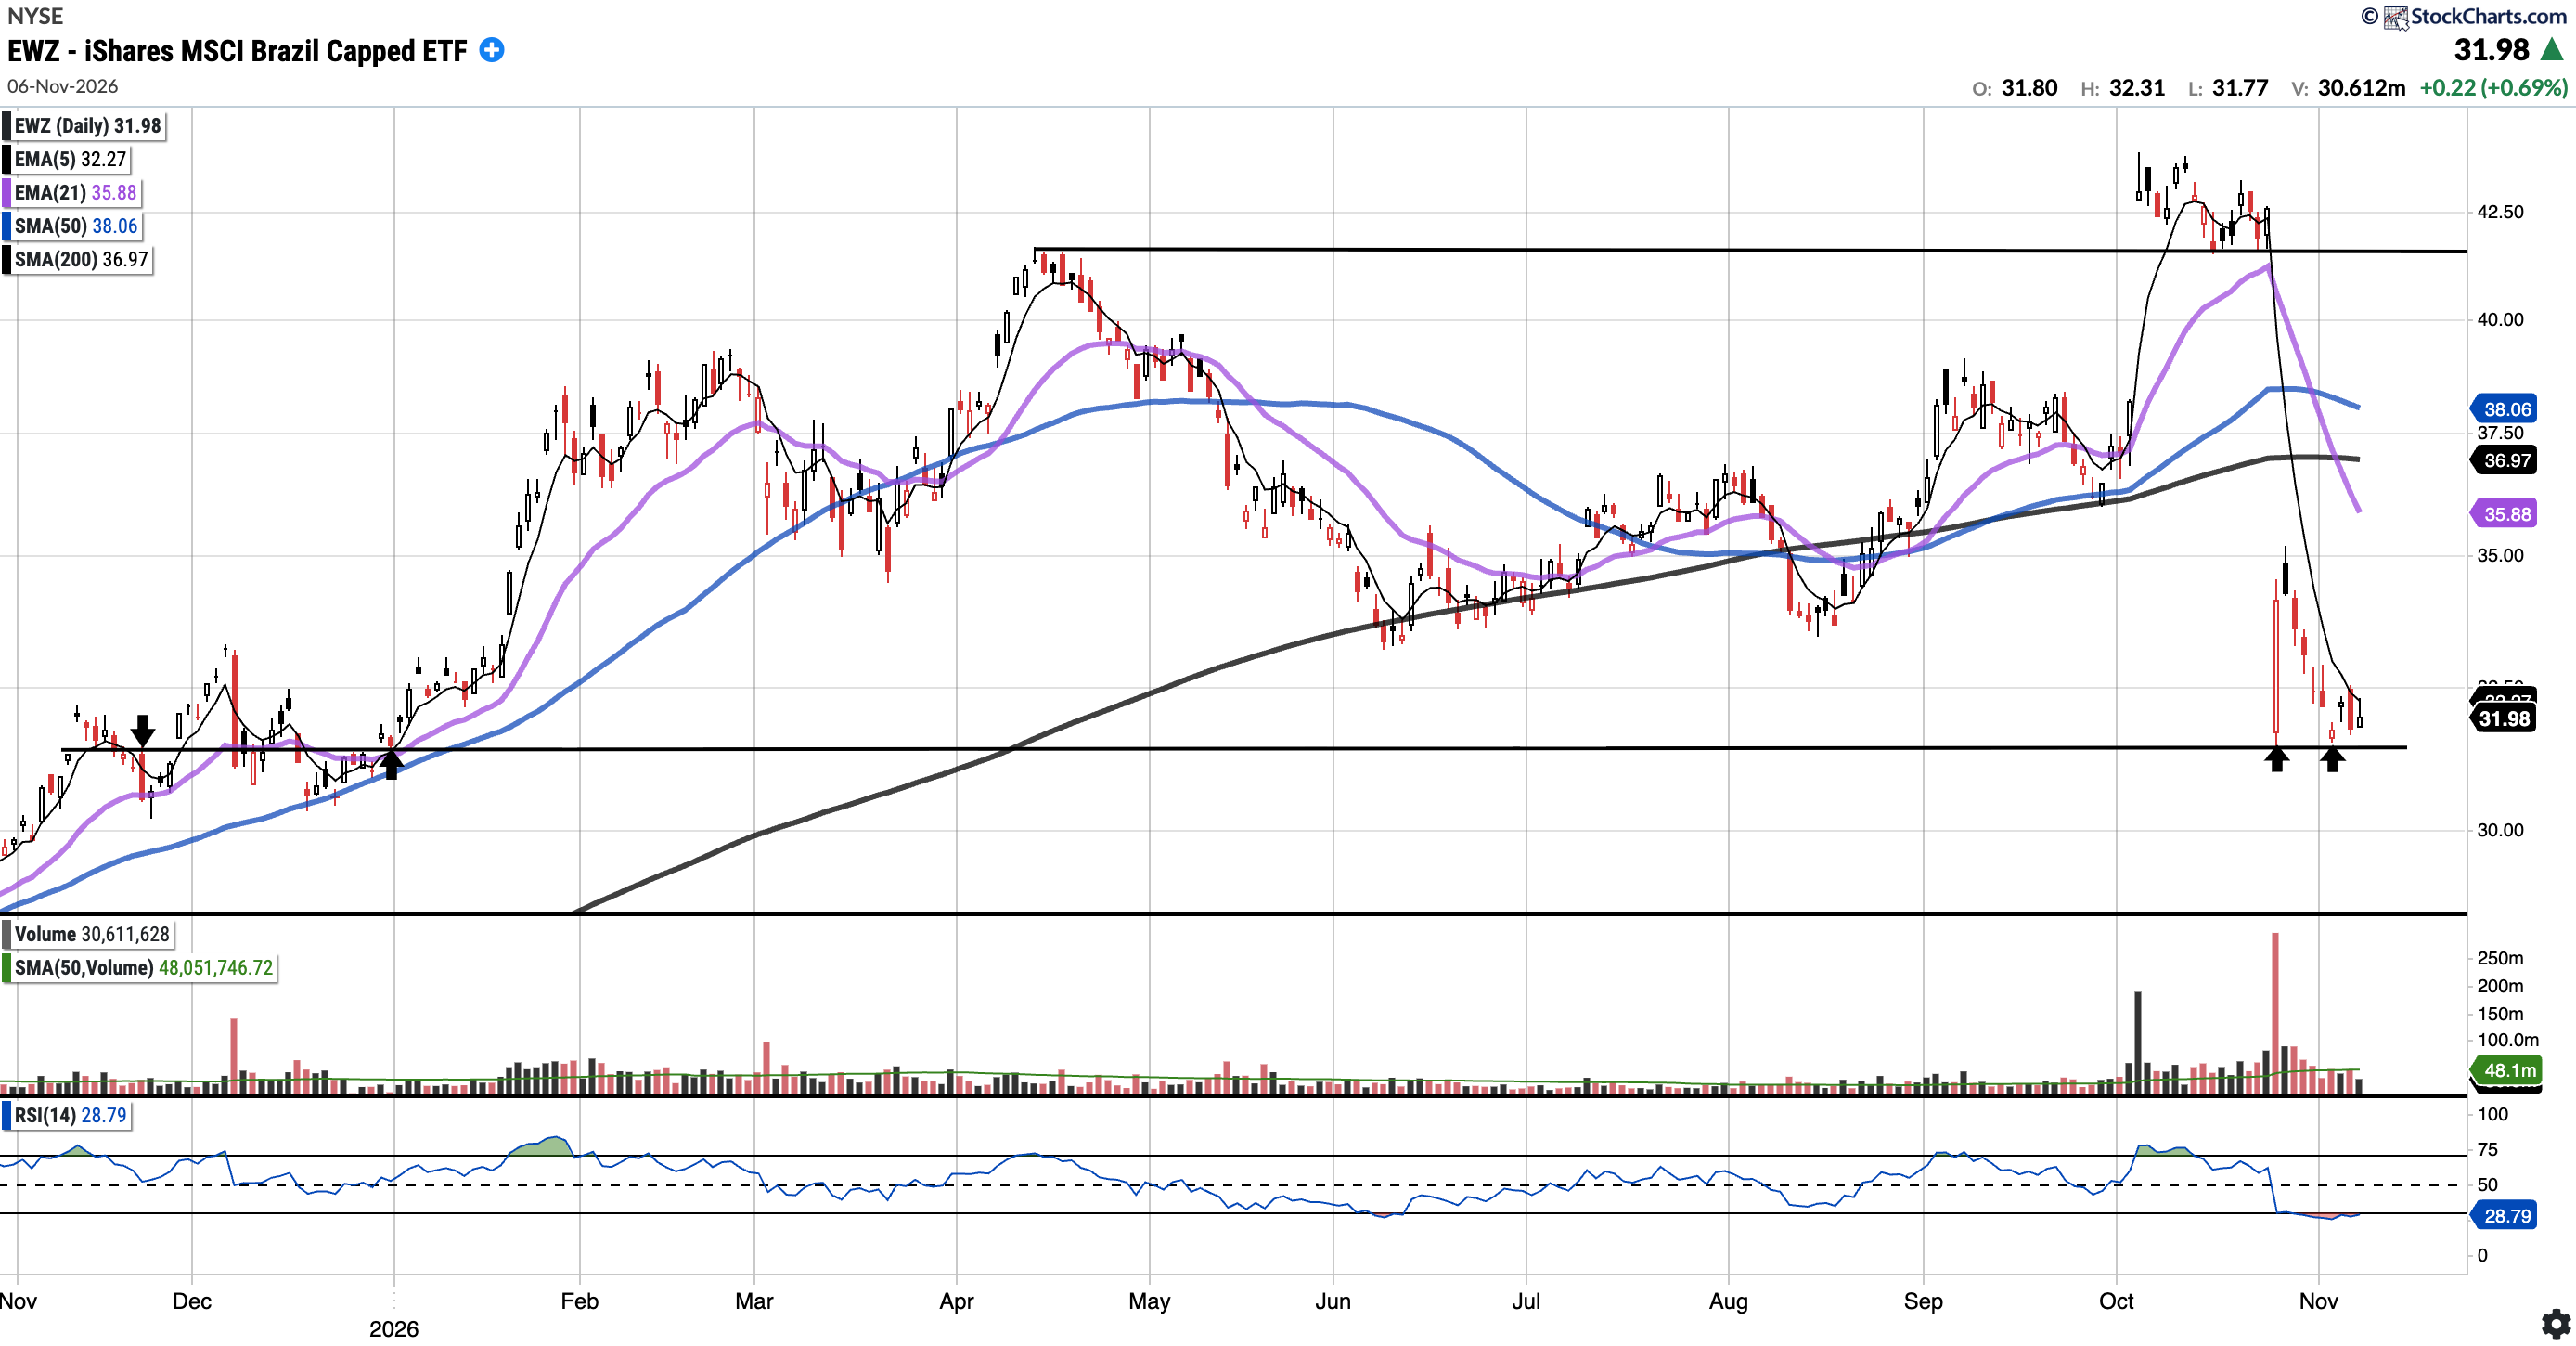
EWZ (Currently Long via IBZL)
Currently trades at $31.98, 15.97% below the 50SMA and 13.50% below the 200SMA.
RSI 28.79
0.26% YTD
Following last week’s ~20% drop after the Brazilian runoff, EWZ drifted lower this week. It is holding the ~$31.50 support level (see arrows) as volume has eases back below average. Bulls will want $31.50 to hold.
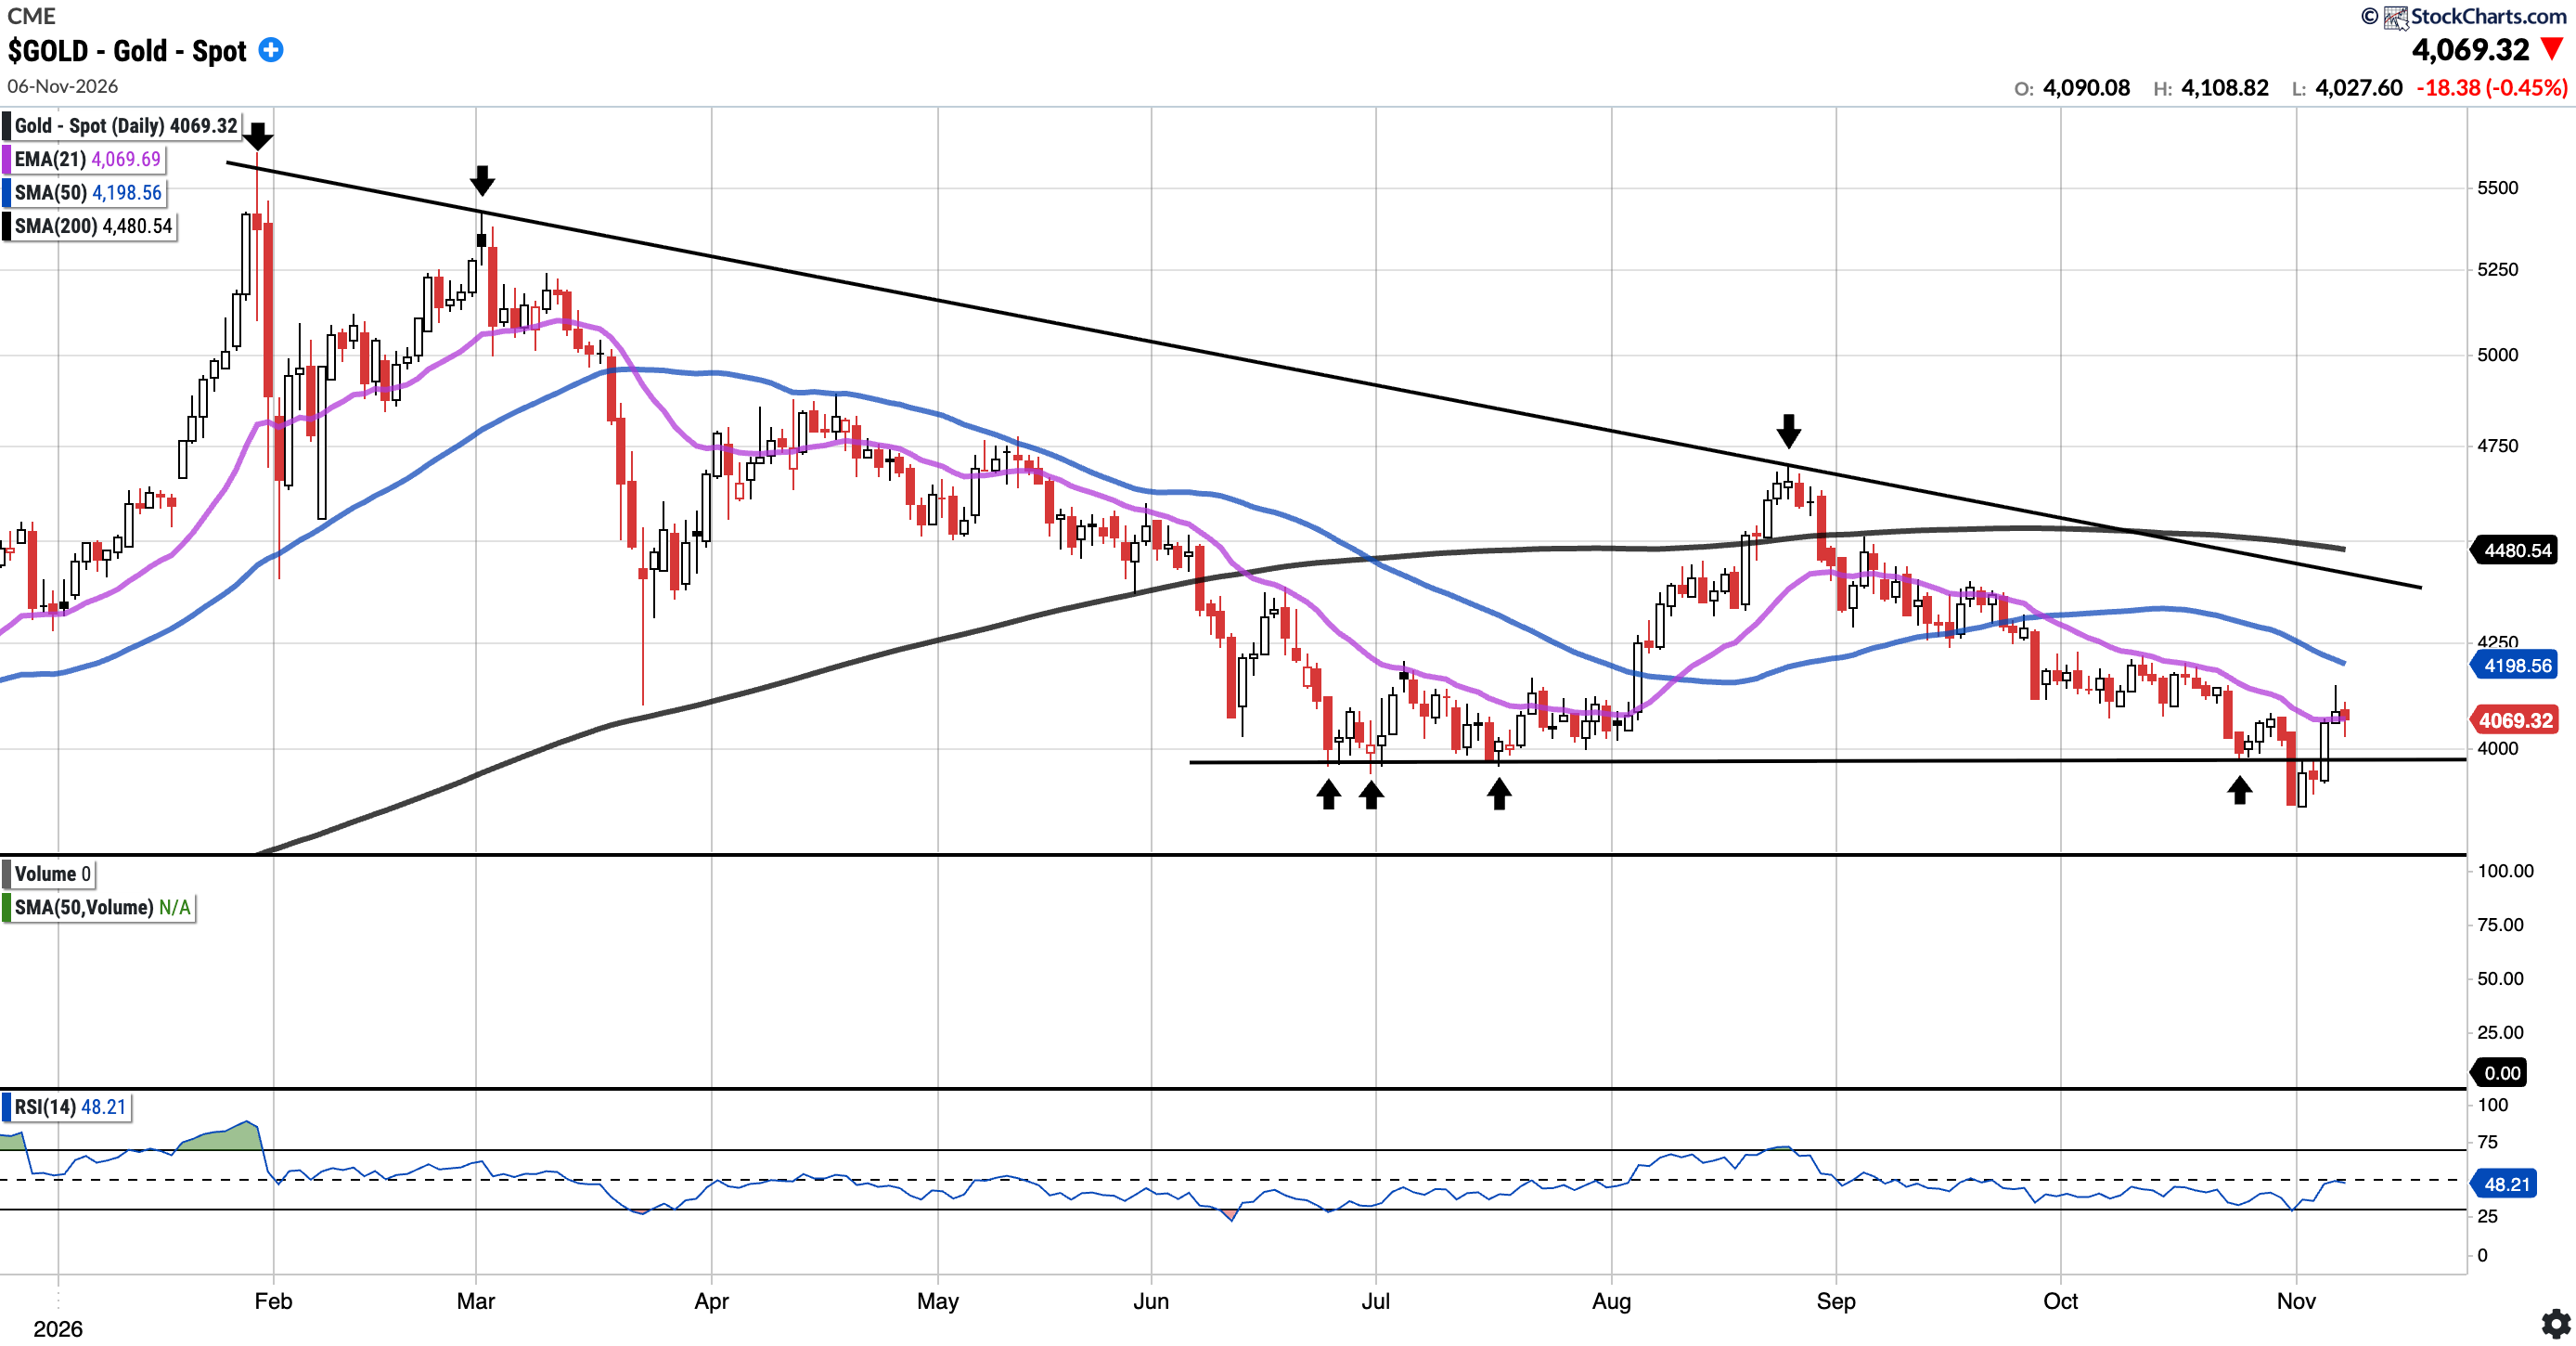
GOLD (Long Physical)
Currently trades at $4,069.32, 3.08% below the 50SMA and 9.18% below the 200SMA.
RSI 48.21
-5.87% YTD
Last week, gold broke below the $3,950–$4,000 support zone. We noted that bulls would want that zone reclaimed initially, followed by the 21-day EMA. This week gold did both:
It reclaimed the zone (see arrows) and is now sitting right at the 21-day EMA ($4,069.69), up around 5% on the week. The next overhead levels are the 50-day SMA ($4,198.56), followed by the descending trendline from the January highs, and the 200-day SMA ($4,480.54).
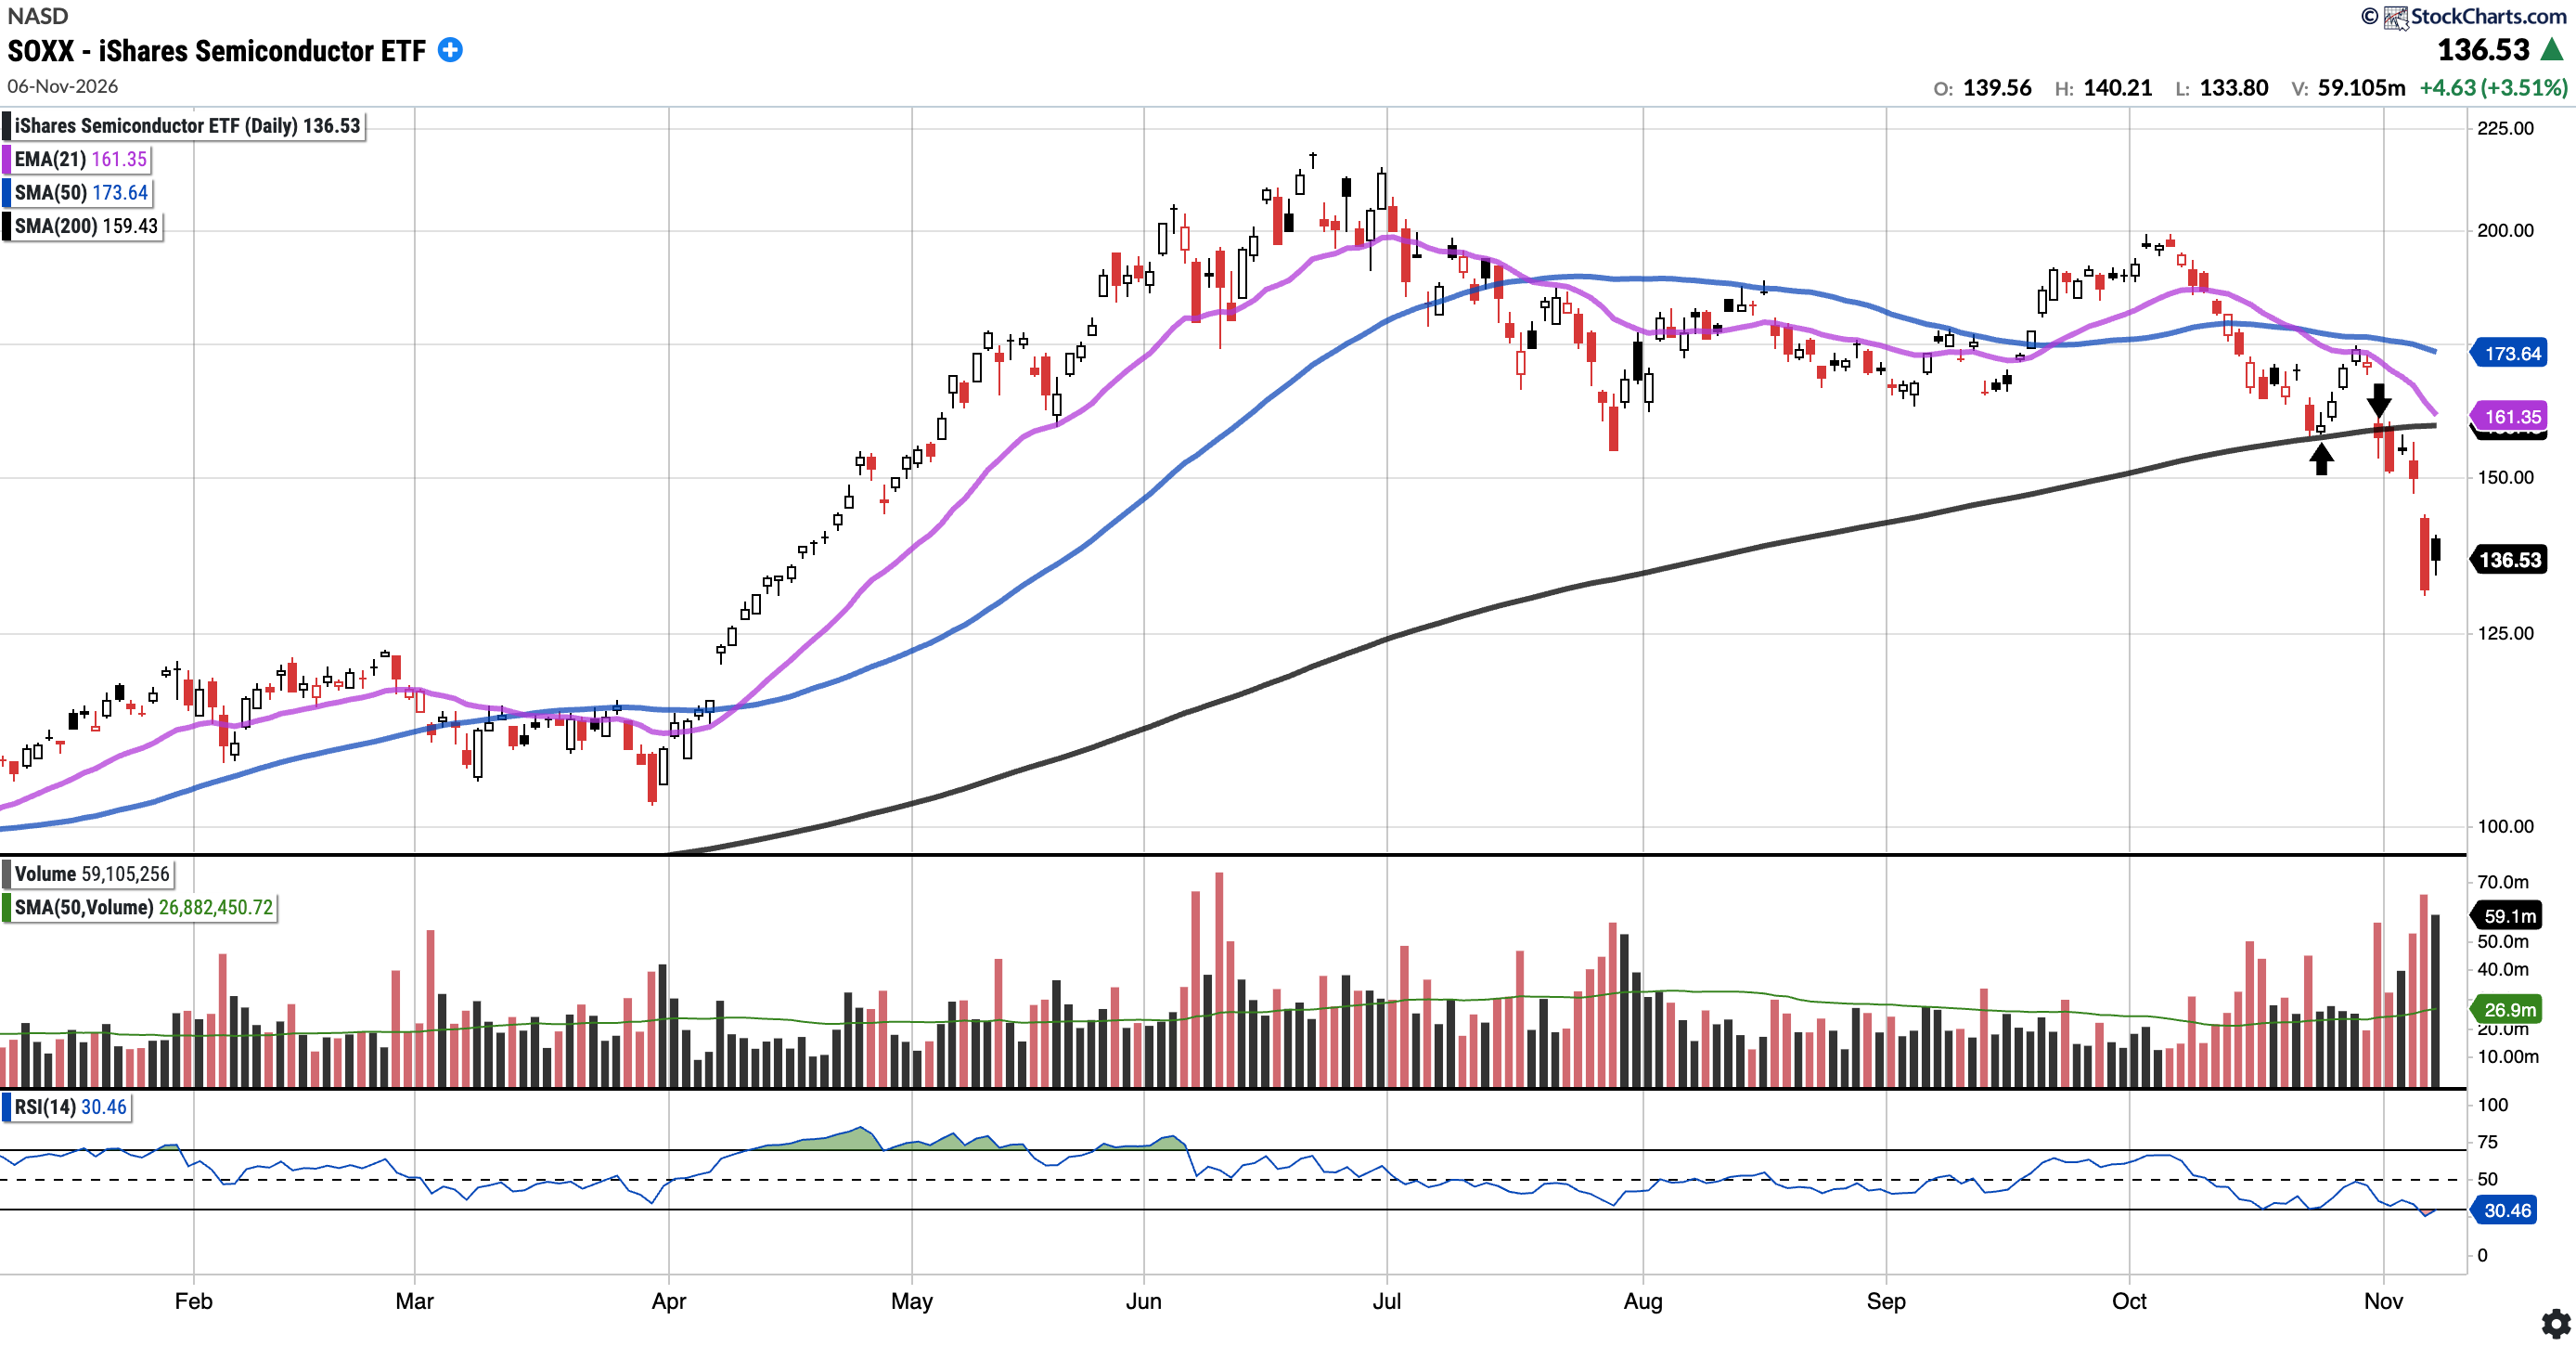
SOXX
Currently trades at $136.53, 21.37% below the 50SMA and 14.36% below the 200SMA.
RSI 30.46
30.80% YTD
Whilst last week SOXX closed right at the 200-day SMA, this week it closed down 13.13% for the week. It was rejected on a retest of the 200-day from below early in the week (see down arrow), then gapped down 12.15% on Thursday on more than double its average volume. The 21EMA and 200SMA are now both around $160 overhead.
NB: the ETF underwent a 3:1 split this week, on November 5.
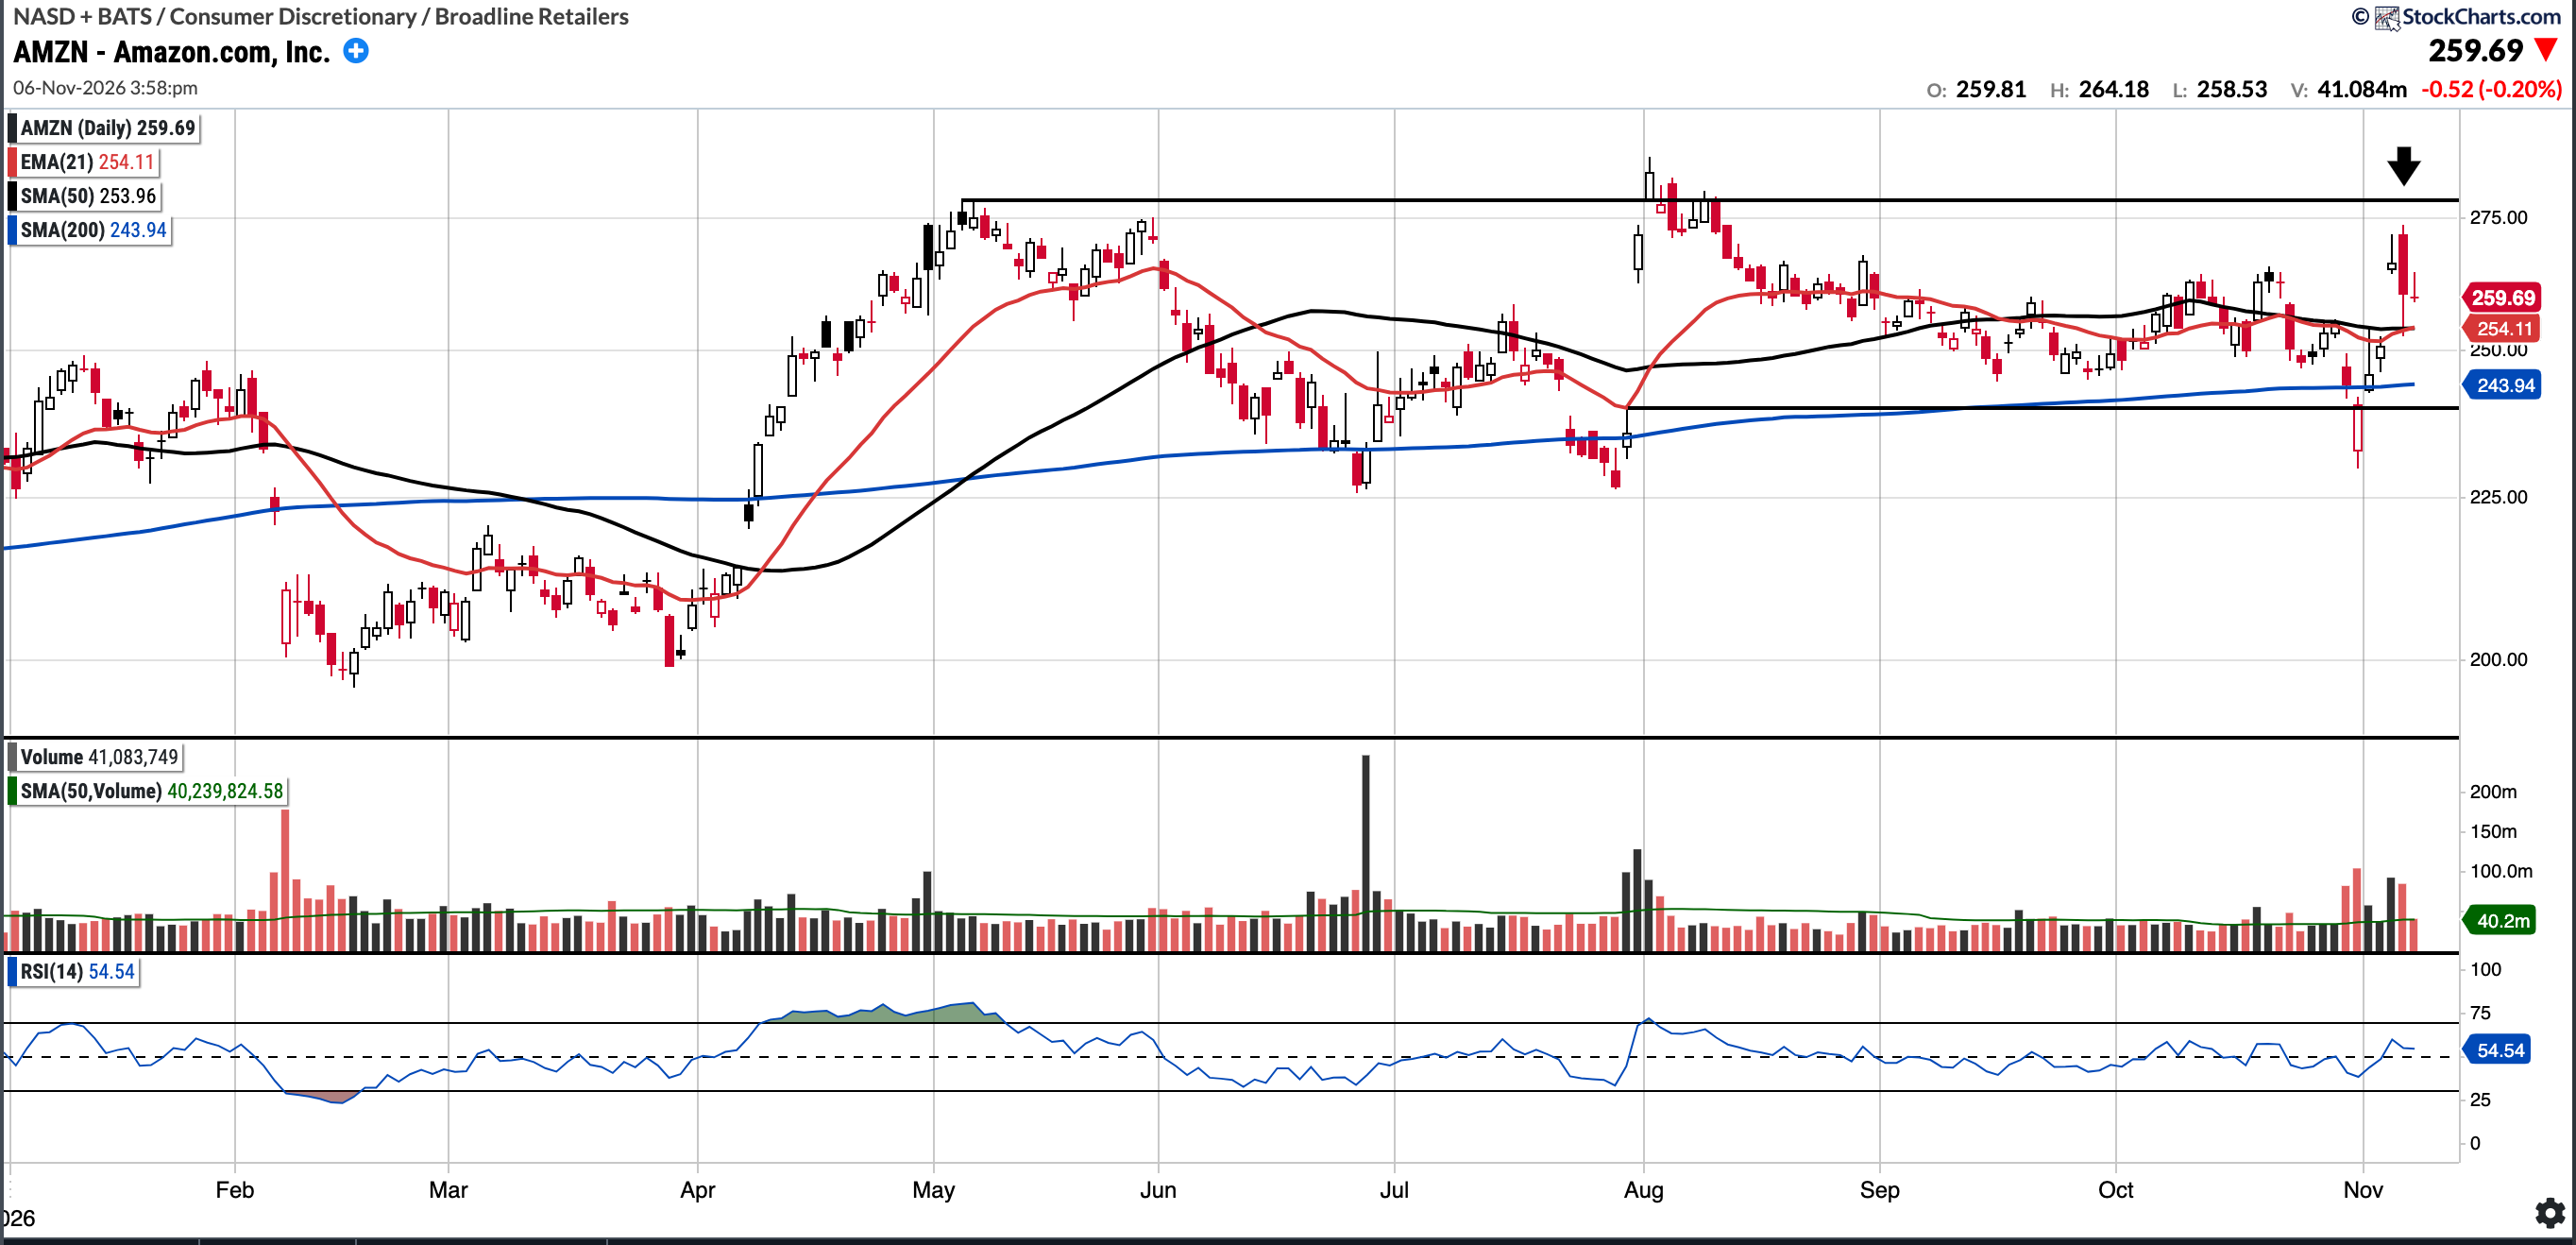
AMZN (Currently Long)
Currently trades at $259.30, 2.11% above the 50SMA and 6.30% above the 200SMA.
RSI 54.54
14.48% YTD
AMZN has reclaimed all of its key moving averages, closing the week up 7.88%. Overhead, the mid-$270s will likely serve as resistance, which coincides with the May high (see horizontal line). To the downside, bulls would want the SMA 50 to hold as firm support.
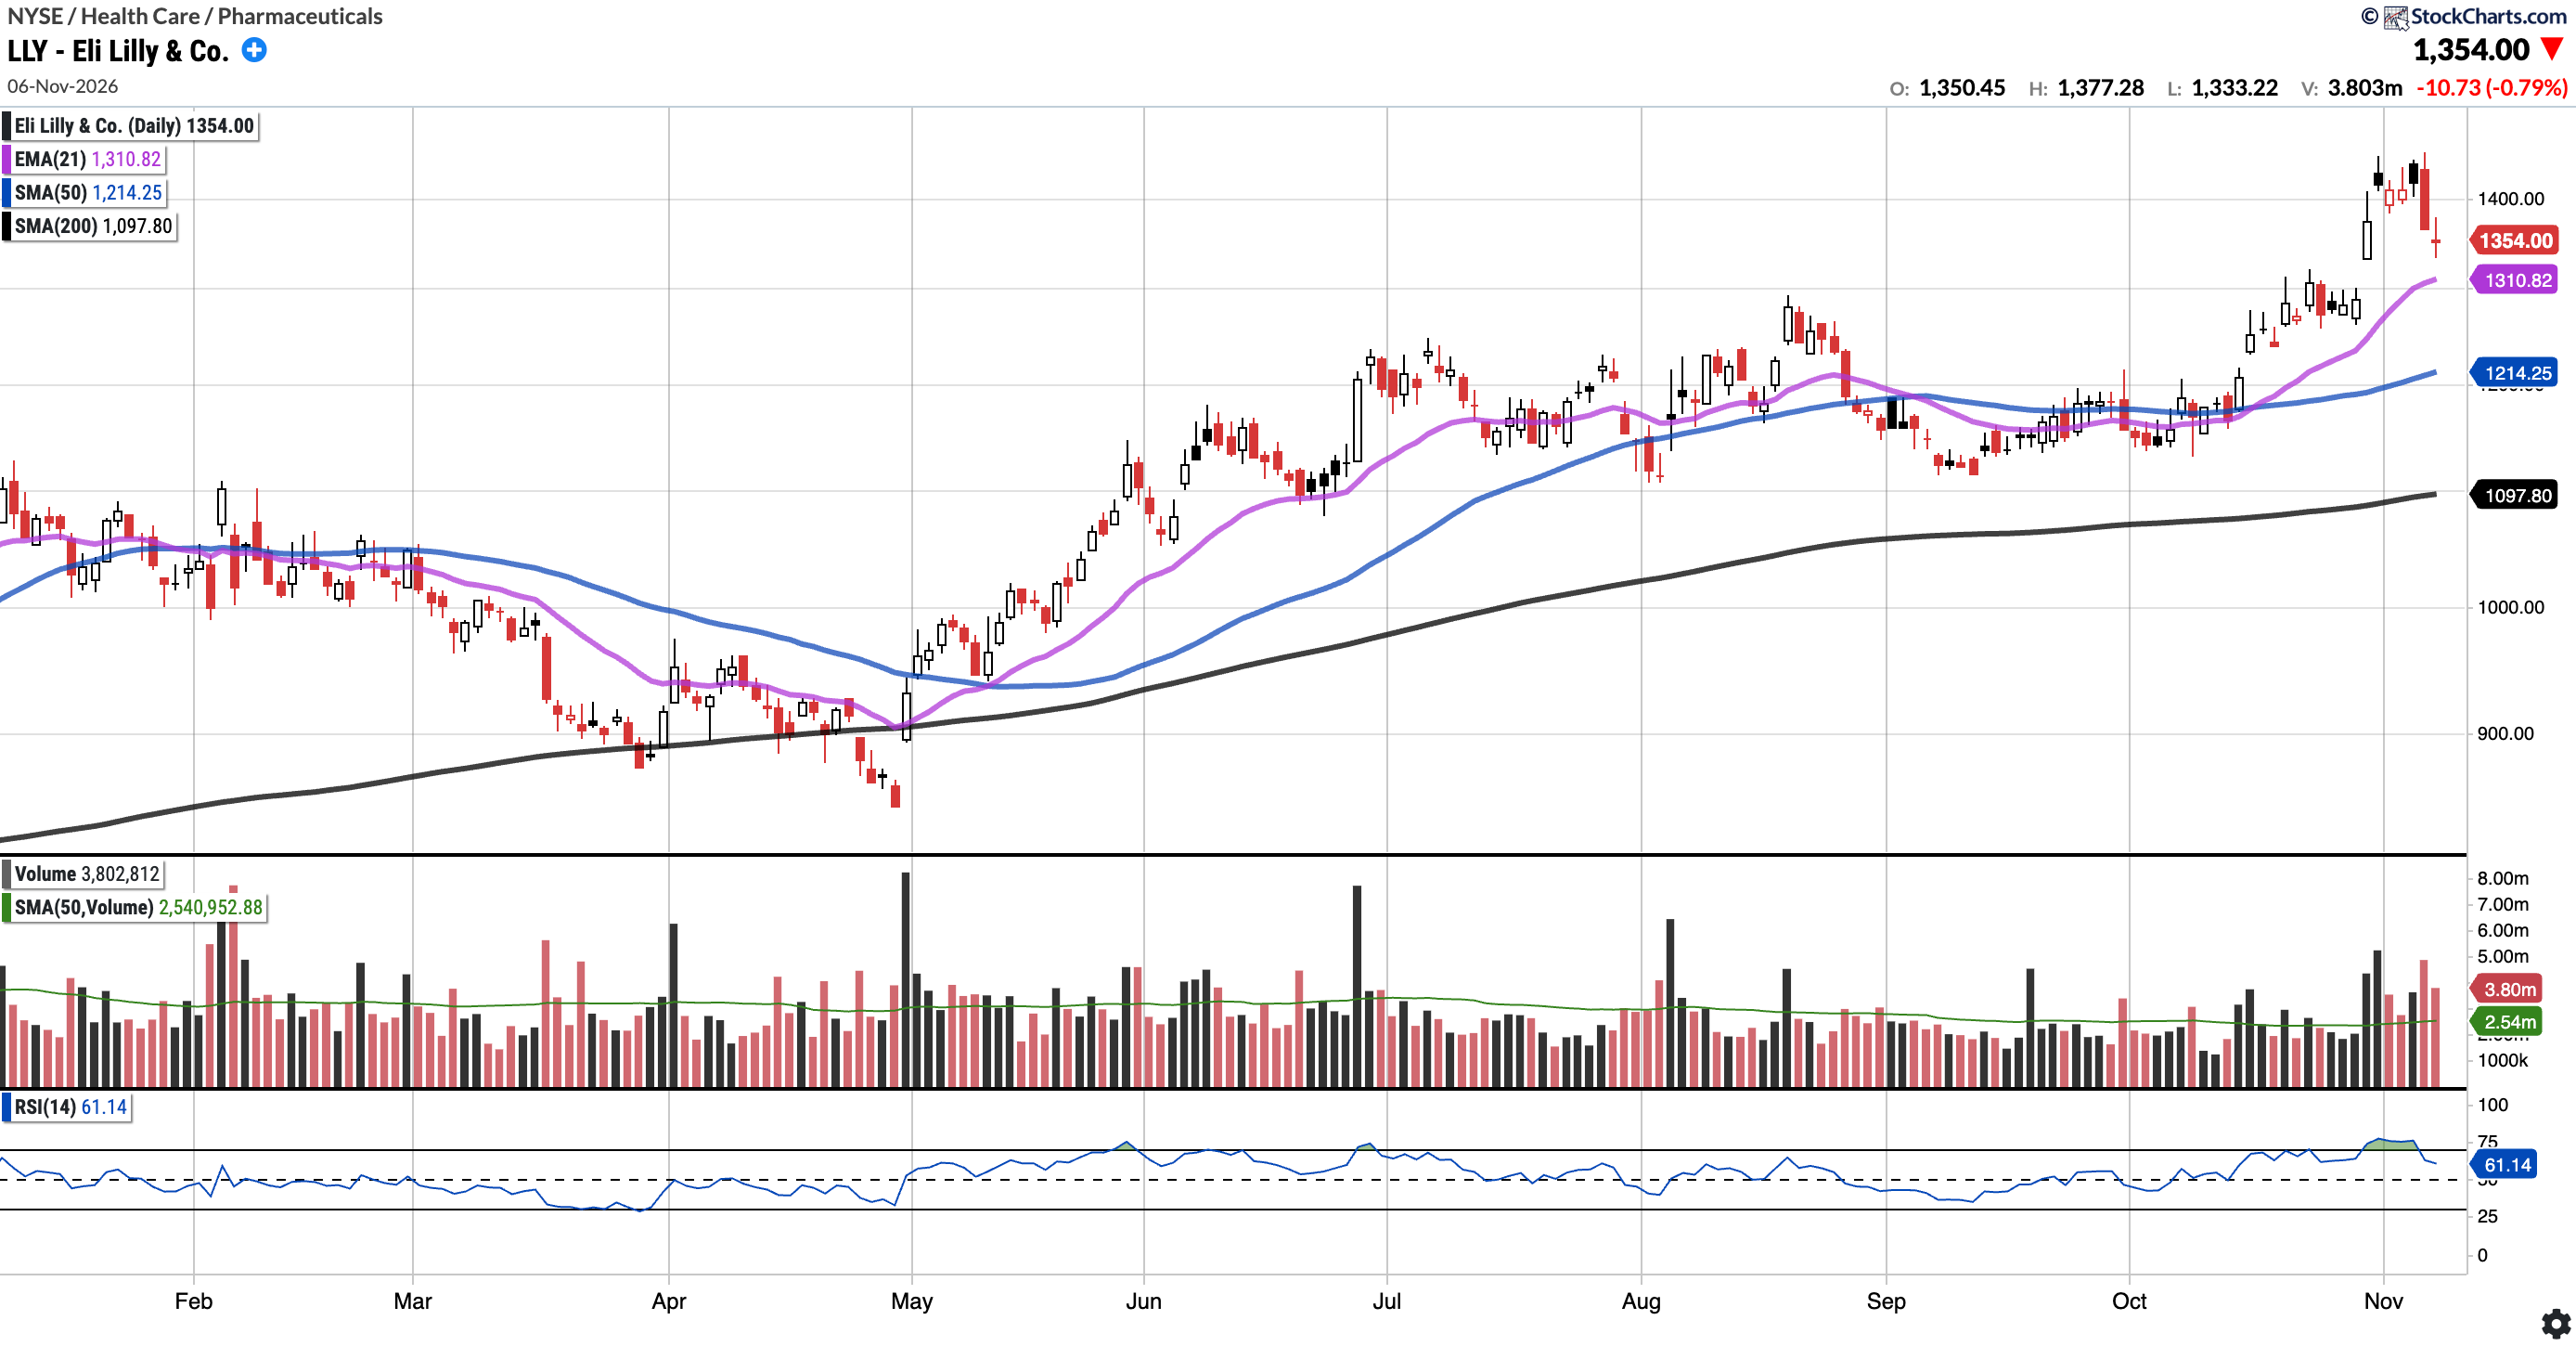
LLY (Currently Long)
Currently trades at $1,354.00, 11.51% above the 50SMA and 23.34% above the 200SMA.
RSI 61.14
25.93% YTD
LLY was slightly down on the week (-4.48%). It made a new intraday high of $1,453 on Thursday before reversing lower. The $1310 21EMA level is the next support below, which bulls will want to see price hold.
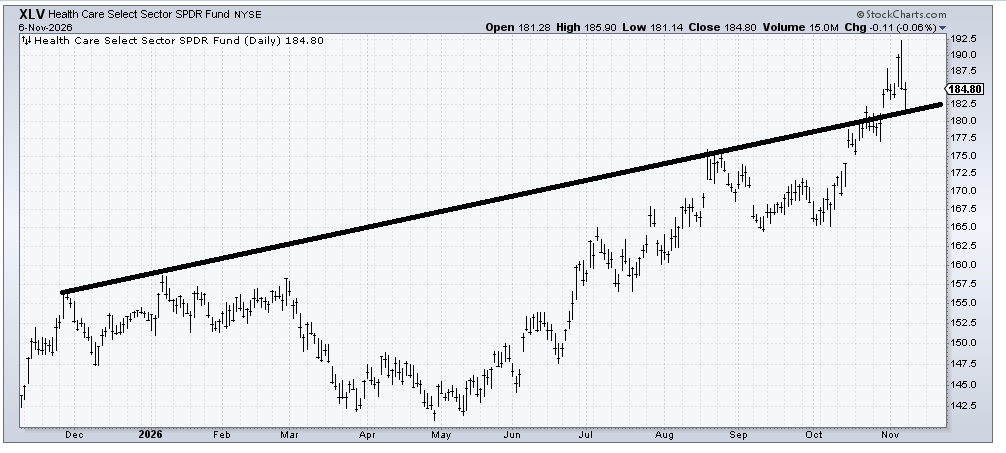
This chart by Helene Meisler also shows that XLV as a group has run a lot, with LLY being its largest holding. I am somewhat more cautious on LLY here.
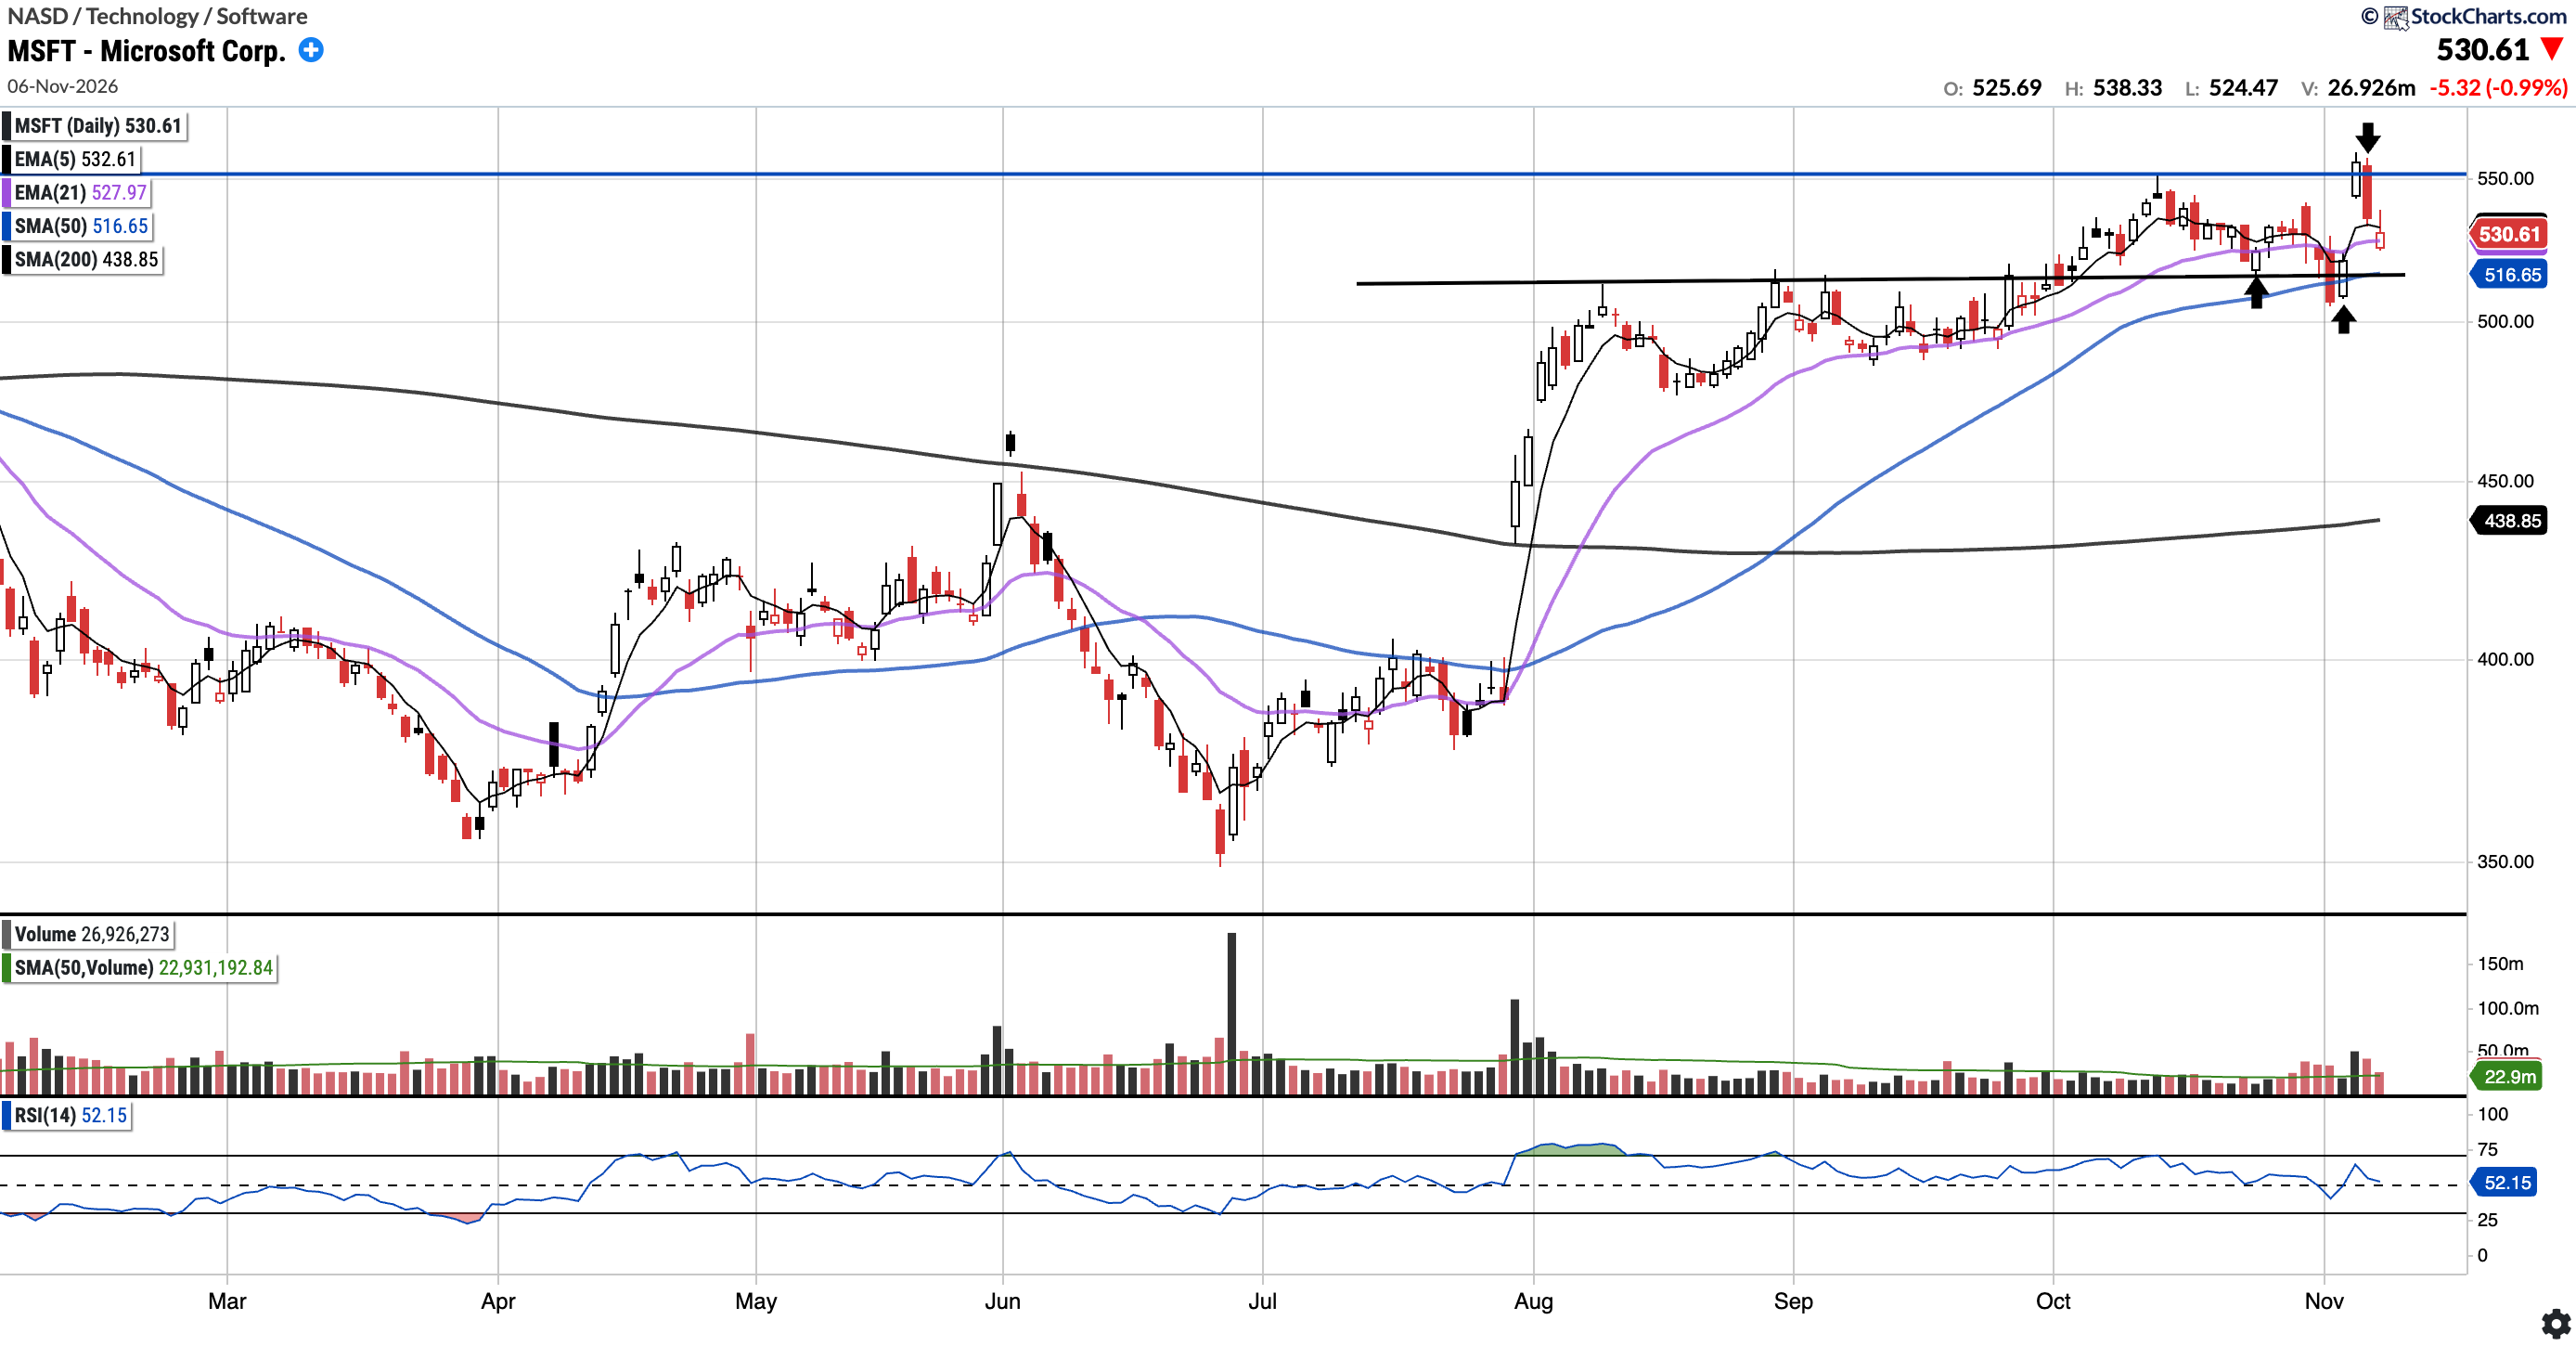
MSFT (Currently Long)
Currently trades at $530.61, 2.70% above the 50SMA and 20.91% above the 200SMA.
RSI 52.15
12.91% YTD
On Monday, MSFT fell below the $515 level and the 50-day SMA intraday before recovering (see up arrows). On Wednesday, it gapped 6.68% higher, clearing the $550 level that has rejected it roughly four times. The breakout did not hold: Thursday saw price drop back below $550 (see down arrow). Bulls will want to see $550 cleared on a closing basis, with $515 and the 50-day SMA acting as support below
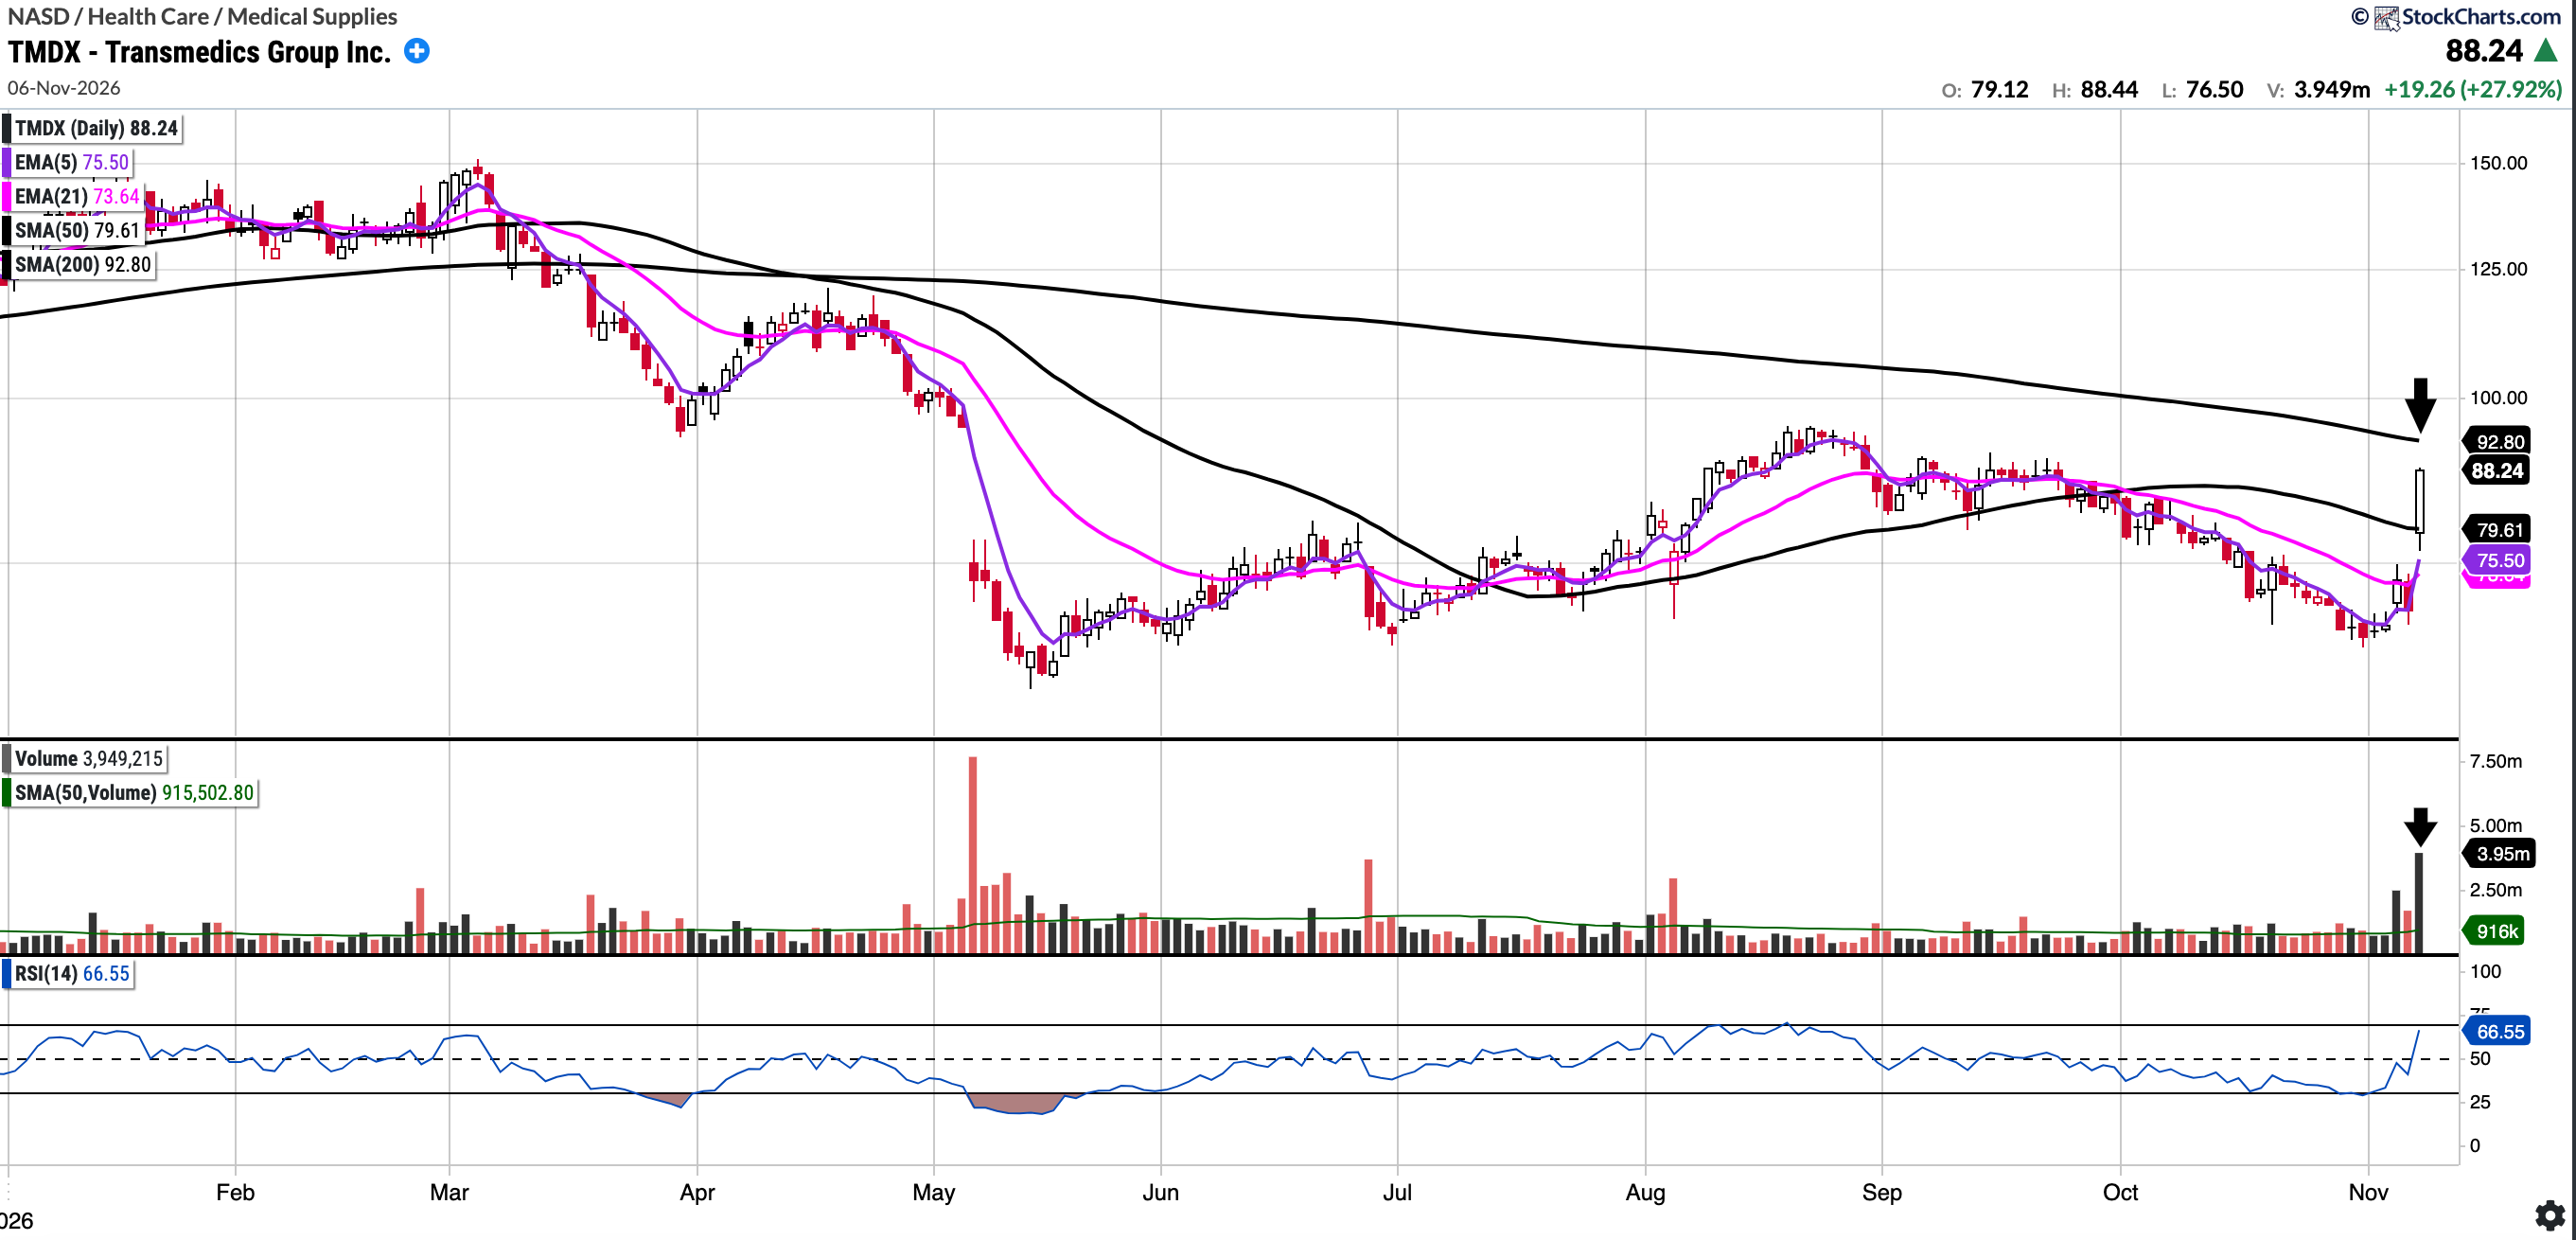
TMDX (Currently Long)
Currently trades at $88.24, 10.83% above the 50SMA and 4.91% below the 200SMA.
RSI 66.55
-28.08% YTD
TMDX shares were up 28% on Friday, on 4x above-average volume (see arrow). We also had a 5/21 cross to the upside which is constructive.
Overhead is the SMA 200 ($92.80), which coincides with a gap fill from May. Bulls would want those levels reclaimed and flipped to support.
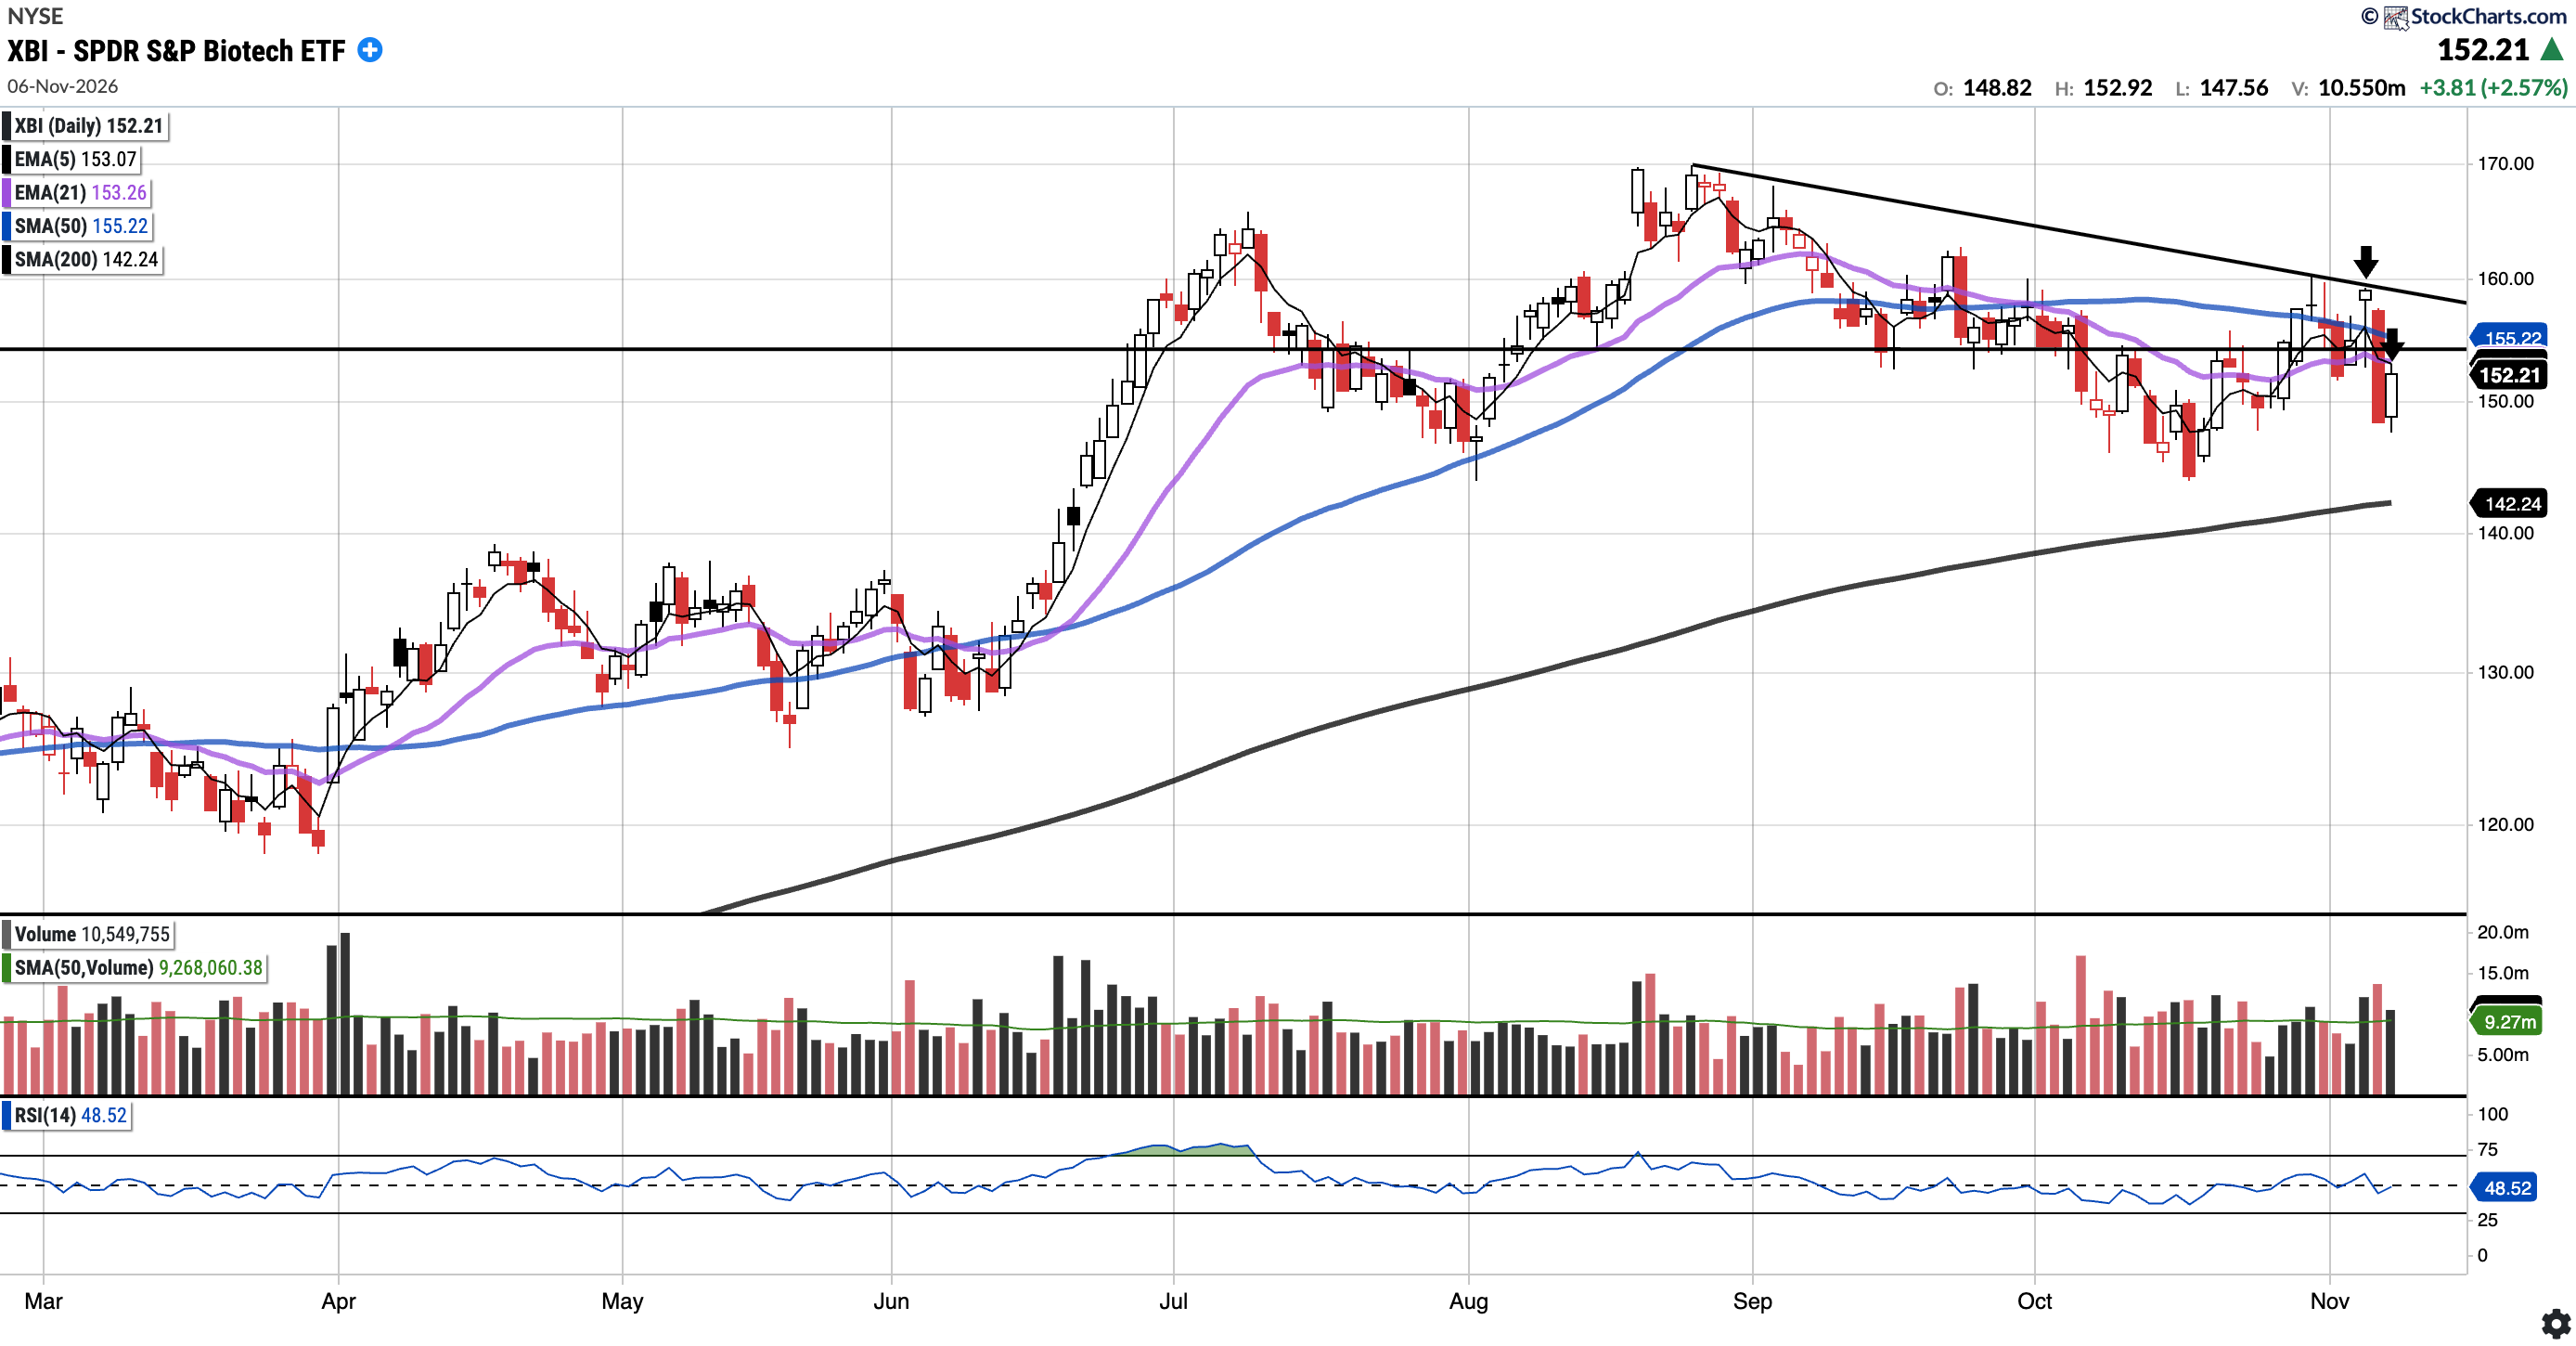
XBI
Currently trades at $152.21, 1.94% below the 50SMA and 7.01% above the 200SMA.
RSI 48.52
25.38% YTD
XBI dropped 6.73% on above-average volume on Thursday, breaking below the $154 level flagged last week and losing the 21EMA and 50SMA (see second down arrow). Friday bounced 2.57%, but closed below all key MAs. Bulls will still want $154 reclaimed; otherwise, a retest of the low $140s, where the 200SMA sits ($142.24), is not out of the question.
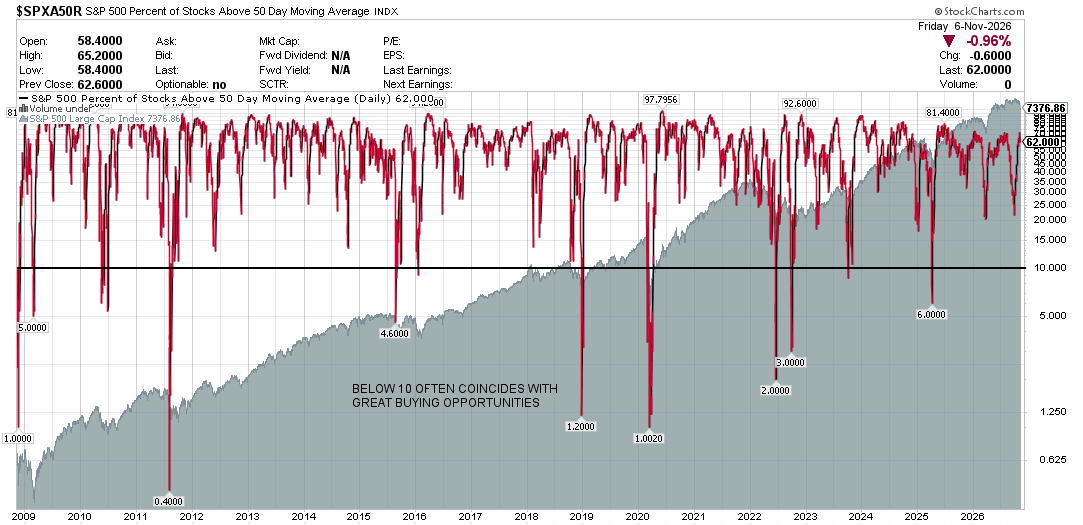
S&P 500 Percentage of Stocks Above the 50 Day Moving Average: Currently 62.00%
Breadth more or less remained the same this week, with the percentage of stocks above the 50-day moving average now at 62.00% compared to 61.60% last week.
Notable portfolio changes in previous week (all updated live in subscriber channels):